Introduction
Tuberculosis (TB) is an infectious disease caused by
the bacillus Mycobacterium tuberculosis (M. tb), one
of the most successful bacteria that infects humans (1). TB has existed for millennia and
remains a major global health problem (2). In recent years, the emergence and
spread of (multi)drug-resistant M. tb along with the limited
protection afforded by the current BCG vaccine in a number of
populations has made it difficult to effectively control the TB
epidemic. TB is one of the top 10 causes of mortality and the
leading cause of mortality from a single infectious agent, more
than HIV/AIDS, and millions of individuals continue to become
infected each year (3). The
clinical infection of TB is complicated. The aim of the present
study was to reveal the general host response mechanism to TB
infection and examine its potential immune mechanism effects
through the analysis of the M. tb H37Rv strain.
Macrophages, being professional phagocytes, ingest
and degrade dead cells, debris and foreign material, and
orchestrate inflammatory processes, which serve an essential role
in the control of bacterial infections (4,5).
When M. tb infects the host, it first needs to resist the
immune response from macrophages (6,7).
Paradoxically, macrophages may be the primary long-term environment
for M. tb in the host, as M. tb is able to evade the
principle antimicrobial mechanism of macrophages through a variety
of bacterial immune subversive mechanisms, allowing the bacteria to
utilize various intracellular cell resources (8). However, the mechanisms by which
M. tb enters the host cell, circumvents host defenses and
spreads to neighboring cell are not completely understood.
Therefore, an improved understanding of host-pathogen interaction
is essential if the global TB pandemic is to be controlled
(9). The interaction between
macrophages and M. tb alters cellular gene expression
profiles, and studies of changes in expression of these genes may
assist to understand the immunomodulatory effects of M. tb
in macrophages.
With the beginning of the era of big data, the
mining and application of high-throughput big data for genes has
received more and more attention. Microarray technology is
fundamental to generating large amounts of gene expression data.
Microarray technology is widely used as it is able to
simultaneously detect and express high-throughput expression levels
of 10,000's of gene transcription sets (10). Microarray technology can be used
to study gene expression more efficiently and in-depth. With the
increasing availability of microarray technology, gene expression
data associated with various physiological and disease conditions
are provided on public platforms, including the Gene Expression
Omnibus (GEO) database and The Cancer Genome Atlas database
(11). The meta-analysis tools
for the systematic and comprehensive quantitative analysis of the
results of multiple independent studies investigating the same
disease have been developed (12). A number of studies have used
meta-analysis methods to analyze small sample experimental studies,
improving the accuracy of statistical performance and effect
estimation (13-19).
The present study used meta-analysis methods to
identify overlapping DEGs in THP-1-derived macrophages infected by
M. tb, analyze protein-protein interaction (PPI) networks,
identify potential central genes, complete functional and pathway
enrichment studies and verify pivotal gene differences expression
through experiments. The potential effects of the immune mechanism
of TB infection was estimated using the aforementioned method.
Materials and methods
Microarray data collection and quality
control
The present study used the GEO database at the
National Center for Biotechnology Information (http://www.ncbi.nlm.nih.gov/geo/) to retrieve
expression profile datasets. The search terms used were:
'Mycobacterium tuberculosis', 'THP-1' and 'Homo
sapiens'. Series Matrix Files of these datasets was downloaded
respectively, and the probe IDs were transformed into official gene
symbols. In order to obtain more credible results, the MetaQC
package in R was applied to implement quality control analysis and
directly used the principal component analysis chart to display
statistical results. There are 6 quantitative quality control
measures in this package, including: i) internal homogeneity of
co-expression structure among studies; ii) external consistency of
co-expression structure correlating with a pathway database; iii)
accuracy of differentially expressed genes (DEG) detection and
pathway identification; and iv) consistency of differential
expression ranking of genes and pathways. Through quality control,
only the data with high quality was included in the subsequent
analysis.
DEGs identification
DEGs were screened out with MetaDE v.1.0.5 software
package (20), which provides 12
major meta-analysis methods. In the present study, 3 methods,
including Fisher, rth-ordered P-value (roP) and random effects
model (REM) were selected to filtrate DEGs in high quality data. A
false discovery rate (FDR) <0.05 was considered as the cut-off
criterion. In addition, the intersection of the required datasets
under the three statistical methods was extracted and considered as
the most reliable DEGs. DEGs were regressed into high quality data
to complete cluster analysis.
PPI network construction
The initial PPI network for the protein products of
identified DEGs was constructed using the Search Tool for the
Retrieval of Interacting Genes/Proteins Database (STRING v10;
https://string-db.org/) (21), and then the network was visualized
and analyzed with Cytoscape v.3.6.1 software (22). To extract the characteristic genes
from the DEGs, the CentiScape and MCODE plugins in the Cytoscape
software were used. Firstly, the Degree Centrality (DC) of
CentiScape reflects hubness of the node in the PPI network by
calculating the degree. Nodes with higher centrality were
extracted. Secondly, constructing sub-networks through k-core
analysis of the MCODE afforded the selection a stable structure
from a high-centrality network, and narrowed the scope of the
study.
Function and pathway enrichment analysis
of characteristic genes
To assess the prospective functions of
characteristic genes identified by the meta-analysis and PPI
network analysis, Gene Ontology (GO) biological pathways and Kyoto
Encyclopedia of Genes and Genomes (KEGG) pathways were identified
using CluGO from Cytoscape software. P<0.05, subjected to
Bonferroni adjustment, were defined as the cut-off criterion.
M. tb H37Rv and THP-1 cell line
propagation and infection
The M. tb H37Rv strain (American Type Culture
Collection; product no., 27294) was grown at 35°C for 15 days in a
Middlebrook 7H9 medium (BD Biosciences), supplemented with 10%
(v/v) OADC (BD Biosciences), with the addition of 0.2% glycerol
(v/v) and 0.025% Tween-80 (v/v). The human acute monocytic leukemia
THP-1 cell line (American Type Culture Collection; cat. no.
TIB-202) was cultivated at 37°C in 5% CO2 in RPMI-1640
(Hyclone; GE Healthcare Life Sciences) medium supplemented with 10%
FBS (Gibco; Thermo Fisher Scientific, Inc.). Prior to infection,
THP-1 cells were treated with 200 nM
phorbol-12-myristate-13-acetate (Sigma-Aldrich; Merck KGaA) for 24
h to allow for the differentiation into macrophages in 6-well
plates. Infections were performed with the M. tb H37Rv
strain at a multiplicity of infection of 5. The 7H9 broth was used
as a blank control.
M. tb infection confocal microscopy
The success of the M. tb infection model was
verified by observing the co-localization of M. tb with
THP-1 cell lysosomes. Firstly, M. tb was labeled with
fluorescent isothiocyanate (FITC) solution (Sigma-Aldrich; Merck
KGaA) according to the manufacturer's protocol. M. tb was
washed 3 times with PBS buffer, resuspended in carbonate buffer,
and added to FITC (10 mg/ml) to a final concentration of 100
µg/ml. Following incubation for 2 h at room temperature, the
supernatant was isolated by centrifugation at 1,000 × g for 2 min
at 4°C, and inoculated into THP-1 cells previously induced to
adhere to slides in a 6-well plate, and the whole procedure was
performed in the dark. Then, according to the manufacturer's
protocol, the Lyso Tracker Red99 (Sigma-Aldrich; Merck KGaA)
solution was prepared with RPMI-1640 medium, mixed and stored at
4°C, and preheated at 37°C prior to use. After 24 h, the cell
culture solution of infection was discarded, washed 3 times with
PBS, and 1 ml Lyso Tracker Red99 solution was added to each well to
label the lysosomal component of the macrophage, and incubated at
room temperature for 30 min. Finally, the supernatant was directly
discarded using a pipette and the slides were washed 3 times with
PBS. Then, the slides were removed, fixed on a glass slide with 4%
paraformaldehyde for 20 min at room temperature, observed under a
confocal microscope (magnification, ×20) and visualized by FV10-ASW
2.1 Viewer software (Olympus Europa Holding GmbH) to observe the
co-localization.
Reverse transcription quantitative
polymerase chain reaction (RT-qPCR)
To validate the accuracy of DEGs microarray analysis
results, the total RNA of cells from the infection model was
extracted using Trizol® (Invitrogen; Thermo Fisher
Scientific, Inc.) and 2 µg RNA was transcribed into cDNA by
PrimeScript™ RT reagent kit with gDNA Eraser (Perfect Real Time)
(Takara Biotechnology Co., Ltd.). Relative expression levels of
mRNA were quantitatively normalized and analyzed by RT-qPCR using
FastStart Universal SYBR Green Master (ROX; Roche Diagnostics)
against the expression of β-actin, using the 2−ΔΔCq
method (23). The primer
sequences were derived from PrimerBank (https://pga.mgh.harvard.edu/prim-erbank/) (24) (Table SI). The thermocycling conditions
for RT-qPCR are presented in Table
SII.
Statistical analysis
Receiver operating characteristic (ROC) curves were
used to analyze the differentially expressed genes [interferon
(IFN)-stimulated gene 15 (ISG15), 2′-5-oligoad-enylate
synthetase like (OASL), IFN regulatory factor 7
(IRF7) and DExD/H-box helicase 58 (DDX58)] between TB
infected group and control group. Quantitative data were expressed
as the mean ± standard deviation. GraphPad Prism 6 software
(GraphPad Software, Inc.) was utilized to draw the ROC curves and
calculated the sensitivity, specificity and area under the curve
(AUC). The AUC of the ROC curve >0.7 was regarded as
significant. Data from multiple groups were analyzed using analysis
of variance followed by a Student-Newman-Keuls post-hoc test.
P<0.05 was considered to indicate a statistically significant
difference.
Results
Identification of DEGs with microarray
meta-analysis
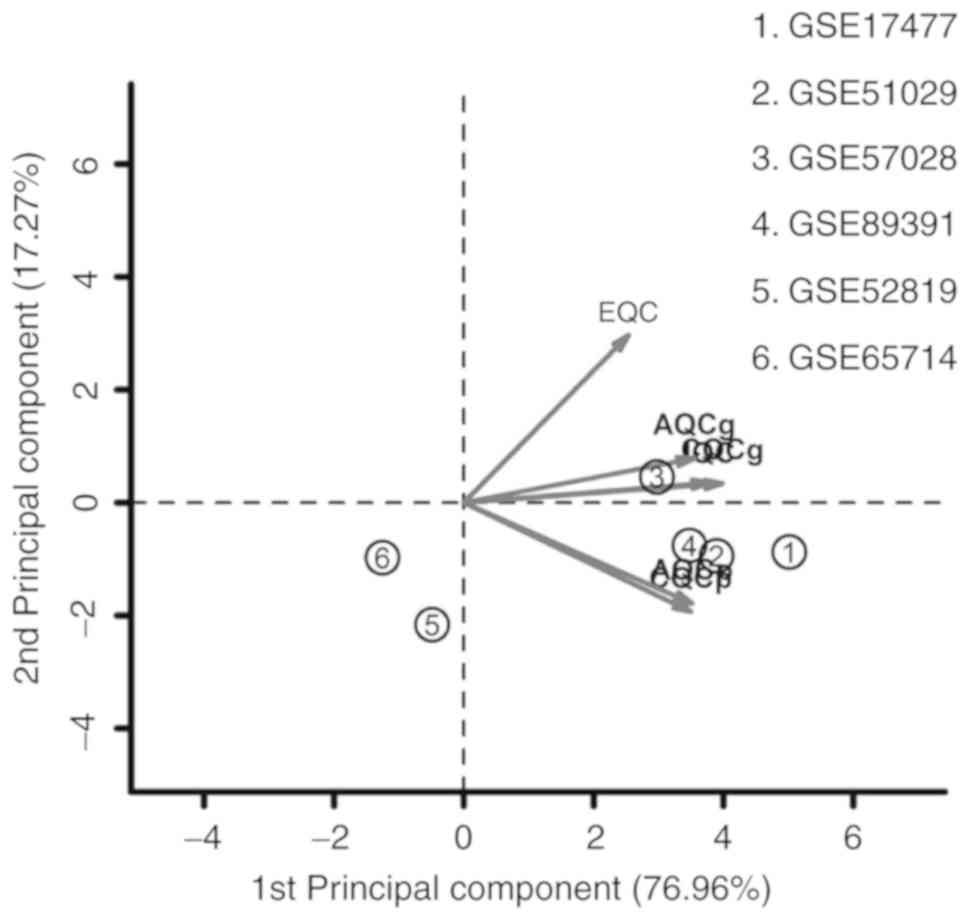
A total of 6 microarray datasets were downloaded
from the GEO using the aforementioned search method (Table I). These datasets were analyzed by
MetaQC package and visualized by principle component analysis (PCA;
Table II; Fig. 1). The results of the comprehensive
PCA indicate that the datasets GSE17477, GSE51029, GSE57028 and
GSE89391 were rated as high quality data. The raw data of these 4
high quality datasets were analyzed using the R package MetaDE, for
a total of 76 independent samples (30 H37Rv-infected samples and 46
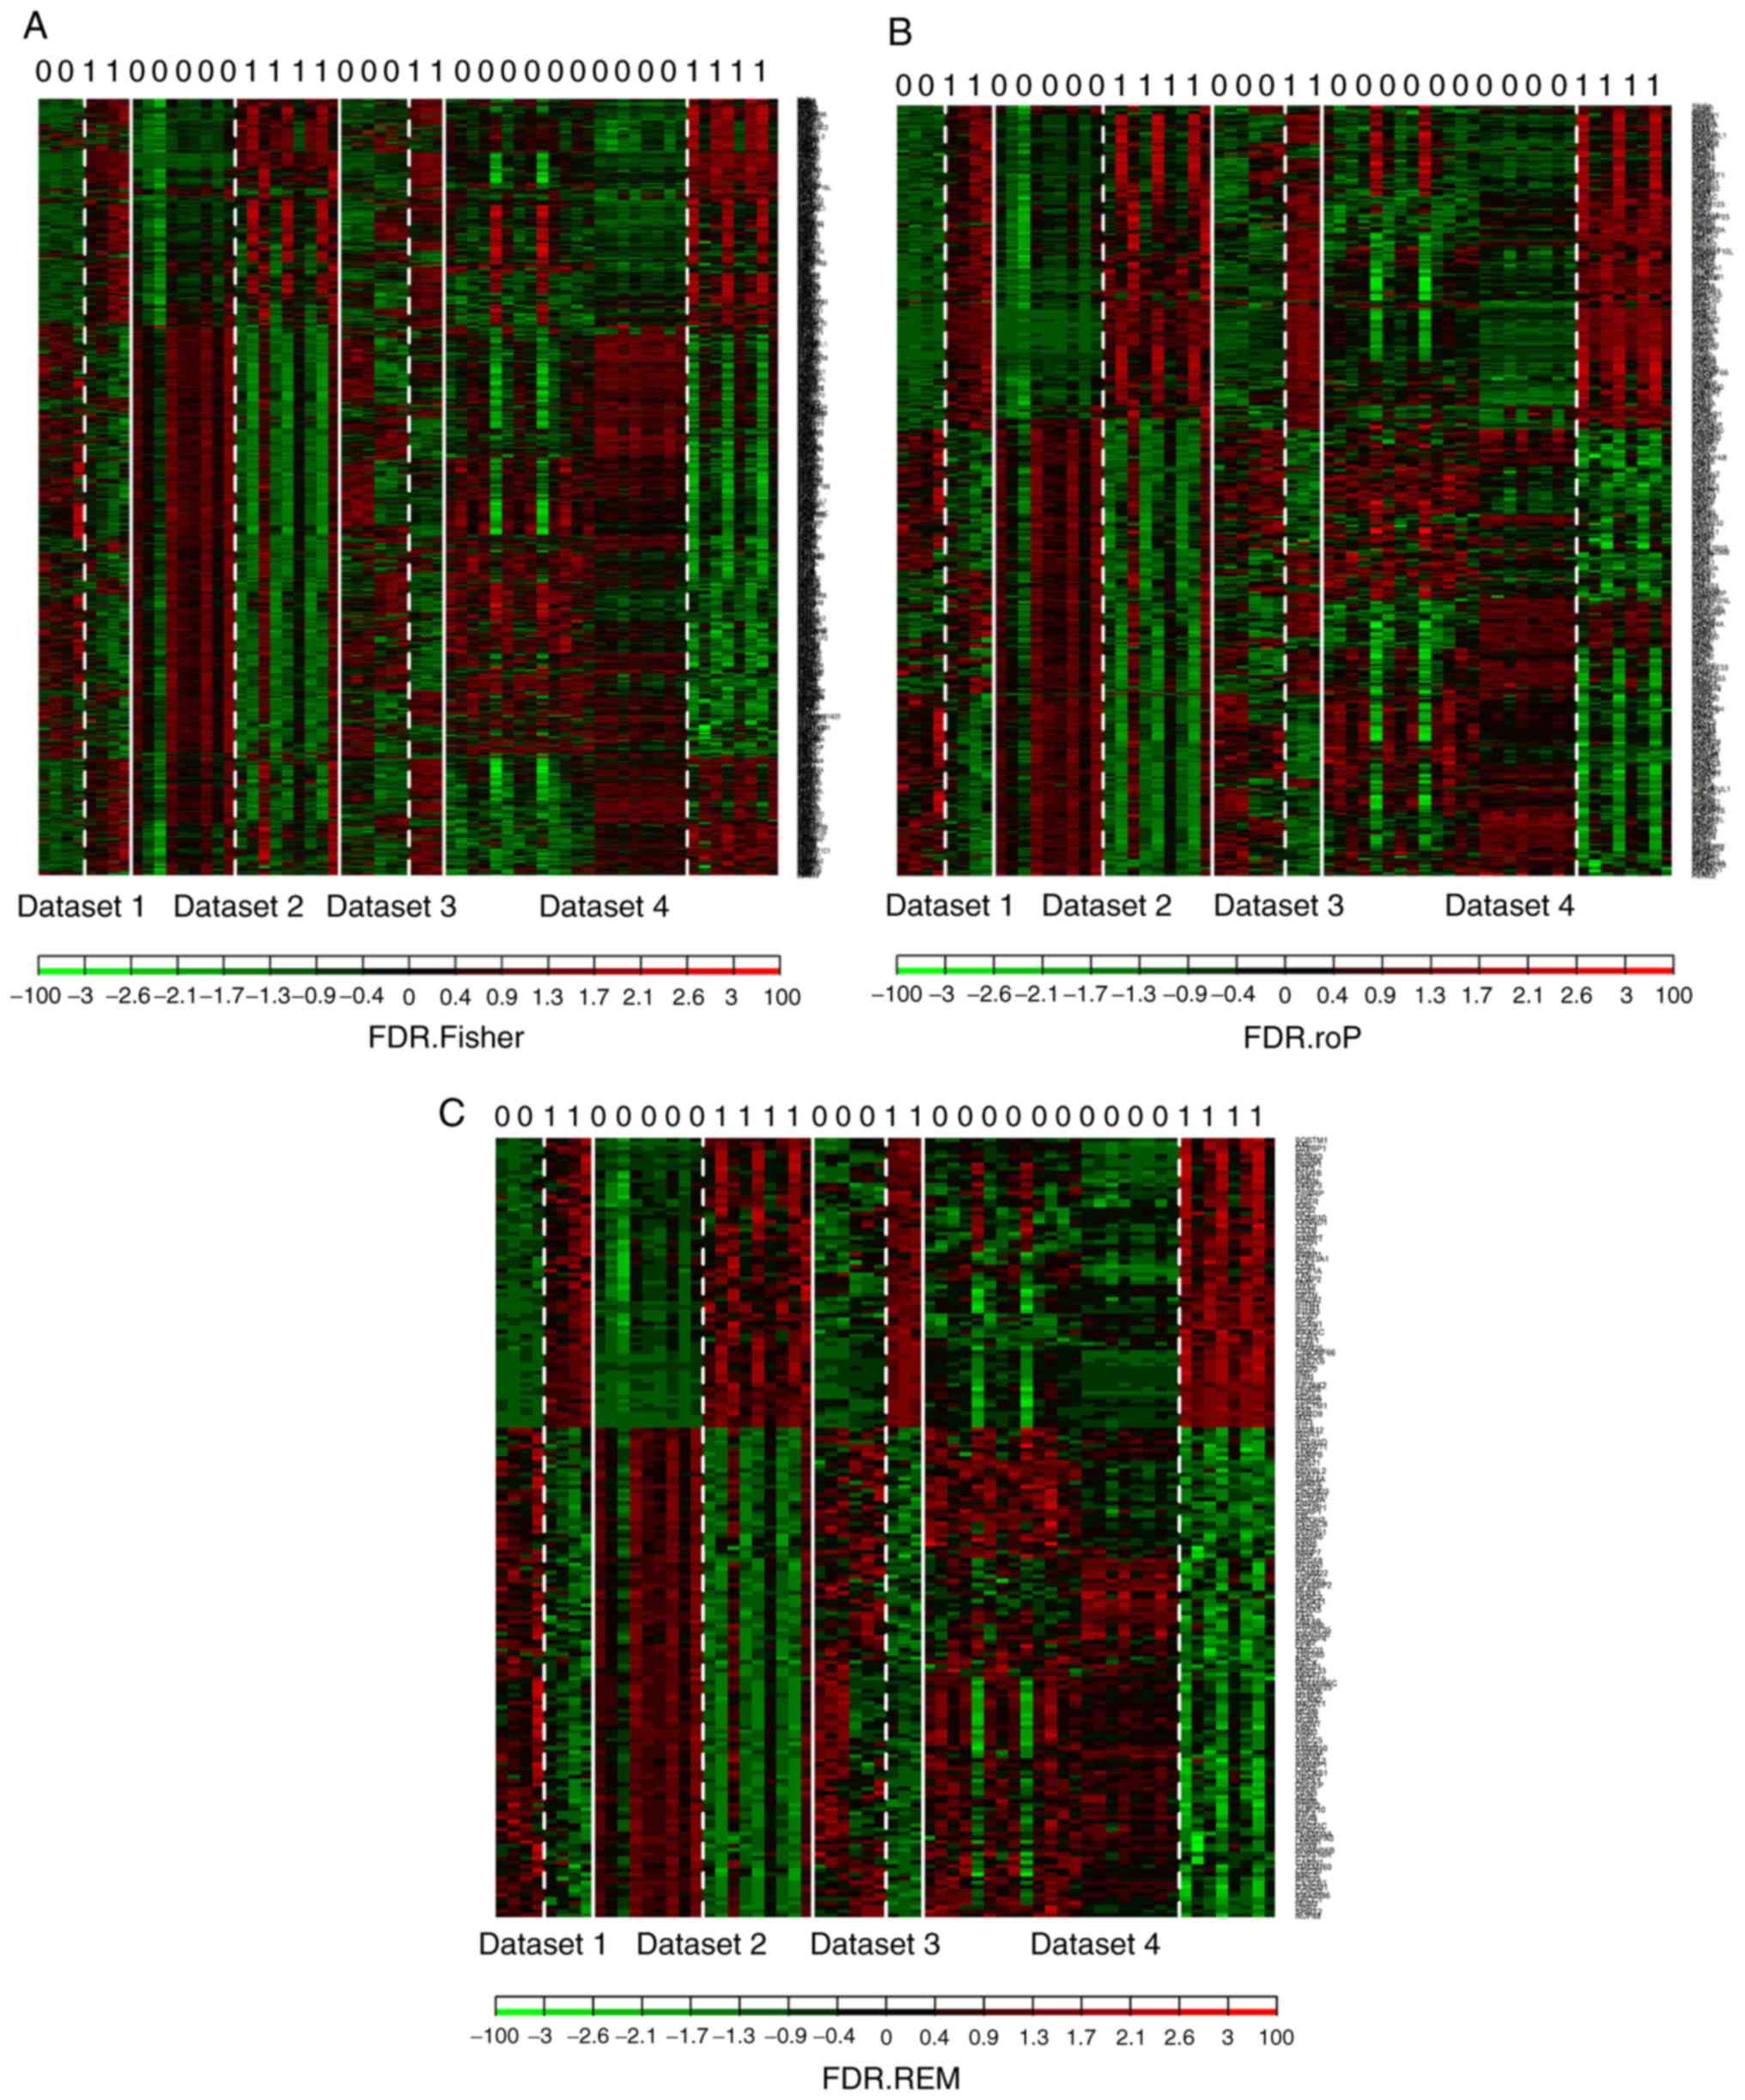
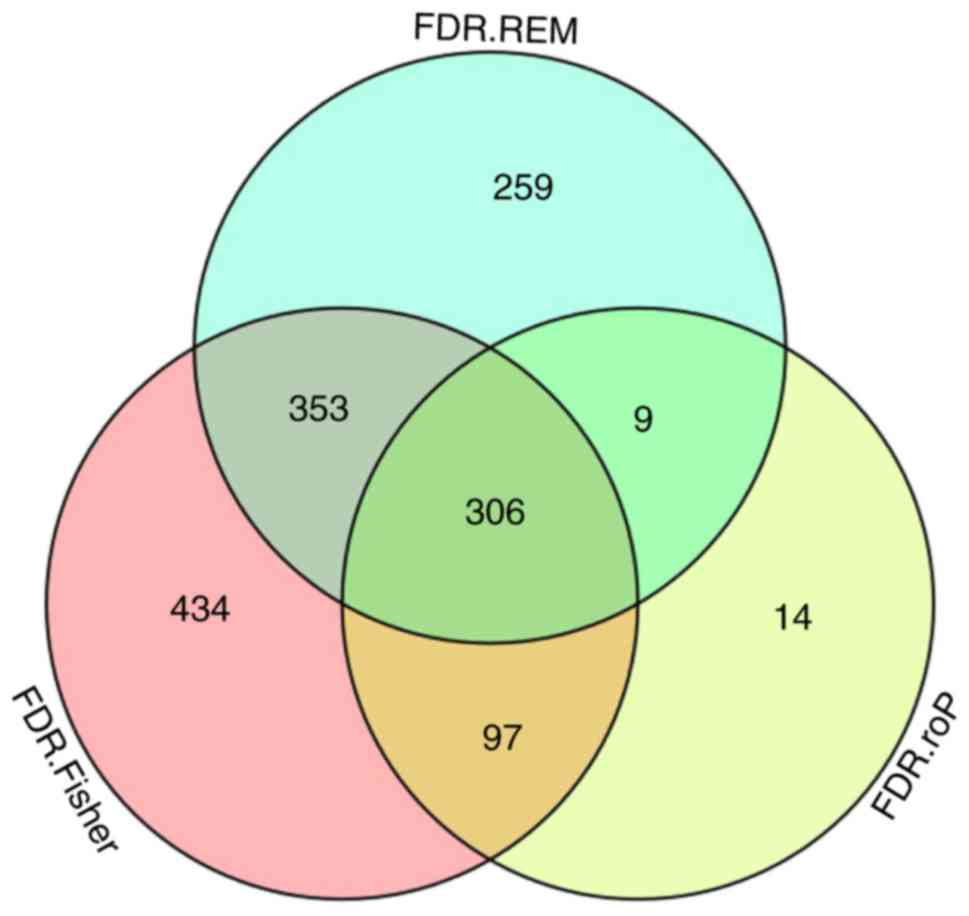
controls). The shared genes from the 4 datasets were analyzed by 3
methods: Fisher; roP; and REM (Fig.
2A-C). During the analysis, the non-DEGs, and those exhibiting
small variation and expression intensities across the majority of
datasets were filtered out. Through the same three statistical
methods (Fisher, roP and REM), 1,190, 426 and 927 differentially
expressed genes were identified, respectively. The intersection of
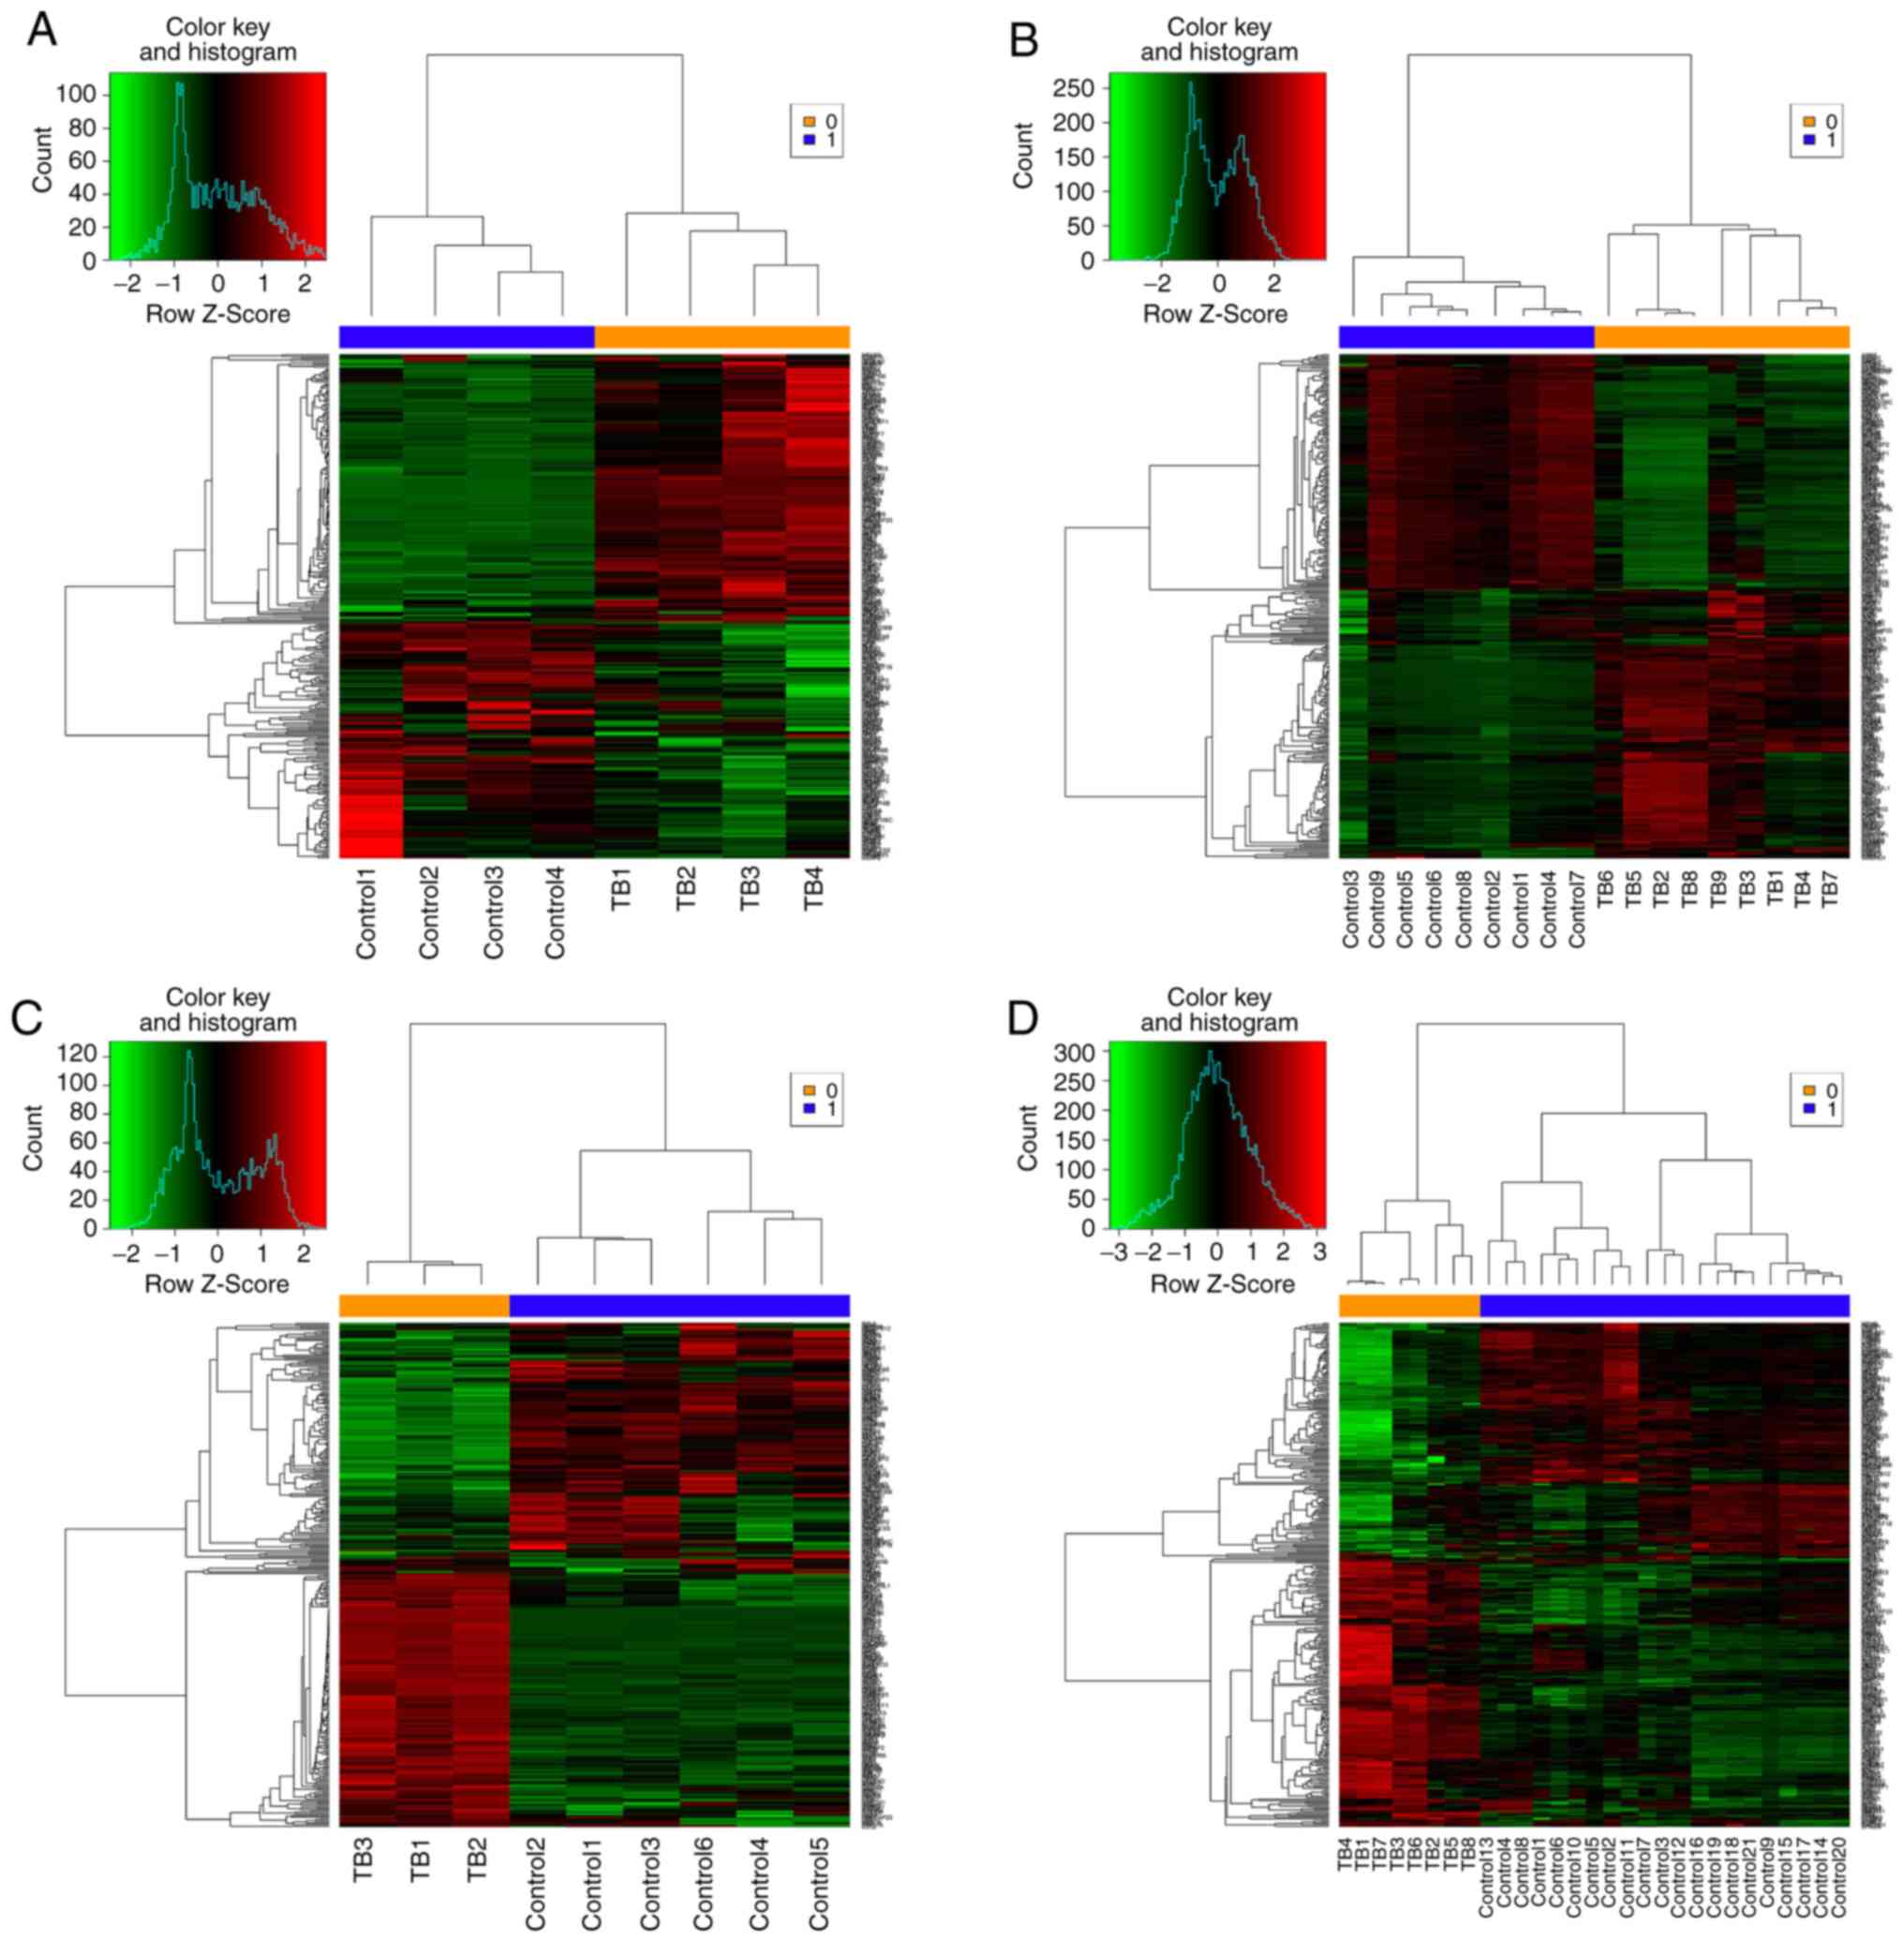
the 3 datasets yielded 306 common DEGs (Fig. 3). These 306 DEGs were arranged
into 4 high-quality datasets for hierarchical cluster analysis
(Fig. 4A-D). It was clear that
these genes were well-differentiated between the M. tb
infection and control groups. The top 20 shared DEGs identified in
the meta-analysis are summarized in Table III, ranked by average
log2 fold change.
 | Table ICharacteristics of gene expression
datasets from Gene Expression Omnibus database. |
Table I
Characteristics of gene expression
datasets from Gene Expression Omnibus database.
| ID | Platform | H37Rv infection
group | Control group |
|---|
| GSE17477 | GPL571 | 4 | 4 |
| GSE51029 | GPL4133 | 9 | 9 |
| GSE52819 | GPL6244 | 3 | 3 |
| GSE57028 | GPL16686 | 3 | 6 |
| GSE65714 | GPL10558 | 3 | 3 |
| GSE89391 | GPL6480 | 8 | 21 |
| Table IIQuality control test of the gene
expression datasets. |
Table II
Quality control test of the gene
expression datasets.
| Study | IQC | EQC C | QCg C | QCp | AQCg | AQCp | Rank |
|---|
| GSE17477 | 4.4 | 3.3 | 25.52 | 146.88 | 6.08 | 94.1 | 1.67 |
| GSE51029 | 4.84 | 3.19 | 21.13 | 127.06 | 2.88 | 79.93 | 2.83 |
| GSE57028 | 4.4 | 3.4 | 17.81 | 57.94 | 4.66 | 29.26 | 3.33 |
| GSE89391 | 4.4 | 2.77 | 19.03 | 106.29 | 3.9 | 64.74 | 3.5 |
| GSE52819 | 3.97 | 0.4 | 16.34 | 151.75 | 3.52 | 85.18 | 3.83 |
| GSE65714 | 0.26 | 0.75 | 0.58 | 0.96 | 0.26 | 0.49 | 5.83 |
| Table IIITop 20 shared differentially
expressed genes identified in the meta-analysis, ranked by average
Log2FC. |
Table III
Top 20 shared differentially
expressed genes identified in the meta-analysis, ranked by average
Log2FC.
A, Top 10
upregulated genes
|
|---|
| Symbol | FDR.Fisher | FDR.roP | FDR.REM | Average Log2FC |
|---|
| CXCL10 |
1.62×10⁻¹⁹ |
7.52×10−04 |
1.86×10−02 | 4.46 |
| IFI44L |
1.62×10⁻¹⁹ |
5.41×10⁻¹⁹ |
5.74×10−03 | 4.00 |
| RSAD2 |
1.62×10⁻¹⁹ |
5.41×10⁻¹⁹ |
4.35×10−03 | 3.89 |
| ISG20 |
1.62×10⁻¹⁹ |
4.63×10−05 |
2.43×10⁻¹⁹ | 3.59 |
| IFIT2 |
1.62×10⁻¹⁹ |
5.41×10⁻¹⁹ |
2.43×10⁻¹⁹ | 3.58328139 |
| IFIT1 |
1.62×10⁻¹⁹ |
5.41×10⁻¹⁹ |
2.43×10⁻¹⁹ | 3.58 |
| IFIT3 |
1.62×10⁻¹⁹ |
5.41×10⁻¹⁹ |
2.43×10⁻¹⁹ | 3.22 |
| OASL |
1.62×10⁻¹⁹ |
5.41×10⁻¹⁹ |
5.65×10−05 | 3.15 |
| HERC5 |
1.62×10⁻¹⁹ |
5.41×10⁻¹⁹ |
3.74×10−04 | 3.01 |
| IFITM1 |
1.62×10⁻¹⁹ |
5.41×10⁻¹⁹ |
1.96×10−05 | 2.78 |
B, Top 10
downregulated genes
|
|---|
| Symbol | FDR.Fisher | FDR.roP | FDR.REM | Average Log2FC |
|---|
| CX3CR1 |
1.62×10⁻¹⁹ |
1.94×10−04 |
8.65×10−05 | −1.17 |
| MYB |
1.62×10⁻¹⁹ |
1.31×10−03 |
1.50×10−02 | −1.09 |
| RASGRP2 |
7.10×10−04 |
1.20×10−04 |
3.21×10−02 | −1.00 |
| LMNB1 |
1.62×10⁻¹⁹ |
4.63×10−05 |
1.48×10−05 | −0.98 |
| ABI2 |
1.13×10−03 |
4.63×10−05 |
3.92×10−03 | −0.96 |
| PHGDH |
1.54×10−04 |
1.51×10−03 |
3.04×10−03 | −0.95 |
| RECK |
3.21×10−03 |
2.35×10−02 |
2.43×10⁻¹⁹ | −0.93 |
| DOCK10 |
1.62×10⁻¹⁹ |
5.41×10⁻¹⁹ |
7.87×10−03 | −0.90 |
| DTL |
1.75×10−03 |
4.46×10−02 |
5.07×10−04 | −0.89 |
| BUB1 |
6.61×10−03 |
2.56×10−02 |
5.74×10−03 | −0.89 |
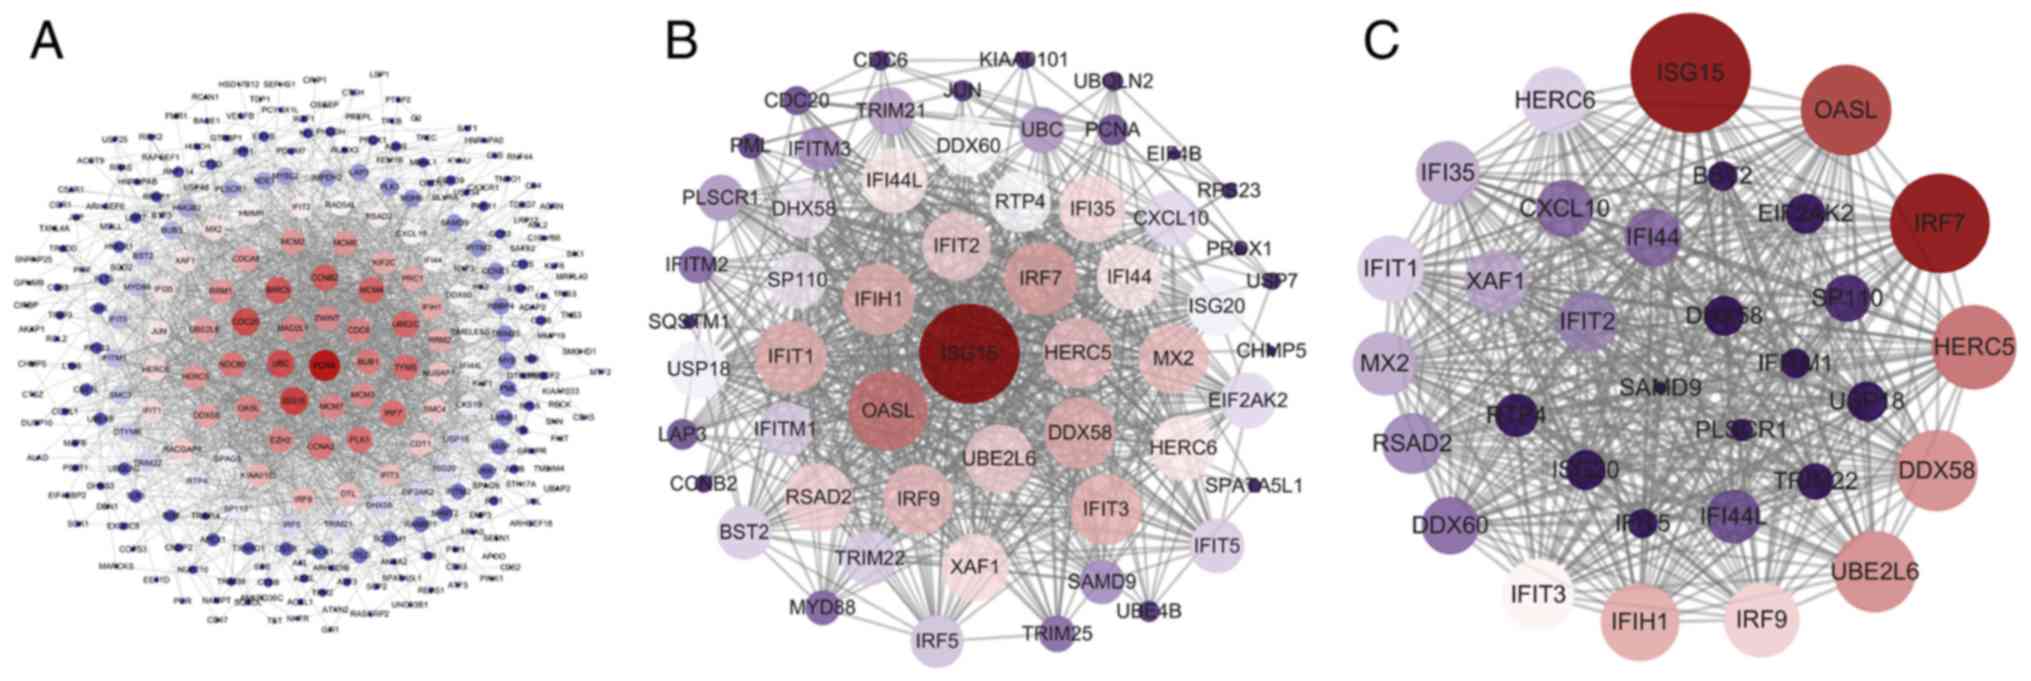
Prioritization of DEGs by PPI network
analysis
The PPI network of these DEGs was established using
STRING database, and the node and edge relationships were imported
into Cytoscape software for visualization, and then the DC
evaluation was completed. The degree result is demonstrated by the
size of the point and the thickness of the edge (Fig. 5A). The first 56 genes were
selected as hub genes (Fig. 5B)
as a focus for subsequent examination. Using the k-core
decomposition function of MCODE with average MCODE score =28.774,
nodes =32 and edges =446, a variety of sub-networks were obtained
and a new network was created (Fig.
5C). This resulted in 32 remaining differentially expressed
genes in the new network. These 32 differentially expressed genes
were therefore selected for further research to narrow the scope of
the present study. The association between the three PPI networks
is demonstrated in Fig. S1. The
results of DC and MCODE of DEGs analysis are summarized in Table IV.
| Table IVResults of Degree Centrality and
MCODE analysis. |
Table IV
Results of Degree Centrality and
MCODE analysis.
| Symbol | BC | Degree | MCODE_Score | MCODE_Cluster |
|---|
| ISG15 | 0.27257001 | 55 | 22.77 | Cluster 1 |
| OASL | 0.05886982 | 42 | 22.77 | Cluster 1 |
| IRF7 | 0.01632719 | 38 | 22.77 | Cluster 1 |
| DDX58 | 0.01029361 | 38 | 22.77 | Cluster 1 |
| IFIH1 | 0.00863645 | 37 | 22.77 | Cluster 1 |
| IFIT1 | 0.00773668 | 37 | 22.77 | Cluster 1 |
| IFIT3 | 0.01031726 | 37 | 22.77 | Cluster 1 |
| HERC5 | 0.01926602 | 36 | 22.77 | Cluster 1 |
| IRF9 | 0.0092487 | 36 | 22.77 | Cluster 1 |
| MX2 | 0.00610183 | 36 | 22.77 | Cluster 1 |
| IFIT2 | 0.00542212 | 35 | 22.77 | Cluster 1 |
| RSAD2 | 0.00566624 | 35 | 22.77 | Cluster 1 |
| UBE2L6 | 0.01919648 | 35 | 21.70666667 | Cluster 2|Cluster
1 |
| IFI35 | 0.00540913 | 34 | 22.77 | Cluster 1 |
| XAF1 | 0.0038621 | 34 | 22.77 | Cluster 1 |
| HERC6 | 0.01571431 | 33 | 22.77 | Cluster 1 |
| IFI44 | 0.00381869 | 33 | 22.77 | Cluster 1 |
| IFI44L | 0.00381869 | 33 | 22.77 | Cluster 1 |
| DDX60 | 0.00236545 | 30 | 22.77 | Cluster 1 |
| RTP4 | 0.00168655 | 30 | 20.69950739 | Cluster 2|Cluster
1 |
| ISG20 | 0.0054854 | 29 | 20.77173913 | Cluster 2|Cluster
1 |
| USP18 | 0.00142348 | 29 | 22.77 | Cluster 1 |
| DHX58 | 0.00224466 | 28 | 21.52615385 | Cluster 2|Cluster
1 |
| SP110 | 0.00130771 | 28 | 21.84057971 | Cluster 2|Cluster
1 |
| CXCL10 | 0.00634646 | 27 | 20.91699605 | Cluster 2|Cluster
1 |
| EIF2AK2 | 0.0022294 | 27 | 21.84057971 | Cluster 2|Cluster
1 |
| BST2 | 0.00201042 | 26 | 20 | Cluster 2|Cluster
1 |
| IFIT5 | 6.43E-04 | 26 | 21.84057971 | Cluster 2|Cluster
1 |
| IFITM1 | 0.00123016 | 26 | 19.42028986 | Cluster 2|Cluster
1 |
| TRIM22 | 0.00324214 | 26 | 18.75324675 | Cluster 2|Cluster
1 |
| PLSCR1 | 7.11E-04 | 21 | 18.90952381 | Cluster 2|Cluster
1 |
| SAMD9 | 5.86E-05 | 20 | 19 | Cluster 2|Cluster
1 |
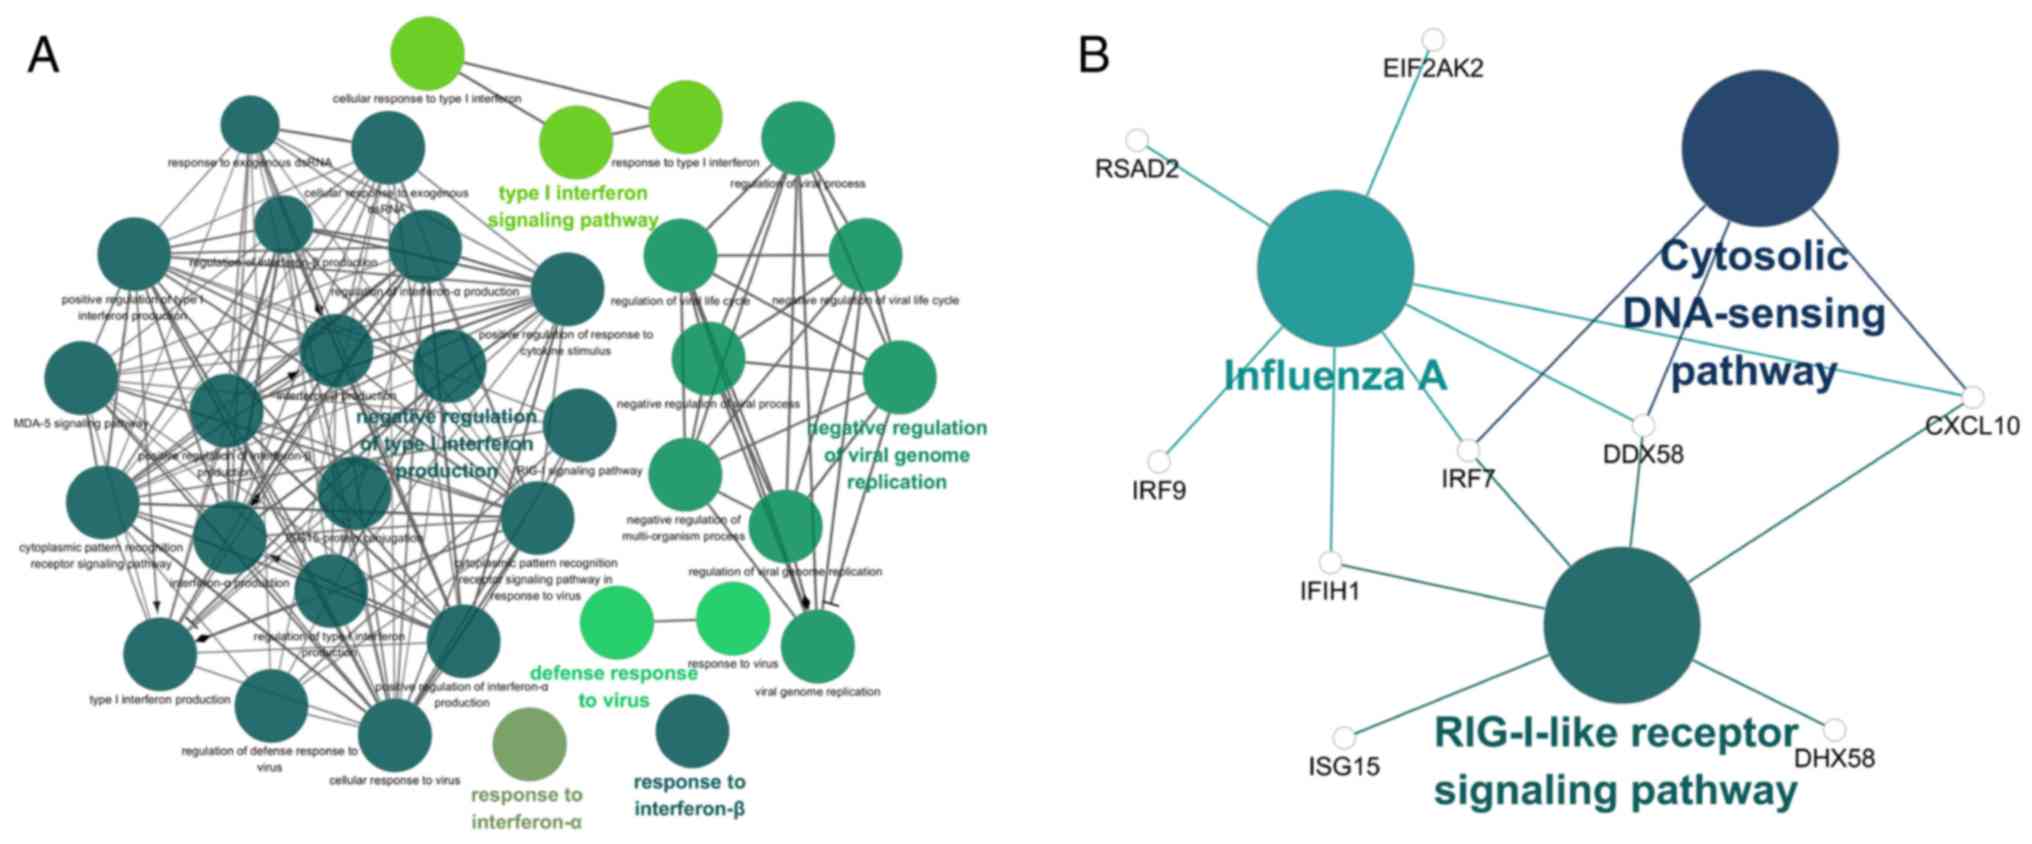
Function and pathway enrichment analyses
of hub genes
The GO and KEGG term enrichment analyses were
performed using CluGO. There were a total of 35 GO terms within the
'Biological Process' (BP) group and 3 KEGG pathways with P<0.05
(including Bonferroni adjustment) identified within the analysis of
the 32 characteristic genes.
Among the top significant GO BP terms identified
were those associated with response to IFN-α and IFN-β, the
IFN-γ-mediated signaling pathway and the type I IFN signaling
pathway (Fig. 6A). Only 3
significant KEGG pathways, the retinoic acid-inducible gene-I
(RIG-I)-like receptor signaling pathway, cytosolic DNA-sensing
pathway and influenza A were identified (Fig. 6B). Detailed enrichment information
for the GO and KEGG pathways is summarized in Tables V and VI. Based on the results of the function
and pathway enrichment analyses, the result that M. tb
infection was closely associated with virus-associated pathways,
including the type I IFN signaling pathway, is consistent with the
characteristics of M. tb as an intracellular pathogen. Among
these pathways, it was hypothesized that genes which serve a
significant role include bone marrow stromal cell antigen 2
(BST2), IRF7, IFN induced protein with
tetratricopeptide repeats 1 (IFIT1), C-X-C motif chemokine
ligand 10 (CXCL10), ISG15, DDX58 and
OASL.
| Table VMost significant GO pathway of the 32
nodes in the protein-protein interaction network. |
Table V
Most significant GO pathway of the 32
nodes in the protein-protein interaction network.
| GO ID | Term | P-value | Associated
genes |
|---|
| GO:0035455 | Response to
interferon-α |
3.23899×10⁻¹² | BST2, EIF2AK2,
IFIT2, IFIT3, IFITM1, MX2 |
| GO:0035456 | Response to
interferon-β |
8.3886×10⁻⁸ | BST2, IFITM1,
PLSCR1, XAF1 |
| GO:0060337 | Type I interferon
signaling pathway |
5.06394×10⁻²⁷ | BST2, IFI35, IFIT1,
IFIT2, IFIT3, IFITM1, IRF7, IRF9, ISG15, ISG20, MX2, OASL, RSAD2,
USP18, XAF1 |
| GO:0051607 | Defense response to
virus |
4.21784×10−39 | BST2, CXCL10,
DDX58, DDX60, DHX58, EIF2AK2, HERC5, IFI44L, IFIH1, IFIT1, IFIT2,
IFIT3, IFIT5, IFITM1, IRF7, IRF9, ISG15, ISG20, MX2, OASL, PLSCR1,
RSAD2, RTP4, TRIM22 |
| GO:0045069 | Negative regulation
of viral genome replication |
2.22495×10⁻¹⁶ | BST2, EIF2AK2,
IFIT1, IFIT5, IFITM1, ISG15, ISG20, OASL, PLSCR1, RSAD2 |
| GO:0032480 | Negative regulation
of type I interferon production |
3.69762×10⁻¹⁰ | DDX58, DHX58,
HERC5, IFIH1, ISG15, UBE2L6 |
| Table VIMost significant KEGG pathway of the
32 nodes in the protein-protein interaction network. |
Table VI
Most significant KEGG pathway of the
32 nodes in the protein-protein interaction network.
| KEGG ID | Term | P-value | Associated genes
identified |
|---|
| KEGG:04622 | Retinoic
acid-inducible gene-I-like receptor signaling pathway |
1.0325×10⁻⁹ | CXCL10, DDX58,
DHX58, IFIH1, IRF7, ISG15 |
| KEGG:04623 | Cytosolic
DNA-sensing pathway | 0.000173925 | CXCL10, DDX58,
IRF7 |
| KEGG:05164 | Influenza A |
5.76×10⁻⁹ | CXCL10, DDX58,
EIF2AK2, IFIH1, IRF7, IRF9, RSAD2 |
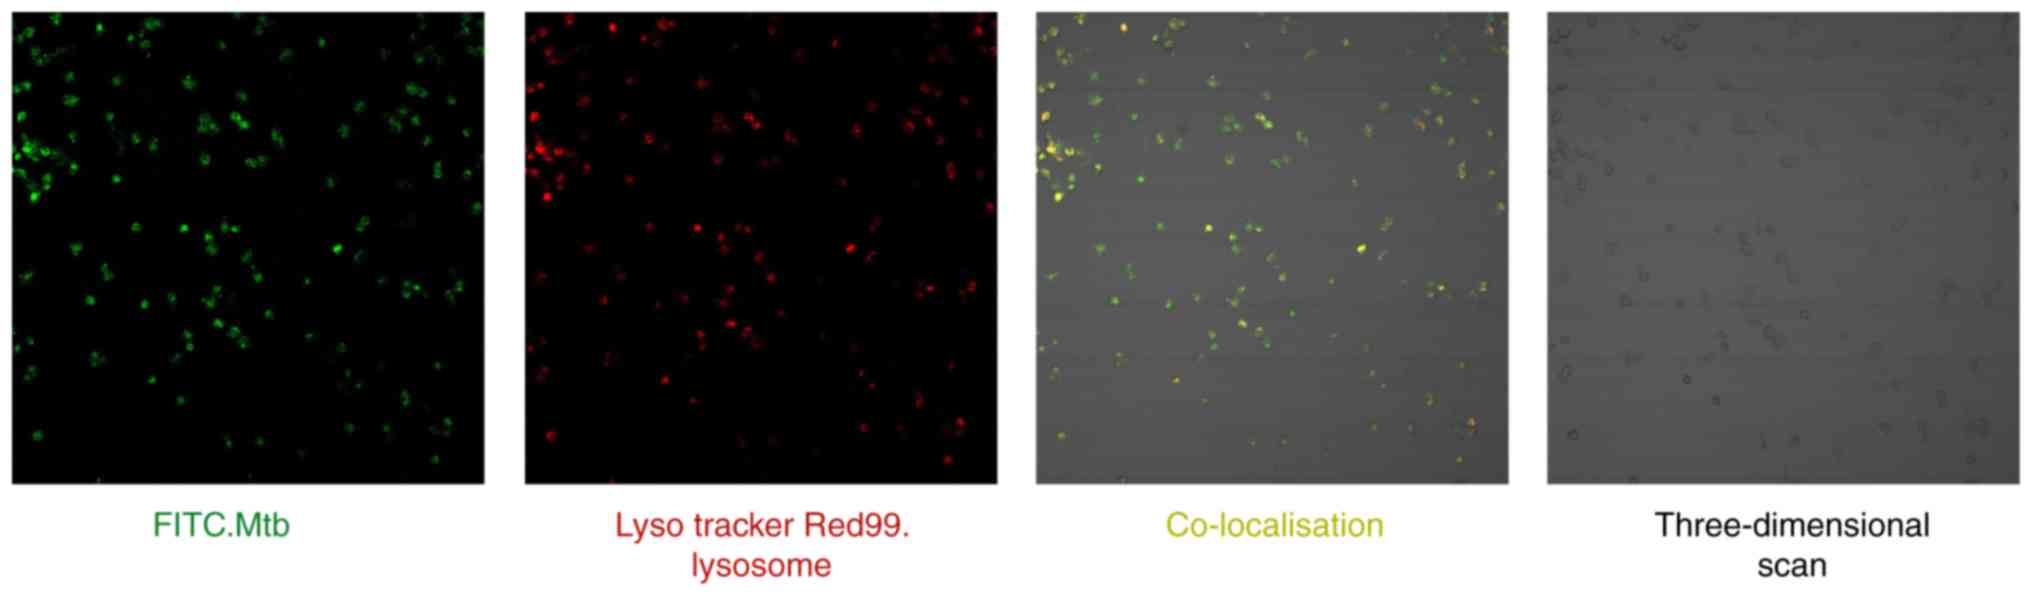
M. tb successfully enters THP-1-derived
macrophage lysosomes
Co-localization of the lysosome
specific-acido-tropic dye Lyso Tracker Red99 with live virulent
M. tb in macrophages was examined by confocal microscopy
(Fig. 7). A total of 2 sets of
images were recorded: Firstly, the localization of the FITC-labeled
Mycobacterium-positive compartment (green) and secondly, the
Lyso Tracker Red99 lysosome-positive compartment (red). Following
merging of the 2 image sets, the sections in which M. tb was
co-localized with the lysosomes appeared yellow. Finally, a
three-dimensional scan of THP-1 derived macrophages was obtained.
These results demonstrated that THP-1 cells were successfully
cultured and induced into macrophages, and that an M. tb
infection model was established to verify the reliability of the
previous bioinformatics analysis.
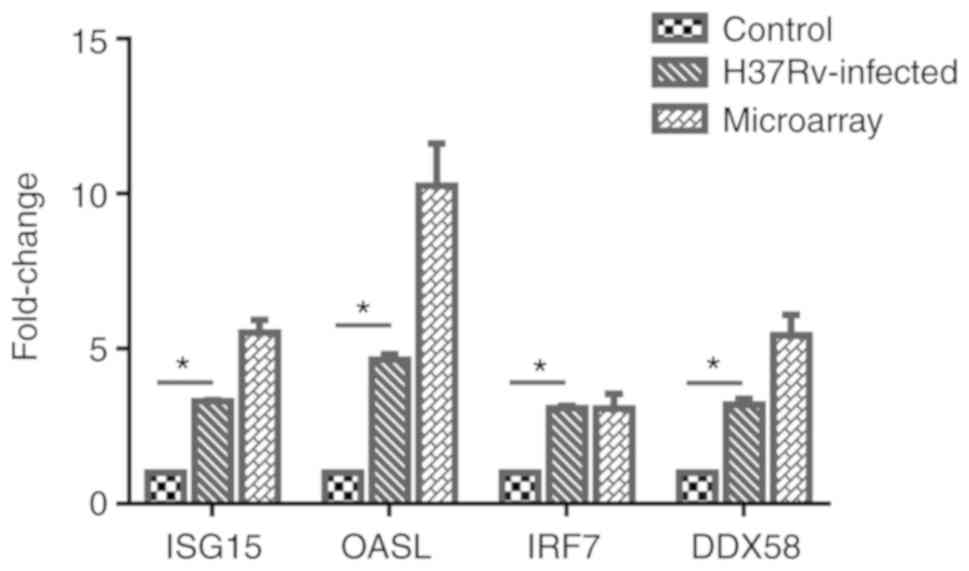
Analysis of relative expression levels of
ISG15, OASL, IRF7 and DDX58 in the infection model
A total of 4 genes, ISG15, OASL, IRF7 and
DDX58, were selected from the important genes identified,
and their differential expression levels between the infected and
control groups was verified by RT-qPCR. Using the 2−ΔΔCq
method, the difference in expression levels of the 4 genes relative
to β-actin was calculated, and it was identified that the
expression of these 4 genes was significantly upregulated following
M. tb infection. Then, GraphPad Prism 6 software was used to
visually demonstrate the comparison between RT-qPCR results and
microarray meta-analysis results, and it was identified that the
experimental verification results were consistent with
bioinformatics analysis data (Fig.
8). These genes were differentially expressed following M.
tb infection of the host and are associated with the response
mechanism of the host to M. tb, which requires additional
study.
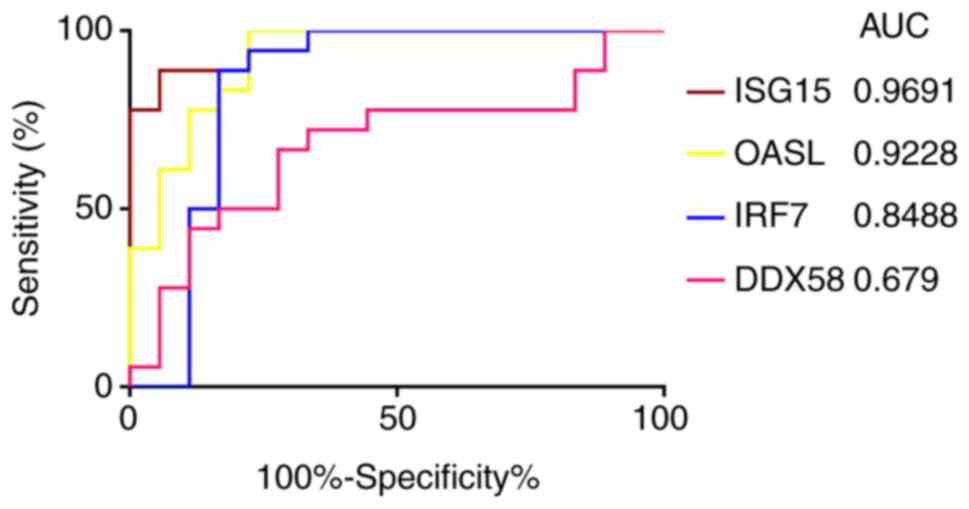
ROC curve analysis of the expression of
ISG15, OASL, IRF7 and DDX58
The ROC curve analysis of ISG15, OASL,
IRF7 and DDX58 identified that the AUC values were
0.9691, 0.9228, 0.8488 and 0.679, respectively (Fig. 9). Among the 4 genes, only the AUC
of the ROC curve of DDX58 was <0.7, indicating that
DDX58 did not have good specificity and sensitivity, while
ISG15, OASL and IRF7 were statistically
significant, and may be able to distinguish between infected and
uninfected cells.
Discussion
In the present study, a meta-analysis was conducted
using microarray-based gene expression studies that were previously
published and are available for public reuse. Under the premise of
reducing research bias and individual heterogeneity, a total of 306
DEGs with high credibility were identified, including 178
upregulated and 128 downregulated genes with FDR<0.05. Based on
these DEGs, a PPI network was constructed, including 275 nodes and
2038 edges, and 32 characteristic genes were obtained through DC
sorting and k-core analysis, including ISG15, OASL, IRF7,
DDX58, IFN induced with helicase C domain 1, IFIT1, IFN
induced protein with tetratricopeptide repeats 3, HECT and RLD
domain containing E3 ubiquitin protein ligase 5, IFN regulatory
factor 9, MX dynamin like GTPase 2, IFN induced protein with
tetratricopeptide repeats 2, radical S-adenosyl methionine domain
containing 2, ubiquitin conjugating enzyme E2 L6, IFN induced
protein 35, XIAP associated factor 1, HECT and RLD domain
containing E3 ubiquitin protein ligase family member 6, IFN induced
protein 44 (IFI44), IFI44 like, DExD/H-box helicase 60,
receptor transporter protein 4, IFN stimulated exonuclease gene 20,
ubiquitin specific peptidase 18 and sterile α motif domain
containing 9.
A THP-1-derived macrophage model of M. tb
infection was constructed, and the co-localization association
between M. tb and lysosome was confirmed by confocal
microscopy to determine the success of infection. Among the 32
characteristic genes identified, the genes with the top 4 DC values
in the PPI network and associations with type I IFN were selected
as the verification targets. The expression of these 4 genes
extracted by bioinformatics analysis was verified, and the RT-qPCR
results were consistent with the microarray data analysis, which
suggested that the results of the analyses were reliable.
These characteristic genes were primarily enriched
in BP pathways including responses to IFN-α and IFN-β, the
IFN-γ-mediated signaling pathway, the type I IFN signaling pathway,
defense response to virus and regulation of viral genome
replication. Analysis of the KEGG pathways revealed that the
characteristic genes were involved in the RIG-I-like receptor
signaling pathway, cytosolic DNA-sensing pathway, and influenza A
pathways. These results are consistent with the intracellular
parasite characteristics of M. tb. This species is known to
possess a specific secretion system, early secretory antigenic
target-6 secretion system 1 (ESX-1), which serves a key role in
mycobacterial virulence by promoting the release of M. tb
products into the cytoplasm of macrophages (25-28). We hypothesized that the
double-stranded DNA of M. tb enters the host cell via the
ESX-1 system, stimulating the response recognition of the cytosolic
DNA-sensing pathway, which triggers downstream type I
IFN-associated signaling pathways.
The type I IFN system, as the first important line
of defense against viral infection, detects viruses by
pattern-recognition receptor recognition of pathogen-associated
molecular patterns, and then expresses >300 IFN-stimulated genes
to mediate multiple antiviral mechanisms to exert antiviral and
immunomodulatory effects (29).
However, viruses have developed an impressive array of strategies
to circumvent IFN responses, for example, by disrupting Toll-like
receptors or RIG-I-like receptors to prevent initial virus
detection, and the degradation of transcription factors involved in
IFN expression, in order to prevent IFN production (30). The interaction between viruses and
the type I IFN system requires additional study. The present study
only focused on the role of the type I IFN system in M. tb
infection, as it has been suggested previously that the type I IFN
pathway may promote the survival and replication of M. tb in
host cells, and that this is a common strategy of a number of
intracellular pathogenic bacteria to promote virulence (28,31-38). Understanding the role of type I
IFN signaling is critical to understanding the pathology and
outcome of TB. Therefore, the present study focused on the most
important first-line genes identified in the PPI network, which
were associated with type I IFNs and validated by biological
experiments and ROC curve analysis, ISG15, OASL and
IRF7.
ISG15 is one of the most commonly induced
proteins by type I IFN (39) and
during M. tb infection (40). It is a ubiquitin-like protein that
is conjugated to intracellular target proteins upon activation by
IFN-α and IFN-β (41). It has
been demonstrated to have several functions, including promoting T
cell-dependent natural killer cell proliferation, augmenting
lymphokine activated killer activity, serving as a chemotactic
factor that enhances neutrophil chemotactic activity, directing
ligated target proteins to intermediate filaments, cell-to-cell
signaling and antiviral activity during viral infections (42-45).
It was suggested that type I IFN and ISG15
serve transient roles in promoting bacterial replication. However,
as the disease progresses, ISGylation deviates from the overall
effect of type I IFN and, ultimately, mice deficient in ISGylation
are significantly more susceptible than IFNAR mice (46). In the study conducted by Keller
et al (47), differences
in gene expression in M. tb-infected susceptible and
resistant mouse strains were investigated, and ISG15
expression was also significantly increased following infection
with M. tb for 28 days. However, to the best of our
knowledge, no studies have been conducted in patients with TB;
ISG15 may lead to different disease outcomes during the
development of TB infection in humans, and the actual role requires
additional study.
The data from the study by Sambarey et al
(48), involving whole blood
samples from patients with TB, indicated that OASL was
significantly upregulated in blood samples from patients with
active TB compared with patients with latent TB, and the expression
level in the blood samples of patients after 6 months of treatment
was significantly downregulated. However, to the best of our
knowledge, no in-depth study of the role of OASL in the
infection process has been performed as of yet. OASL belongs
to the type I IFN-induced antiviral protein OAS family consisting
of OAS1, OAS2, OAS3 and OASL (49). OASL is associated with the
OAS family through the N-terminal OAS-like domain but lacks
synthetase activity (50).
Although OASL lacks enzymatic activity, recently identified
functions appear to be critical for viral innate and adaptive
immune responses (51). In
response to viral infections, OASL serves 2 distinct roles.
In the case of RNA virus infection, OASL may enhance the
ability of type I IFN signaling to exert antiviral effects
(51). However, when challenged
with DNA viruses, OASL exerts a pro-survival function by
inhibiting type I IFN signaling (52,53). Nonetheless, its biological role in
microbial infection is not clear. As M. tb is phagocytosed
by macrophages, it is able to release contents including dsDNA into
host cell solute, which is similar to DNA virus attack. A recent
study identified that when the host was infected with M.
leprae, OASL was able to inhibit antimicrobial peptides
expression, impair the mechanism of bacterial kill activation and
inhibit the autophagy process of host cells, thereby preventing
microbial clearance (54). In
view of these data and the similarity between the physiological
state and infection process of M. tb and M. leprae,
it is reasonable to conclude that OASL may serve a similar
role in M. tb infection, relying on the type I IFN pathway
to inhibit autophagy of macrophages, provide sites and raw
materials for M. tb, and promote the progression of TB.
Finally, IRF7 encodes IFN regulatory factor
7, a member of the IFN regulatory transcription factor family.
IRF7 was also demonstrated to be upregulated in a host RNA
sequencing study in response to M. tb infection (55). Cheng and Schorey (56)
indicated that M. tb may rely on cytoplasmic DNA and RNA
sensing pathways to mediate IFN-βproduction by IRF7, thereby
assisting the host in the identification of bacterial infection. In
the study by Lin et al (57), involving whole blood gene
expression profiles in patients with active and latent TB, a
transcription factor gene regulatory network was constructed and
IRF7 was revealed to be significantly upregulated and
enriched in the immune and infection pathways, which was
hypothesized to help patients resist TB infection (57).
In conclusion, the present study demonstrated that
the type I interferon signaling pathway serves a significant role
in the infection of macrophages by M. tb. In addition, the
mechanism of a number IFN-stimulated genes in TB infection remains
uncertain, but ISG15 and OASL are likely to become a
potential target for TB treatment, creating new possibilities for
TB treatment. However, the results from the present study were
obtained via bioinformatics analysis, and require additional
confirmation using animal model studies.
Supplementary Data
Acknowledgments
Not applicable.
Funding
The present study was supported by the National
Natural Science Foundation of China (grant no., 81672109), the
Fundamental Research Funds for the Central Universities, JLU and
Program for JLU Science and Technology Innovative Research
Team.
Availability of data and materials
All data generated or analyzed during this study are
included in this published article.
Authors' contributions
FL, YWZ and YL designed the current study. YWZ, YL
and RNT performed the experiments and acquired/analyzed the data.
HYY and RNT analyzed experimental data. YWZ and YL wrote the
manuscript. The final version of the manuscript was read and
approved by all authors.
Ethics approval and consent to
participate
Not applicable.
Patient consent for publication
Not applicable.
Competing interests
The authors declare that they have no competing
interests.
References
|
1
|
Goldberg MF, Saini NK and Porcelli SA:
Evasion of innate and adaptive immunity by Mycobacterium
tuberculosis. Microbiol Spectr. 5:2014.
|
|
2
|
Comas I, Coscolla M, Luo T, Borrell S,
Holt KE, Kato-Maeda M, Parkhill J, Malla B, Berg S, Thwaites G, et
al: Out-of-Africa migration and Neolithic coexpansion of
Mycobacterium tuberculosis with modern humans. Nat Genet.
45:1176–1182. 2013. View
Article : Google Scholar : PubMed/NCBI
|
|
3
|
Organization WH: Global Tuberculosis
Report. 2018, https://www.who.int/tb/publications/global_report/en/.
Accessed September 18, 2018.
|
|
4
|
Aderem A and Underhill DM: Mechanisms of
phagocytosis in macrophages. Annu Rev Immunol. 17:593–623. 1999.
View Article : Google Scholar : PubMed/NCBI
|
|
5
|
Weiss G and Schaible UE: Macrophage
defense mechanisms against intracellular bacteria. Immunol Rev.
264:182–203. 2015. View Article : Google Scholar : PubMed/NCBI
|
|
6
|
Akira S, Uematsu S and Takeuchi O:
Pathogen recognition and innate immunity. Cell. 124:783–801. 2006.
View Article : Google Scholar : PubMed/NCBI
|
|
7
|
Bhatt K and Salgame P: Host innate immune
response to Mycobacterium tuberculosis. J Clin Immunol. 27:347–362.
2007. View Article : Google Scholar : PubMed/NCBI
|
|
8
|
Hmama Z, Peña-Díaz S, Joseph S and Av-Gay
Y: Immunoevasion and immunosuppression of the macrophage by
Mycobacterium tuberculosis. Immunol Rev. 264:220–232. 2015.
View Article : Google Scholar : PubMed/NCBI
|
|
9
|
Meena LS and Rajni: Survival mechanisms of
pathogenic Mycobacterium tuberculosis H37Rv. FEBS J. 277:2416–2427.
2010. View Article : Google Scholar : PubMed/NCBI
|
|
10
|
Rhodes DR, Yu J, Shanker K, Deshpande N,
Varambally R, Ghosh D, Barrette T, Pandey A and Chinnaiyan AM:
Large-scale meta-analysis of cancer microarray data identifies
common transcriptional profiles of neoplastic transformation and
progression. Proc Natl Acad Sci USA. 101:9309–9314. 2004.
View Article : Google Scholar : PubMed/NCBI
|
|
11
|
Rung J and Brazma A: Reuse of public
genome-wide gene expression data. Nat Rev Genet. 14:89–99. 2013.
View Article : Google Scholar
|
|
12
|
Wang X, Kang DD, Shen K, Song C, Lu S,
Chang LC, Liao SG, Huo Z, Tang S, Ding Y, et al: An R package suite
for microarray meta-analysis in quality control, differentially
expressed gene analysis and pathway enrichment detection.
Bioinformatics. 28:2534–2536. 2012. View Article : Google Scholar : PubMed/NCBI
|
|
13
|
Smid M, Dorssers LC and Jenster G: Venn
mapping: Clustering of heterologous microarray data based on the
number of co-occurring differentially expressed genes.
Bioinformatics. 19:2065–2071. 2003. View Article : Google Scholar : PubMed/NCBI
|
|
14
|
DeConde RP, Hawley S, Falcon S, Clegg N,
Knudsen B and Etzioni R: Combining results of microarray
experiments: A rank aggregation approach. Stat Appl Genet Mol Biol.
5:Article152006. View Article : Google Scholar : PubMed/NCBI
|
|
15
|
Xia J, Fjell CD, Mayer ML, Pena OM,
Wishart DS and Hancock RE: INMEX-a web-based tool for integrative
meta-analysis of expression data. Nucleic Acids Res. 41:W63–W70.
2013. View Article : Google Scholar : PubMed/NCBI
|
|
16
|
Xia J, Gill EE and Hancock RE:
NetworkAnalyst for statistical, visual and network-based
meta-analysis of gene expression data. Nat Protoc. 10:823–844.
2015. View Article : Google Scholar : PubMed/NCBI
|
|
17
|
Wang R, Cai Y, Zhang B and Wu Z: A 16-gene
expression signature to distinguish stage I from stage II lung
squamous carcinoma. Int J Mol Med. 41:1377–1384. 2018.
|
|
18
|
Shao K, Shen LS, Li HH, Huang S and Zhang
Y: Systematic-analysis of mRNA expression profiles in skeletal
muscle of patients with type II diabetes: The glucocorticoid was
central in pathogenesis. J Cell Physiol. 233:4068–4076. 2018.
View Article : Google Scholar
|
|
19
|
Tuo Y, An N and Zhang M: Feature genes in
metastatic breast cancer identified by MetaDE and SVM classifier
methods. Mol Med Rep. 17:4281–4290. 2018.PubMed/NCBI
|
|
20
|
Tseng GC, Ghosh D and Feingold E:
Comprehensive literature review and statistical considerations for
microarray meta-analysis. Nucleic Acids Res. 40:3785–3799. 2012.
View Article : Google Scholar : PubMed/NCBI
|
|
21
|
Szklarczyk D, Franceschini A, Wyder S,
Forslund K, Heller D, Huerta-Cepas J, Simonovic M, Roth A, Santos
A, Tsafou KP, et al: STRING v10: Protein-protein interaction
networks, integrated over the tree of life. Nucleic Acids Res.
43:D447–D452. 2015. View Article : Google Scholar
|
|
22
|
Shannon P, Markiel A, Ozier O, Baliga NS,
Wang JT, Ramage D, Amin N, Schwikowski B and Ideker T: Cytoscape: A
software environment for integrated models of biomolecular
interaction networks. Genome Res. 13:2498–2504. 2003. View Article : Google Scholar : PubMed/NCBI
|
|
23
|
Livak KJ and Schmittgen TD: Analysis of
relative gene expression data using real-time quantitative PCR and
the 2(−Delta Delta C(T)) method. Methods. 25:402–408. 2001.
View Article : Google Scholar
|
|
24
|
Spandidos A, Wang X, Wang H and Seed B:
PrimerBank: A resource of human and mouse PCR primer pairs for gene
expression detection and quantification. Nucleic Acids Res.
38:D792–D799. 2010. View Article : Google Scholar :
|
|
25
|
Stanley SA, Raghavan S, Hwang WW and Cox
JS: Acute infection and macrophage subversion by Mycobacterium
tuberculosis require a specialized secretion system. Proc Natl Acad
Sci USA. 100:13001–13006. 2003. View Article : Google Scholar : PubMed/NCBI
|
|
26
|
Hsu T, Hingley-Wilson SM, Chen B, Chen M,
Dai AZ, Morin PM, Marks CB, Padiyar J, Goulding C, Gingery M, et
al: The primary mechanism of attenuation of bacillus
Calmette-Guerin is a loss of secreted lytic function required for
invasion of lung interstitial tissue. Proc Natl Acad Sci USA.
100:12420–12425. 2003. View Article : Google Scholar : PubMed/NCBI
|
|
27
|
Guinn KM, Hickey MJ, Mathur SK, Zakel KL,
Grotzke JE, Lewinsohn DM, Smith S and Sherman DR: Individual
RD1-region genes are required for export of ESAT-6/CFP-10 and for
virulence of Mycobacterium tuberculosis. Mol Microbiol. 51:359–370.
2004. View Article : Google Scholar : PubMed/NCBI
|
|
28
|
Stanley SA, Johndrow JE, Manzanillo P and
Cox JS: The type I IFN response to infection with Mycobacterium
tuberculosis requires ESX-1-mediated secretion and contributes to
pathogenesis. J Immunol. 178:3143–3152. 2007. View Article : Google Scholar : PubMed/NCBI
|
|
29
|
de Veer MJ, Holko M, Frevel M, Walker E,
Der S, Paranjape JM, Silverman RH and Williams BR: Functional
classification of interferon-stimulated genes identified using
microarrays. J Leukoc Biol. 69:912–920. 2001.PubMed/NCBI
|
|
30
|
Taylor KE and Mossman KL: Recent advances
in understanding viral evasion of type I interferon. Immunology.
138:190–197. 2013. View Article : Google Scholar :
|
|
31
|
Manca C, Tsenova L, Bergtold A, Freeman S,
Tovey M, Musser JM, Barry CE III, Freedman VH and Kaplan G:
Virulence of a Mycobacterium tuberculosis clinical isolate in mice
is determined by failure to induce Th1 type immunity and is
associated with induction of IFN-alpha/beta. Proc Natl Acad Sci
USA. 98:5752–5757. 2001. View Article : Google Scholar
|
|
32
|
Flynn JL and Chan J: What's good for the
host is good for the bug. Trends Microbiol. 13:98–102. 2005.
View Article : Google Scholar : PubMed/NCBI
|
|
33
|
Ordway D, Henao-Tamayo M, Harton M,
Palanisamy G, Troudt J, Shanley C, Basaraba RJ and Orme IM: The
hypervirulent Mycobacterium tuberculosis strain HN878 induces a
potent TH1 response followed by rapid down-regulation. J Immunol.
179:522–531. 2007. View Article : Google Scholar : PubMed/NCBI
|
|
34
|
Antonelli LR, Gigliotti Rothfuchs A,
Gonçalves R, Roffê E, Cheever AW, Bafica A, Salazar AM, Feng CG and
Sher A: Intranasal Poly-IC treatment exacerbates tuberculosis in
mice through the pulmonary recruitment of a pathogen-permissive
monocyte/macrophage population. J Clin Invest. 120:1674–1682. 2010.
View Article : Google Scholar : PubMed/NCBI
|
|
35
|
Berry MP, Graham CM, McNab FW, Xu Z, Bloch
SA, Oni T, Wilkinson KA, Banchereau R, Skinner J, Wilkinson RJ, et
al: An interferon-inducible neutrophil-driven blood transcriptional
signature in human tuberculosis. Nature. 466:973–977. 2010.
View Article : Google Scholar : PubMed/NCBI
|
|
36
|
Desvignes L, Wolf AJ and Ernst JD: Dynamic
roles of type I and type II IFNs in early infection with
Mycobacterium tuberculosis. J Immunol. 188:6205–6215. 2012.
View Article : Google Scholar : PubMed/NCBI
|
|
37
|
McNab FW, Ewbank J, Rajsbaum R,
Stavropoulos E, Martirosyan A, Redford PS, Wu X, Graham CM, Saraiva
M, Tsichlis P, et al: TPL-2-ERK1/2 signaling promotes host
resistance against intracellular bacterial infection by negative
regulation of type I IFN production. J Immunol. 191:1732–1743.
2013. View Article : Google Scholar : PubMed/NCBI
|
|
38
|
Dorhoi A, Yeremeev V, Nouailles G, Weiner
J III, Jörg S, Heinemann E, Oberbeck-Müller D, Knaul JK, Vogelzang
A, Reece ST, et al: Type I IFN signaling triggers immunopathology
in tuberculosis-susceptible mice by modulating lung phagocyte
dynamics. Eur J Immunol. 44:2380–2393. 2014. View Article : Google Scholar : PubMed/NCBI
|
|
39
|
Der SD, Zhou A, Williams BR and Silverman
RH: Identification of genes differentially regulated by interferon
alpha, beta, or gamma using oligonucleotide arrays. Proc Natl Acad
Sci USA. 95:15623–15628. 1998. View Article : Google Scholar : PubMed/NCBI
|
|
40
|
Chaussabel D, Semnani RT, McDowell MA,
Sacks D, Sher A and Nutman TB: Unique gene expression profiles of
human macrophages and dendritic cells to phylogenetically distinct
parasites. Blood. 102:672–681. 2003. View Article : Google Scholar : PubMed/NCBI
|
|
41
|
Hermann M and Bogunovic D: ISG15: In
sickness and in health. Trends Immunol. 38:79–93. 2017. View Article : Google Scholar
|
|
42
|
Chua PK, McCown MF, Rajyaguru S, Kular S,
Varma R, Symons J, Chiu SS, Cammack N and Nájera I: Modulation of
alpha interferon anti-hepatitis C virus activity by ISG15. J Gen
Virol. 90:2929–2939. 2009. View Article : Google Scholar : PubMed/NCBI
|
|
43
|
Zhang D and Zhang DE:
Interferon-stimulated gene 15 and the protein ISGylation system. J
Interferon Cytokine Res. 31:119–130. 2011. View Article : Google Scholar :
|
|
44
|
Speer SD, Li Z, Buta S, Payelle-Brogard B,
Qian L, Vigant F, Rubino E, Gardner TJ, Wedeking T, Hermann M, et
al: ISG15 deficiency and increased viral resistance in humans but
not mice. Nat Commun. 7:114962016. View Article : Google Scholar : PubMed/NCBI
|
|
45
|
Sooryanarain H, Rogers AJ, Cao D, Haac
MER, Karpe YA and Meng XJ: ISG15 modulates type I interferon
signaling and the antiviral response during Hepatitis E virus
replication. J Virol. 91:e00621–17. 2017. View Article : Google Scholar : PubMed/NCBI
|
|
46
|
Kimmey JM, Campbell JA, Weiss LA, Monte
KJ, Lenschow DJ and Stallings CL: The impact of ISGylation during
Mycobacterium tuberculosis infection in mice. Microbes Infect.
19:249–258. 2017. View Article : Google Scholar : PubMed/NCBI
|
|
47
|
Keller C, Hoffmann R, Lang R, Brandau S,
Hermann C and Ehlers S: Genetically determined susceptibility to
tuberculosis in mice causally involves accelerated and enhanced
recruitment of granulocytes. Infect Immun. 74:4295–4309. 2006.
View Article : Google Scholar : PubMed/NCBI
|
|
48
|
Sambarey A, Devaprasad A, Mohan A, Ahmed
A, Nayak S, Swaminathan S, D'Souza G, Jesuraj A, Dhar C, Babu S, et
al: Unbiased identification of blood-based biomarkers for pulmonary
tuberculosis by modeling and mining molecular interaction networks.
EBioMedicine. 15:112–126. 2017. View Article : Google Scholar : PubMed/NCBI
|
|
49
|
Sadler AJ and Williams BR:
Interferon-inducible antiviral effectors. Nat Rev Immunol.
8:559–568. 2008. View Article : Google Scholar : PubMed/NCBI
|
|
50
|
Hancks DC, Hartley MK, Hagan C, Clark NL
and Elde NC: Overlapping patterns of rapid evolution in the nucleic
acid sensors cGAS and OAS1 suggest a common mechanism of pathogen
antagonism and escape. PLoS Genet. 11:e10052032015. View Article : Google Scholar : PubMed/NCBI
|
|
51
|
Choi UY, Kang JS, Hwang YS and Kim YJ:
Oligoadenylate synthase-like (OASL) proteins: Dual functions and
associations with diseases. Exp Mol Med. 47:e1442015. View Article : Google Scholar : PubMed/NCBI
|
|
52
|
Lee MS, Kim B, Oh GT and Kim YJ: OASL1
inhibits translation of the type I interferon-regulating
transcription factor IRF7. Nat Immunol. 14:346–355. 2013.
View Article : Google Scholar : PubMed/NCBI
|
|
53
|
Lee MS, Park CH, Jeong YH, Kim YJ and Ha
SJ: Negative regulation of type I IFN expression by OASL1 permits
chronic viral infection and CD8(+) T-cell exhaustion. PLoS Pathog.
9:e10034782013. View Article : Google Scholar
|
|
54
|
de Toledo-Pinto TG, Ferreira AB,
Ribeiro-Alves M, Rodrigues LS, Batista-Silva LR, Silva BJ, Lemes
RM, Martinez AN, Sandoval FG, Alvarado-Arnez LE, et al:
STING-dependent 2′-5′ oligoadenylate synthetase-like production is
required for intracellular Mycobacterium leprae survival. J Infect
Dis. 214:311–320. 2016. View Article : Google Scholar : PubMed/NCBI
|
|
55
|
Leisching G, Pietersen RD, van Heerden C,
van Helden P, Wiid I and Baker B: RNAseq reveals
hypervirulence-specific host responses to M. tuberculosis
infection. Virulence. 8:848–858. 2017. View Article : Google Scholar :
|
|
56
|
Cheng Y and Schorey JS: Mycobacterium
tuberculosis-induced IFN-β production requires cytosolic DNA and
RNA sensing pathways. J Exp Med. 215:2919–2935. 2018. View Article : Google Scholar : PubMed/NCBI
|
|
57
|
Lin Y, Duan Z, Xu F, Zhang J, Shulgina MV
and Li F: Construction and analysis of the transcription
factor-microRNA co-regulatory network response to Mycobacterium
tuberculosis: A view from the blood. Am J Transl Res. 9:1962–1976.
2017.
|