Introduction
Recently, as one of the most dominant platforms to
spatiotemporally resolve protein interaction networks in living
cells (1), refine existing
protein-protein interaction networks (2), identify potential therapeutic target
(3) and distinguish new protein
therapeutics (4), mass
spectrometry (MS)-based proteomics is characterized by its ability
to present detailed information of protein intensities. It can thus
provide a more comprehensive landscape of cellular process and
enable network-centered investigations (5). Therefore, MS-based proteomics has
emerged as a dominant tool in the field of biomarker investigations
for various diseases. Due to the distinguishing characteristics,
label-free proteome quantification (LFQ) has become increasingly
investigated, and has been widely applied to the protein biomarker
investigations for coronary artery disease.
According to its molecular biology, coronary artery
disease can be defined as a group of thousands of proteins that
collectively alter cellular processes and result in the
characteristic remodeling of the local coronary artery environment.
Therefore, to achieve the early diagnosis of coronary artery
disease, and to interfere with the coronary artery disease process
before clinical consequences appear, it is essential to identify
the unique patterns and dynamic characteristics of coronary
arterial protein networks that consist of the molecular signatures
of normal and atherosclerotic coronary arterial tissues.
Previous studies have presented characteristics of
the human coronary arterial proteome in autopsied young adults
(6), and paraformaldehyde-fixed,
paraffin-embedded and frozen coronary arteries (7); limited numbers of global human
coronary arterial tree samples with various grade atherosclerosis
have been investigated. To the best of our knowledge, comprehensive
studies on the proteins associated with coronary artery disease
have not yet been published. Therefore, a label-free proteome
quantification technology-based landscape study of the proteomics
characteristics of human coronary atherosclerosis was performed in
the present study, in order to characterize human coronary arterial
proteomics, and to investigate the proteins, networks and pathways
most significantly associated with human coronary arterial
atherosclerotic lesions.
Subjects and methods
Study subjects
The coronary artery samples were obtained from 2
autopsy cases from the Department of Human Anatomy in Nanjing
Medical University. Informed consent from the bereaved family was
obtained for the research use only of the samples and the autopsy
was performed according to the guidelines of the university. The
methods were performed in accordance with the approved guidelines,
and all experimental protocols were approved by the Ethics
Committee of Nanjing Medical University and the First Affiliated
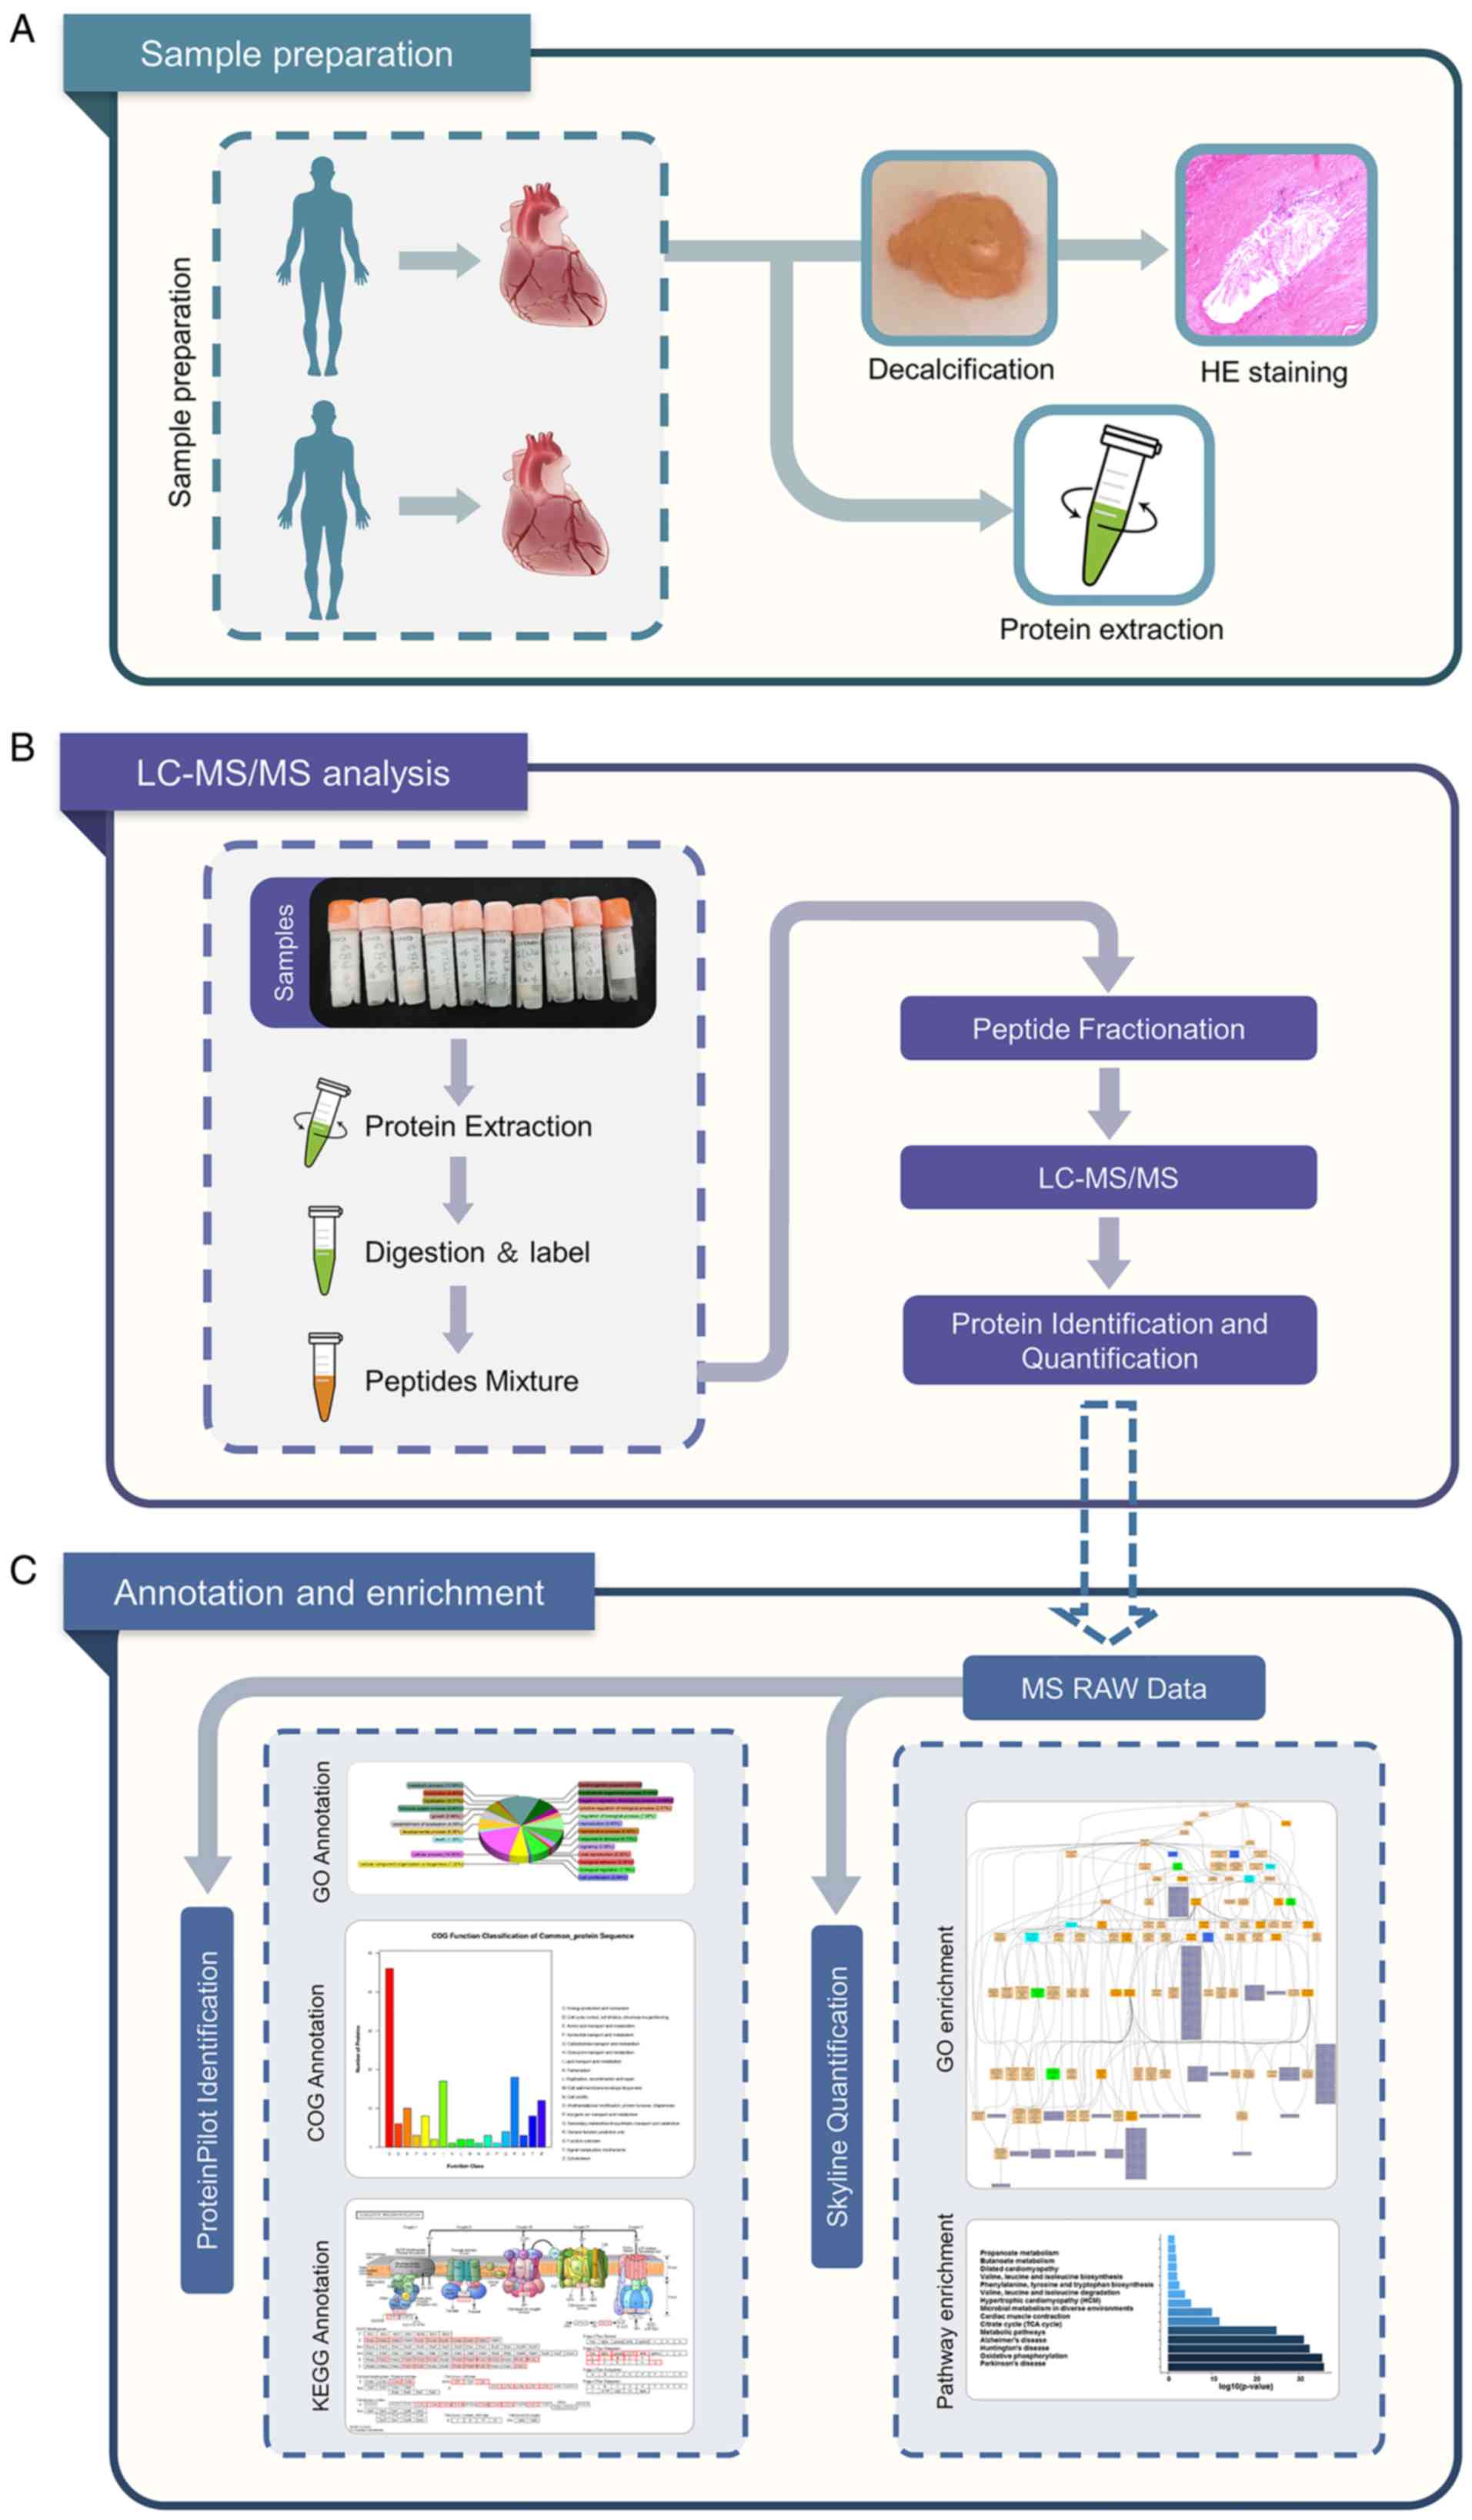
Hospital of Nanjing Medical University. The experimental design and
schematic roadmap of the present study is presented in Fig. 1.
Preparation of coronary artery
segments
The present study included 2 autopsies performed in
2018 at the Department of Human Anatomy at Nanjing Medical
University. The age of the patients was 64 and 69 years, and both
were male. The postmortem delay varied between 1 and 2 days. During
the autopsy, epicardial coronary arteries were removed from the
hearts. The epicardial coronary artery of each autopsy was divided
into 10 segments as follows: The proximal segment, midsegment and
distal segment of the left anterior descending (LAD), proximal
segment, midsegment and distal segment of the left circumflex
(LCX), proximal segment, midsegment and distal segment of the right
coronary artery (RCA) and the left main trunk (LM). Each coronary
artery segment was divided into 2 groups as follows: The protein
group and the pathological group. The segments at a thickness of 5
mm in the protein group were snap-frozen in liquid nitrogen and
stored at −80°C for protein extraction. In addition, the segments
at a thickness of 5 mm in the pathological group were fixed
overnight in 10% formalin and embedded in paraffin for histological
analysis following decalcification in ethylene diamine tetraacetic
acid (EDTA) decalcification fluid (Beijing Solarbio Science &
Technology Co., Ltd.) for approximately 2 weeks.
Pathological analysis
Following decalcification with EDTA decalcification
fluid (Beijing Solarbio Science & Technology Co., Ltd.) for ~2
weeks, the coronary artery segments in the pathological group were
fixed overnight in 10% formalin and processed for paraffin
embedding: Longitudinal 5-µm-thick consecutive sections were
obtained using a rotary microtome (Leica RM2235; Leica Biosystems
Nussloch GmbH) and stained with hematoxylin and eosin (H&E) in
order to observe the morphology. Each slide was examined using a
steromicroscope 10X (Leica DM2500; Leica Microsystems) at ×5 and
×20 magnification and digitized using an image analysis system
(Leica LAS; Leica Microsystems).
The coronary atherosclerosis grade and extent of the
coronary artery segments were analyzed by independent pathologists
who graded the samples based on the American Heart Association
(AHA) classification guidelines (8).
Protein extraction and LC-MS/MS
analysis
Coronary artery segment
A total of 100 mg of each coronary artery sample was
obtained for the extraction experiment. Coronary artery samples
were ground in liquid nitrogen and transferred to a centrifuge
tube. A total of 600 µl of L3 lysis buffer (7 M urea, 2 M
thiourea, 40 mM Tris-HCl) was added to make a final concentration
with 1 mM phenylmethanesulfonyl fluoride (PMSF), 2 mM EDTA and 10
mM DL-Dithiothreitol (DTT). The solution was mixed with a pipette
and ultrasonically treated on ice for 15 min (2 sec/3 sec); and
then centrifuged at 20,000 × g at 4°C for 20 min. The supernatant
was then added to 4 times the volume of cold acetone, yielding a
final concentration up to 30 mM DTT. This solution was precipitated
at −20°C for 2 h; it was then centrifuged at 20,000 × g at 4°C for
20 min. The supernatant was discarded, and 1 ml of cold acetone was
added to the precipitate, yielding a final concentration of 10 mM
DTT. The precipitate was completely crushed, vortexed, allowed to
stand at −20°C for 30 min, centrifuged at 20,000 × g for 20 min,
and the supernatant was then discarded. Subsequently, 100-600
µl U2 lysis buffer (8 M Urea, 10 mM EDTA) were added, and
the solution was ultrasonically treated on ice for 5 min (2 sec/3
sec), and then centrifuged at 20,000 × g for 20 min at 4°C. The
supernatant was then removed. The protein concentration was
determined using the Bradford method.
Protein quantification
A total of 2 µl of the protein sample was
obtained, diluted to the appropriate amount, and the protein
concentration was subsequently determined using the Bradford method
as follows: A total of 0.02 µg/µl of bovine serum
albumin (BSA) was configured to a standard 2 ml. Subsequently, 0,
20, 40, 60, 80, 100, 120, 140, 160, 180 and 200 µl were
added to a new 1.5 ml EP tube, and the diluent was added. Up to 200
µl was added and mixed. Subsequently, 20 µl of the
diluted BSA solution were placed into the micro-plate, with 3
replicate wells for each concentration. A total of 20 µl of
the diluted protein sample was added to the plate, and 3 replicate
wells were set for each sample. This was followed by the addition
of 180 µl of G250 color solution to each well and incubation
for 5 min at room temperature. The A595 absorbance value was
measured with a microplate reader (SM600, Shanghai Utrao Medical
Instrument Co., Ltd.). The concentration of the protein sample was
calculated from the standard curve and the dilution factor of the
protein sample.
Reductive alkylation
For each coronary artery sample, 500 µg of
total protein were added to 200 µl U2 lysis buffer, with 1%
of the volume of 1 M DTT, kept in a water bath at 56°C for 30 min,
and the temperature was then rapidly returned to room temperature
by placing the solution on ice. Subsequently, 10% of the volume of
0.55 M iodoacetamide (IAM) was established, and kept in the dark at
room temperature for 30 min. A total of 4 times the volume of cold
acetone was then added, as well as the final concentration of 10 mM
DTT, and the samples were then precipitated at −20°C for 2 h. The
samples were then centrifuged at 2,000 × g for 20 min at 4°C, the
supernatant was discarded and 1 ml of cold acetone was added, as
well as DTT at the final concentration of 10 mM. The precipitate
was mashed, vortexed, lapsed at −20°C for 30 min, and centrifuged
at 20,000 × g for 20 min, before discarding the supernatant. The
precipitate was air-dried, 300 µl U2 lysis buffer were
added, sonicated for 5 min (2 sec/3 sec) and centrifuged at 20,000
x g for 20 min at 4°C. The supernatant was obtained, and the
protein concentration was determined via the Bradford method.
Protein digestion
The supernatant from each sample, containing
precisely 100 µg of protein was digested with Trypsin Gold
(Promega) at a 1:50 enzyme-to-substrate ratio. After 16 h of
digestion at 37°C, peptides were desalted with C18 cartridge to
remove the high urea, and desalted peptides were dried by vacuum
centrifugation at 4°C and 1,000 × g for 3 h.
LC-MS/MS analysis
All protein samples were analyzed using Q Exactive
mass spectrometer (Thermo Fisher Scientific, Inc.) coupled with the
Easy-nLC 1200 UHPLC system (Thermo Fisher Scientific, Inc.). A
sample volume containing 2 µg of total peptides was injected
onto a home-made C18 trap column (5 µm, 100 µm × 20
mm), and eluted at 300 nl/min onto a C18 analytical column (3
µm, 75 µm × 150 mm) with a 120 min gradient. A binary
mobile phase system of buffer A (2% acetonitrile/0.1% formic
acid/98% H2O) and buffer B (98% acetonitrile/0.1% formic
acid/2% H2O) was used. The 120 min solvent gradient
listed as follows: 5% B, 5 min; 5-25% B, 85 min; 25-35% B, 10 min;
35-80% B, 10 min; 80% B, 5 min; 80-5%, 1 min; 5%, 4 min. The LC was
interfaced to a Q-Exactive quadrupole Orbitrap mass spectrometer
(Thermo Fisher Scientific, Inc.) via nano-electrospray ionization
using an Easy Spray source with an integrated column heater set at
50°C. An electrospray voltage of 2.2 kV was applied. The mass
spectrometer was programmed to acquire, by data-dependent
acquisition, tandem mass spectra from the top 20 ions in the full
scan from 400 to 1200 m/z. Dynamic exclusion was set to 15 sec,
singly-charged ions were excluded, isolation width was set to 1.6
Da, full MS resolution to 70,000 and MS/MS resolution to 17,500.
Normalized collision energy was set to 25, automatic gain control
to 1e6, max fill of MS to 20 msec, max fill MS/MS to 60 msec, and
the underfill ratio to 0.1%.
Processing of mass spectrometry
spectra by MaxQuant
The resulting MS/MS data were processed using
Maxquant search engine (v.1.5.2.8). Tandem mass spectra were
searched against the UniProt Homo_sapiens protein database
(https://www.uniprot.org/) concatenated with the
reverse decoy database. Trypsin/P was specified as cleavage enzyme
allowing up to 4 missing cleavages. The mass tolerance for
precursor ions was set as 20 ppm in First search and 5 ppm in Main
search, and the mass tolerance for fragment ions was set as 0.02
Da. The carbamidomethylation of cysteine was considered as a fixed
modification and oxidation of methionine, acetylation of the
N-terminus, and the deamidation of asparagine or glutamine as
variable modifications. The label-free quantification method was
LFQ, FDR was adjusted to <1% and the minimum score for modified
peptides was set >40.
For protein identification, protein with at least 1
unique peptide was identified at FDR <1.0% on the peptide and
protein level, respectively. Proteins containing similar peptides
and that could not be distinguished based on MS/MS analysis were
grouped separately as protein groups. Precursor quantification
based on intensity was used for label-free quantification. The
significant ratios, defined as fold change (FC) ≥1.5 or FC ≤0.67,
were used to screen the differentially expressed proteins (DEPs)
(9).
Bioinformatics and annotations
In order to determine the biological and functional
properties of all identified proteins, the Gene Ontology (GO) Terms
(http://geneontology.org/) were used to describe
the properties of genes and gene products in organisms. To this
end, homology searches were first performed on all identified
sequences using the local NCBI blastp program for the NCBInr animal
database in the present study. The e value was set to be <1e-5,
and the best hit for each query sequence takes into account the GO
term match. GO term matching was performed using blast2go v4.5.
Functional annotation of genes from the new genome and studies of
genome evolution were investigated using the orthologous protein
system population [Clusters of Orthologous Groups of proteins
(COGs) database; http://www.ncbi.nlm.nih.gov/COG/)]. The Kyoto
Encyclopedia of Genes and Genomes (KEGG) is the main public
database on pathways (https://www.kegg.jp/), and pathway analyses identify
the most important biochemical metabolic pathways and signal
transduction pathways involved with each protein. In order to
identify candidate biomarkers, the present study used
hypergeometric testing for GO enrichment and KEGG pathway
enrichment.
Results
Natural history and histological
classification of atherosclerotic lesions of the coronary artery
samples
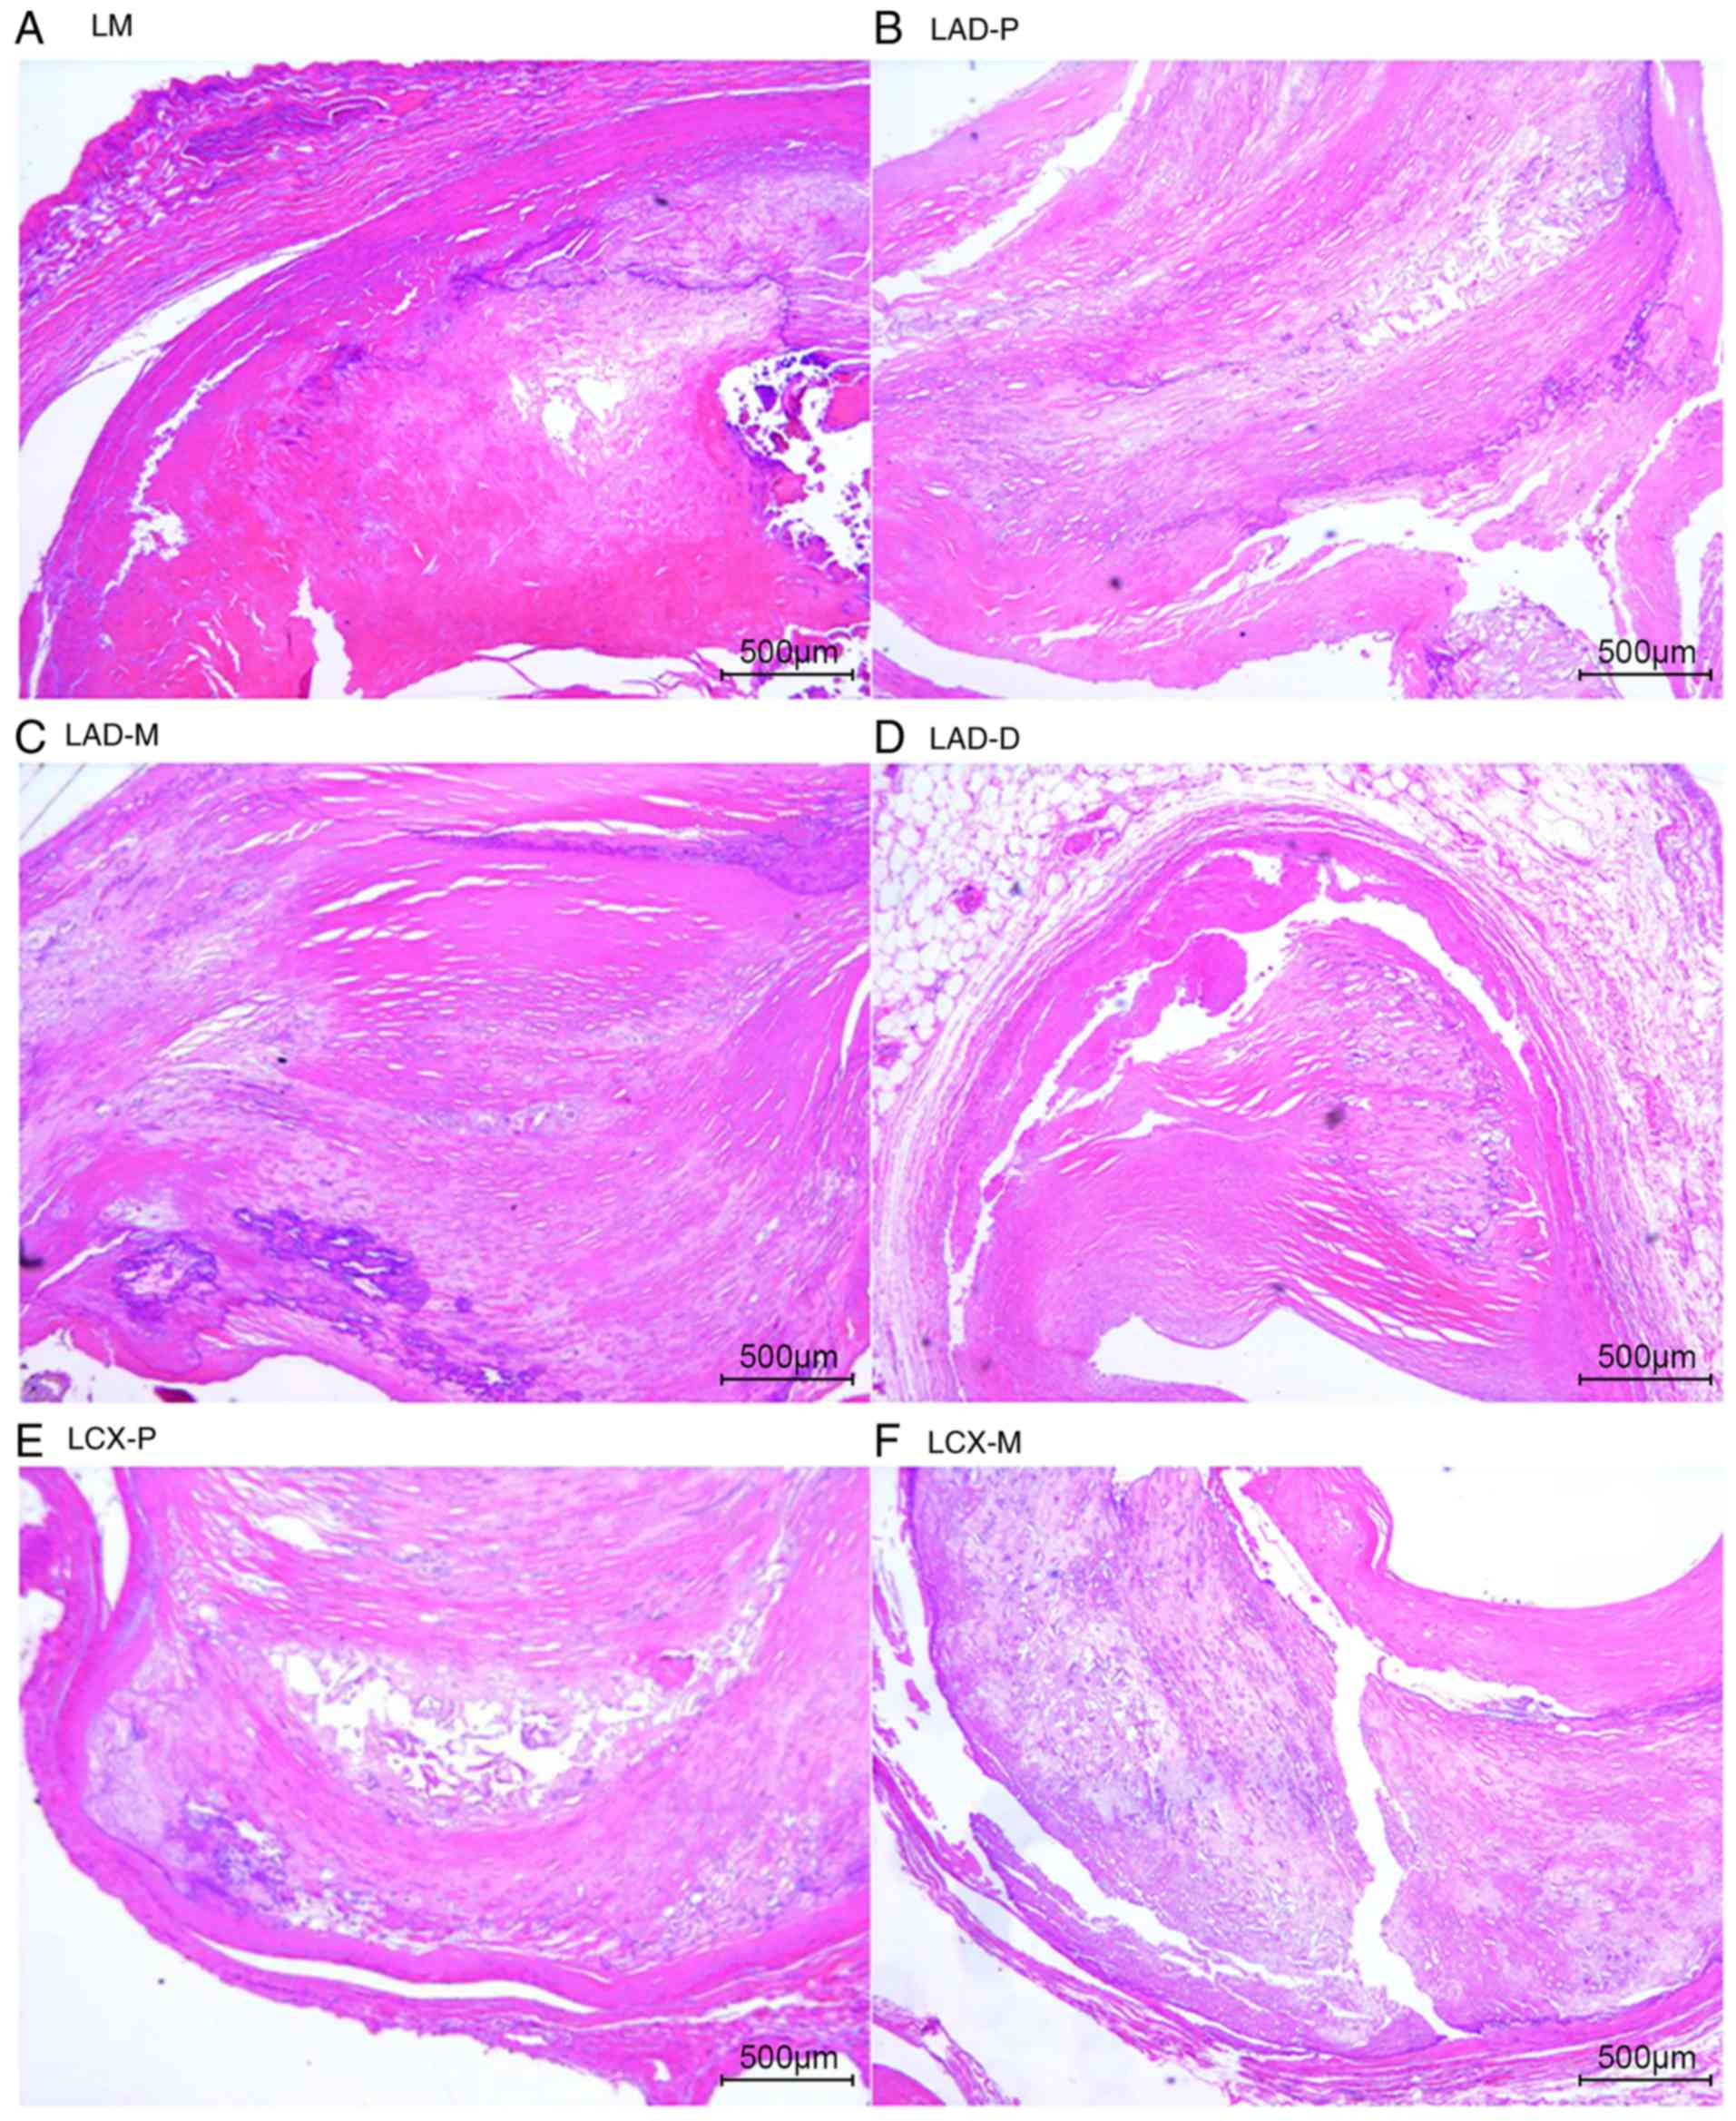
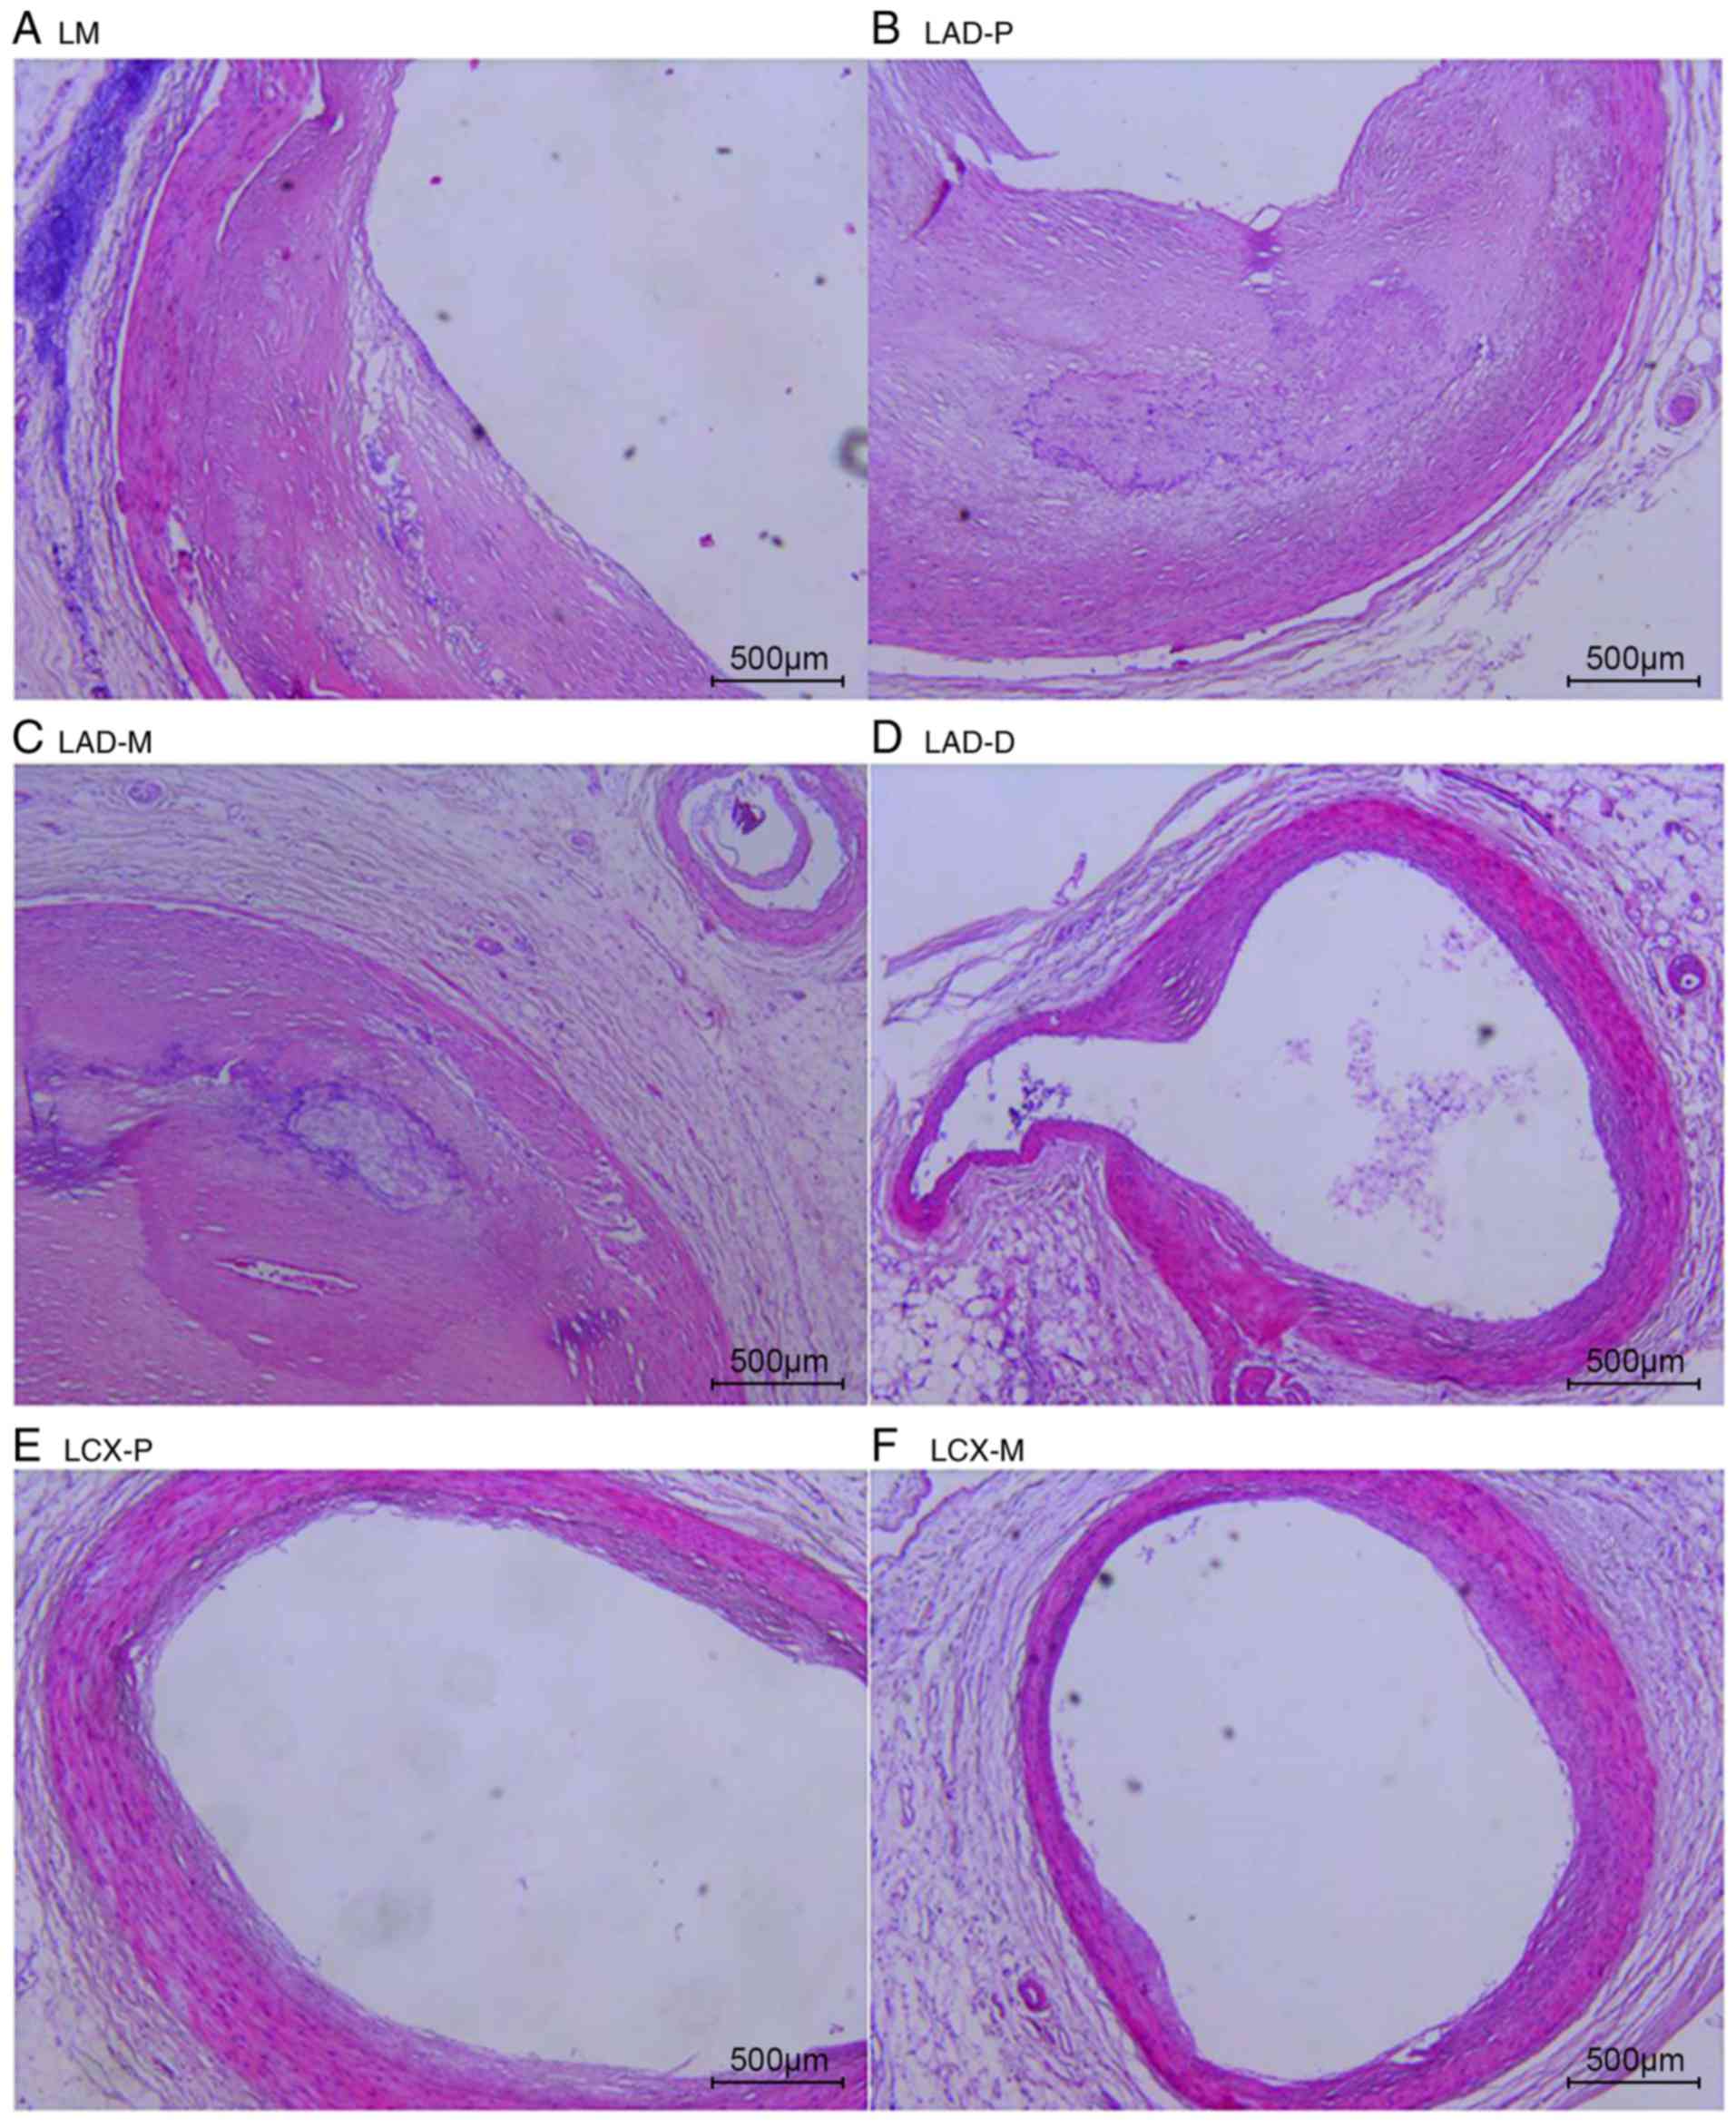
The natural history and histological classification
of atherosclerotic lesions of the coronary artery samples were
analyzed by H&E staining in the present study, and the results
are presented in Table I and
Figs. 2 and 3.
 | Table INatural history and histological
classification of atherosclerotic lesions of the coronary artery
samples. |
Table I
Natural history and histological
classification of atherosclerotic lesions of the coronary artery
samples.
| A, Case 1 |
|---|
| Age (years) | Sex | LM | LAD-P | LAD-M | LAD-D LC | X-P | LCX-M | LCX-D RC | A-P | RCA-M | RCA-D |
|
| Grade | 64 | Male | 3 | 4 | 3 | 4 | 4 | 4 | 3 | 4 | 4 | 4 |
| Stage | | | 4 | 3 | 3 | 3 | 4 | 3 | 3 | 4 | 3 | 3 |
|
B, Case 2
|
| Age (years) | Sex | LM | LAD-P | LAD-M | LAD-D LC | X-P | LCX-M | LCX-D RC | A-P | RCA-M | RCA-D |
|
| Grade | 69 | Male | 3 | 3 | 3 | 1 | 1 | 1 | 1 | 1 | 3 | 1 |
| Stage | | | 3 | 3 | 3 | 0 | 0 | 1 | 1 | 2 | 3 | 1 |
The analysis of the H&E staining indicated that
the atherosclerotic lesions were observed in the coronary artery
segments in both cases. However, the coronary atherosclerosis grade
and extent in case 1 were more serious than those in case 2. All of
the examined coronary segments in case 1 revealed atherosclerotic
changes of the intima, ranging from lesions classifiable as
atherosclerotic tunica intima to secondary affection tunica intima,
and stenosis from 51-100%. In addition, atherosclerotic changes of
normal tunica intima, fatty streak tunica intima, fibrous plaques
tunica intima and atherosclerotic tunica intima were observed in
the coronary segments of case 2, with coronary stenosis from
0-75%.
Global analysis of coronary artery
proteomics identifies proteins
The results of the global analysis of coronary
artery proteomics are presented in Table II. Based on strict quality
control and procedure criteria, a definite total of 515,061
spectrums, 21,703 peptides and 2,135 proteins were identified in
the 20 coronary artery segments samples with repeated items
removed, including 236,069 spectrums, 15,719 peptides and 1,835
proteins present in the 10 coronary artery segment samples of case
1, and 278,992 spectrums, 18,362 peptides and 2,046 proteins
present in the 10 coronary artery segment samples of case 2.
| Table IIGlobal analysis of coronary artery
proteomics identifies proteins. |
Table II
Global analysis of coronary artery
proteomics identifies proteins.
| Type | Spectrum | Peptides | Proteins |
|---|
| ALL_combined | 515,061 | 21,703 | 2,135 |
| Case 1 | 236,069 | 15,719 | 1,835 |
| Case 2 | 278,992 | 18,362 | 2,046 |
| LAD-D | 26,095 | 8,595 | 1,399 |
| LAD-D-2 | 25,976 | 7,831 | 1,279 |
| LAD-M | 23,247 | 7,940 | 1,227 |
| LAD-M-2 | 25,730 | 7,845 | 1,331 |
| LAD-P | 22,443 | 6,629 | 1,068 |
| LAD-P-2 | 28,156 | 8,638 | 1,357 |
| LCX-D | 19,319 | 6,523 | 969 |
| LCX-D-2 | 25,524 | 7,653 | 1,374 |
| LCX-M | 27,142 | 8,678 | 1,339 |
| LCX-M-2 | 26,934 | 7,943 | 1,404 |
| LCX-P | 21,642 | 7,814 | 1,197 |
| LCX-P-2 | 31,737 | 10,727 | 1,396 |
| LM | 25,468 | 8,073 | 1,294 |
| LM-2 | 27,092 | 8,323 | 1,328 |
| RCA-D | 22,635 | 7,537 | 1,123 |
| RCA-D-2 | 26,169 | 7,971 | 1,318 |
| RCA-M | 24,236 | 7,673 | 1,181 |
| RCA-M-2 | 31,845 | 10,615 | 1,486 |
| RCA-P | 23,842 | 7,494 | 1,257 |
Characteristics distribution of the
identified results
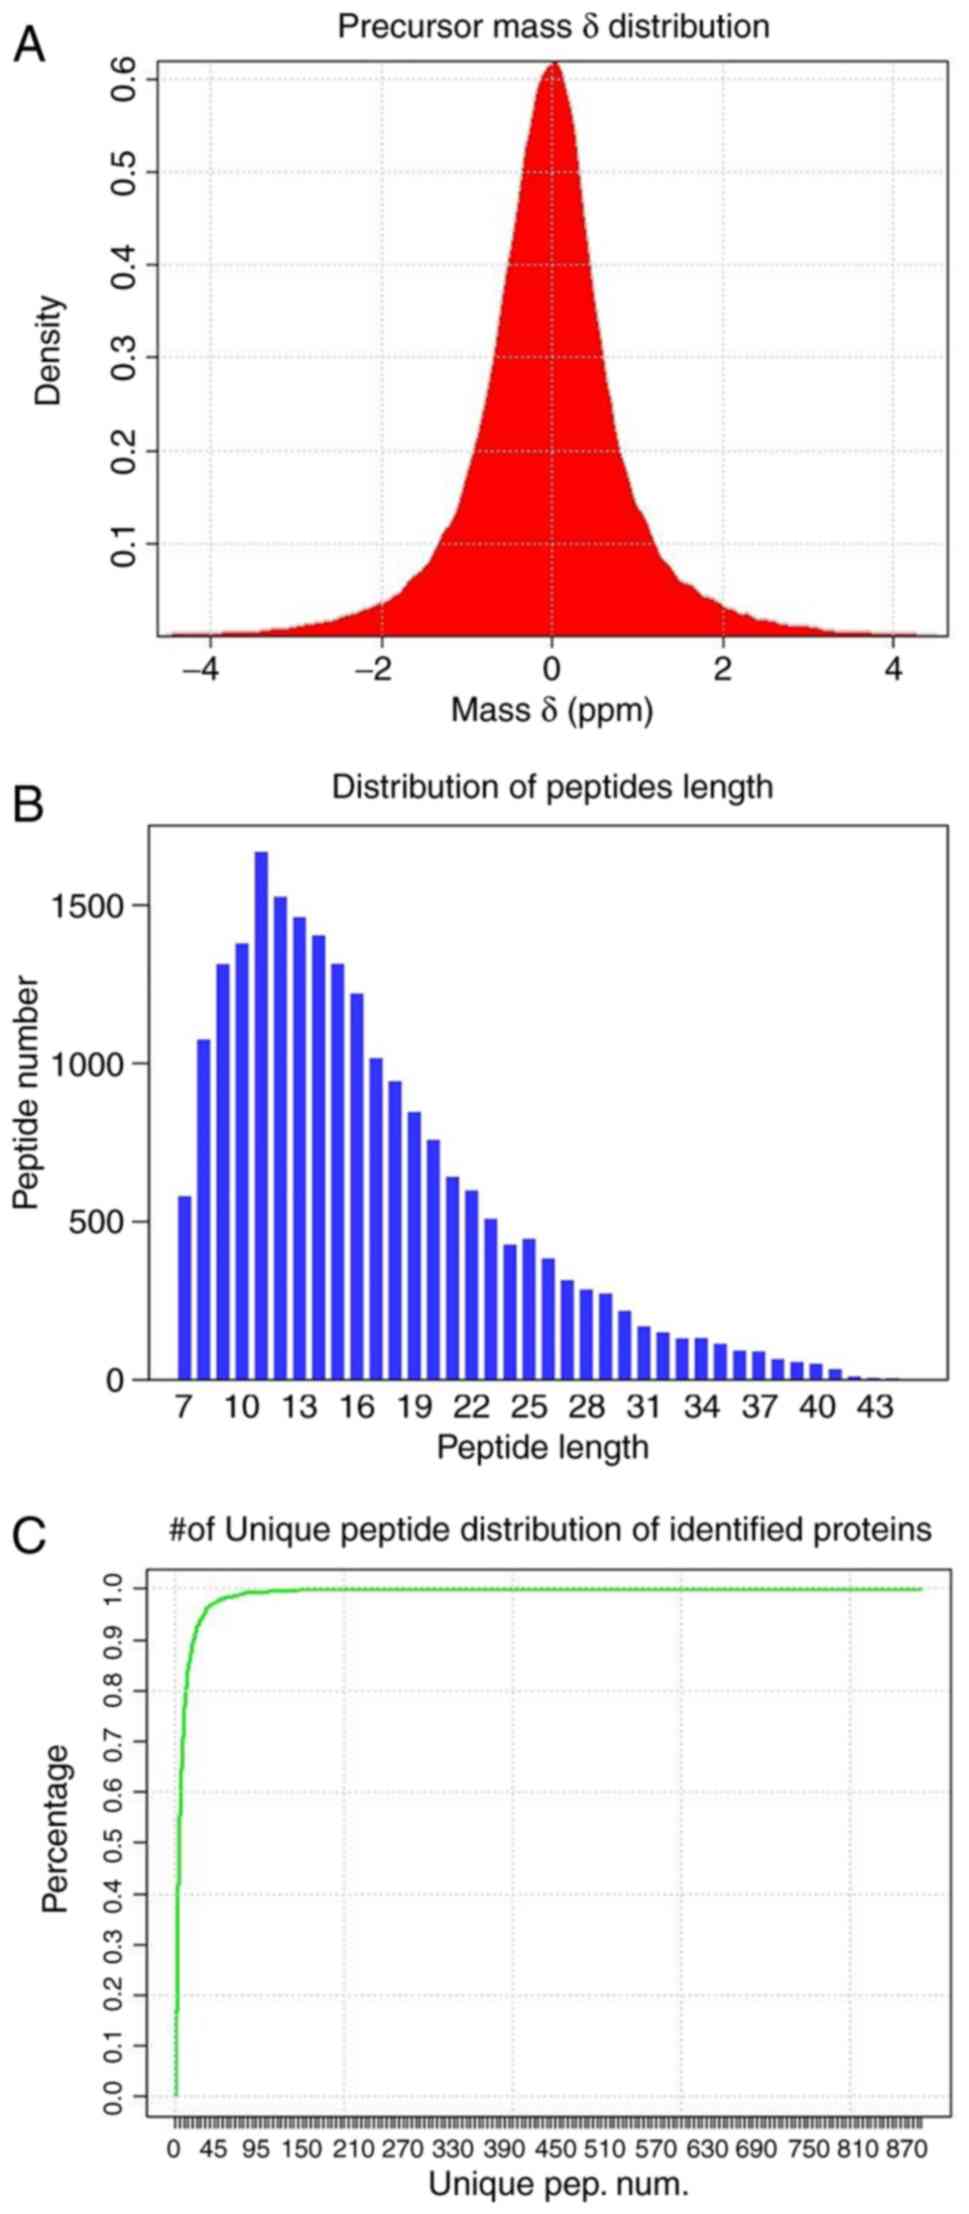
The distributions of precursors mass δ, peptide
length and number of unique peptides of identified proteins
(Fig. 4) were employed to
estimate the accuracy and reliability of the identification
results. The mass δ of peptide segment precursors is basically
distributed in the range of ±0.1 Da, and the identified results
achieving high accuracy are presented in Fig. 4A. Furthermore, the length
distribution of peptide segments (Fig. 4B) demonstrates that the length of
the majority of the identified peptide segments is concentrated in
the range of 8-22, which is consistent with the molecular weight
range recognized by a mass spectrometer (400-1,200).
A unique peptide segment is defined as a peptide
that exists in only one protein group. The existence of the
corresponding protein can be determined by the existence of the
unique peptide segment, and the distribution of the number of
unique peptide segments in all proteins identified in the present
study is presented in Fig.
4C.
Analysis of the association of protein
expression abundance with the histological classification of
atherosclerotic lesions of the coronary artery samples
In the present study, the identification and
quantification of proteins were performed using MaxQuant software
(10). The identification
criteria of significantly different proteins were a fold change
(FC) ≥1.5 or FC ≤0.67. The present study only considered identified
proteins to be abundantly differentially expressed between coronary
artery segment samples when they met the aforementioned criteria.
Comparisons of the identification and quantification of proteins
under study are presented in Table
III where, in each group, the expression abundance between
significantly different proteins for those identified and
quantified is shown.
| Table IIIAnalysis of protein expression
abundance association with histological classification of
atherosclerotic lesions of coronary artery. |
Table III
Analysis of protein expression
abundance association with histological classification of
atherosclerotic lesions of coronary artery.
| Type | sig. diff Num. | sig. UP num. | sig. DOWN num. |
|---|
| Stage 1/Stage
0 | 390 | 174 | 216 |
| Stage 2/Stage
0 | 413 | 156 | 257 |
| Stage 3/Stage
0 | 344 | 120 | 224 |
| Stage 4/Stage
0 | 414 | 125 | 289 |
| Stage 4, 3, 2,
1/Stage 0 | 174 | - | - |
According to these criteria, 390 proteins were
abundantly differentially expressed between the fatty streak tunica
intima and normal tunica intima groups. Compared with the normal
tunica intima group, 257 proteins were observed as down-regulated
in the fibrous plaques tunica intima group, while 156 were
determined to be upregulated. When comparing the atherosclerotic
tunica intima, secondary affection tunica intima groups with normal
tunica intima groups, the number of dysregulated proteins was 344
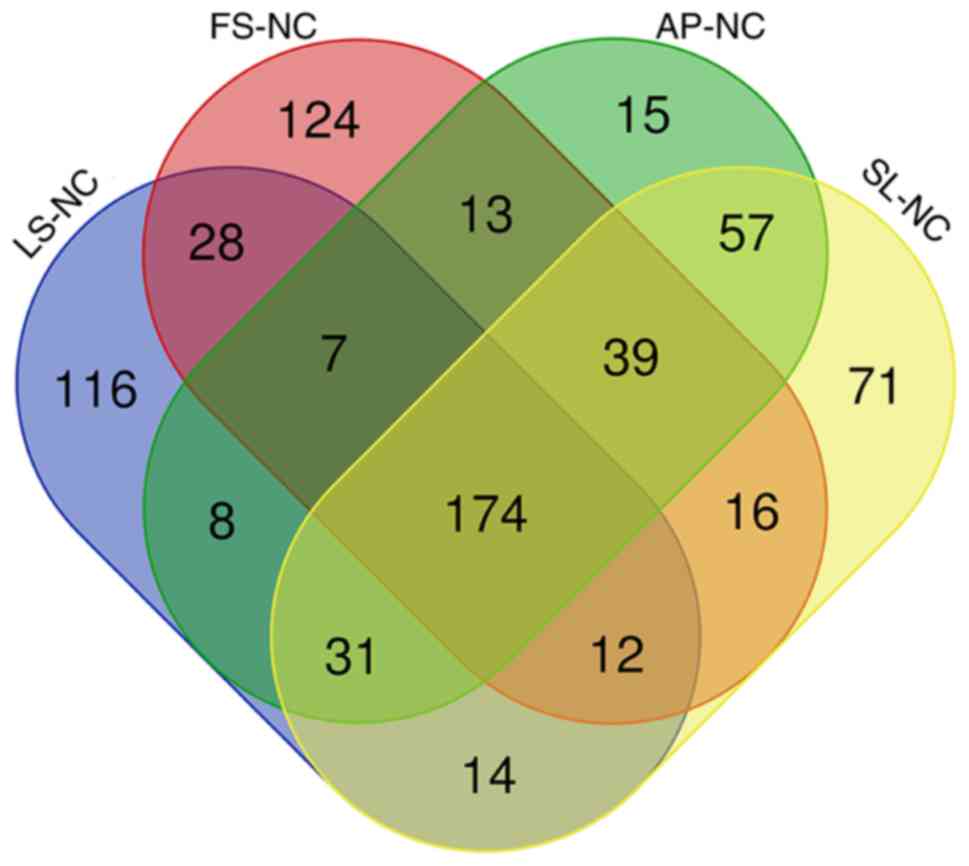
and 414, respectively. The most significant proteins of the whole
integrated data were obtained through the intersection of the
aforementioned four comparison sets, and the intersection revealed
that a total of 174 proteins, including 4 upregulated [P54687
(BCAT1_HUMAN), Q06033 (ITIH3_HUMAN), Q13576 (IQGA2_HUMAN), Q96IY4
(CBPB2_HUMAN)] and 164 downregulated proteins (excluding 6 proteins
with inconsistent expression tendencies), were obtained after
comparing the fatty streak tunica intima, fibrous plaques tunica
intima, atherosclerotic tunica intima and secondary affection
tunica intima groups with the normal tunica intima groups. A Venn
diagram analyzed the results of the distribution of shared
differentially expressed protein families among multiple sets of
comparisons, as presented in Fig.
5.
GO, COG and KEGG annotation of the
differentially expressed proteins
In order to further investigate the biological and
functional properties of all differentially expressed proteins, the
present study used the GO annotation, COG annotation and KEGG
annotation to analyze the differentially expressed proteins. The
annotation results are presented in Fig. 6.
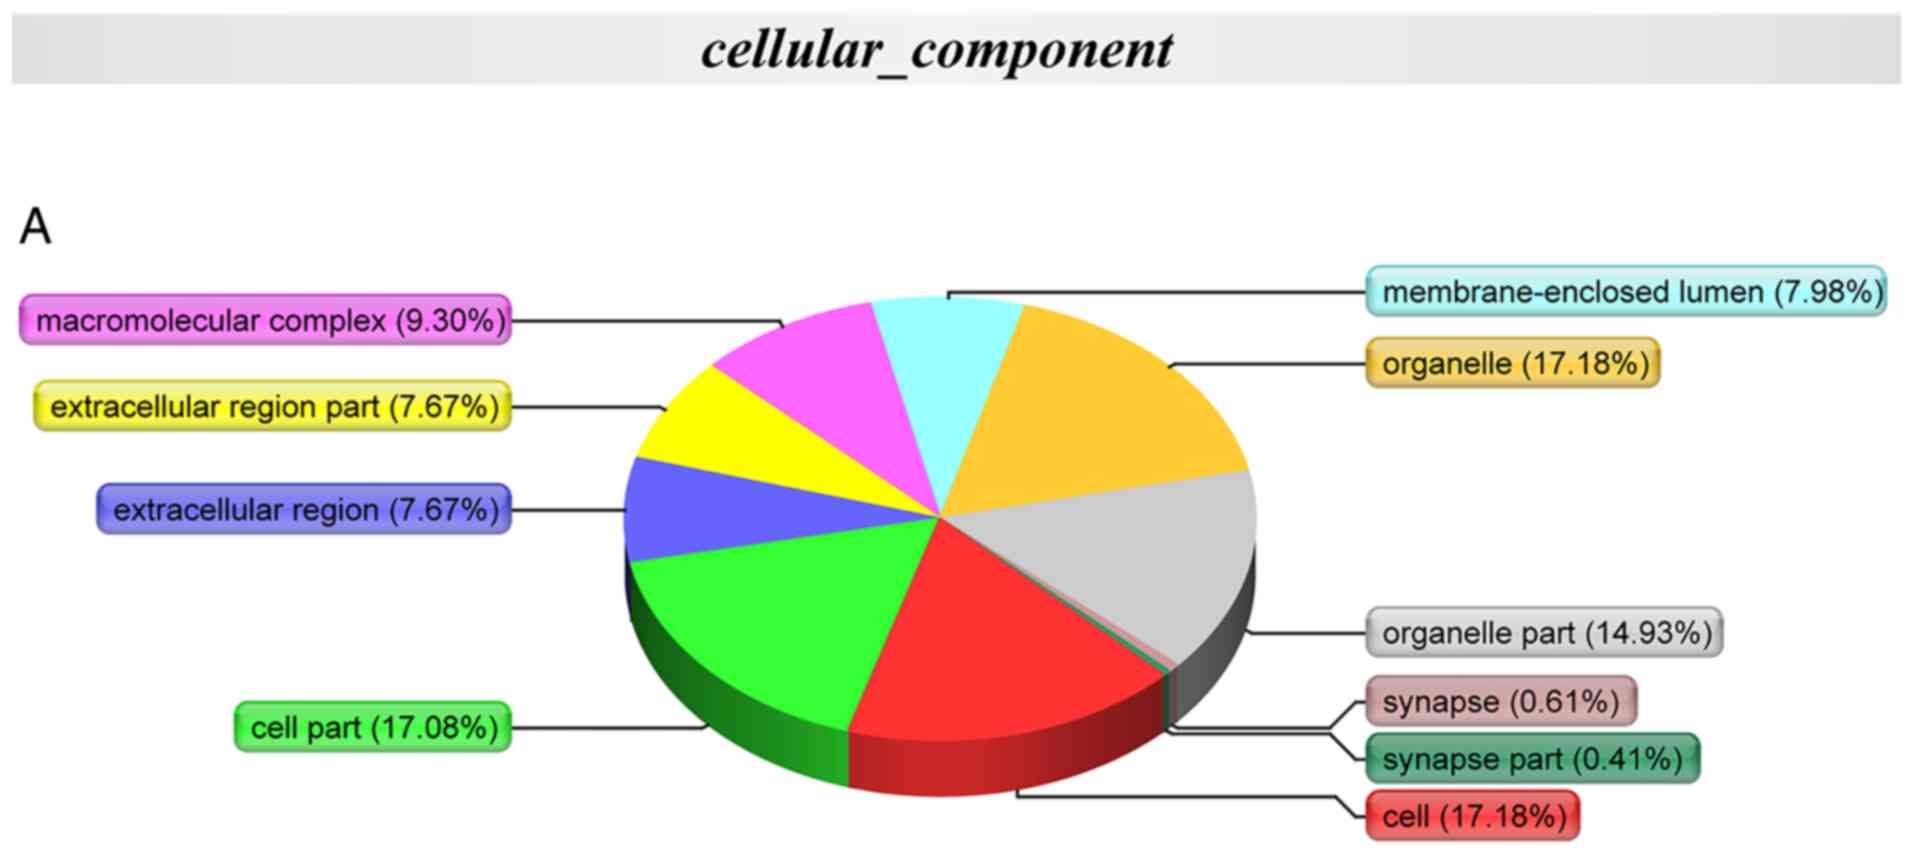 | Figure 6GO, COG and KEGG annotation of the
differentially expressed proteins. (A) Cellular compartment
annotation analysis: Organelle (17.18%), cell (17.18%), cell part
(17.08%) and organelle part (14.93%); (B) molecular function
annotation analysis: Binding (41.47%), catalytic activity (33.24%),
transporter activity (9.41%) and structural molecular activity
(7.06%); (C) biological process annotation analysis: Cellular
process (16.95%), metabolic process (15.99%), biological regulation
(7.78%) and multicellular organismal process (7.14%). (D) COG
functional annotation analysis: Energy production and conversion,
general function prediction only, lipid transport and metabolism
and cytoskeleton. GO, Gene Ontology; COG, Clusters of Orthologous
Groups of proteins (COG); KEGG, Kyoto Encyclopedia of Genes and
Genomes. |
GO annotation with respect to the 174 differentially
expressed proteins in the coronary artery samples demonstrated that
the cellular component of these proteins was predominantly derived
from the organelle (17.18%), cell (17.18%), cell part (17.08%) and
organelle part (14.93%) (Fig.
6A). Furthermore, the molecular function of these proteins
primarily included binding (41.47%), catalytic activity (33.24%),
transporter activity (9.41%) and structural molecular activity
(7.06%) (Fig. 6B). In addition,
the biological process that these proteins predominantly
participated in included the cellular process (16.95%), metabolic
process (15.99%), biological regulation (7.78%) and multicellular
organismal process (7.14%) (Fig.
6C). The results demonstrated that these COG functions,
including energy production and conversion, general function
prediction only, lipid transport and metabolism, and cytoskeleton
were primarily enriched in the differentially expressed proteins
(Fig. 6D). KEGG pathway
annotation indicated that these proteins were enriched in metabolic
pathways (54.04%), Huntington's disease (32.92%), Parkinson's
disease (32.3%), oxidative phosphorylation (31.06%) (Fig. S1), Alzheimer's disease (29.81%)
and microbial metabolism in diverse environments (15.53%) signaling
pathways (Table IV).
| Table IVKEGG annotation of the differentially
expressed proteins. |
Table IV
KEGG annotation of the differentially
expressed proteins.
| Pathway | Different proteins
with pathway annotation (n=161) (%) | Pathway ID |
|---|
| Metabolic
pathways | 87 (54.04) | ko01100 |
| Huntington's
disease | 53 (32.92) | ko05016 |
| Parkinson's
disease | 52 (32.3) | ko05012 |
| Oxidative
phosphorylation | 50 (31.06) | ko00190 |
| Alzheimer's
disease | 48 (29.81) | ko05010 |
| Microbial
metabolism in diverse environments | 25 (15.53) | ko01120 |
| Cardiac muscle
contraction | 22 (13.66) | ko04260 |
| Citrate cycle (TCA
cycle) | 17 (10.56) | ko00020 |
| Dilated
cardiomyopathy | 16 (9.94) | ko05414 |
| Hypertrophic
cardiomyopathy | 16 (9.94) | ko05410 |
| Focal adhesion | 11 (6.83) | ko04510 |
| Regulation of actin
cytoskeleton | 10 (6.21) | ko04810 |
| Valine, leucine and
isoleucine degradation | 10 (6.21) | ko00280 |
| Arrhythmogenic
right ventricular cardiomyopathy | 8 (4.97) | ko05412 |
| Calcium signaling
pathway | 7 (4.35) | ko04020 |
GO and KEGG enrichment of the
differentially expressed proteins
Cellular component analysis from the GO terms
indicated that the differentially expressed proteins were mainly
located in the mitochondrion, mitochondrial matrix, mitochondrial
intermembrane, mitochondrial intermembrane space, mitochondrial
inner membrane, mitochondrial outer membrane and mitochondrial
respiratory chain complex I (Fig.
S2). The GO terms for biological processes included respiratory
electron transport chain, tricarboxylic acid cycle, mitochondrial
electron transport NADH to ubiquinone and mitochondrial ATP
synthesis coupled proton transport (Fig. S3). Several GO terms for molecular
functions, including NADH dehydrogenase activity, NADH
dehydrogenase (ubiquinone) activity, NADH dehydrogenase (quinone)
activity, oxidoreductase activity acting on NADH or NADPH, and
quinone or similar compound as acceptor were significantly enriched
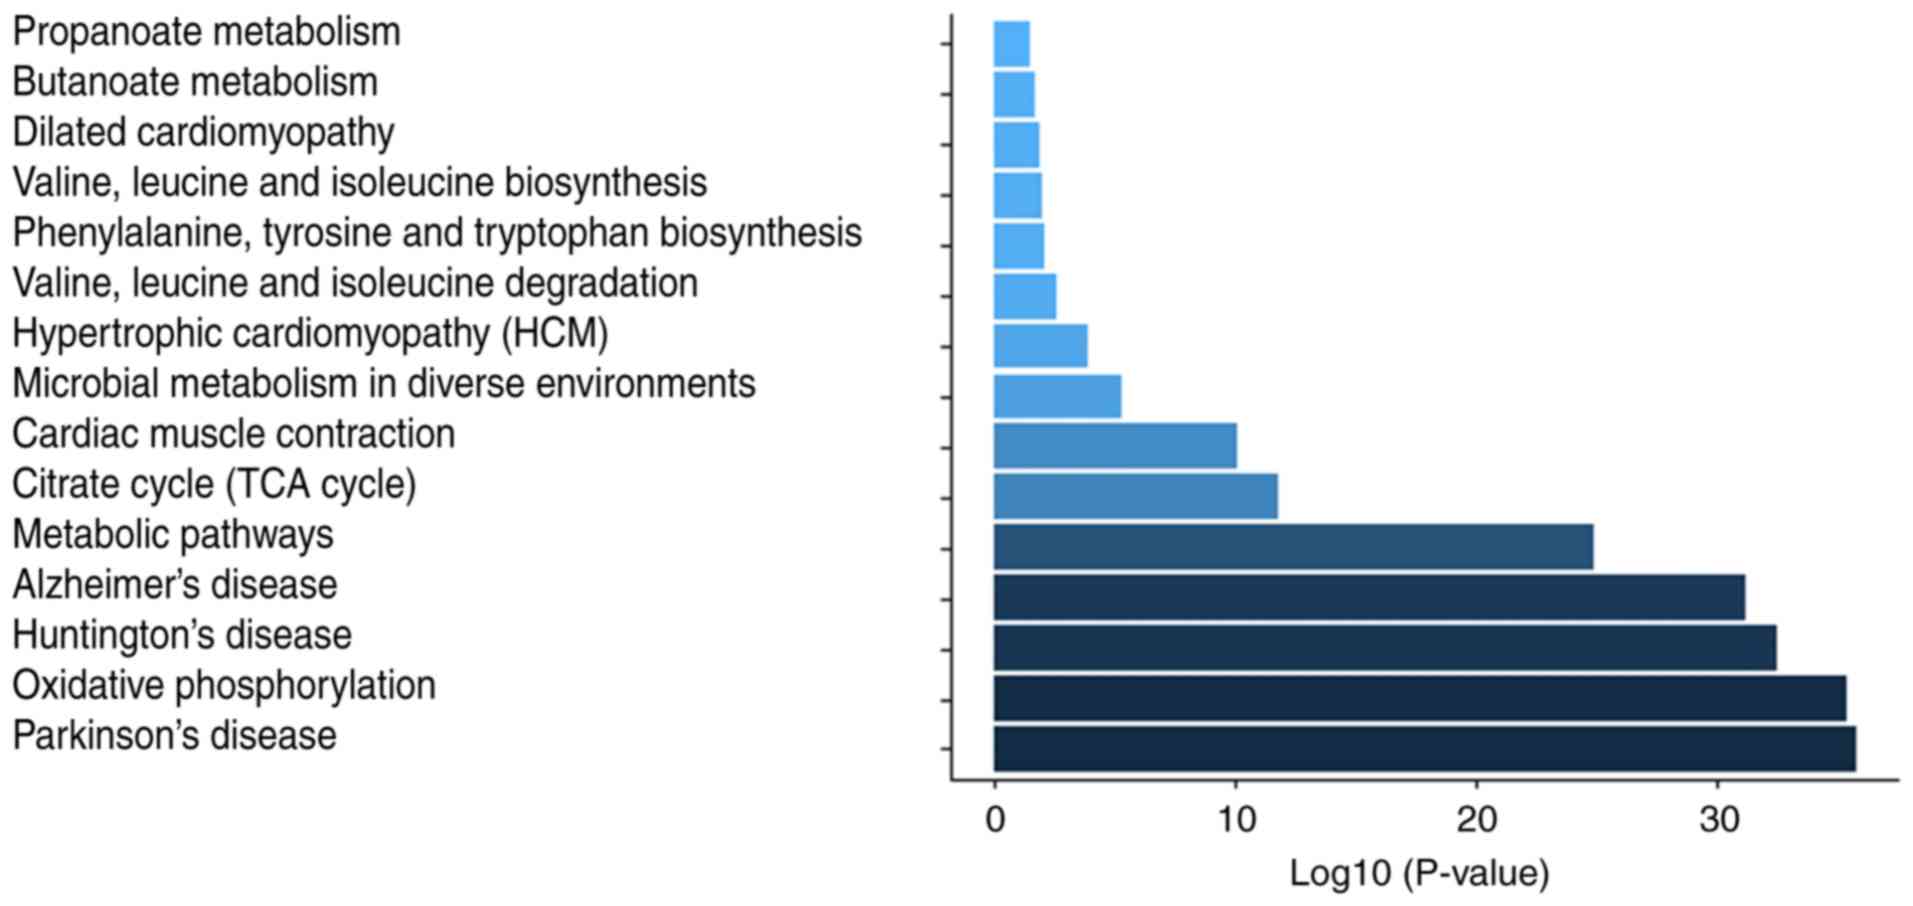
(Fig. S4). In addition, a KEGG
pathway enrichment analysis was performed, which revealed that
coronary artery disease-specific proteins were associated with
Parkinson's disease, oxidative phosphorylation, Huntington's
disease, Alzheimer's disease, metabolic pathways, citrate cycle
(TCA cycle), cardiac muscle contraction and microbial metabolism in
diverse environments (Fig. 7).
The GO function 'NADH dehydrogenase activity', the cellular
component 'mitochondrion', and KEGG pathways 'metabolic pathways'
enriched in the differentially expressed proteins, suggested that
the mitochondrial energy metabolism may be underlying the
occurrence and development of coronary artery atherosclerosis.
Discussion
The aim of the present study was to provide a
comprehensive survey of human coronary artery proteins and identify
individual proteins and potential regulatory pathways that differ
between the histological classification of atherosclerotic lesions.
The present study observed 2,135 proteins in the 20 coronary artery
segments samples from two cases. Combined with the results of
H&E staining of the coronary artery samples, the intersection
analysis suggested that the intersection reveals a total of 174
proteins, including 4 upregulated proteins and 164 downregulated
proteins (excluding 6 proteins with inconsistent expression
tendencies) that were obtained after comparing the fatty streak
tunica intima, fibrous plaques tunica intima, atherosclerotic
tunica intima and secondary affection tunica intima groups with the
normal tunica intima groups. GO and KEGG enrichment analyses of the
differentially expressed proteins revealed that the mitochondrial
energy metabolism may be underlying the occurrence and development
of coronary artery atherosclerosis.
Proteomics is defined as the comprehensive analysis
of all proteins expressed in cells, tissues or organisms for the
identification, quantification, post-translational modification,
subcellular localization, protein-protein interaction and enzymatic
activities (11). The proteomics
approaches are becoming commonly available for the study of
increasingly complex diseases since the early 2000s (12-14). Although a few proteomics studies
on coronary artery disease may reflect the pathophysiological
changes in coronary artery disease and may be used for the clinical
study of coronary artery disease, the majority of samples involved
in the proteomics studies of coronary artery disease are urine
(15), coronary artery
endothelial cells (16) and
plasma (17). A total of 806
proteins were previously identified from 35 human coronary
atherosclerotic samples by means of direct tissue proteomics
analysis in a previous study (7);
however, these samples were obtained in paraffin or frozen blocks.
Another mass spectrometry analysis of coronary artery specimens
from 100 autopsied young adults presented the human coronary
arterial proteome and proteomic features strongly associated with
early atherosclerosis (6);
however, these samples were only obtained from the LAD artery. The
present study can be distinguished from previous investigations as
the sampling of human coronary artery segments were underlying the
majority of coronary artery disease morbidity and mortality, the
quantity, quality and variety of proteins identified, and the
virtue that the proteins were identified from two cases of
comprehensive coronary artery tree samples where the effects of
local anatomy context and natural history and histological
classification of atherosclerotic lesions are manifested by H&E
staining.
The human mitochondrial DNA (mtDNA) is a
double-stranded, circular molecule of 16,569 bp and contains 37
genes coding for proteins of the electron transport chain (ETC) [13
subunits of complexes I, III, IV and the ATP synthase (complex V)]
that are essential for oxidative phosphorylation (OXPHOS), two
rRNAs, 22 tRNAs and 13 polypeptides that are essential for normal
mitochondrial function (18).
Oxygen-consuming mitochondrial OXPHOS is the physiological means of
ATP production in the heart. As a major source of cellular energy
in the heart, mitochondria can produce ATP via the electron
transport chain (ETC). Mitochondrial dysfunction can result in
impaired cellular function, and has been associated with coronary
artery disease. Results from a recent study have suggested that the
transformation of mitochondrial metabolism from oxidative
phosphorylation to glycolysis may be associated with coronary
artery disease (19). In the
present study, the analysis results indicated that a total of 174
proteins, including 4 upregulated proteins and 164 downregulated
proteins, (excluding 6 proteins with inconsistent expression
tendencies) were significantly associated with coronary artery
disease. In addition, GO terms for molecular functions, including
NADH dehydrogenase activity, NADH dehydrogenase (ubiquinone)
activity, NADH dehydrogenase (quinone) activity, oxidoreductase
activity acting on NADH or NADPH, the cellular component
'mitochondrion, mitochondrial matrix, mitochondrial intermembrane,
mitochondrial intermembrane space, mitochondrial inner membrane,
mitochondrial outer membrane, and mitochondrial respiratory chain
complex I', and KEGG pathways 'oxidative phosphorylation, metabolic
pathways, citrate cycle (TCA cycle)' enriched in the differentially
expressed proteins, suggested that the dysfunction of mitochondrial
energy metabolism may be underlying the occurrence and development
of coronary artery atherosclerosis. The results of the present
study coincide with those of previous studies where it has been
demonstrated that the altered mitochondrial dynamics and
mitochondrial dysfunction are also key features of coronary artery
disease (20,21), and may shed light on the current
understanding of the molecular mechanism of coronary artery disease
with respect to environmental and genetic risk factors. From the
present study, it can be concluded that the prevention of
mitochondrial dysfunction may be a promising target in coronary
artery disease. The present study demonstrated that it is possible
to reverse the mitochondrial dysfunction, recover mitochondrial
dynamics via retrieving the mitochondrial-associated protein
expression, leading to decreased atherosclerosis of coronary
artery.
The present study had several limitations. First,
the human coronary artery samples of the present study were
obtained from two cases with 20 segments; the sample size was too
small to minimize the experimental bias; thus, a large-sample study
is required in the future in order to validate the results obtained
in the present study. Secondly, in the present study, the human
coronary artery samples were selected postmortem; therefore, the
potential effects of death on the stability of identified proteins,
associated cellular functional processes, protein-protein
interaction, protein networks and pathways should be noted. These
limitations, however, do not withdraw from the accuracy and
reliability of the identification results achieved by means of the
analysis of the distributions of precursors mass δ, peptide length
and number of unique peptides of identified proteins. Thirdly, due
to the functional validation assays not having been included in the
present study, the specific mechanisms through which differentially
expressed proteins may be involved in atherosclerosis development
have not been established. In order to achieve the potential
clinical utility of the identified proteins as coronary artery
disease biomarkers, the functional role and mechanistic
underpinning of the proteins, protein networks and pathways
identified in the present study are required in future studies.
In conclusion, the present study identified 2,135
proteins in human coronary artery samples. Combined with the
results of histological classification of the coronary artery
samples, a total of 174 proteins, including 4 upregulated proteins
and 164 downregulated proteins (excluding 6 proteins with
inconsistent expression tendencies) were identified that were
associated with coronary artery disease. In addition, GO and KEGG
enrichment of the differentially expressed proteins revealed that
the mitochondrial energy metabolism may be underlying the
occurrence and development of coronary artery atherosclerosis.
Supplementary Data
Funding
The present study was supported by the National
Natural Science Foundations of China (grant nos. 81970302,
81170180, 30400173 and 30971257) and the Priority Academic Program
Development of Jiangsu Higher Education Institutions.
Availability of data and materials
All data generated or analyzed during this study are
included in this published article.
Authors' contributions
YaZ performed the collection of coronary artery
samples and contributed to the writing and revising of the
manuscript. JY performed the protein extraction and was involved in
the writing of the manuscript. YF, FA and JC performed the LC-MS/MS
analysis. YoZ, JJ, MG, ZM and HS performed the coronary artery
segment preparation and the pathological analysis. QJ, CZ, MJ, JZ
and GX performed the processing of mass spectrometry spectra and
the bioinformatics analysis. EJ conceived and designed the study
and contributed to the writing of the manuscript. All authors have
read and approved the final manuscript.
Ethics approval and consent to
participate
The methods were performed in accordance with the
approved guidelines, and all experimental protocols were approved
by the Ethics Committee of Nanjing Medical University and the First
Affiliated Hospital of Nanjing Medical University. Informed consent
from the bereaved family was obtained for the research use of the
samples.
Patient consent for publication
Not applicable.
Competing interests
The authors declare that they have no competing
interests.
Acknowledgments
Dr En-Zhi Jia is an Assistant Fellow at the
Collaborative Innovation Center for Cardiovascular Disease
Translational Medicine.
References
|
1
|
Lobingier BT, Hüttenhain R, Eichel K,
Miller KB, Ting AY, von Zastrow M and Krogan NJ: An Approach to
spatiotemporally resolve protein interaction networks in living
cells. Cell. 169:350–360.e12. 2017. View Article : Google Scholar : PubMed/NCBI
|
|
2
|
Thul PJ, Åkesson L, Wiking M, Mahdessian
D, Geladaki A, Ait Blal H, Alm T, Asplund A, Björk L, Breckels LM,
et al: A subcellular map of the human proteome. Science.
356:eaal33212017. View Article : Google Scholar : PubMed/NCBI
|
|
3
|
Van Rooden EJ, Florea BI, Deng H,
Baggelaar MP, van Esbroeck ACM, Zhou J, Overkleeft HS and van der
Stelt M: Mapping in vivo target interaction profiles of covalent
inhibitors using chemical proteomics with label-free
quantification. Nat Protoc. 13:752–767. 2018. View Article : Google Scholar : PubMed/NCBI
|
|
4
|
Li KS, Shi L and Gross ML: Mass
spectrometry-based fast photochemical oxidation of proteins (FPOP)
for higher order structure characterization. Acc Chem Res.
51:736–744. 2018. View Article : Google Scholar : PubMed/NCBI
|
|
5
|
Distler U, Kuharev J, Navarro P and Tenzer
S: Label-free quantification in ion mobility-enhanced
data-independent acquisition proteomics. Nat Protoc. 11:795–812.
2016. View Article : Google Scholar : PubMed/NCBI
|
|
6
|
Herrington DM, Mao C, Parker SJ, Fu Z, Yu
G, Chen L, Venkatraman V, Fu Y, Wang Y, Howard TD, et al: Proteomic
architecture of human coronary and aortic atherosclerosis.
Circulation. 137:2741–2756. 2018. View Article : Google Scholar : PubMed/NCBI
|
|
7
|
Bagnato C, Thumar J, Mayya V, Hwang SI,
Zebroski H, Claffey KP, Haudenschild C, Eng JK, Lundgren DH and Han
DK: Proteomics analysis of human coronary atherosclerotic plaque: A
feasibility study of direct tissue proteomics by liquid
chromatography and tandem mass spectrometry. Mol Cell Proteomics.
6:1088–1102. 2007. View Article : Google Scholar : PubMed/NCBI
|
|
8
|
Stary HC: Natural history and histological
classification of atherosclerotic lesions: An update. Arterioscler
Thromb Vasc Biol. 20:1177–1178. 2000. View Article : Google Scholar : PubMed/NCBI
|
|
9
|
Fernández-Coto DL, Gil J, Hernández A,
Herrera-Goepfert R, Castro-Romero I, Hernández-Márquez E,
Arenas-Linares AS, Calderon- Sosa VT, Sanchez-Aleman MÁ Mendez-,
Tenorio A, et al: Quantitative proteomics reveals proteins involved
in the progression from non-cancerous lesions to gastric cancer. J
Proteomics. 186:15–27. 2018. View Article : Google Scholar : PubMed/NCBI
|
|
10
|
Tyanova S, Temu T and Cox J: The MaxQuant
computational platform for mass spectrometry-based shotgun
proteomics. Nat Protoc. 11:2301–2319. 2016. View Article : Google Scholar : PubMed/NCBI
|
|
11
|
Aebersold R and Mann M: Mass
spectrometry-based proteomics. Nature. 422:198–207. 2003.
View Article : Google Scholar : PubMed/NCBI
|
|
12
|
Florens L, Washburn MP, Raine JD, Anthony
RM, Grainger M, Haynes JD, Moch JK, Muster N, Sacci JB, Tabb DL, et
al: A proteomic view of the Plasmodium falciparum life cycle.
Nature. 419:520–526. 2002. View Article : Google Scholar : PubMed/NCBI
|
|
13
|
Koller A, Washburn MP, Lange BM, Andon NL,
Deciu C, Haynes PA, Hays L, Schieltz D, Ulaszek R, Wei J, et al:
Proteomic survey of metabolic pathways in rice. Proc Natl Acad Sci
USA. 99:11969–11974. 2002. View Article : Google Scholar : PubMed/NCBI
|
|
14
|
Washburn MP, Wolters D and Yates JR III:
Large-scale analysis of the yeast proteome by multidimensional
protein identification technology. Nat Biotechnol. 19:242–247.
2001. View Article : Google Scholar : PubMed/NCBI
|
|
15
|
Sun H, Wang D, Liu D, Guo Z, Shao C, Sun W
and Zeng Y: Differential urinary proteins to diagnose coronary
heart disease based on iTRAQ quantitative proteomics. Anal Bioanal
Chem. 411:2273–2282. 2019. View Article : Google Scholar : PubMed/NCBI
|
|
16
|
Li SM, Liu WT, Yang F, Yi QJ, Zhang S and
Jia HL: Phosphorylated proteomics analysis of human coronary artery
endothelial cells stimulated by Kawasaki disease patients serum.
BMC Cardiovasc Disord. 19:212019. View Article : Google Scholar : PubMed/NCBI
|
|
17
|
Anwar MA, Dai DL, Wilson-McManus J, Smith
D, Francis GA, Borchers CH, McManus BM, Hill JS and Cohen Freue GV:
Multiplexed LC-ESI-MRM-MS-based assay for identification of
coronary artery disease biomarkers in human plasma. Proteomics Clin
Appl. 11:e17001112019. View Article : Google Scholar
|
|
18
|
Taanman JW: The mitochondrial genome:
Structure, transcription, translation and replication. Biochim
Biophys Acta. 1410:103–123. 1999. View Article : Google Scholar : PubMed/NCBI
|
|
19
|
Ait-Aissa K, Blaszak SC, Beutner G, Tsaih
SW, Morgan G, Santos JH, Flister MJ, Joyce DL, Camara AKS,
Gutterman DD, et al: Mitochondrial oxidative phosphorylation defect
in the heart of subjects with coronary artery disease. Sci Rep.
9:76232019. View Article : Google Scholar : PubMed/NCBI
|
|
20
|
Mercer JR, Cheng KK, Figg N, Gorenne I,
Mahmoudi M, Griffin J, Vidal-Puig A, Logan A, Murphy MP and Bennett
M: DNA damage links mitochondrial dysfunction to atherosclerosis
and the metabolic syndrome. Circ Res. 107:1021–1031. 2010.
View Article : Google Scholar : PubMed/NCBI
|
|
21
|
Sergin I, Evans TD, Zhang X, Bhattacharya
S, Stokes CJ, Song E, Ali S, Dehestani B, Holloway KB, Micevych PS,
et al: Exploiting macrophage autophagy-lysosomal biogenesis as a
therapy for atherosclerosis. Nat Commun. 8:157502017. View Article : Google Scholar : PubMed/NCBI
|