Introduction
Mitochondria are cytoplasmic organelles that are
present in most eukaryotic cells, and are comprised of the matrix,
the outer membrane (OM) and the inner membrane, which contains
cristae that are highly trapped in the inner wall (1). Mitochondria produce ATP via
oxidative phosphorylation and play a central role in cell apoptosis
(2). In addition to providing
energy for cells, mitochondria have other tasks, such as regulating
signal transduction, regulating cell death and cell
differentiation, and regulating cell growth and cell cycle
(2). Mitochondria are constantly
dividing, moving and fusing within eukaryotic cells; these dynamics
are critical for the normal function of these organelles (3). The kinetic balance of fusion and
division plays a critical role in mitochondrial morphology,
enabling them to rapidly adapt to the energy demand and maintain
their integrity (3). Therefore,
the dynamics of mitochondria fission and fusion, and the proteins
(which are conserved from yeast to humans) controlling these
processes are of major importance; their abnormalities are
associated with serious human diseases, including
Beckwith-Wiedemann syndrome, neurodegenerative diseases,
Charcot-Marie-Tooth disease type 6, multiple symmetric lipomatosis
and microcephaly (4).
Membrane fusion is important for the establishment
of cell distribution and the morphology of mitochondrial chambers
(5). When fission is dominant,
mitochondria are in the form of isolated dots, and when fusion is
dominant, mitochondria are in the form of interconnected filaments
(6). Conserved dynamin-related
proteins (Drps) regulate mitochondrial dynamics (7). Based on the analysis of
spermatogenesis defects in Drosophila mutants, the
FZO gene for mitochondrial fusion was identified (8). The discovery of FZO
homologues in yeasts, nematodes and mammals defined a novel family
of high molecular weight GTPases with multiple domains (8). Fuzzy onions protein 1 (Fzo1p)
controls mitochondrial OM fusion in various cell types and
organisms (9).
Cell replication involves a series of highly
evolutionary conserved and regulated complex processes referred to
as the cell cycle (10).
Schizosaccharomyces pombe (S. pombe), termed fission
yeast, is a unicellular organism that possesses numerous cell cycle
characteristics similar to those in mammalian cells, and which can
easily be genetically manipulated (11). It is an important model cell for
investigating checkpoint controls and the cell cycle (12). In the present study, S.
pombe was used to explore the effect of FZO1 gene
deletion on cell dynamics in mitosis.
Materials and methods
S. pombe strains construction
All strains used in the present study, wild-type and
mutant, were donated by Associate Professor Phong Tran (University
of Pennsylvania). A small patch of HY 3447
h+/h- cells and equivalent patch of wild-type
PT h+/h- cells that had different fluorescent
protein markers were added onto a mating plate [Edinburgh minimal
medium without nitrogen (EMM-N); Formedium Ltd.; diameter, 5 mm]
and blended well. Cells on the mating plate were incubated at 25°C
for 24 h. A patch of cells from the sporulation/mating plate were
added to glusulase suspension (100 µl; Shanghai Yuanye
Bio-Technology Co., Ltd.) and incubated overnight at room
temperature. Sterile water was used to wash the glusulase and a
microscope was used to verify that all cells were hydrolyzed.
Diluted cells (10 µl) were collected and spread on a
YE5S-G418 (0.225 mg/ml G418; Formedium Ltd.) plate evenly. Colonies
typically appeared following incu-bation for 3 days at 25°C.
Monoclones which had appropriate markers were identified and
isolated under a fluorescence microscope (13). In the donated strains, constructs
expressing red fluorescent protein-cytochrome c oxidase 4
(RFP-Cox4) had been integrated into the leu2 locus, and constructs
expressing mCherry-tubulin α2 (Atb2), histone H3 (Hht2)-green
fluorescent protein (GFP), actin (pACT1)-LifeAct-GFP and GFP-Atb2
were integrated into the leu1 locus. All strains used in the
present study are listed in Table
I.
 | Table IList of strains. |
Table I
List of strains.
| Strain | Genotype | Figure |
|---|
| PT 286 | Wt:h- | NA |
| PT 287 | Wt:h+ | NA |
| PT 917 | Wt: mCherry-Atb2
h- | NA |
| PT 735 | Wt: GFP-Atb2
h+ | NA |
| PT 3850 | Wt:
pACT1-LifeAct-GFP: LEU1 h+/h- | NA |
| PT 2167 | Wt: Hht2-GFP: URA4
h+ | NA |
| PT 1683 | Wt: RFP-Cox4
h? | NA |
| HY 1 | Wt: Hht2-GFP:
URA4/mCherry-Atb2 h+/h- | Figs. 2 and 3 |
| HY 2 | Wt: KanR
pACT1-LifeAct-GFP: LEU1/mCherry-Atb2 h+/h- | Fig. 4 |
| HY 3 | Wt: KanR
GFP-Atb2/RFP-Cox4 h+/h- | Fig. 1 |
| HY 3447 | fzo1Δ: KanR
h+/h- | NA |
| HY 3447-1 | fzo1Δ: KanR
Hht2-GFP: URA4/mCherry-Atb2 h? | Figs. 2 and 3 |
| HY 3447-2 | fzo1Δ: KanR
pACT1-LifeAct-GFP: LEU1/mCherry-Atb2 h? | Fig. 4 |
| HY 3447-3 | fzo1Δ: KanR
GFP-Atb2/RFP-Cox4 h? | Fig. 1 |
Cell proliferation
Cells were transferred from YE5S solid medium
(Formedium Ltd.) to YE5S liquid medium (Formedium Ltd.), cultured
in a cultivation shaker (Shanghai Bluepard Instruments Co., Ltd.)
at 25°C for 24 h for cell activation. When the optical density
(OD)595 of wild-type and fzo1Δ cells reached
0.5–0.8, cells were diluted to an OD595 of 0.1. Then,
cells were cultured in a cultivation shaker at 25°C and the
OD595 was determined every 2 h using a microplate reader
(Thermo Fisher Scientific, Inc.).
Observation of sporogenesis
A patch of HY 3447 h+ cells and an
equivalent patch of 3447 h- cells were collected, added
to a mating plate (EMM-N; diameter, 5 mm) and blended well. The
mating plate was incubated for 24 h at 25°C. A patch of cells was
collected during the sporulation/mating plate to observe the
formation of zygotes. The method for observing wild-type cell
sporulation was the same as for HY 3447 cells. During the
observation of ascospores, 500 cells without damage to the cell
wall were selected randomly for image collection to ensure that
spores did not overflow and cause analysis errors. Then, the
proportion of cells that produced 2, 3 or 4 spores was calculated,
with three replicates performed. The total number of cells analyzed
in each group was 1,500 (8).
Microscopy
The camera used to capture ascospores images was an
Olympus DP72 (Olympus Corporation) and the microscope was an
Olympus BX51 (magnification, x1,000; Olympus Corporation). The
software used to capture ascospores images was cellSens Entry
(Olympus Corporation). Live-cell imaging was conducted at 25°C. A
Photometrics CoolSNAP HQ2 CCD camera (Teledyne Photometrics) and a
spinning-disc confocal microscope (Olympus Corporation) with a
Nikon PlanApo x100/1.40 NA objective (Nikon Corporation) were used
for imaging of living cells (14). MetaMorph 7.5 (Molecular Devices,
LLC) was used to analyze all images. Images were acquired at 60-sec
intervals across a total time of 90 min, with an exposure of
300-500 msec for GFP/mCherry fluorescence acquisition in 11 optical
sections of 0.5-µm distance. Microtubules (MTs) were
observed for 8 min; the maximum number of MTs in each cell was used
as the final MT number, and the maximum MT length of each MT was
used as the final MT length. Analysis of energy metabolites. Cells
were cultured in YE5S medium for 3 days at 25°C. The cells were
washed three times with cold PBS and collected in a 1.5-ml
centrifuge tube, and then frozen in liquid nitrogen and stored at
-80°C following centrifugation at 3,000 × g and 4°C for 5 min. The
collected cells were sent to Shanghai Applied Protein Technology
Co., Ltd. to be analyzed for metabolomics via liquid
chromatography-mass spectrometry (LC-MS).
Data analysis
Bar graphs and line graphs were expressed using mean
± SD, other data were presented as box plots, and SPSS 17 software
(SPSS, Inc.) was used to analyze significant differences between
the control group and the experimental group by one-way ANOVA.
P<0.05 was considered to indicate a statistically significant
difference. All plots were analyzed using Kaleidagraph 4.0
(http://www.synergy.com). Box plots present the
median and interquartile range, and includes all individual data,
with any outliers displayed as a single point. The number of
repeats for each experiment is indicated in the corresponding
figure legend. The fluorescence ratio was used in MetaMorph 7.5 to
reduce the error in fluorescence detection.
Results
Effects of FZO1 gene deletion on
mitochondrial morphology, cell growth and the number and morphology
of ascospores
The mitochondrial morphology analysis showed that
the mitochondria (visualized by RFP-Cox4) appeared to be fragmented
and tubular in wild-type cells, while they showed a state of
accumulation in fzo1Δ cells (Fig. 1A). The cell proliferation results
indicated that there was little difference in the proliferation
rates of wild-type and fzo1Δ cells at 25°C between 0-6 h.
After 6 h, the proliferation rate of wild-type cells increased,
while that of fzo1Δ cells exhibited relatively slow growth
in comparison. At 12 h, the optical density (OD)595 of
wild-type cells had reached 0.625±0.01, but the OD595 of
fzo1Δ cells was only 0.422±0.05, which was significantly
reduced compared with the wild-type cells (P<0.05; Fig. 1B). The results indicated that
FZO1 gene deletion reduced the proliferation rate of S.
pombe to a certain extent. The number of MTs in wild-type and
fzo1Δ cells at mitotic interphase were subsequently analyzed
(n=20; Fig. 1C and D). The
results showed that 35±7.64, 55±8.26 and 20±2.89% of wild-type
cells exhibited three, four and five MTs, respectively, whereas
6.67±2.89, 31.67±2.89, 60±5.00 and 1.66±2.89% of fzo1Δ cells
exhibited three, four, five and six MTs, respectively (n=20;
Fig. 1D). There was a significant
difference in the frequency of cells with three and four MTs
between wild-type and fzo1Δ cells (P<0.05). Of note, the
number of wild-type and fzo1Δ cells with five MTs was highly
significantly different (P<0.01). Statistical analysis of MT
length in mitotic interphase cells showed that the average MT
lengths in wild-type and fzo1Δ cells were 5.13±1.44 and
4.89±1.63 µm, respectively, which were not significantly
different (n=20) (Fig. 1E). The
results indicated that loss of FZO1 resulted in an increase
in the number of MTs in cells without a notable effect on MT length
compared with wild-type cells.
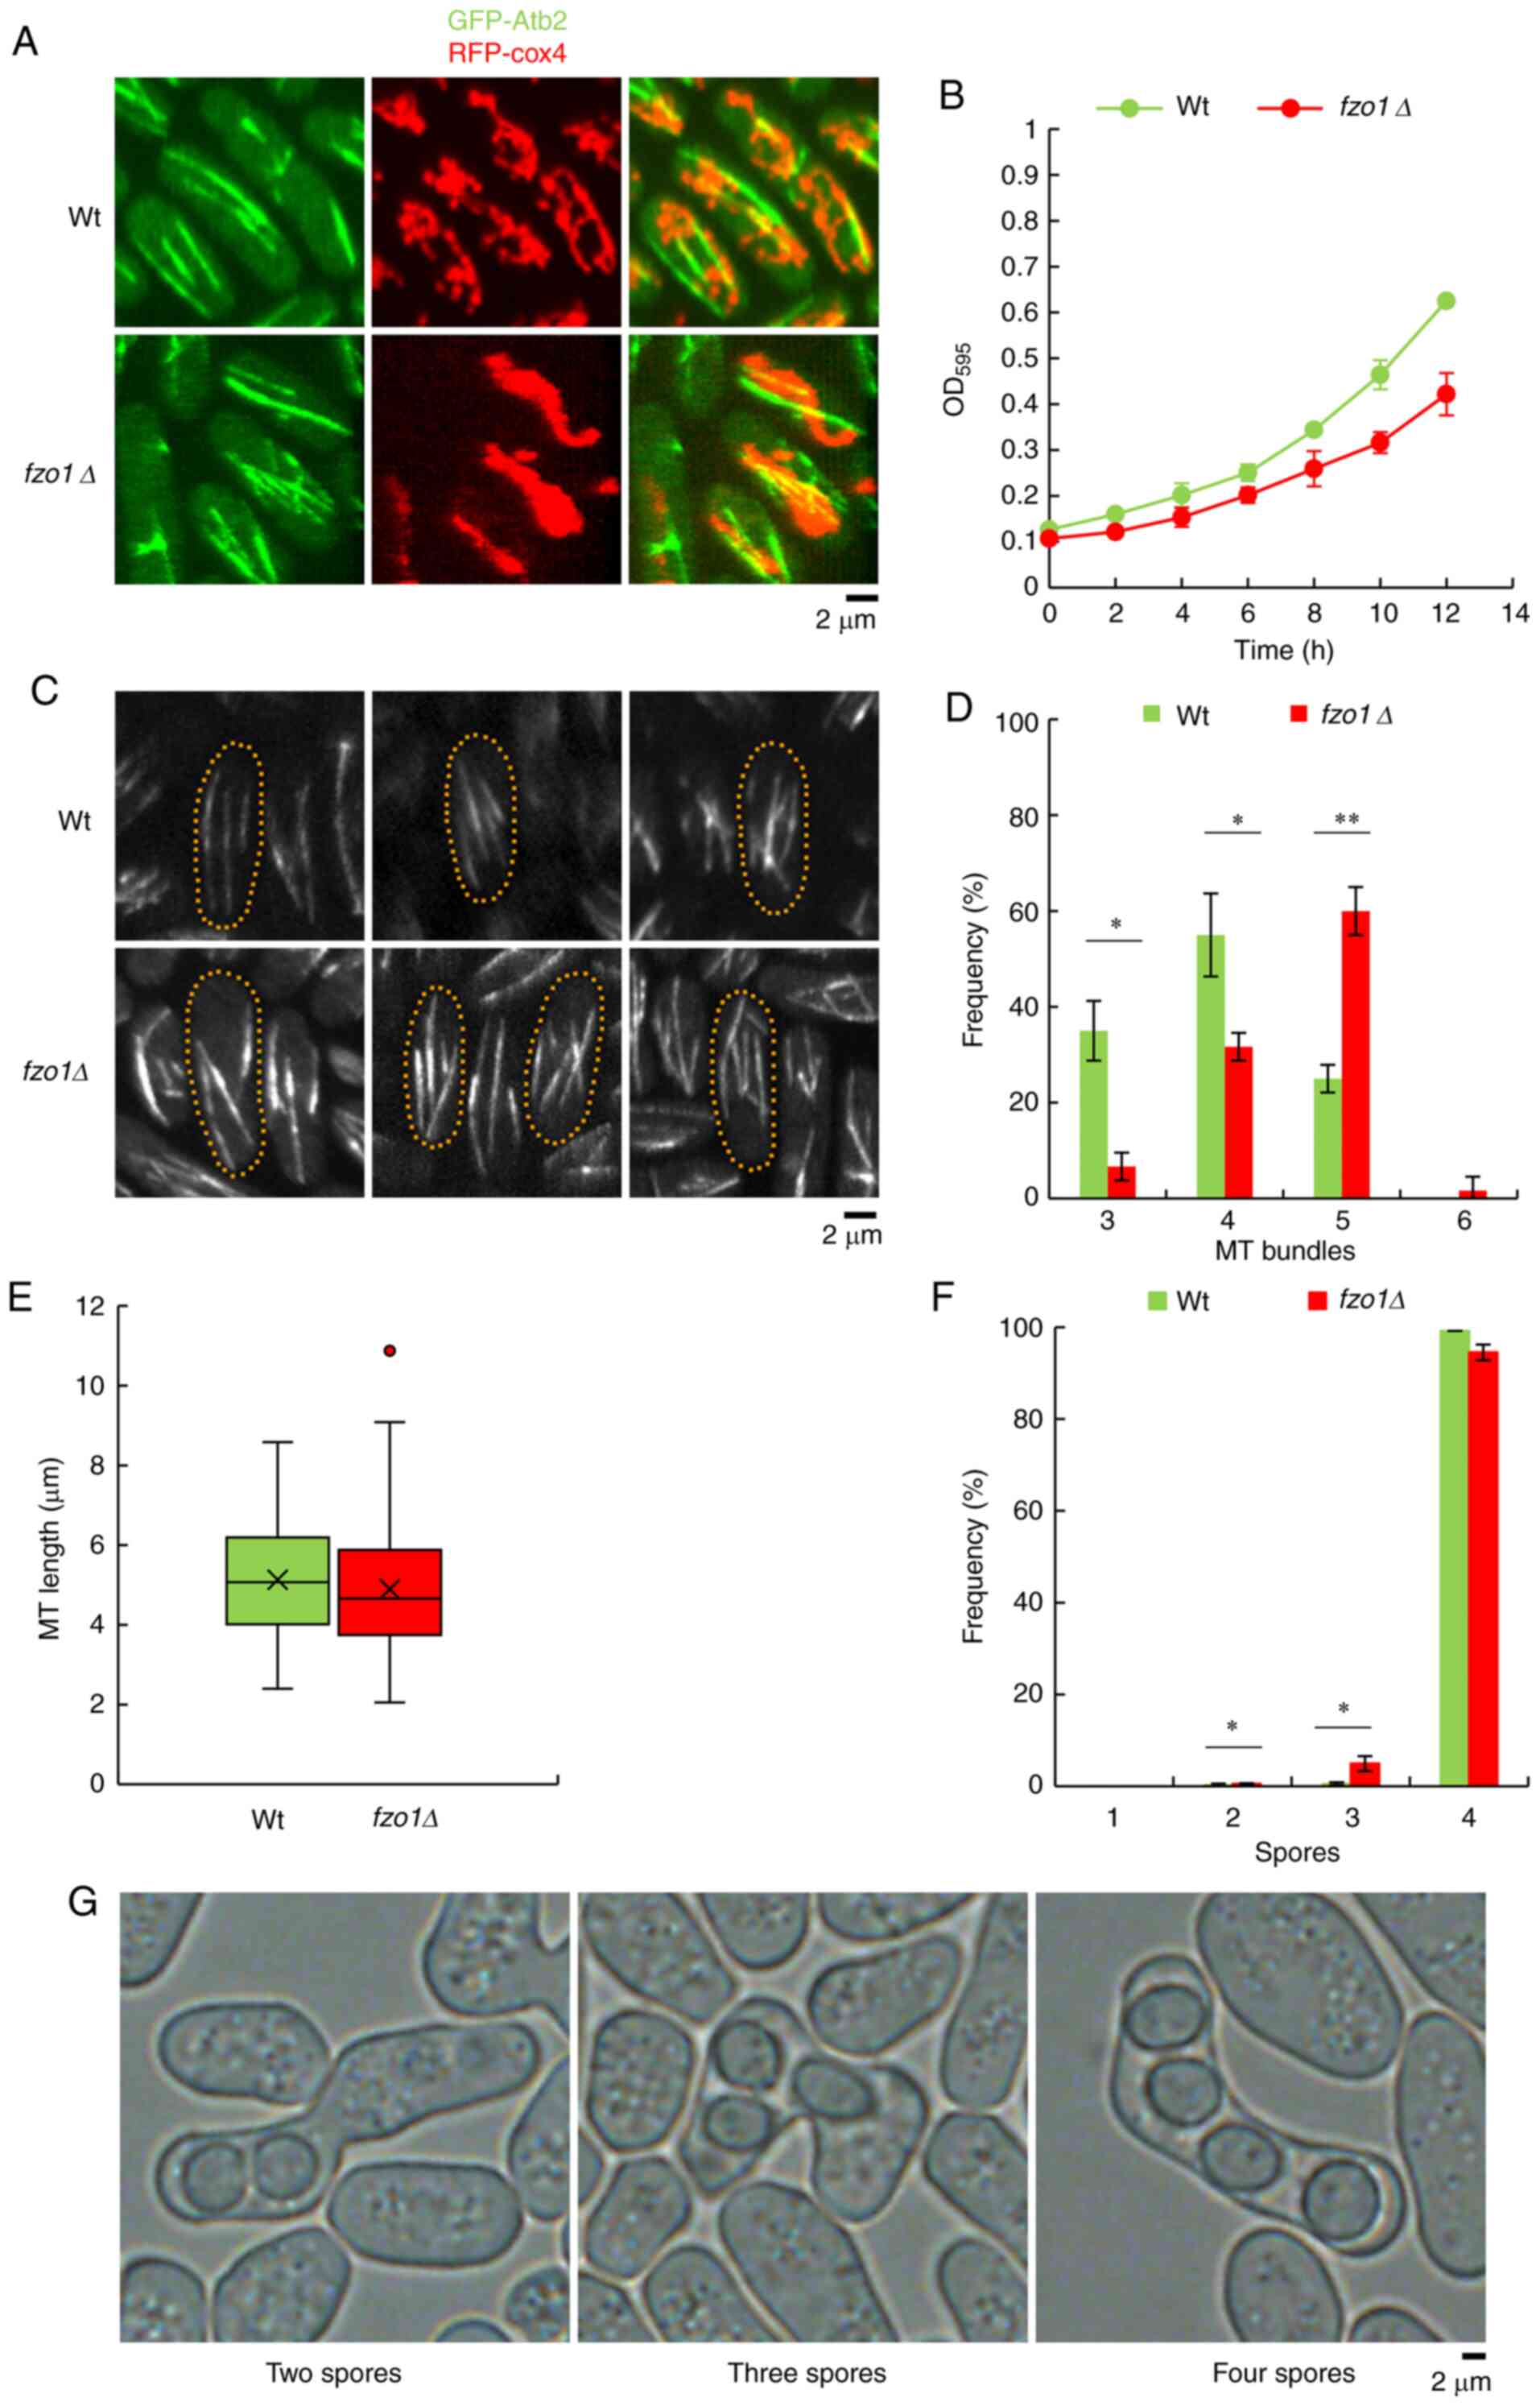 | Figure 1Effect of FZO1 gene deletion
on mitochondrial morphology, cell growth, and numbers of MT and
ascospores. (A) Mitochondria morphology (RFP-Cox4) and MT bundles
(GFP-Atb2) in Wt and fzo1Δ cells. (B) Growth curves of Wt
and fzo1Δ cells cultured at 25°C. Data are presented as the
mean ± SD (n=3 experimental repeats). (C) MT morphology of Wt cells
and fzo1Δ cells at mitotic interphase. Example images of Wt
cells with three, four and five MTs, respectively, are presented
from left to right; fzo1Δ cells with three, four, five and
six MTs are also presented. (D) Number of MTs in Wt cells and
fzo1Δ cells at the mitotic interphase (n=20 cells). (E)
Length of MTs in Wt and fzo1Δ cells at the mitotic
interphase (n=80 MTs). (F) Spore number in Wt and fzo1Δ
cells (n=1,500 cells). (G) Morphology of ascospores in fzo1Δ
cells. Example images of fzo1Δ cells with two, three and
four ascospores, respectively, from left to right.
*P<0.05, **P<0.01. fzo, fuzzy
onions; GFP-Atb2, green fluorescent protein-tubulin α2; MT,
microtubule; OD, optical density; RFP-Cox4, red fluorescent
protein-cytochrome c oxidase 4; Wt, wild-type. |
The number of ascospores produced by wild-type and
fzo1Δ cells were subsequently analyzed (Fig. 1F and G). The results showed that
0.3, 0.5 and 99.2% of wild-type cells produced two, three and four
ascospores, respectively, whereas 0.5, 4.9 and 94.5% of
fzo1Δ cells produced two, three and four ascospores,
respectively (n=1500; Fig. 1F).
The number of fzo1Δ cells with two and three spores were
significantly increased compared with wild-type cells (P<0.05),
while there was no notable difference in ascospore morphology
between wild-type and fzo1Δ cells, which suggested that the
FZO1 gene and its encoded protein affected the quantity of
ascospores of S. pombe without affecting spore morphology
(Fig. 1G).
Effect of FZO1 gene deletion on spindle
and cell length during cell division
There are three different elongation stages of the
mitotic spindle, corresponding to different stages of mitosis
(15). The spindle pole bodies
(SPBs) can regulate the mitotic spindle for chromosomal separation.
At the same time, SPBs also regulate the astral MTs, and their
functions in nuclear and spindle localization are similar to
interphase MTs (15). To gain
insight on the effect of FZO1 gene deletion on spindle
assembly, the spindle assembly dynamics were analyzed by live-cell
imaging in fission yeast fzo1Δ cells expressing mCherry-Atb2
and Hht2-GFP compared with wild-type cells. In wild-type cells,
three-phase spindle elongation dynamics were observed, specifically
prophase, metaphase, and anaphase A (chromatid separation) and B
(spindle elongation). There were some abnormalities observed in
fzo1Δ cells. Spindle length analysis revealed delayed or
failed spindle elongation in fzo1Δ cells (n=20; Fig. 2A and B). Analysis of spindle
elongation time showed that the fzo1Δ cells eventually
elongated with a delayed transition from metaphase to anaphase A by
3 min, which was significantly different compared with wild-type
cells (P<0.05; n=20; Fig. 3C),
and with a delayed elongation of 4.6 min during anaphase B, which
was strongly significantly different compared with wild-type cells
(P<0.01; n=20; Fig. 3E). Cell
length analysis of wild-type and fzo1Δ cells showed that the
cell lengths of wild-type cells at the spindle formation,
prophase-metaphase transition, metaphase-anaphase transition,
anaphase-telophase transition and end points during mitosis were
12.86±1.30, 12.99±1.23, 13.22±1.26, 13.40±1.25 and 8.46±1.07
µm, respectively, whereas those of fzo1Δ cells were
13.48±1.45, 13.64±1.42, 13.79±1.44, 13.94±1.45 and 8.35±0.73
µm, respectively (n=20; Fig.
2C-H). There was no significant difference in cell length
between the two groups.
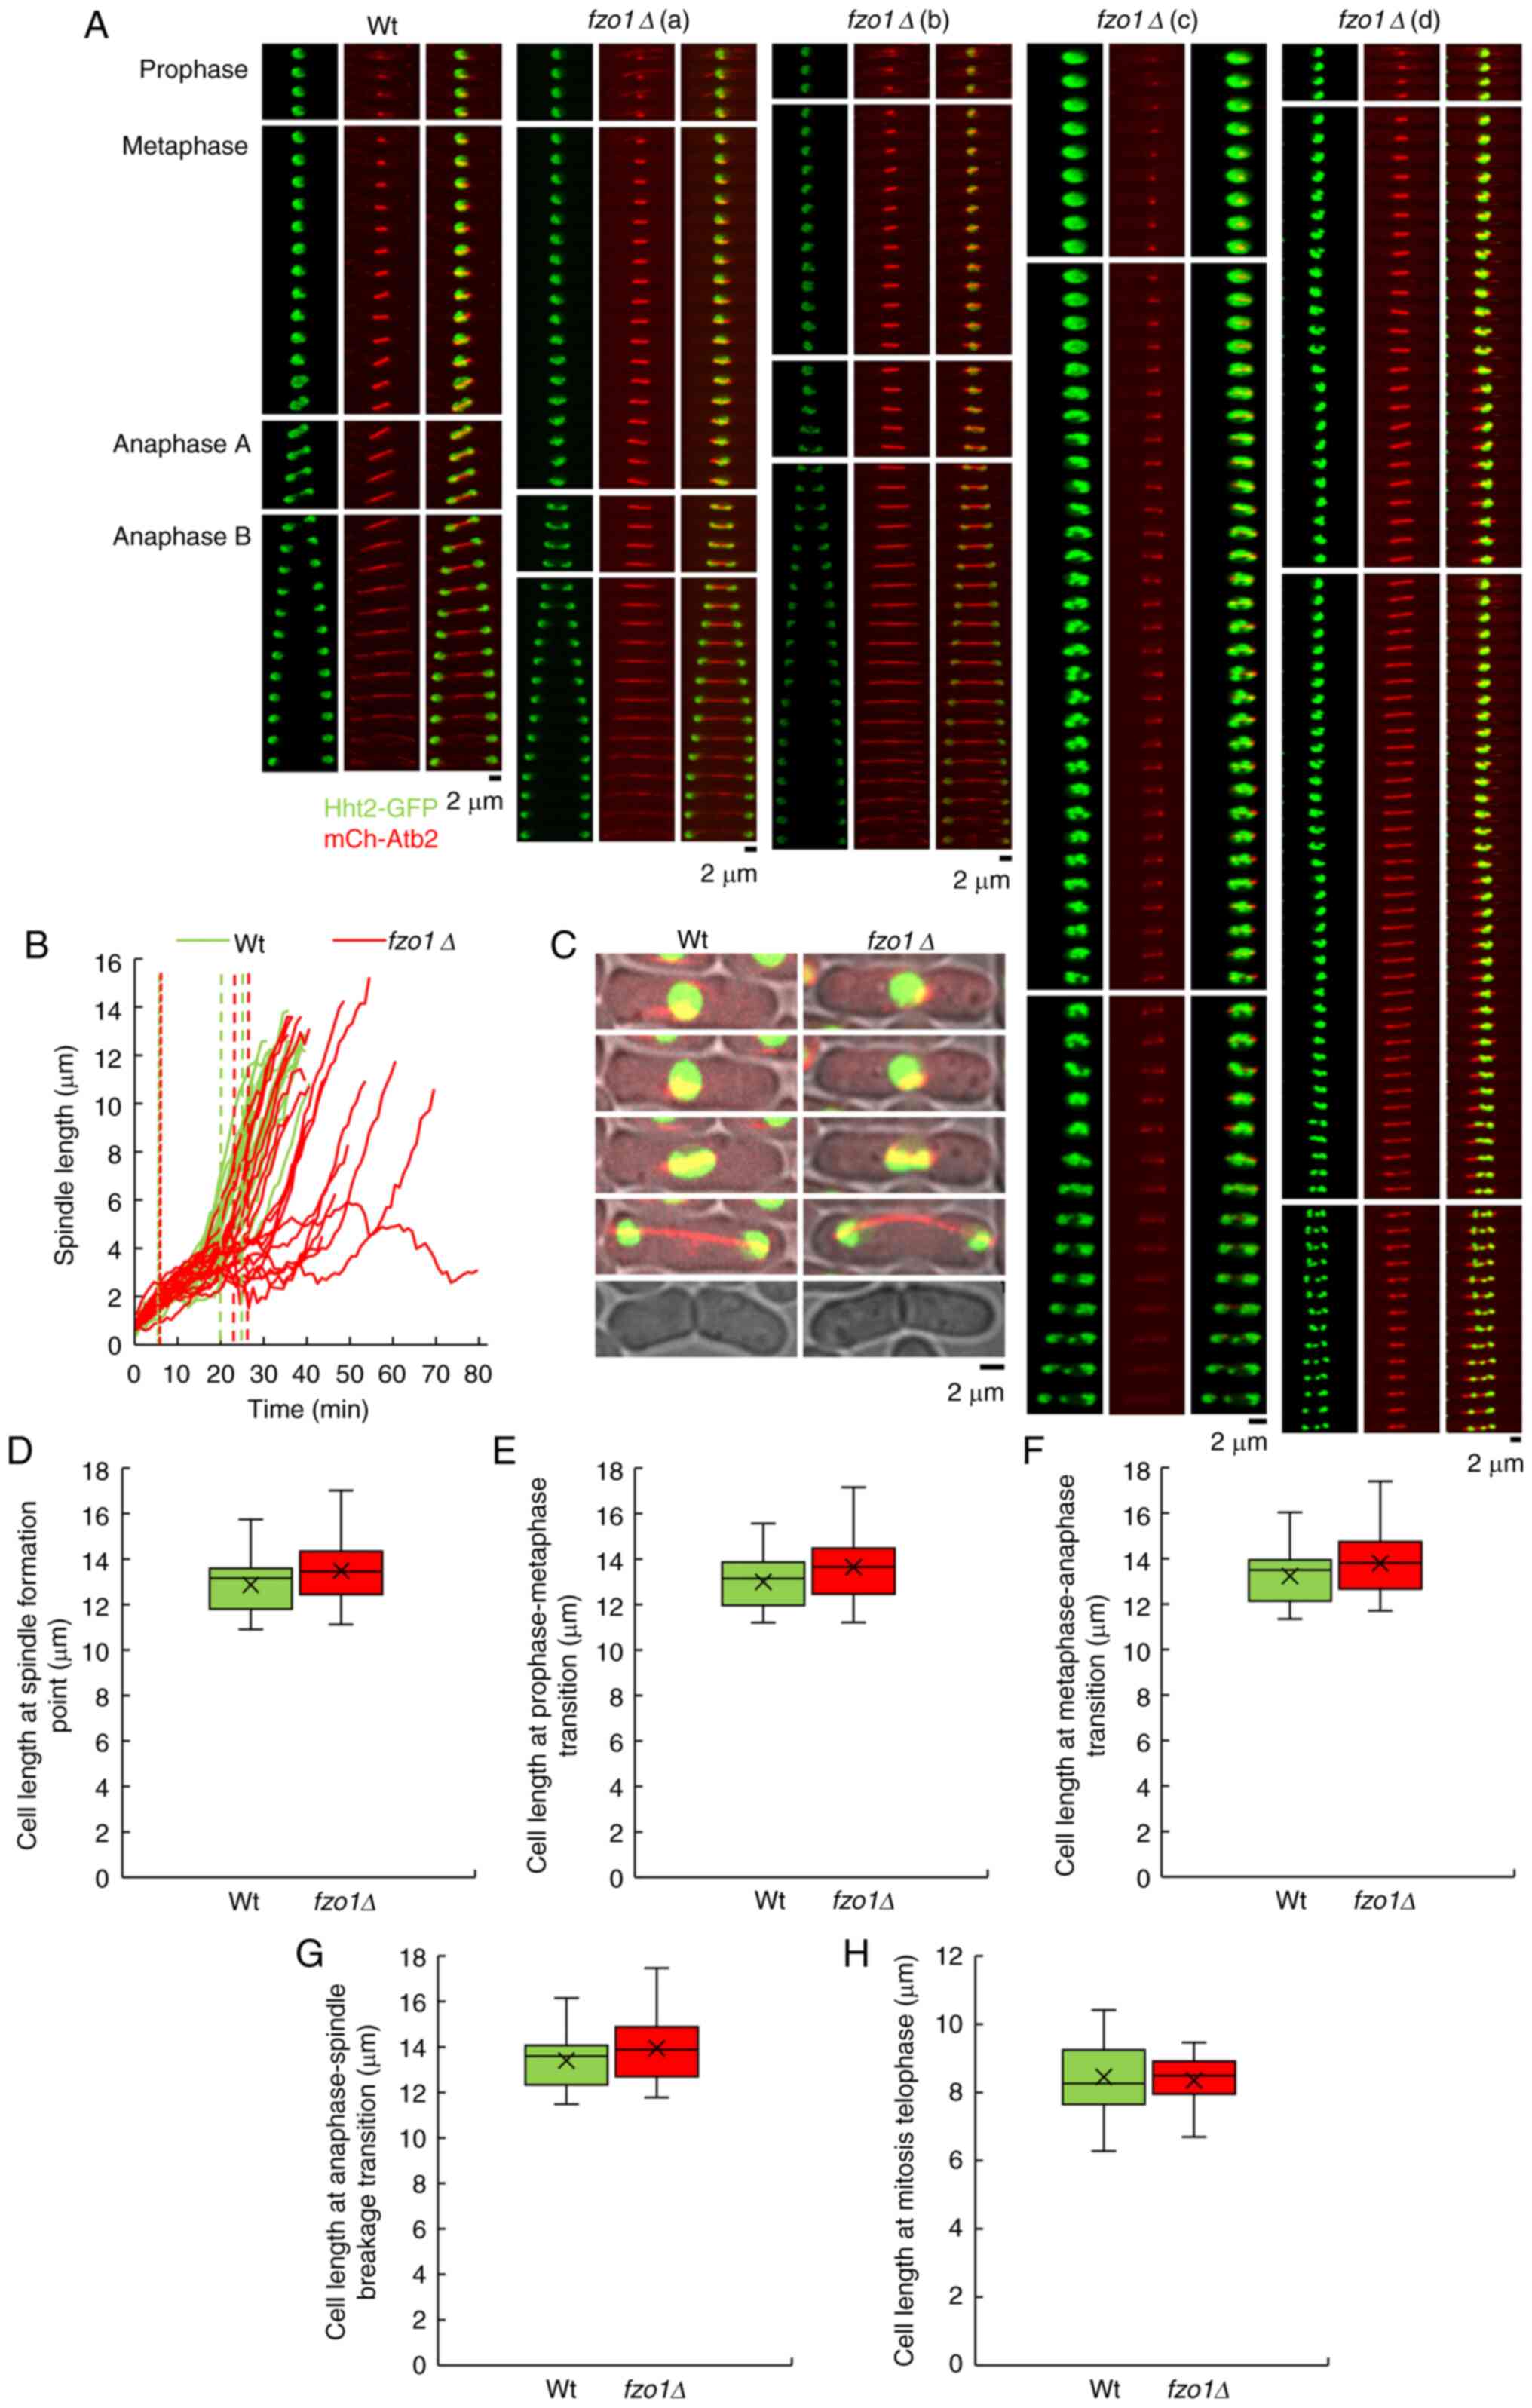 | Figure 2Effect of FZO1 gene deletion
on spindle and cell length during cell mitosis. (A) Spindle and
chromosome dynamics of Wt cells and fzo1Δ cells during whole
cell mitosis. Wt cells exhibited normal mitosis, fzo1Δ cells
exhibited (a) metaphase prolongation, (b) anaphase prolongation,
(c) anaphase delay and (d) chromosome mis-segregation. (B) Spindle
elongation in Wt and fzo1Δ cells during cell mitosis. (n=20
cells). Green and red dotted lines indicate the transitions during
cell mitosis in Wt cells and fzo1Δ cells, respectively. The
dotted lines in the figure indicate, from left to right, the
transitions between prophase and metaphase, metaphase and anaphase,
and anaphase A and anaphase B, respectively. (C) Cell morphology of
Wt and fzo1Δ cells at, from top to bottom, spindle
formation, prophase-metaphase transition, metaphase-anaphase
transition, anaphase-telophase transition and the end point of
mitosis. Length of Wt and fzo1Δ cells at (D) spindle
formation, (E) prophase-metaphase transition, (F)
metaphase-anaphase transition, (G) anaphase-spindle breakage
transition and (H) mitosis telophase (n=20 cells). fzo,
fuzzy onions; Hht2-GFP, histone H3-green fluorescent protein;
mCherry-Atb2, mCherry-tubulin α2; Wt, wild-type. |
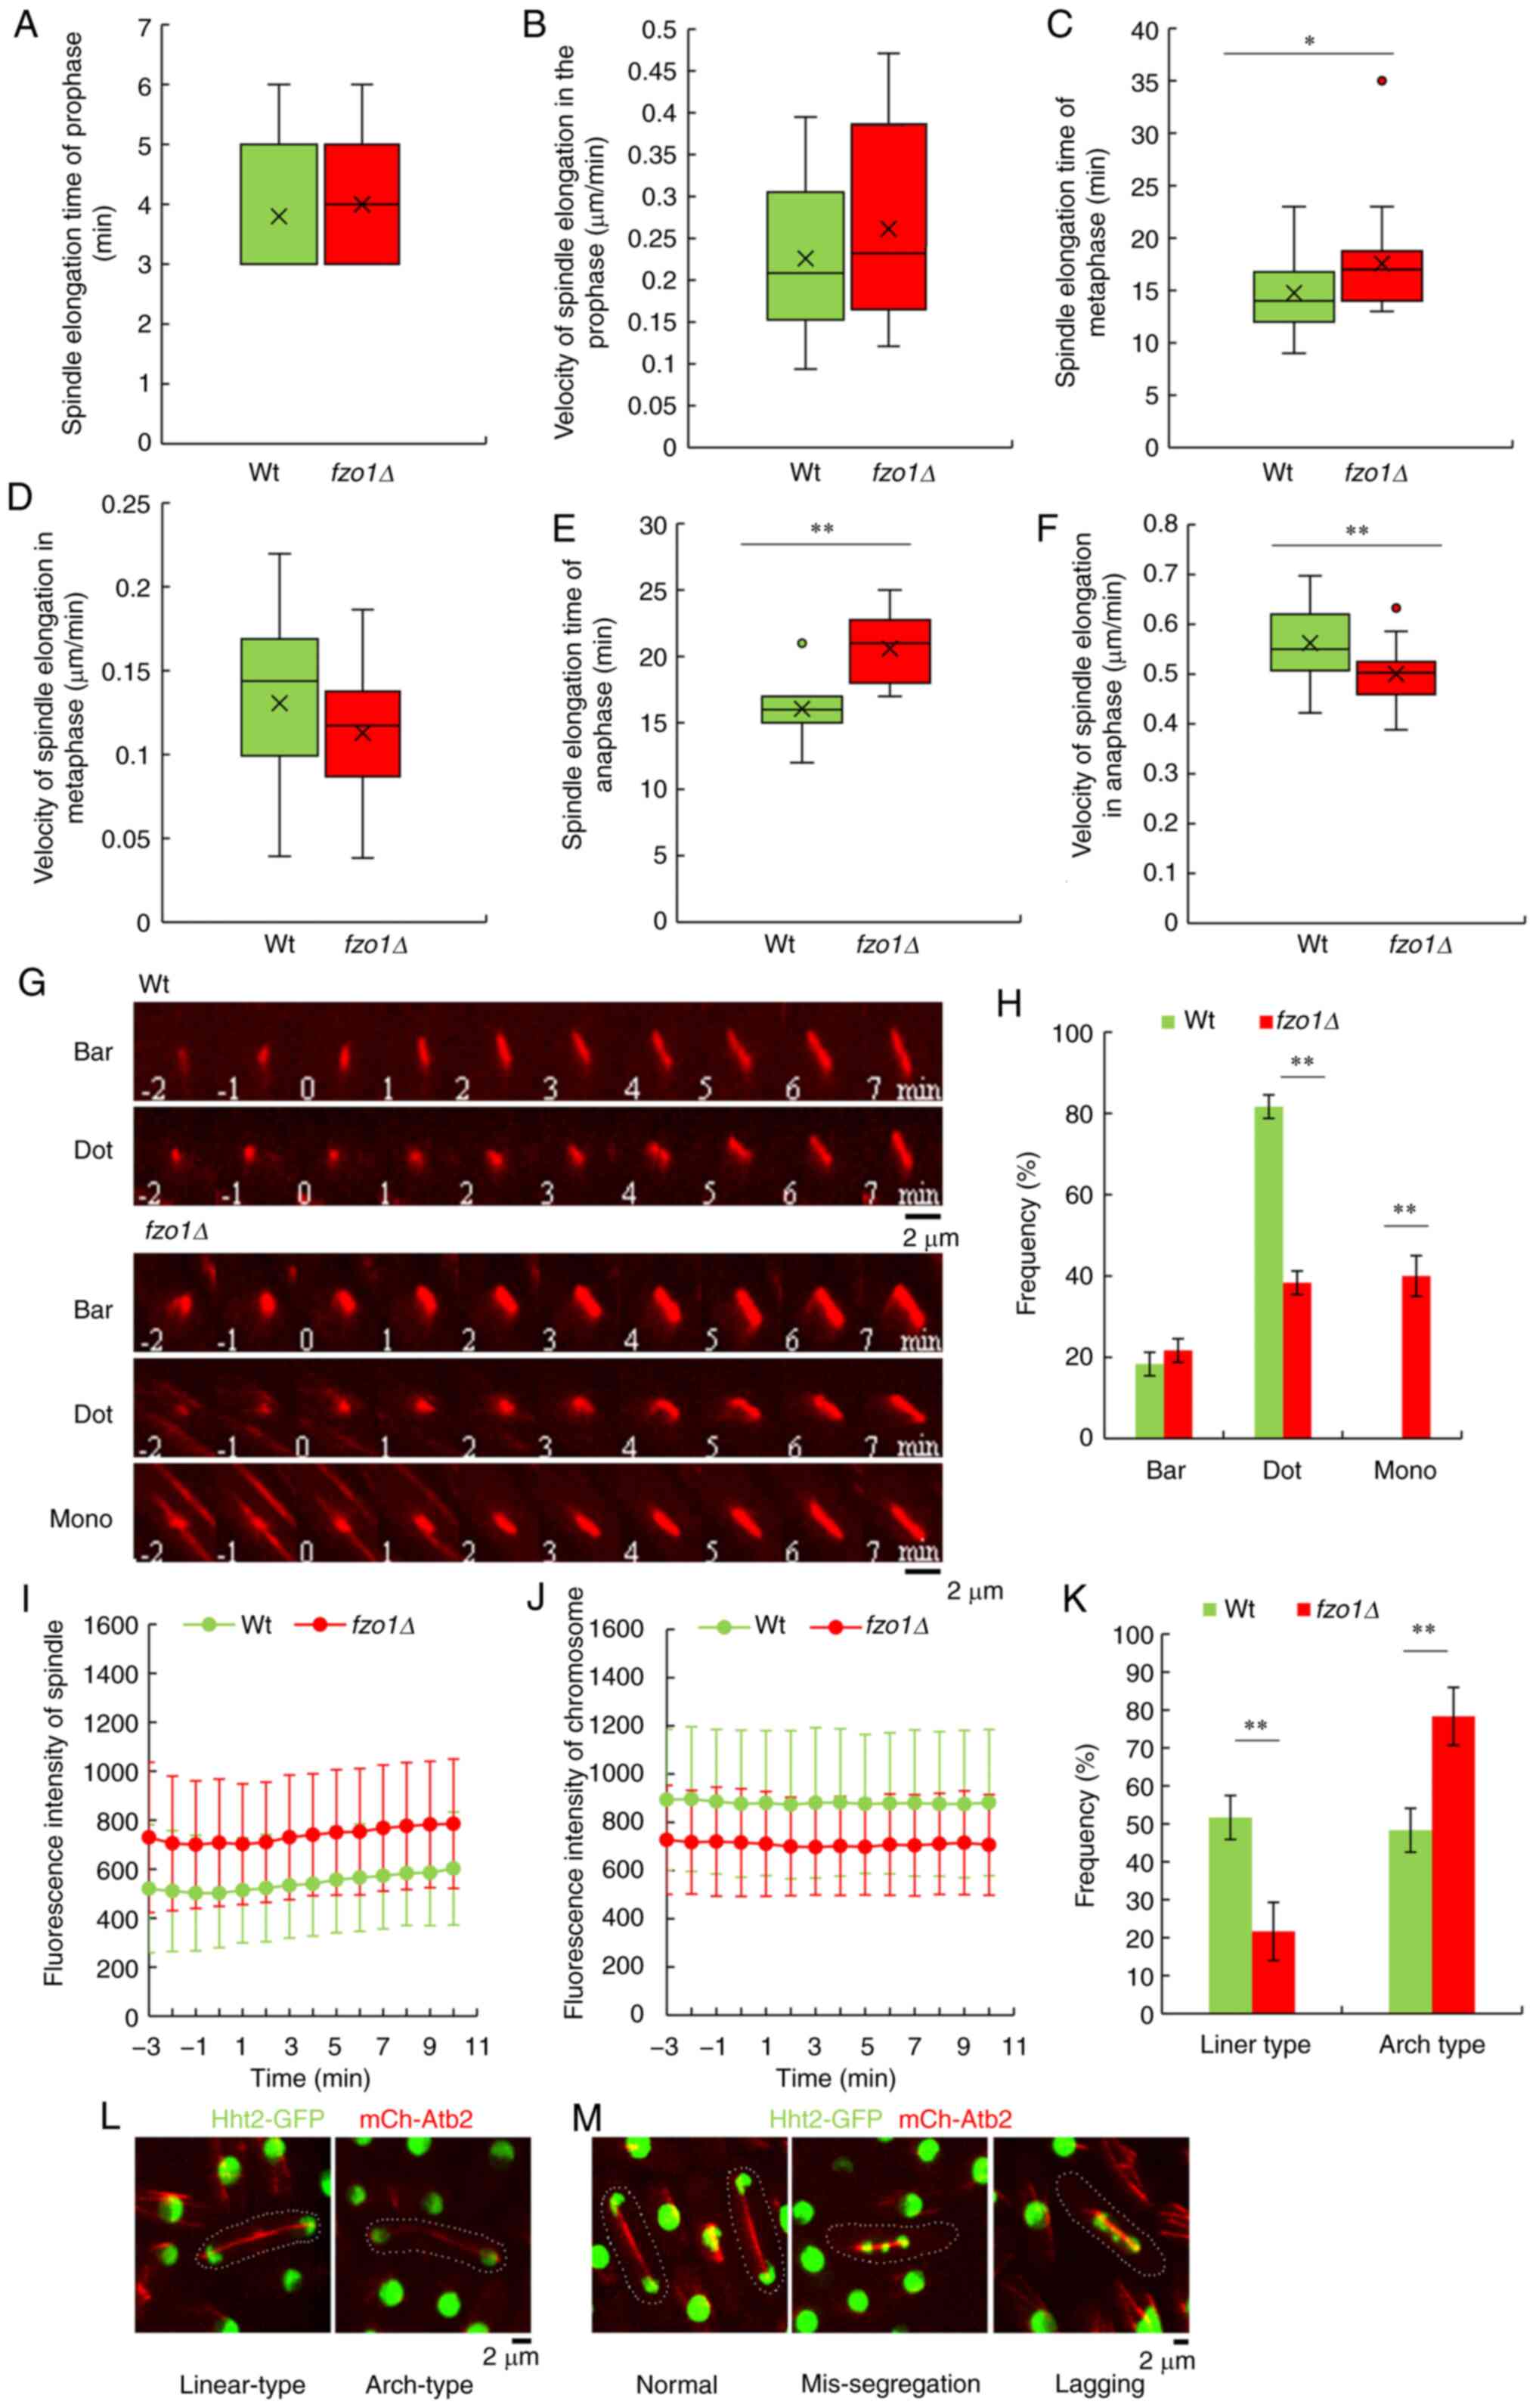
Effects of FZO1 gene deletion on spindles
and chromosomes during cell division
mCherry-Atb2 and Hht2-GFP were also used to monitor
spindle elongation and chromosome segregation dynamics in cell
mitosis. First, spindle and chromosome dynamics were analyzed
during prophase and metaphase of cell division. The spindle of
wild-type cells elongated at 0.23±0.09 µm/min during
prophase, with a prophase duration of 3.80±1.01 min prior to
reaching a steady-state metaphase; the spindle of wild-type cells
elongated at 0.13±0.05 µm/min during metaphase with a
duration of 14.75±3.43 min. In contrast, the spindle of
fzo1Δ cells elongated at 0.26±0.12 µm/min during
prophase, with a duration of 4.00±0.92 min, and the spindle
elongated at 0.11±0.04 µm/min during metaphase with a
duration of 17.55±4.98 min. The duration of metaphase was
significantly different between wild-type and fzo1Δ cells
(P<0.05; n=20; Fig. 3A-D). In
addition, the spindle of wild-type cells elongated at 0.56±0.07
µm/min during anaphase, with a duration of 16.05±2.26 min,
whereas the spindle of fzo1Δ cells elongated at 0.50±0.06
µm/min with a duration of 20.60±2.48 min (P<0.01; n=20;
Fig. 3E and F). Both of these
values were significantly different between wild-type and
fzo1Δ cells.
Spindle MT organization was markedly different in
fzo1Δ cells compared with wild-type cells (n=20; Fig. 3G). In wild-type cells, mitosis and
the disintegration of intercellular MTs occurred simultaneously. In
order to standardize the measurements of mitotic time, the starting
time of mitosis was defined as 0 min. Only 21.67±2.89% of
fzo1Δ cells exhibited bars at 0 min; the remainder exhibited
delayed formation of the bipolar spindle, with a frequency of
spindle dots (38.33±2.89%). Of note, 40±5% of fzo1Δ cells
exhibited transient MT protrusions, termed monopolar spindles
(n=20; Fig. 3H). On the contrary,
in wild-type cells, at 0 min, the assembly of MT bars (81.67±2.89%
of cells) or dots (18.33±2.89% of cells) was reliably observed.
There were significant differences in the frequency of dots and
monopolar spindles between wild-type and fzo1Δ cells
(P<0.01). The MT rapidly transforms into a bar (100% of cells),
indicative of a bipolar spindle. No wild-type cells exhibited
monopolar spindles. The results showed that spindle MT organization
was markedly affected by FZO1 gene deletion.
Studies have shown that there is a clear correlation
between the intensity of a fluorescent protein and expression of
the other gene in the construct, and that fluorescent intensity can
indirectly reflect the expression level of the attached gene
product (16,17). Analysis of fluorescence intensity
of the spindle at prophase and metaphase showed that the
fluorescence intensity of the spindle in fzo1Δ cells was
notably stronger compared with in wild-type cells, whereas
fluores-cence intensity of the chromosome at prophase and metaphase
was notably weaker in fzo1Δ cells compared with in wild-type
cells (n=20; Fig. 3I and J),
which indicated that the gene expression levels of the spindle (as
indicated by tubulin α2) were upregulated and those of the
chromosome (as indicated by histone H3) were downregulated
following FZO1 gene deletion.
The fidelity of chromosome segregation depends
substantially on the appropriate attachment of MTs to the
centromere in metaphase (15).
Chromosome segregation depends on the assembly of spindles, which
are MT-based structures that effectively capture and separate
sister chromatids during cell mitosis. There is association between
mutations that change the length of metaphase stable spindles and
chromosome segregation defects (15). Live-cell imaging was performed on
strains expressing mCherry-Atb2 and Hht2-GFP. It was observed that
in wild-type cells, the spindle broke in the form of linear-type
(51.67±5.77%) and arch-type (48.33±5.77%) structures; however, in
fzo1Δ cells, the frequency of the two forms were 21.67±7.64
and 78.33±7.64%, respectively (P<0.01, n=20) (Fig. 3K and L), which were both
significantly different compared with wild-type cells. The results
showed that the loss of FZO1 gene also led to abnormal
spindle breakage. There were three distinct chromosome behaviors
observed: Normal (100% of wild-type, 65% of fzo1Δ), the
chromosomes were separated to opposite poles during anaphase;
lagging (30%), the chromosomes were segregated to one pole wrongly,
but the chromosome corrected and separated to the opposite poles
eventually; and mis-segregation (5%), the chromosomes stayed at one
pole and never separated to opposite poles (Fig. 3M). The results indicated that the
loss of FZO1 contributed to metaphase spindle length
maintenance deficiencies and chromosome segregation
deficiencies.
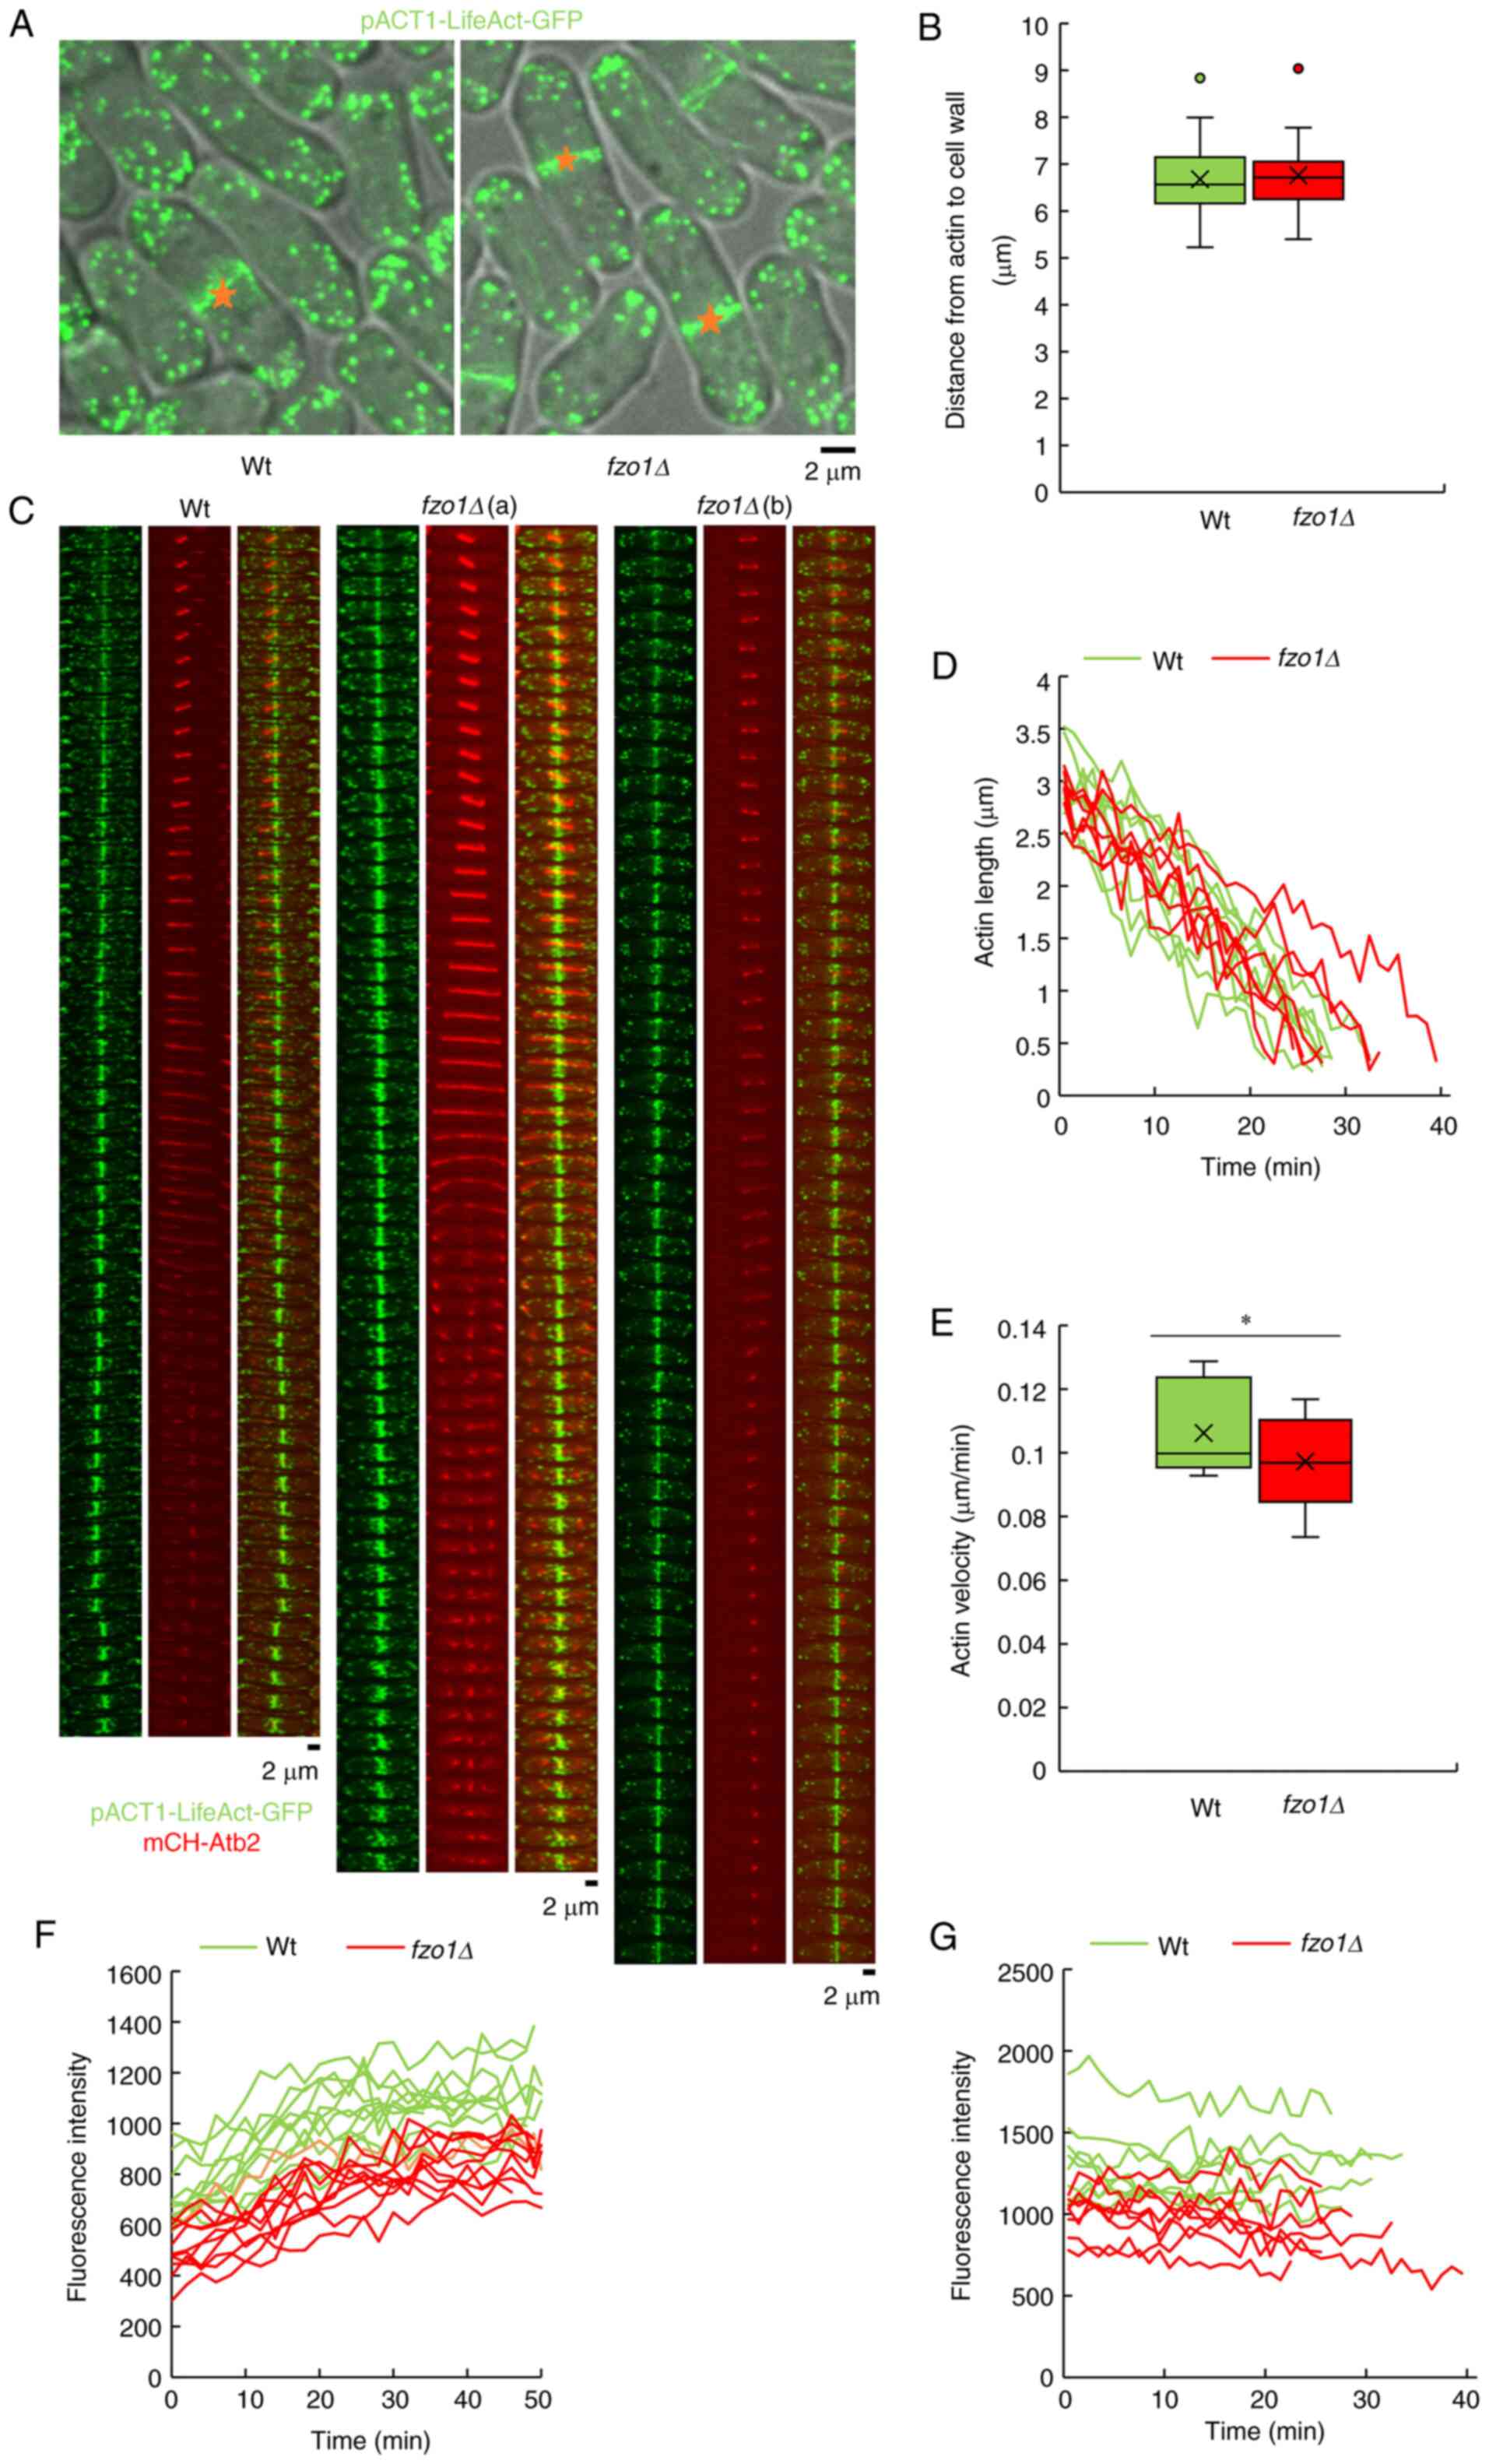
Effects of FZO1 gene deletion on actin in
mitosis
mCherry-Atb2 and pACT1-LifeAct-GFP were used to
detect actin contraction dynamics in cell mitosis. In rod-shaped
division, the cell only grows at the top of the cell, and its
diameter remains unchanged (18).
Therefore, when the cell stops growing, the final cell size can be
quantified by measuring the cell length during mitosis. To
investigate the impact of FZO1 gene deletion on cell size
during mitosis, the length from the splitting point to the cell
wall was measured. The results showed that the distance in
wild-type and fzo1Δ cells was 6.68±0.88 and 6.76±0.85
µm, respectively (Fig.
4B). The results showed that FZO1 gene deletion had no
significant effect on cell size during mitosis. The morphology of
actin did not notably change in the two groups (Fig. 4A); however, during mitosis, the
contraction rate of actin varied between wild-type and fzo1Δ
cells. The contraction time of actin in most mutant cells was the
same as that in wild-type cells, but it took longer for a small
portion of the mutant cells to complete contraction (Fig. 4C and D). Statistical analysis of
actin contraction rates showed that the actin contraction rate in
wild-type and fzo1Δ cells was 0.11±0.01 and 0.10±0.02
µm/min, respectively, which was significantly different
(P<0.01; Fig. 4E). The
fluorescence intensity of actin during mitosis was increased in
wild-type compared with in fzo1Δ cells during both anaphase
and telophase (Fig. 4F and
G).
Effect of FZO1 gene deletion on coenzymes
in energy metabolism
The tricarboxylic acid cycle, glycolysis and
oxidative phosphorylation pathways are the central pathways of cell
energy production (19). In order
to further investigate energy metabolism in fzo1Δ cells,
coenzymes and energy metabolites involved in in the tricarboxylic
acid cycle, glycolysis and oxidative phosphorylation were detected
via LC-MS. The results showed that the relative contents of
nicotinamide adenine dinucleotide phosphate (NADPH) and
nicotinamide adenine dinucleotide (NAD+) in the
wild-type cells were 16.37±0.26 and 25.85±0.08, respectively, while
those in fzo1Δ cells were 15.24±0.16 and 25.45±0.03,
respectively, which were significantly different (P<0.01;
Fig. 5A and B). The relative
contents of nicotinamide adenine dinucleotide phosphate
(NADP+) and acetyl coenzyme A (acetyl-CoA) in wild-type
cells were 23.44±0.37 and 19.68±0.50, respectively, while those in
fzo1Δ cells were 22.38±0.24 and 18.20±0.03, respectively,
which again were significantly different (P<0.05; Fig. 5C and D). However, there were not
significant differences between the two groups in the relative
contents of intermediate metabolites such as flavin mononucleotide
and thiamine pyrophosphate. The results indicated that FZO1
gene deletion affected the relative contents of NADPH,
NAD+, NADP+ and acetyl-CoA, interfering with
the tricarboxylic acid cycle, glycolysis and oxidative
phosphorylation.
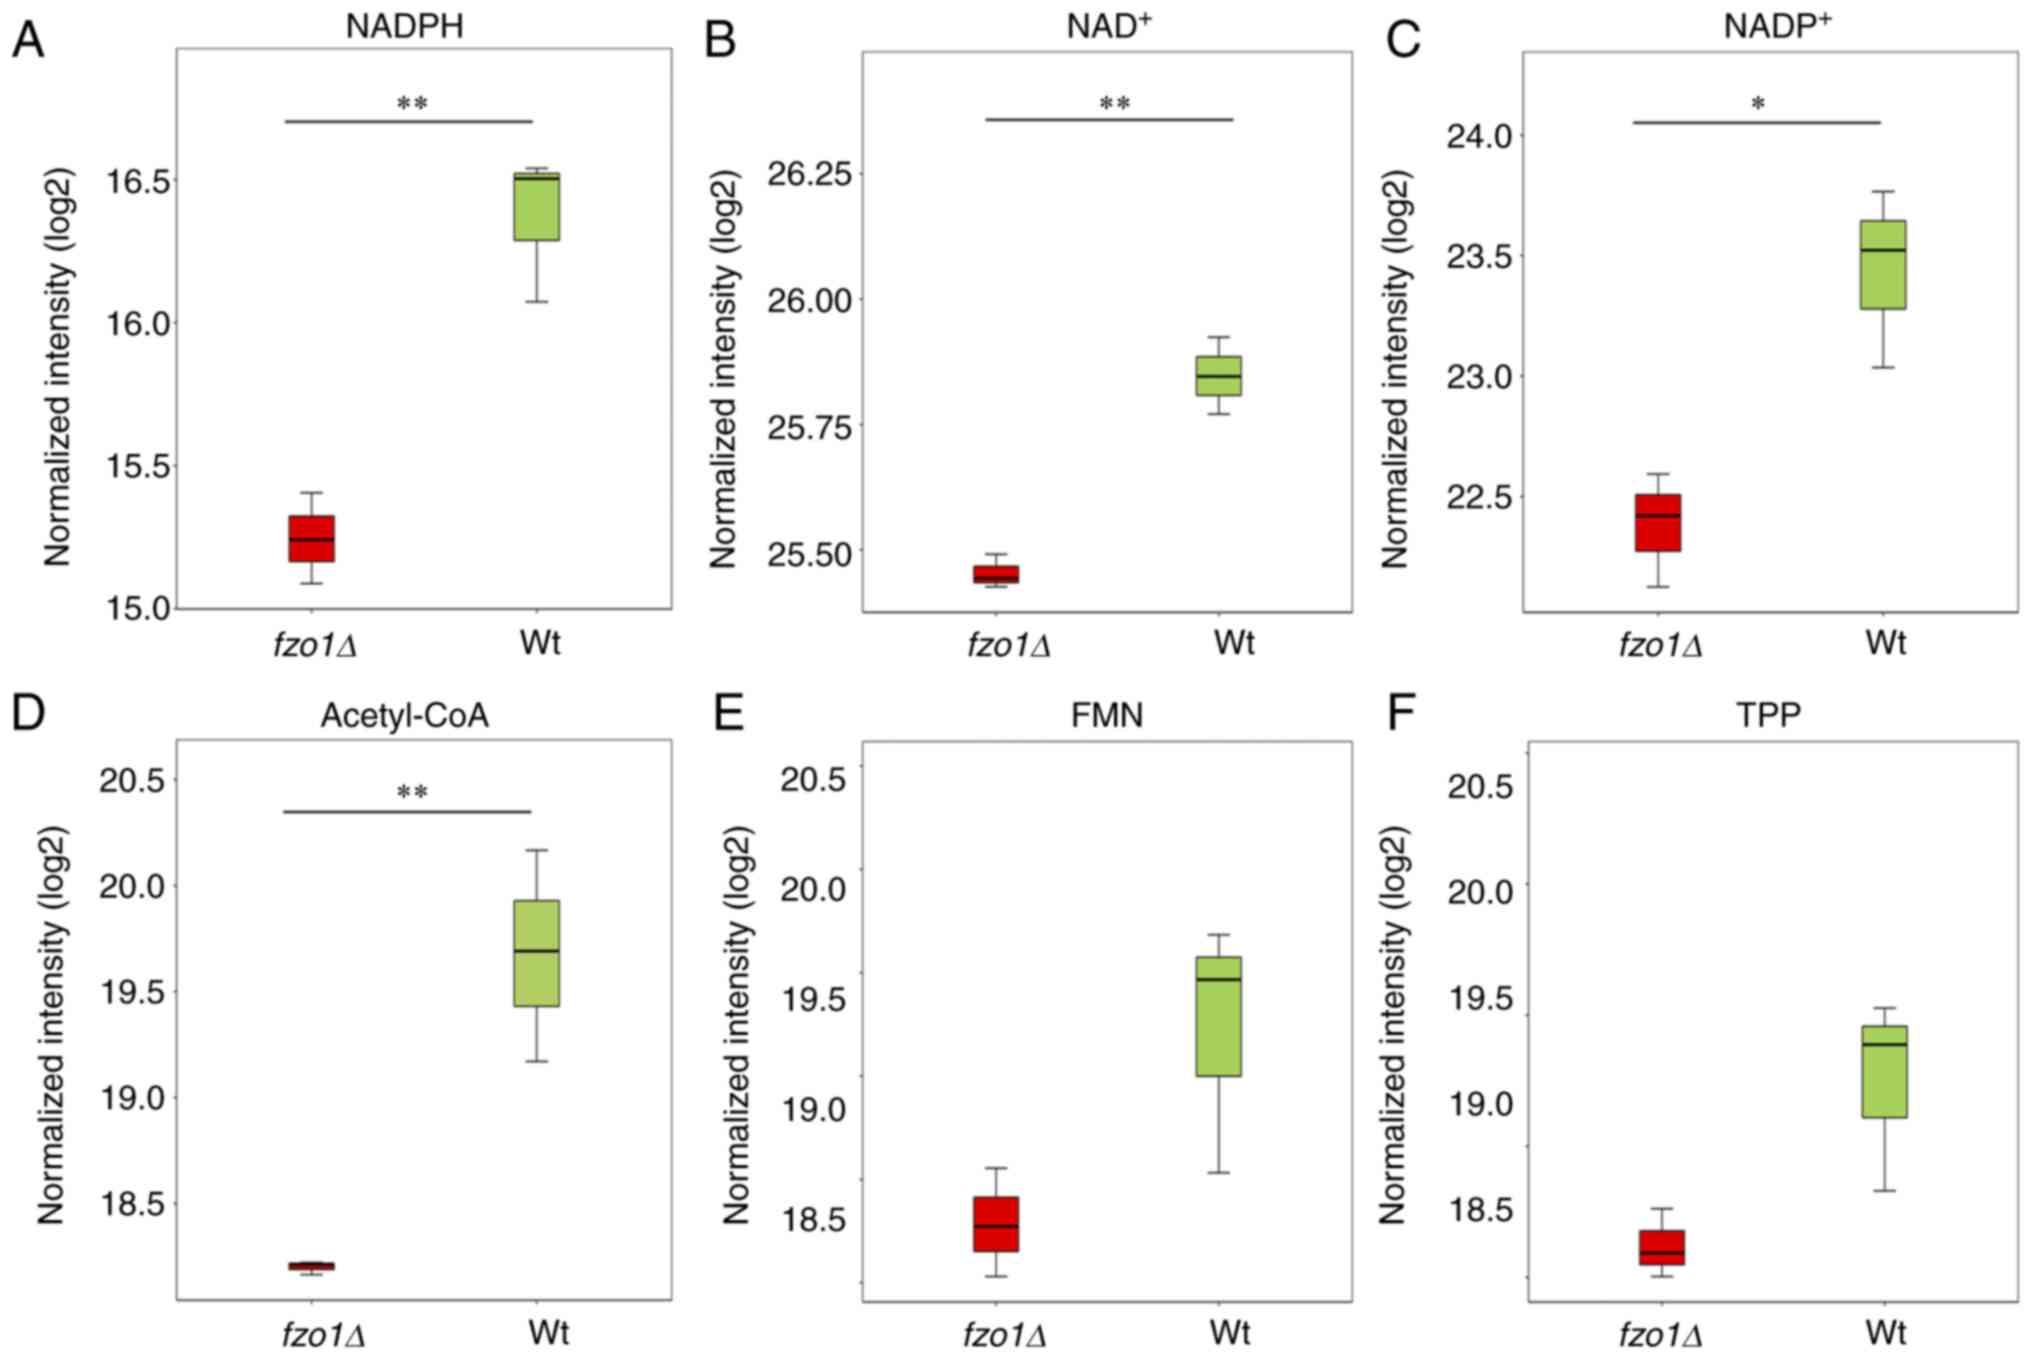 | Figure 5Effect of FZO1 gene deletion
on coenzymes in energy metabolism. Relative contents of (A) NADPH,
(B) NAD+, (C) NADP+, (D) acetyl-CoA, (E) FMN
and (F) TPP in Wt and fzo1Δ cells (n=3 experimental
repeats). *P<0.05, **P<0.01.
Acetyl-CoA, acetyl coenzyme A; FMN, flavin mononucleo-tide;
fzo, fuzzy onions; Hht2-GFP, histone H3-green fluorescent
protein; mCherry Atb2, mCherry-tubulin α2; NAD, nicotinamide
adenine dinucleotide; NADP/NADPH, nicotinamide adenine dinucleotide
phosphate; TPP, thiamine pyrophosphate; Wt, wild-type. |
Effect of FZO1 gene deletion on
intermediate metabolites in energy metabolism
Analysis of intermediate metabolites in energy
metabolism showed that the relative contents of L-malic acid,
isocitrate and citrate(1-) in the wild-type cells were 23.55±0.47,
17.17±0.40 and 23.40±0.33, respectively, whereas those in
fzo1Δ cells were 22.29±0.41, 16.09±0.17 and 21.84±0.24,
respectively; these three intermediate metabolites were found in
significantly lower levels in fzo1Δ cells compared with in
wild-type cells (P<0.05; Fig. 6A,
B and D). Additionally, the relative contents of
cis-aconitate were significantly reduced in fzo1Δ
cells compared with in wild-type cells (P<0.01; Fig. 6C). The results indicated that
FZO1 gene deletion affected the production of tricarboxylic
acid cycle and glycolysis intermediates. There were not significant
differences in the levels of other analyzed intermediates,
including α-ketoglutarate, oxaloacetate and photoshoenol-pyruvate
(Fig. 6E-L).
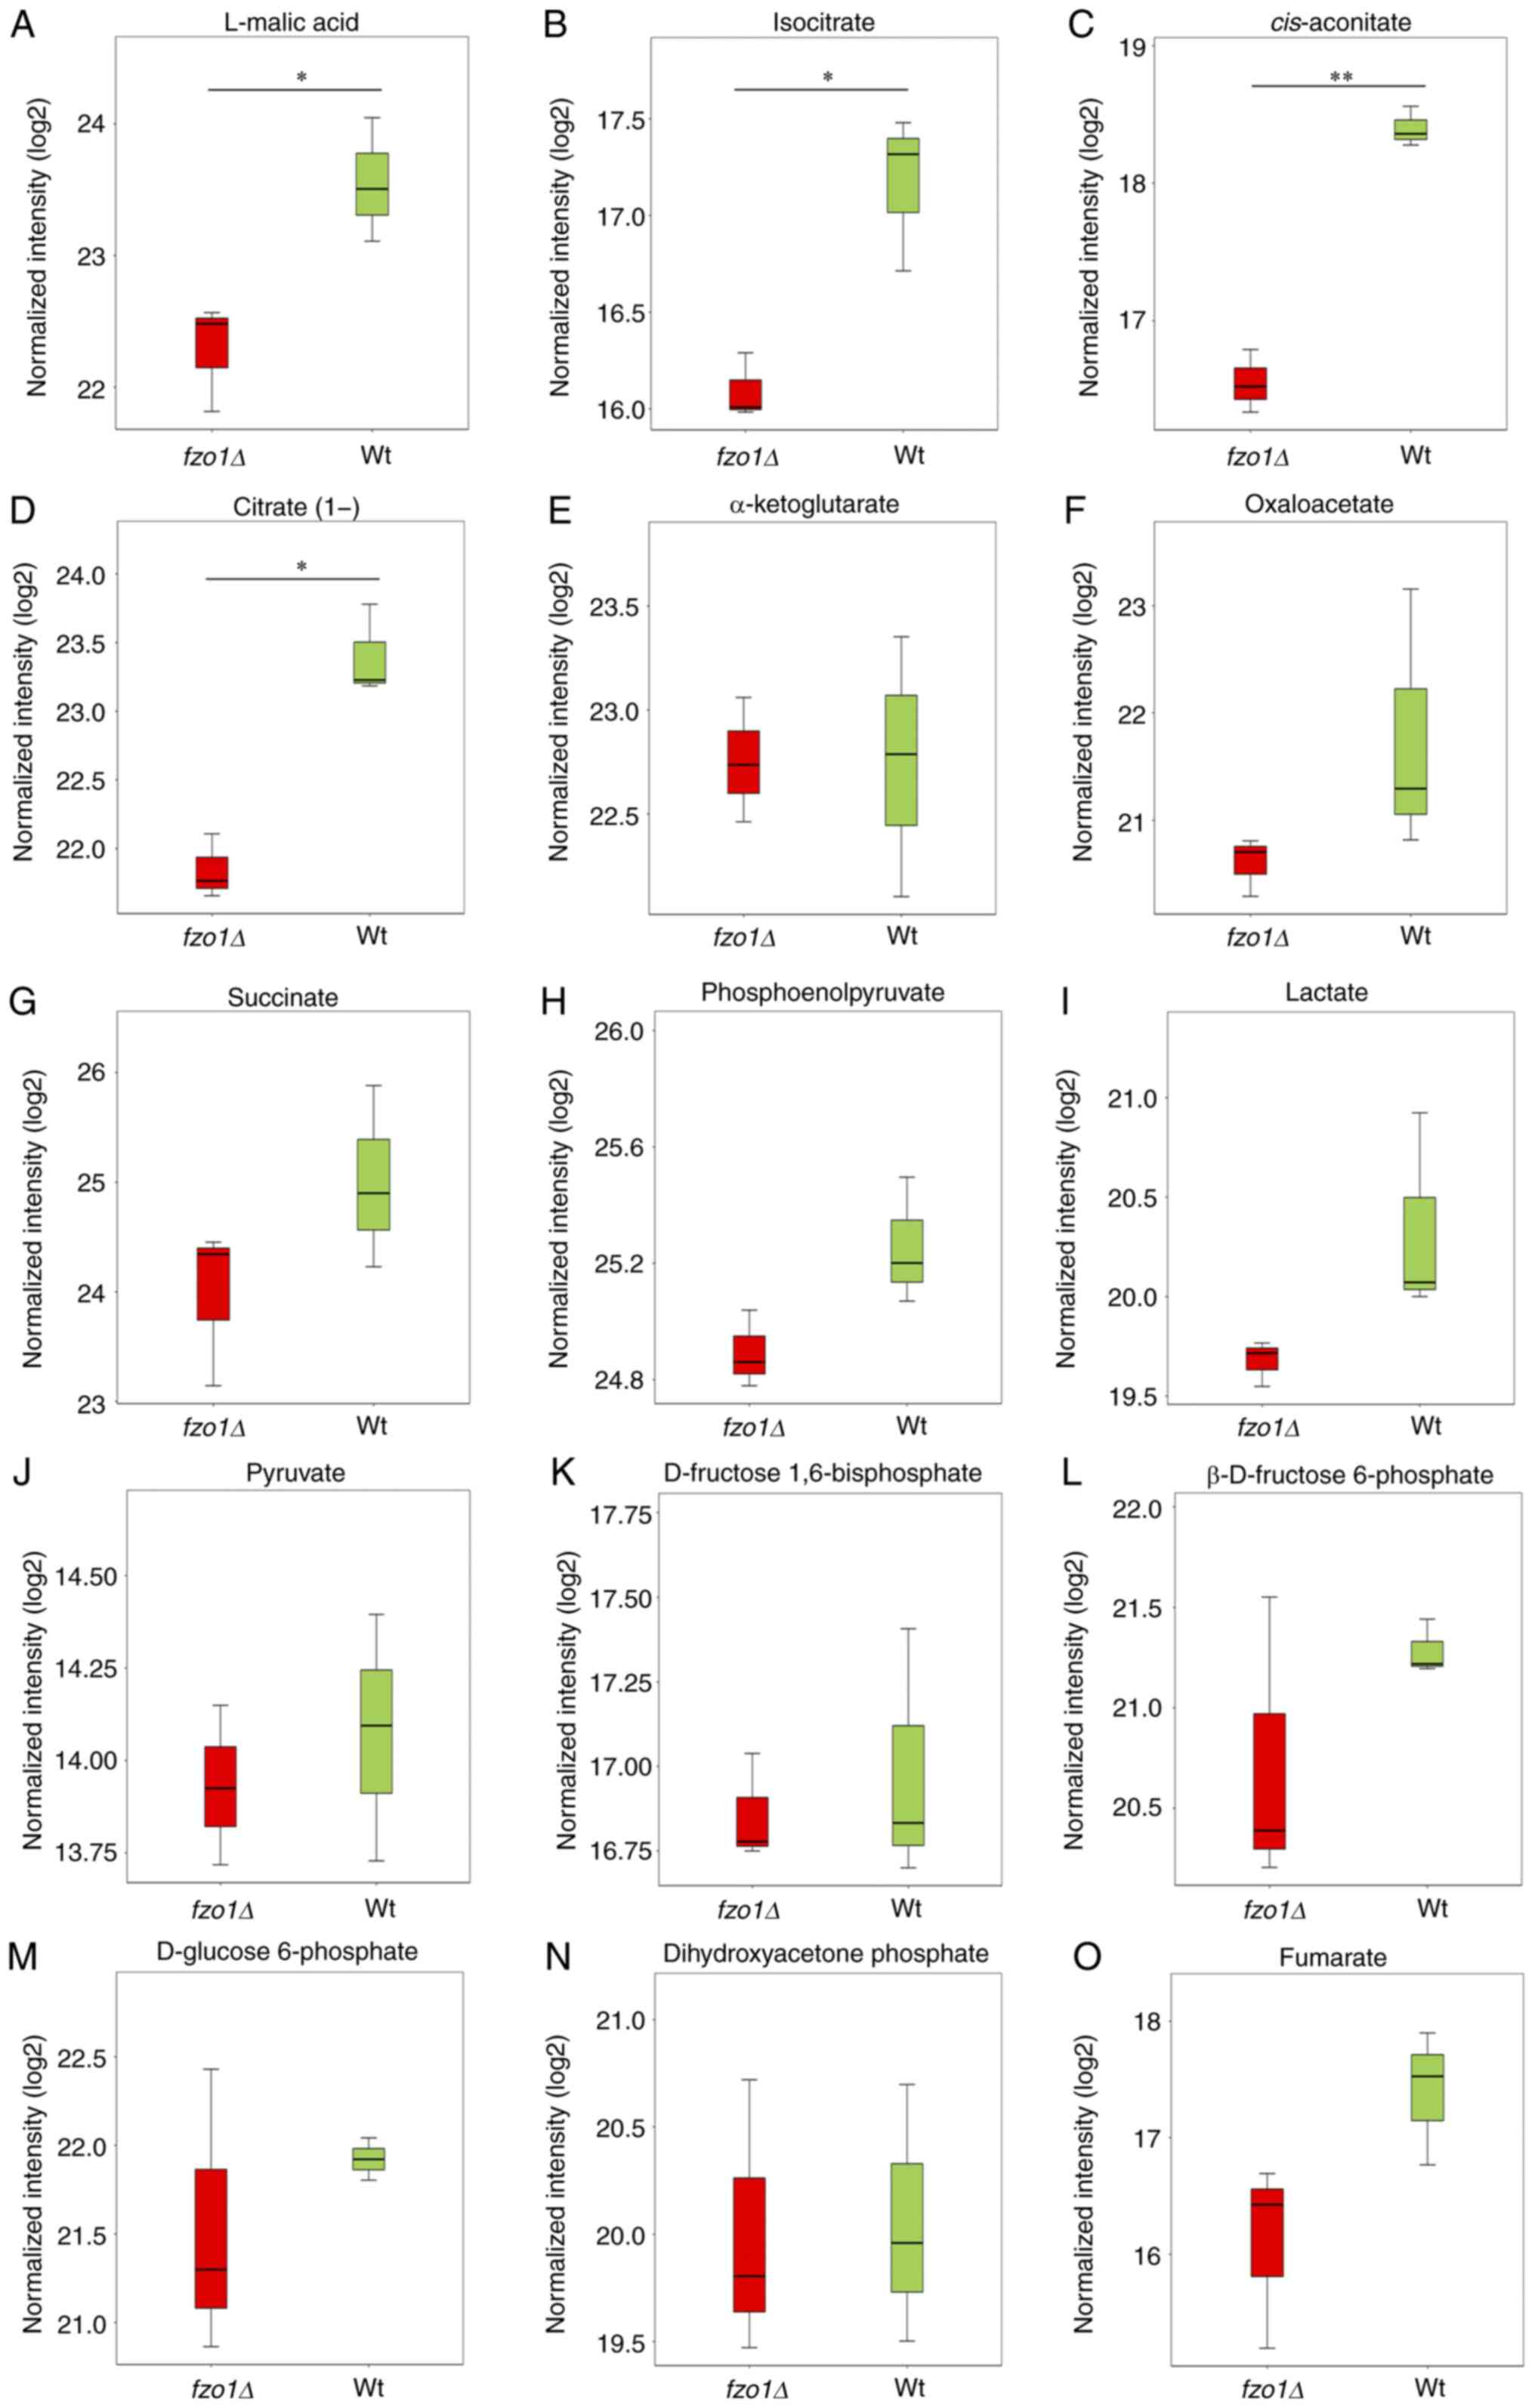 | Figure 6Effect of FZO1 gene deletion
on intermediate metabolites of energy metabolism. Relative contents
of (A) L-malic acid, (B) isocitrate, (C) cis-aconi-tate, (D)
citrate(1-), (E) α-ketoglutarate, (F) oxaloacetate, (G) succinate,
(H) phosphoenolpyruvate, (I) lactate, (J) pyruvate, (K) D-fructose
1,6-bisphosphate, (L) β-D-fructose 6-phosphate, (M) D-glucose
6-phosphate, (N) dihydroxyacetone phosphate and (O) fumarate in Wt
and fzo1Δ cells (n=3 experimental repeat).
*P<0.05, **P<0.01. fzo, fuzzy
onions; Wt, wild-type. |
Effect of FZO1 gene deletion on energy in
energy metabolism
The aim of cellular energy metabolism is to provide
energy for cell growth and division. The results revealed that the
relative contents of adenosine triphosphate (ATP), guanosine
triphosphate (GTP), adenosine diphosphate (ADP) and adenosine
monophosphate (AMP) in wild-type cells were 21.02±0.17, 16.95±0.29,
24.79±0.41 and 26.35±0.12, respectively, whereas the relative
contents of those products in fzo1Δ cells were 20.74±0.12,
16.70±0.16, 24.36±0.26 and 26.34±0.02, respectively cells (Fig. 7A-D). Of note, the contents of
guanosine monophosphate (GMP) and guanosine diphosphate (GDP) in
wild-type cells (25.07±0.27 and 20.98±0.14, respectively) were
significantly increased compared with those in fzo1Δ cells
(24.28±0.17 and 20.45±0.19, respectively; P<0.05; Fig. 7E and F). The results suggested
suggested that FZO1 gene deletion affected the production of
GMP and GDP, without significantly affecting GTP and ATP
production, in yeast cells.
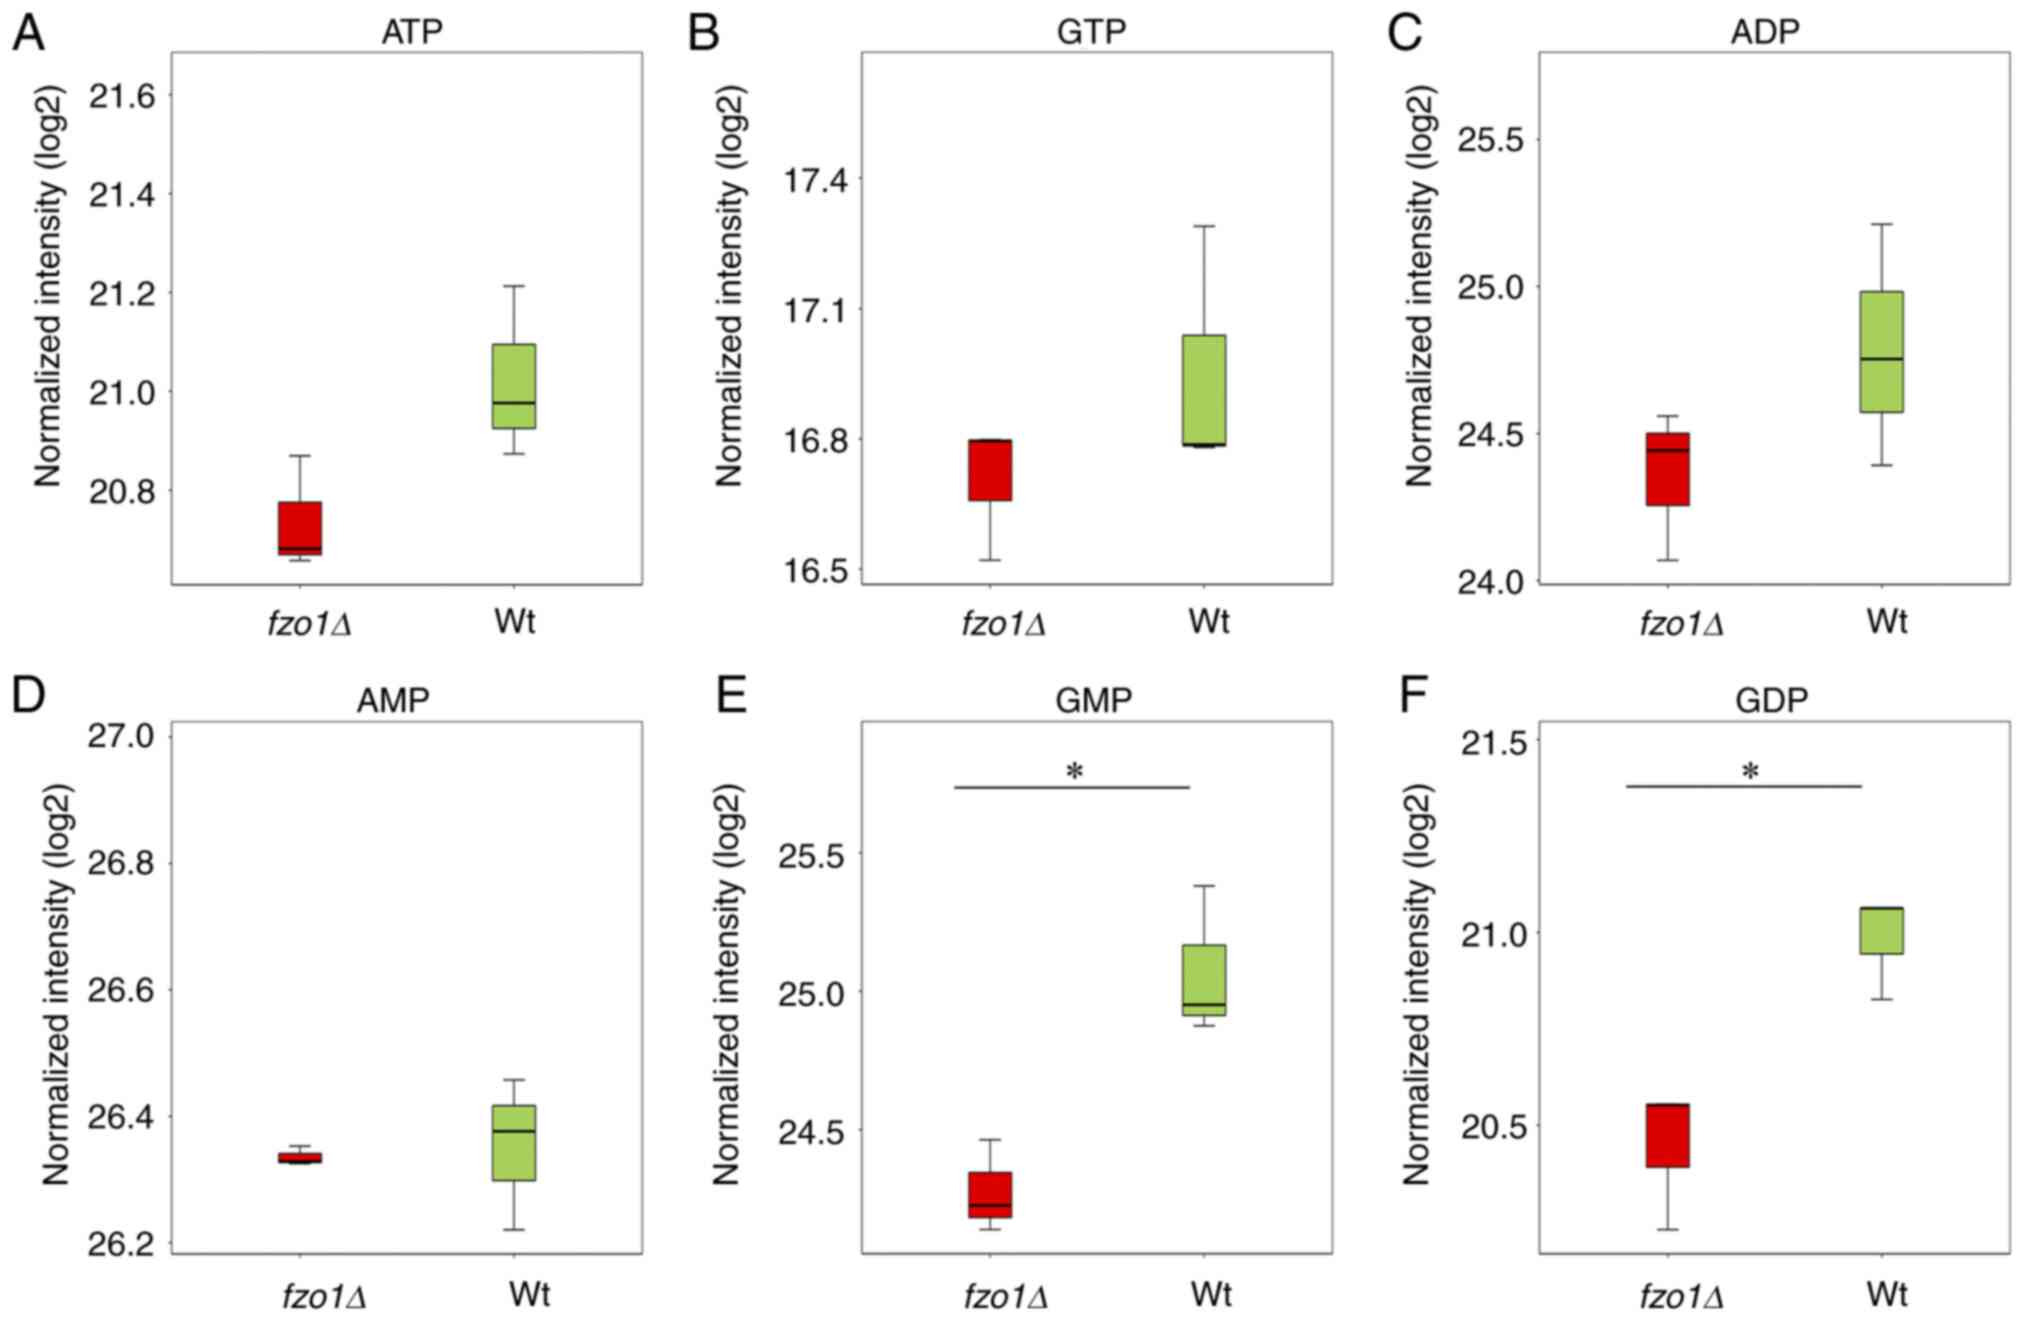 | Figure 7Effect of FZO1 gene deletion
on energy production. Relative contents of (A) ATP, (B) GTP, (C)
ADP, (D) AMP, (E) GMP and (F) GDP in Wt and fzo1Δ cells (n=3
experimental repeat). *P<0.05. ADP, adenosine
diphosphate; AMP, adenosine monophosphate; ATP, adenosine
triphosphate; GDP, guanosine diphosphate; GMP, guanosine
monophosphate; GTP, guanosine triphosphate; fzo, fuzzy
onions; Wt, wild-type. |
Discussion
Metaphase is the stage of mitosis in which
chromosomes attach to bipolar spindles and segregate directionally
at anaphase (20). MTs and their
related motors play an important role in nuclear migration, cell
division, polarity and sexual reproduction (15). In different cell types, the
metaphase spindle has a characteristic constant length (21). The present study showed that the
FZO1 gene deletion can affect the growth rate and duration
of spindle activity at the metaphase and anaphase. Additionally,
spindle MT organization differed in fzo1Δ cells compared
with wild-type cells. Spindle length in metaphase is regulated by
pulling and pushing forces produced by spindle MTs, as well as
their interactions with motors and MT-associated proteins (MAPs)
(15). Spindle length is
important for the fidelity of chromosome segregation, as in the
metaphase, cells with shorter or longer spindles than the normal
length, which may occur due to inhibition or deletion of mitotic
motors or MAPs, exhibit chromosome segregation defects (21). However, the present study did not
involve the inhibition or deletion of mitotic motors or MAPs.
Therefore, it is proposed that the loss of FZO1 results in
mitochondrial dynamics deficiencies, which may contribute to
spindle maintenance deficiencies and abnormal spindle breakage in
the anaphase.
When fusion is dominant, mitochondria exist in the
form of interconnected filaments; when division is dominant,
mitochondria exist in the form of isolated dots (6). Mitomycin fusion protein (Mfn)1/2,
Opa1 and Drp-1 are the main regulators of mitochondrial morphology
(22). Mfn1 is a target of that
can regulate the fusion of mitochondria by altering protein
conformations (23). Opa1 is a
GTP enzyme-related protein; it possesses a mitochondrial targeting
sequence, which can guide proteins into the inter intimal and
mitochondrial cristae (24). It
regulates cytochrome c and mitochondrial function by
regulating and reshaping the shape of mitochondrial cristae
(23). There are various types of
mitochondrial dysfunction observed in Opa1 mutant cells, including
mitochondrial cristae structural disorder, changes in mitochondrial
network dynamics, cell proliferation deficiencies and respiratory
capacity deficiencies (25).
Drp-1 is a pro-fission molecule, which also participates in the
remodeling of cytochrome c; Drp-1 deletion can affect
mitochondrion fission and function (26), which is also fatal to embryo
development (27). The fusion of
the mitochondrial OM is regulated by the FZO1 gene (6). In the present study, the
mitochondrial morphology results indicated that the mitochondria
were fragmented and tubular in wild-type cells, but existed in a
state of accumulation in fzo1Δ cells, which consistent with
previous results (28).
In the process of energy production in mitochondria,
abnormalities in coenzyme activity or intermediate metabolites such
as NADPH, NAD+, NADP+ and acetyl-CoA may lead
to cellular dysfunction. Decreased NAD+ content may lead
to nuclear and mitochondrial dysfunction, and is associated with
numerous age-related diseases, such as Alzheimer's disease
(29). Acetyl-CoA, as a carbon
source consumed during oxidation in the dicarboxylic acid cycle, is
one of the most important substrates in the tricarboxylic acid
cycle (30). Alterations in
acetyl-CoA levels affect the activity of citrate(1-) synthetase
(31). Acetyl-CoA not only plays
an important role in the tricarboxylic acid cycle, but also
regulates the function and adaptability of neurons and non-neuronal
brain cells (31). Intermediate
metabolites in energy metabolism also play important roles in
physiological and biochemical processes. For example, citric acid
and L-malic acid are important intermediates in the tricarboxylic
acid cycle, and have protective effects on myocardial
ischemia-reperfusion injury (32); the potential mechanism may be
associated with anti-inflammatory and anti-platelet aggregation
actions, alongside direct myocardial protection (32). Isocitrate has a role in treating
acute inflammatory anemia in mouse models (33). In the present study, it was shown
that the relative contents of NADPH, NAD+,
NADP+ and acetyl-CoA in fzo1Δ cells were
significantly reduced compared with in wild-type cells.
Additionally, relative levels of intermediate metabolites including
L-malic acid, cis-aconitate, citrate(1-) and isocitrate were
significantly reduced in fzo1Δ cells compared with in
wild-type cells. These results indicated that the relative content
of important coenzymes and intermediate metabolites involved in the
tricarboxylic acid cycle were substantially affected by the
fzo1Δ mutation.
The production of mitochondrial energy is essential
for cell division, as well as other basic functions in the cell,
including the regulation of cell volume, solute concentration and
cellular architecture (34). At
different stages of the cell cycle, energy levels vary, indicating
that there is a relationship between energy abundance and the
ability of cells to enter the new cell cycle, which supports the
hypothesis that mitochondria play a critical role in the regulation
of cell cycle progression (35).
The specific mechanism connecting cell cycle regulation and
mitochondria is not clear; studies have shown that low-energy cell
cycle checkpoints regulate energy capacity before further rounds of
cell division (36). Although
there are reports that abnormal mitochondrion division and fusion
cause the mitochondrial network to become scattered, leading to
deficiencies in ATP production (37), in the present study, the relative
contents of ATP, GTP, ADP and AMP were not significantly different
between wild-type and fzo1Δ cells. Conversely, the relative
contents of GMP and GDP in fzo1Δ cells were significant
reduced compared with in wild-type cells.
The present study indicated that the loss of
FZO1 gene resulted in mitochondrial dynamics deficiencies,
leading to deficiencies in spindle maintenance, chromosome
segregation, spindle breakage, actin contraction, and coenzyme and
intermediate metabolite levels. However, there is much further
research required to fully understand how FZO1 regulates MT,
chromosome and actin dynamics.
Acknowledgments
The authors wish to thank the Associate Professor
Phong Tran (University of Pennsylvania) for donating yeast strains,
and Shanghai Applied Protein Technology Co., Ltd for analyzing the
liquid chromatography-mass spectrometry data.
Funding
This study was supported by the Sichuan Province
Science and Technology Support Project (grant nos. 2018NZ0055,
2018JY0087 and 16cZ0018), the Nanchong City Science and Technology
Project (grant no. 16YFZJ0043), the China West Normal University
Science and Technology Program (grant nos. cXTd2017-3, 17Yc136,
17Yc328, 17Yc329 and 17c039) and China Scholarship Council (grant
nos. 201708510006 and 201708510007).
Availability of data and materials
The datasets used and/or analyzed during the current
study are available from the corresponding author on reasonable
request.
Authors' contributions
YH conceived and designed the experiments of the
present study. YH, XD, RY and XT performed the experiments and
acquired data. YH and RY drafted the manuscript and revised it
critically. All authors read and approved the final manuscript.
Ethics approval and consent to
participate
Not applicable.
Patient consent for publication
Not applicable.
Competing interests
The authors declare that they have no competing
interests.
References
|
1
|
Bohnert M, Pfanner N and van der Laan M:
Mitochondrial machineries for insertion of membrane proteins. Curr
Opin Struct Biol. 33:92–102. 2015. View Article : Google Scholar : PubMed/NCBI
|
|
2
|
Jeong SY and Seol DW: The role of
mitochondria in apoptosis. BMB Rep. 41:11–22. 2008. View Article : Google Scholar : PubMed/NCBI
|
|
3
|
Lackner LL: Shaping the dynamic
mitochondrial network. BMC Biol. 12:352014. View Article : Google Scholar : PubMed/NCBI
|
|
4
|
El-Hattab AW, Suleiman J, Almannai M and
Scaglia F: Mitochondrial dynamics: Biological roles, molecular
machinery, and related diseases. Mol Genet Metab. 125:315–321.
2018. View Article : Google Scholar : PubMed/NCBI
|
|
5
|
Hermann GJ, Thatcher JW, Mills JP, Hales
KG, Fuller MT, Nunnari J and Shaw JM: Mitochondrial fusion in yeast
requires the transmembrane GTPase Fzo1p. J Cell Biol. 143:359–373.
1998. View Article : Google Scholar : PubMed/NCBI
|
|
6
|
Moore AS, Wong YC, Simpson CL and Holzbaur
ELF: Dynamic actin cycling through mitochondrial subpopulations
locally regulates the fission-fusion balance within mitochondrial
networks. Nat Commun. 7:128862016. View Article : Google Scholar : PubMed/NCBI
|
|
7
|
Harder Z, Zunino R and McBride H: Sumo1
conjugates mitochondrial substrates and participates in
mitochondrial fission. Curr Biol. 14:340–345. 2004. View Article : Google Scholar : PubMed/NCBI
|
|
8
|
Hales KG and Fuller MT: Developmentally
regulated mitochondrial fusion mediated by a conserved, novel,
predicted GTPase. Cell. 90:121–129. 1997. View Article : Google Scholar : PubMed/NCBI
|
|
9
|
Rapaport D, Brunner M, Neupert W and
Westermann B: Fzo1p is a mitochondrial outer membrane protein
essential for the biogenesis of functional mitochondria
insaccharomyces cerevisiae. J Biol Chem. 273:20150–20155. 1998.
View Article : Google Scholar : PubMed/NCBI
|
|
10
|
Santos A, Wernersson R and Jensen LJ:
Cyclebase 3.0: A multi-organism database on cell-cycle regulation
and phenotypes. Nucleic Acids Res. 43:D1140–D1144. 2015. View Article : Google Scholar :
|
|
11
|
Li C, Bai J, Hao X, Zhang S, Hu Y, Zhang
X, Yuan W, Hu L, Cheng T, Zetterberg A, et al: Multi-gene
fluorescence in situ hybridization to detect cell cycle gene copy
number aberrations in young breast cancer patients. Cell Cycle.
13:1299–1305. 2014. View Article : Google Scholar : PubMed/NCBI
|
|
12
|
Gómez EB and Forsburg SL: Analysis of the
fission yeast schizo-saccharomyces pombe cell cycle. Methods Mol
Biol. 241:93–111. 2004.
|
|
13
|
Forsburg SL and Rhind N: Basic methods for
fission yeast. Yeast. 23:173–183. 2006. View Article : Google Scholar : PubMed/NCBI
|
|
14
|
Tran PT, Paoletti A and Chang F: Imaging
green fluorescent protein fusions in living fission yeast cells.
Methods. 33:220–225. 2004. View Article : Google Scholar : PubMed/NCBI
|
|
15
|
Rincon SA, Lamson A, Blackwell R,
Syrovatkina V, Fraisier V, Paoletti A, Betterton MD and Tran PT:
Kinesin-5-independent mitotic spindle assembly requires the
antiparallel microtubule crosslinker Ase1 in fission yeast. Nat
Commun. 8:152862017. View Article : Google Scholar : PubMed/NCBI
|
|
16
|
Okada S, Leda M, Hanna J, Savage NS, Bi E
and Goryachev AB: Daughter cell identity emerges from the interplay
of Cdc42, septins, and exocytosis. Dev Cell. 26:148–161. 2013.
View Article : Google Scholar : PubMed/NCBI
|
|
17
|
Alieva RR, Belogurova NV, Petrova AS and
Kudryasheva NS: Effects of alcohols on fluorescence intensity and
color of a discharged-obelin-based biomarker. Anal Bioanal Chem.
406:2965–2974. 2014. View Article : Google Scholar : PubMed/NCBI
|
|
18
|
Lee ME, Rusin SF, Jenkins N, Kettenbach AN
and Moseley JB: Mechanisms connecting the conserved protein kinases
ssp1, kin1, and pom1 in fission yeast cell polarity and division.
Curr Biol. 28:84–92.e4. 2018. View Article : Google Scholar :
|
|
19
|
Strickland M and Stoll EA: Metabolic
reprogramming in glioma. Front Cell Dev Biol. 5:432017. View Article : Google Scholar : PubMed/NCBI
|
|
20
|
Schalch T and Steiner FA: Structure of
centromere chromatin: From nucleosome to chromosomal architecture.
Chromosoma. 126:443–455. 2017. View Article : Google Scholar :
|
|
21
|
Syrovatkina V, Fu C and Tran PT:
Antagonistic spindle motors and MAPs regulate metaphase spindle
length and chromosome segregation. Currt Biol. 23:2423–2429. 2013.
View Article : Google Scholar
|
|
22
|
Kim J and Cheong JH: Role of
mitochondria-cytoskeleton interactions in the regulation of
mitochondrial structure and function in cancer stem cells. Cells.
9:16912020. View Article : Google Scholar :
|
|
23
|
Pyakurel A, Savoia C, Hess D and Scorrano
L: Extracellular regulated kinase phosphorylates mitofusin 1 to
control mitochondrial morphology and apoptosis. Mol Cell.
58:244–254. 2015. View Article : Google Scholar : PubMed/NCBI
|
|
24
|
Del Dotto V, Fogazza M, Lenaers G, Rugolo
M, Carelli V and Zanna C: OPA1: How much do we know to approach
therapy? Pharmacol Res. 131:199–210. 2018. View Article : Google Scholar : PubMed/NCBI
|
|
25
|
Del Dotto V, Mishra P, Vidoni S, Fogazza
M, Maresca A, Caporali L, McCaffery JM, Cappelletti M, Baruffini E,
Lenaers G, et al: OPA1 isoforms in the hierarchical organization of
mitochondrial functions. Cell Rep. 19:2557–2571. 2017. View Article : Google Scholar : PubMed/NCBI
|
|
26
|
Milani M, Byrne DP, Greaves G, Butterworth
M, Cohen GM, Eyers PA and Varadarajan S: DRP-1 is required for BH3
mimetic-mediated mitochondrial fragmentation and apoptosis. Cell
Death Dis. 8:e25522017. View Article : Google Scholar : PubMed/NCBI
|
|
27
|
Ishihara N, Nomura M, Jofuku A, Kato H,
Suzuki SO, Masuda K, Otera H, Nakanishi Y, Nonaka I, Goto YI, et
al: Mitochondrial fission factor Drp1 is essential for embryonic
development and synapse formation in mice. Nat Cell Biol.
11:958–966. 2009. View Article : Google Scholar : PubMed/NCBI
|
|
28
|
Neutzner A and Youle RJ: Instability of
the mitofusin Fzo1 regulates mitochondrial morphology during the
mating response of the yeast saccharomyces cerevisiae. J Biol Chem.
280:18598–18603. 2005. View Article : Google Scholar : PubMed/NCBI
|
|
29
|
Xiao W, Wang RS, Handy DE and Loscalzo J:
NAD(H) and NADP(H) redox couples and cellular energy metabolism.
Antioxid Redox Signal. 28:251–272. 2018. View Article : Google Scholar :
|
|
30
|
Pietrocola F, Galluzzi L, Bravo-San Pedro
JM, Madeo F and Kroemer G: Acetyl coenzyme a: A central metabolite
and second messenger. Cell Metab. 21:805–821. 2015. View Article : Google Scholar : PubMed/NCBI
|
|
31
|
Ronowska A, Szutowicz A, Bielarczyk H,
Gul-Hinc S, Klimaszewska-Łata J, Dyś A, Zyśk M and Jankowska-Kulawy
A: The regulatory effects of acetyl-CoA distribution in the healthy
and diseased brain. Front Cell Neurosci. 12:1692018. View Article : Google Scholar : PubMed/NCBI
|
|
32
|
Tang X, Liu J, Dong W, Li P, Li L, Lin C,
Zheng Y, Hou J and Dan L: The cardioprotective effects of citric
acid and L-malic acid on myocardial ischemia/reperfusion injury.
Evid Based Complement Alternat Med. 2013:8206952013. View Article : Google Scholar : PubMed/NCBI
|
|
33
|
Kim A, Fung E, Parikh SG, Gabayan V,
Nemeth E and Ganz T: Isocitrate treatment of acute anemia of
inflammation in a mouse model. Blood Cells Mol Dis. 56:31–36. 2016.
View Article : Google Scholar
|
|
34
|
Sweet S and Singh G: Changes in
mitochondrial mass, membrane potential, and cellular adenosine
triphosphate content during the cell cycle of human leukemic
(hl-60) cells. J Cell Physiol. 180:91–96. 1999. View Article : Google Scholar : PubMed/NCBI
|
|
35
|
Lopez-Mejia IC and Fajas L: Cell cycle
regulation of mitochondrial function. Curr Opin Cell Biol.
33:19–25. 2015. View Article : Google Scholar
|
|
36
|
Salazar-Roa M and Malumbres M: Fueling the
cell division cycle. Trends Cell Biol. 27:69–81. 2017. View Article : Google Scholar
|
|
37
|
Bartolák-Suki E, Imsirovic J, Nishibori Y,
Krishnan R and Suki B: Regulation of mitochondrial structure and
dynamics by the cytoskeleton and mechanical factors. Int J Mol Sci.
18:18122017. View Article : Google Scholar :
|