Introduction
Colorectal cancer (CRC) is the fourth leading cause
of cancer-associated mortality worldwide (1). According to the American Cancer
Society, there were 145,600 new cases of CRC and 51,020 associated
deaths in the United States in 2019, and it ranked third in terms
of incidence among all types of cancer (2). Additionally, the incidence and
mortality rate of CRC have increased during the past decade in
China (3). At present,
radiotherapy is recognized as one of the main adjuvant treatment
methods for CRC surgery (4).
However, postoperative recurrence and metastasis of the tumor still
occur due to radiation tolerance (5). Therefore, identifying related
biological targets by which the radiosensitivity of CRC can be
improved is a topic of great interest.
Interferon regulatory factor 1 (IRF1) is a member of
the IRF family and can be activated by cytokines, such as IFN-γ,
TNF-α and interleukins-1-6, which are involved in the regulation of
various cytokines (IL-4, IL-5, IL-12 and IL-13) and immune cells
(Th1, Th2 and Th9) (6,7). Furthermore, studies have
demonstrated that differences in the sensitivity of IRF1 to IFN-γ
responses can lead to different clinical outcomes (8,9).
IRF1 has been demonstrated to be involved in the pathogenesis of
different types of cancer, including breast cancer (10), cervical cancer (11,12), hepatocellular carcinoma (13), pancreatic ductal adenocarcinoma
(14), prostate cancer (15,16) and CRC (17,18). It has been revealed that there is
positive feedback regulation between IRF1 and microRNA-29b, which
could promote the sensitivity of CRC cells to IFN-γ (17). Blocking this feedback regulation
inhibits the growth and metastasis of CRC (17). Hong et al (18) reported that IRF1 suppresses CRC
metastasis and proliferation by promoting Ras association
domain-containing protein 5 expression and inhibiting the RAS-RAC1
signaling pathway.
In addition, previous studies have documented that
IRF1 affects tumor radiation therapy (11,19,20): One study revealed that nuclear
IRF1 expression is higher in patients with cervical cancer with a
complete response to radio/chemotherapy than in patients with only
a partial response to therapy (11). Chen et al (19) found that IRF1 expression is lower
in radiation-tolerant cells than in radiation-sensitive head and
neck squamous tumor cells. Furthermore, IRF1 is an important
transcription factor for cytosolic DNA sensing-mediated type III
IFN production induced by gamma rays in CRC cells (20). Therefore, it is clear that IRF1
is involved in the radiotherapy of tumors. However, to the best of
our knowledge, it is unclear how IFN-γ-mediated IRF1 influences the
development and radiotherapy of CRC. The present study investigated
the role of IRF1 in the progression and radiosensitivity of CRC.
The present study demonstrated that the upregulation of IRF1
inhibited CRC progression and promoted the sensitivity of CRC to
X-rays in both in vitro and in vivo experiments.
Materials and methods
Tissue samples
For immunohistochemistry analysis, 200 samples from
patients with CRC and 31 matched adjacent tissues were collected at
The Second Hospital of Wuxi (Wuxi, China) between January 2010 and
December 2012. Among the 200 patients, there were 142 male patients
and 58 female patients. Their age ranged between 40 and 83 years,
the mean age was 66.21 years and the median age was 66 years. All
specimens were obtained during resection. Patients who had
undergone radiotherapy or chemotherapy were excluded. Matched
adjacent normal tissues were obtained >2 cm away from the tumor.
All patients provided signed, informed consent for their tissues to
be used for scientific research. Ethical approval for the study was
obtained from Ethics Committee of The Second Hospital of Wuxi
(approval no. KY-2020-001; Wuxi, China). All diagnoses were based
on pathological and/or cytological evidence. The histological
features of the specimens were evaluated by a senior pathologist
according to the classification criteria from the World Health
Organization (21).
Immunohistochemistry
Immunohistochemistry staining and the stained
section scoring methods were described in a previous study
(22). IRF1 (dilution, 1:500;
cat. no. ab232861; Abcam) and Bcl-2 (dilution, 1:100; cat. no.
ab182858; Abcam) antibodies were used. The secondary antibody was
horseradish peroxidase-labeled goat anti-rabbit IgG (H+L)
(dilution, 1:500; cat. no. A0208; Beyotime Institute of
Biotechnology).
Human Protein Atlas database
The results of IRF1 in CRC were validated using the
Human Protein Atlas database, which is a database for cancer and
normal protein expression in tissues and the analysis of patient
survival (23). The specific
steps were as follows: The www.proteinatlas.org website was used to enter 'IRF1'
in the search field. Subsequently, 'Pathology' was selected, and
'Colorectal cancer' was selected in 'RNA EXPRESSION OVERVIEW' to
obtain the survival analysis result and figure.
Cell culture, treatment, transfection,
infection and irradiation
Human CRC-derived HT29 and LoVo cell lines were
resuscitated and resuspended in RPMI 1640 medium (HyClone; Cytiva),
while HCT116, CCL244 and SW480 were resuspended in high-glucose
DMEM (HyClone; Cytiva) supplemented with 10% (v/v) FBS (Biological
Industries). Our previous study revealed that CCL244 and SW480
cells were relatively radiation-resistant cell lines among seven
types of CRC cells: HT29, LoVo, Hce8693, CaCo2, HCT116, CCL244 and
SW480 (24). The present study
mainly explored how to enhance the radiation sensitivity of CRC.
Therefore, these two types of cells were used for in vitro
experiments. All cells were obtained from The Cell Bank of Type
Culture Collection of The Chinese Academy of Sciences and
maintained in medium supplemented with 10% FBS and 100 U/ml
penicillin-streptomycin at 37°C with 5% CO2. IFN-γ
(ProteinTech Group, Inc.) was added to the culture medium at 10
ng/ml (17) at 0, 0.25, 0.50,
1.50 and 2.00 h.
For plasmid transfection, the cells were grown in a
6-well culture plate to 70-80% confluence and then transfected with
2.5 µg plasmids for 20 min [either short hairpin RNA
(shRNA)-negative control (NC), 5′-TTC TCC GAA CGT GT C ACGTTT
CAAGAGAAC GTGA CAC GTT CGGAGAATTTTTT-3′ or shRNA-IRF1,
5′-GGCTCATCTGGATTAATAAAGTTCAAGAGACTTTATTAATCCAGATGAGCCTTTTTT -3′;
Vigene Biosciences] using Lipofectamine 2000 at room temperature
(Invitrogen; Thermo Fisher Scientific, Inc.) according to the
manufacturer's protocol. After 48 h, the cells were collected for
assays.
For viral infection, the adenovirus expression
vectors IRF1 (Ad-IRF1) and negative control (Ad-NC) were obtained
from Hanbio Biotechnology Co., Ltd. The cells were infected with
Ad-IRF1 and Ad-NC (multiplicity of infection, 3) for 4 h and then
the medium was changed according to the manufacturer's protocol.
The cells were used for relevant experiments at 48 h after
infection. Furthermore, the present study mainly focused on the
inhibitory effect of IRF1 on CRC and the enhanced radiation
sensitivity of CRC. Therefore, the cells were divided into two
groups in in vitro experiments: Ad-NC and Ad-IRF1.
SW480 and CCL244 cells were irradiated with an X-ray
linear accelerator (Rad Source Technologies) at a dose rate of 1.15
Gy/min.
Cell proliferation assay
After cells infected with Ad-NC and Ad-IRF1, SW480
or CCL244 cells were seeded into 96-well plates at a density of
5×10³ cells per well with eight parallel wells per
group. At 24, 48 and 72 h after 6 Gy X-ray treatment, cell
proliferation was measured using the MTT assay. Briefly, 20
µl MTT solution (5 mg/ml) and 100 µl complete medium
were added to each well, and the cells were incubated for 4 h at
37°C. The medium was then aspirated, and 150 µl dimethyl
sulfoxide was added to dissolve the crystals. The optical density
(OD) was measured at 490 nm using a microplate reader (Bio-Rad
Laboratories, Inc.). The viability index was calculated as the
experimental OD value/the control OD value. Three independent
experiments were performed in quadruplicate.
Colony formation assay
The cells were seeded into 6-well plates at
different densities of 4×10² (for both cell lines with 0
Gy) and 8×10³ (for CLL244 cells with 6 Gy and SW480
cells with 4 Gy) cells per well with three parallel wells per
group. After 24 h, CCL244 cells were exposed to X-rays with
different irradiation doses of 0 and 6 Gy, and SW480 cells were
exposed to X-rays with different irradiation doses of 0 and 4 Gy.
After 14 days of incubation at 37°C, the colonies were fixed with
anhydrous methanol (100%) at room temperature for 15 min and
stained with Giemsa at room temperature for 30 min, and those with
a minimum of 50 viable cells were counted under a light microscope
(Leica Microsystems GmbH). This process was repeated three times.
The cloning efficiency was calculated as the ratio of the number of
colonies formed divided by the total number of cells plated. The
GraphPad software (version 9.0.0; GraphPad Software, Inc.) was used
to analyze the cloning efficiency.
5-Ethynyl-20-deoxyuridine (EdU)
incorporation assay
The Cell-Light EdU DNA Cell Proliferation kit
(Guangzhou RiboBio Co., Ltd.) was used to determine the
proliferation rate of CCL244 or SW480 cells after treatment
according to the manufacturer's protocols. Briefly, the cells were
incubated at 37°C with 50 µM EdU for 2 h prior to fixation
with 4% paraformaldehyde for 30 min at room temperature, 0.5%
TritonX-100 permeabilization for 10 min at room temperature and EdU
staining for 30 min at room temperature. The cell nuclei were
stained with Hoechst 33342 at a concentration of 5 µg/ml for
30 min at room temperature, and the cells were examined under a
fluorescence microscope (Leica Microsystems GmbH). The GraphPad
software (version 9.0.0; GraphPad Software, Inc.) was used to
analyze the proportion of red to blue.
Flow cytometric analysis of cell
apoptosis
Following conventional digestion, cells in the
logarithmic growth phase were used to prepare a single cell
suspension, 2×10⁵ cells/ml were seeded into 6-well
plates with three parallel wells per group. At 48 h after
irradiation (0 and 6 Gy), all cells were collected and centrifuged
at 300 × g for 5 min at 4°C. The supernatant was discarded after
washing with PBS, and centrifugation at 300 × g for 5 min at 4°C
was repeated twice. The cells were then stained with fluorescein
FITC-conjugated Annexin V (Shanghai Yeasen Biotechnology Co., Ltd.)
and PI (Shanghai Yeasen Biotechnology Co., Ltd.), and directly
analyzed using the flow cytometry software equipped in the machine
(BD FACSVerse; Becton-Dickinson and Company). The ratio of both
early and late apoptotic cells was counted. The GraphPad software
(version 9.0.0; GraphPad Software, Inc.) was used to statistically
analyze the data (24).
Flow cytometric analysis of the cell
cycle
At 48 h after irradiation with 0 and 8 Gy, cells
infected with Ad-NC and Ad-IRF1 in logarithmic growth phase were
collected and fixed with 70% precooled ethanol at 4°C overnight.
After staining with propidium iodide (10 µg/ml; Shanghai
Yeasen Biotechnology Co., Ltd.) in the dark for 30 min at 37°C,
flow cytometry was performed on the BD FACSCalibur Flow Cytometer
system (Becton-Dickinson and Company), and the cell cycle
distribution was analyzed using FlowJo software (version 7.6;
Becton-Dickinson and Company) and ModFit LT software (version 3.2;
Becton-Dickinson and Company) (22).
RNA sequencing analysis
Total RNA from three paired Ad-IRF1 and Ad-NC CCL244
cell lines was isolated with an RNA Isolation kit (cat. no.
12183018A, Ambion; Thermo Fisher Scientific, Inc.). RNA purity and
quantification were evaluated using a NanoDrop 2000
spectrophotometer (Thermo Fisher Scientific, Inc.). RNA integrity
was assessed using the Agilent 2100 Bioanalyzer (Agilent
Technologies, Inc.). Subsequently, using RNA with an initial
quality of 4 µg as raw material for sequencing, the
libraries were constructed using TruSeq Stranded mRNA LT Sample
Prep kit (Illumina, Inc.) according to the manufacturer's
protocols. The transcriptome sequencing and analysis were conducted
by OE Biotech Co., Ltd. The libraries were sequenced on an Illumina
HiSeq X Ten platform and 150 bp paired-end reads were generated.
The clean reads were mapped to the human genome using HISAT2
(25). FPKM (26) value of each gene was calculated
using Cufflinks (27), and the
read counts of each gene were obtained by HTSeq-count (28). Differential expression analysis
was performed using the DESeq (2012) R package (29). P<0.05 and fold change >2 or
fold change <0.5 was set as the threshold for significantly
differential expression. Hierarchical cluster analysis of
differentially expressed genes (DEGs) was performed to explore gene
expression patterns. GO enrichment (30) and KEGG (31) pathway enrichment analysis of DEGs
were performed respectively using R based (R 3.6.2; https://cran.r-project.org/bin/windows/base/old/3.6.2/)
on the hypergeometric distribution. All sequencing procedures and
analyses were performed at OE Biotech Co., Ltd.
Immunofluorescence
The treated cells were placed in 24-well plates with
circular slides, up to 50-60% confluence fixed with 4%
paraformaldehyde at room temperature for 10 min after X-ray
radiation for 0, 3 and 6 h, and then treated with 1% Triton X-100
for 10 min at room temperature. After blocking with 1% BSA
(Beyotime Institute of Biotechnology) for 1 h at room temperature,
the samples were incubated with the IRF1 antibody (dilution,
1:1,000; cat. no. ab26109; Abcam) overnight at 4°C, and then
incubated with FITC-conjugated goat anti-rabbit secondary antibody
(dilution, 1:1,000; cat. no. A0562; Beyotime Institute of
Biotechnology) for 2 h at room temperature. The nuclei were stained
with DAPI (Sigma-Aldrich; Merck KGaA). The cells were observed
under a confocal microscope (Olympus Corporation).
Western blotting
Cells were lysed in 1X RIPA (cat. no. P0013B;
Beyotime Institute of Biotechnology) lysis buffer. The total
protein concentration was detected using a BCA kit (cat. no.
P0010S; Beyotime Institute of Biotechnology). The samples were
centrifuged at 12,000 × g for 15 min at 4°C and then boiled, and
~20 µg protein/lane was loaded onto 12 or 15% SDS-PAGE (cat.
no. P0012A; Beyotime Institute of Biotechnology) gels. The
electrophoresed samples were then transferred onto PVDF membranes
(cat. no. IPVH00010; EMD Millipore), which were then blocked with
PBS (HyClone; Cytiva)/Tween 20 (0.1%; VWR International, LLC)
containing 5% BSA (Beyotime Institute of Biotechnology) for 1 h at
room temperature. The membranes were incubated with antibodies
against IRF1 (dilution, 1:1,000; cat. no. ab26109; Abcam),
interferon induced protein 35 (IFI35; dilution, 1:1,000; cat. no.
ab233415; Abcam), interferon α inducible protein 6 (IFI6; dilution,
1:1,000; cat. no. ab192314; Abcam), Bcl-2 (dilution, 1:1,000; cat.
no. ab182858; Abcam), cleaved caspase-3 (dilution, 1:1,000; cat.
no. ab2302, Abcam), cleaved caspase-9 (dilution, 1:1,000; cat. no.
ab2324; Abcam), interferon induced transmembrane protein 1 (IFITM1;
dilution, 1:1,000; cat. no. 60074-1-Ig; ProteinTech Group, Inc.),
Bax (dilution, 1:1,000; cat. no. 5023S, Cell Signaling Technology,
Inc.), β-actin (dilution, 1:1,000; cat. no. AF0003; Beyotime
Institute of Biotechnology), GAPDH (dilution, 1:1,000; cat. no.
AF0006; Beyotime Institute of Biotechnology) and Tubulin (dilution,
1:1,000; cat. no. AT819; Beyotime Institute of Biotechnology)
overnight at 4°C. Goat anti-mouse secondary antibodies (dilution,
1:1,000; cat. no. A0286) and goat anti-rabbit secondary antibodies
(dilution, 1:1,000; cat. no. A0277) were purchased from Beyotime
Institute of Biotechnology. The membranes were incubated with the
appropriate secondary antibody for 1 h at room temperature. After
being washed, the membranes were incubated with enhanced
chemiluminescence (ECL) stable peroxide solution (Beyotime
Institute of Biotechnology). All blots were visualized using a G:
BOX Chemi XRQ gel doc system (Syngene Europe) at room temperature
and ImageJ (version 1.8.0; National Institutes of Health) was used
for densitometry.
Animal experiments and irradiation
A total of 25 male BALB/c nude mice (4 weeks old and
weighing 18-22 g) were purchased from Shanghai SLAC Laboratory
Animal Co., Ltd. The mice were maintained under standard laboratory
conditions with a 12-h light-dark cycle at a controlled temperature
(21-23°C) and humidity (40-60%), and given access to sterilized
food and water in a specific pathogen-free environment throughout
all experiments. All experimental procedures were performed in
accordance with the Guide for the Use and Care of Laboratory
Animals from the National Institutes of Health (32). For the subcutaneous injection,
CCL244 cells (5×10⁴) were suspended in 100 µl PBS
and then inoculated subcutaneously into the right posterior flank
region of BALB/c nude mice. The mice were divided into five groups:
i) Control group without treatment; ii) Ad-IRF1 group; iii) Ad-NC
group; iv) shRNA-IRF1 group; and v) shRNA-NC group. Each group
consisted of five nude mice. Two-dimensional measurements were
taken with an electronic caliper every 3 days, and the tumor volume
(in mm3) was calculated using the following formula:
Volume=a x b2/2, where a is the longest diameter, and b
is the shortest diameter of the tumor. When the tumor volume
reached 80 mm3 on the fifth day, the local tumor was
irradiated with 8 Gy X-ray. Tumor volume was then measured every 4
days, mice were sacrificed on the 29th day, and tumors were frozen
at -80°C or fixed in 10% formalin at room temperature overnight and
subjected to routine histological examination. Formalin-fixed
subcutaneous tumors were used for the following
immunohistochemistry (for Bcl-2) experiments. Next, liver and lung
metastasis models were established by tail vein injection of
IRF1-upregulated/IRF1-downregulated and control CCL244 cells
resuspension solutions, 106 cells in 100 µl PBS
per nude mouse (the grouping was the same as aforementioned). The
time interval between injection and the end of experiment was from
injection to the specific humane endpoints. The maximum time
interval was 35 days. For metastatic tumor models, the specific
humane endpoints were: Rapid weight loss or emaciation
characterized by anemia, hunched posture, ungroomed appearance and
lethargy (33). Liver metastatic
tumors were frozen at -80°C or fixed in 10% formalin at room
temperature overnight and subjected to routine histological
examination. HE and Immunohistochemistry for Bcl-2 were performed
subsequently. The present study was approved by the Institutional
Animal Care and Use Committee of Soochow University (Suzhou,
China). The method of sacrifice of the animals was as follows: The
nude mouse was placed into the euthanasia box, and carbon dioxide
was infused into the box at a rate of 10-30% of the solvent in the
euthanasia box per min. It was ensured that the nude mouse did not
move, had no breathing and had dilated pupils. The carbon dioxide
was turned off, followed by observation for 2 min to confirm that
the nude mouse was dead.
The nude mice were irradiated on the fifth day after
cell injection with an X-ray linear accelerator (Varian Clinac CX;
Varian Medical Systems, Inc.) at a single dose of 8 Gy with a fixed
dose rate of 300 MU/min at a temperature of 23±0.5°C.
Hematoxylin and eosin (H&E)
staining
Liver tissues and lung tissues were fixed in 10%
neutral-buffered formalin for 24 h at room temperature and embedded
in paraffin. Paraffin sections (~3 µm) were deparaffinized
and heat-treated with citrate buffer, pH 6.0, for 7 min following
an epitope retrieval protocol. The sections of the subcutaneous
tumor and liver were stained with H&E (hematoxylin, 5 min; and
eosin, 1 min) at room temperature. All slides were examined under a
light microscope (Leica Microsystems GmbH) and images were
captured. Representative images were randomly selected from each
sample.
Statistical analysis
The data were analyzed using an unpaired two-sided
Student's t-test to determine statistical significance. When more
than two groups were compared, one-way ANOVA was adopted followed
by Tukey's post hoc test. For all in vitro experiments, five
biological replicates were analyzed. For all in vivo
experiments, three biological replicates were analyzed for each
condition. Statistical analysis was performed using Prism 6.01
software (GraphPad Software, Inc.). Data are presented as the mean
± standard error of the mean. P<0.05 was considered to indicate
a statistically significant difference.
Results
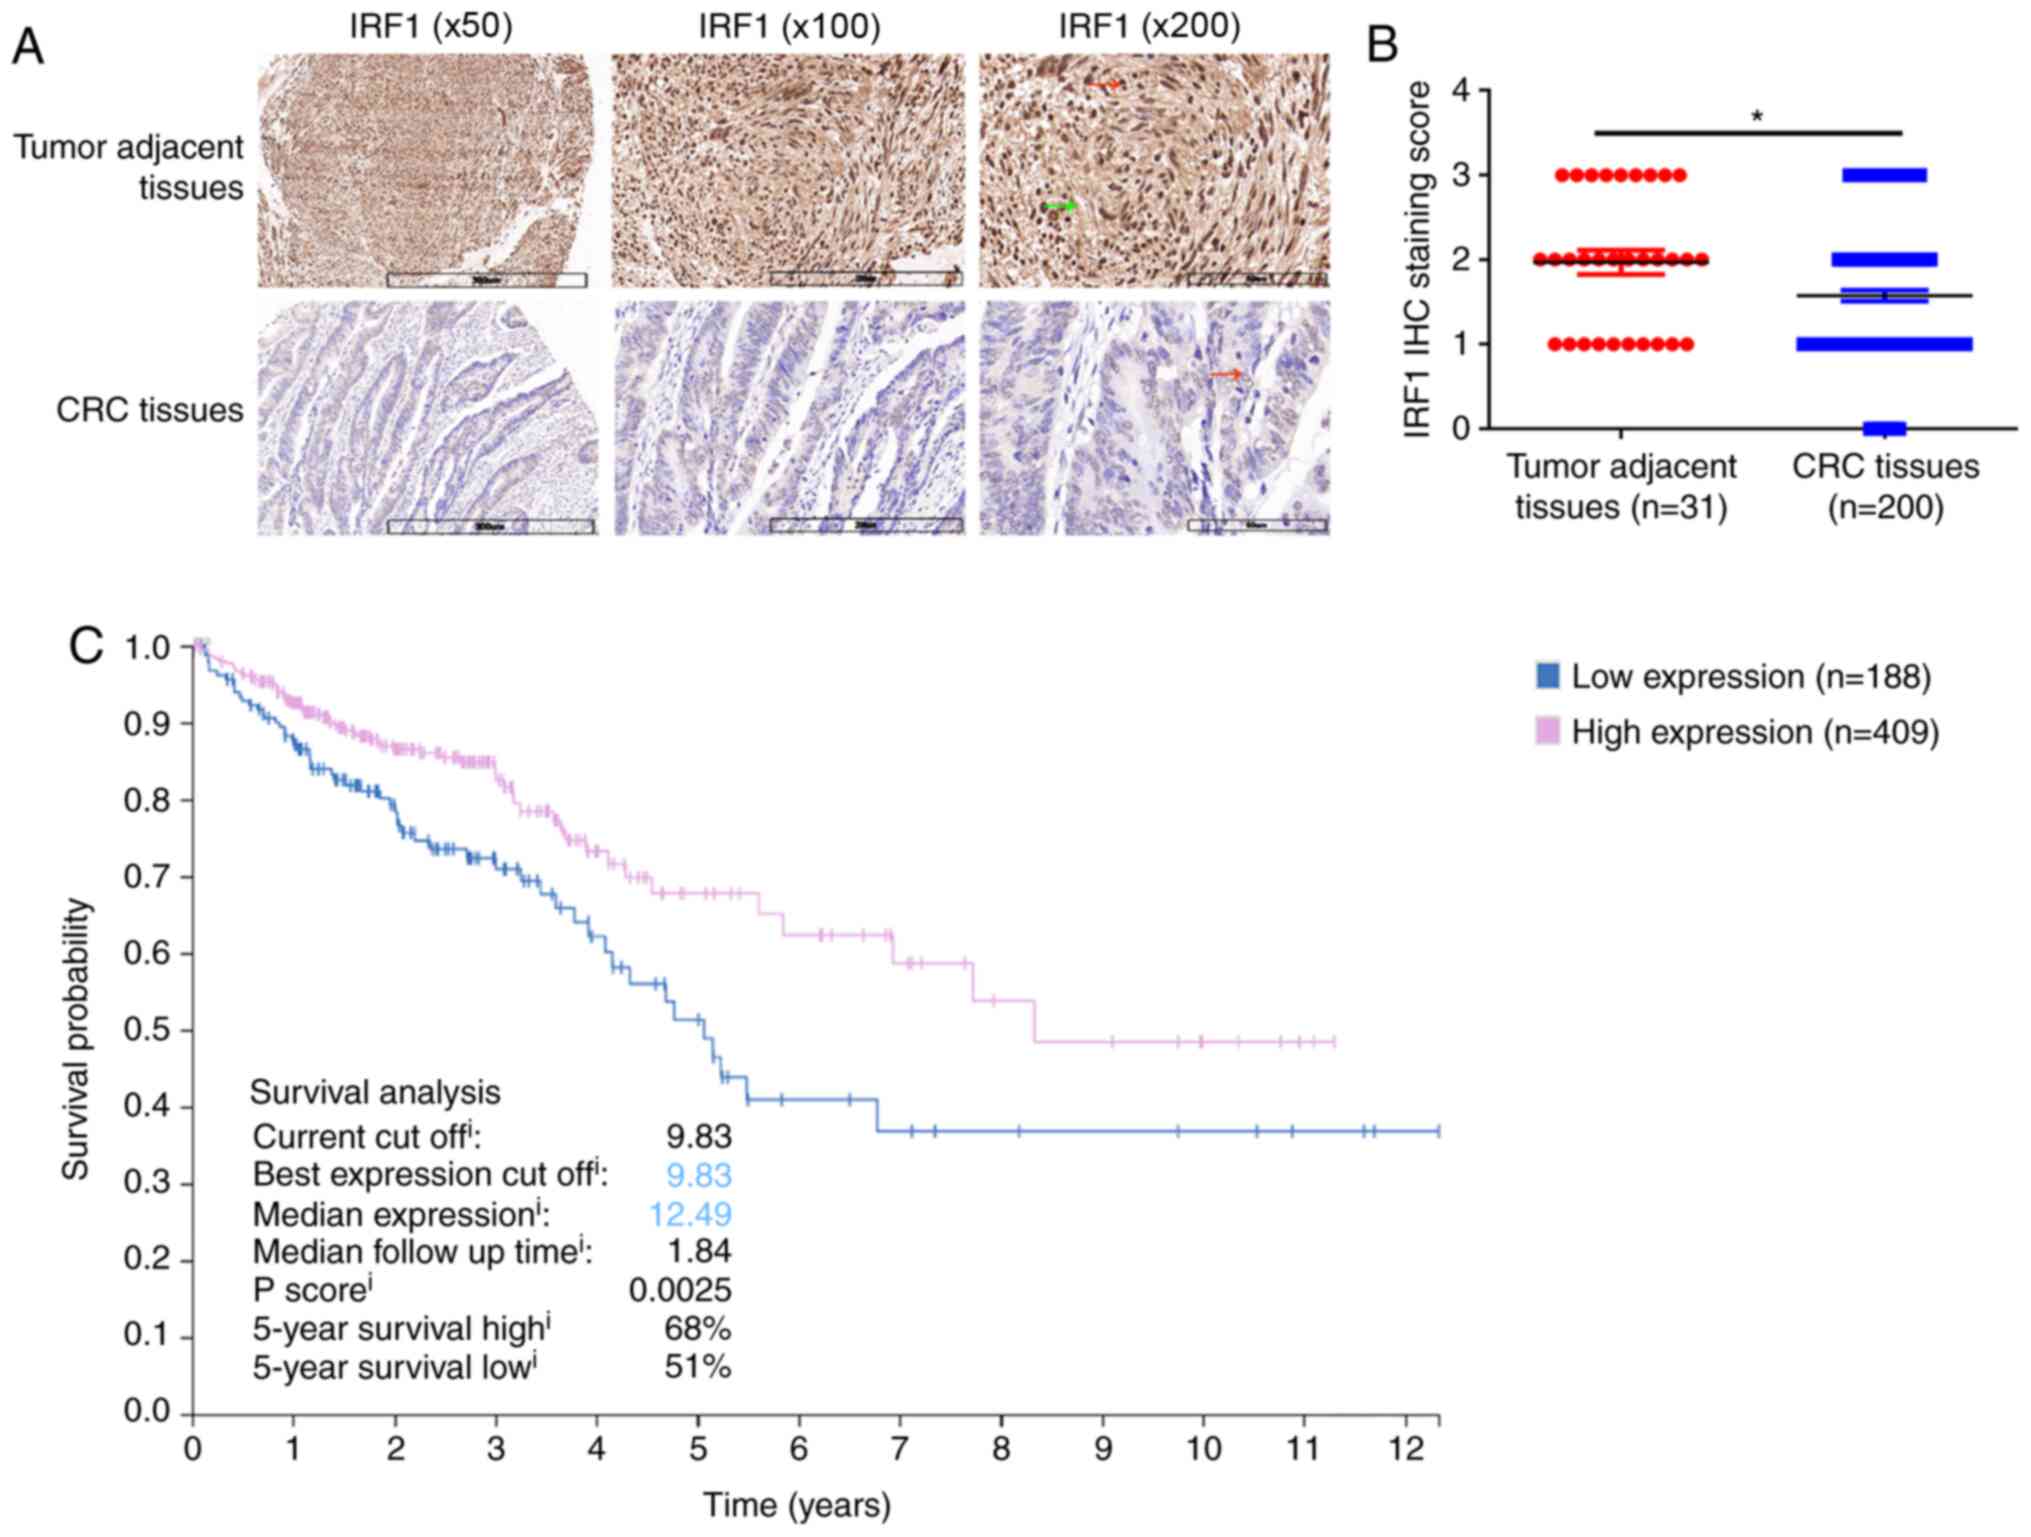
IRF1 expression is downregulated in CRC
tissues and positively associated with the survival rate
Immunohistochemical staining was performed for 200
CRC tissues and 31 matched tumor-adjacent tissues. The results
revealed that IRF1 expression was weaker in CRC tissues compared
with in adjacent tumor tissues. In addition, IRF1 was expressed in
both the cytoplasm (green arrow) and nucleus (red arrow) (Fig. 1A). The histopathological scores
indicated that IRF1 expression in CRC tissues was significantly
lower than that in adjacent tissues (Fig. 1B). The present study further
searched the Human Protein Atlas database and identified that the
5-year survival rate of patients with high IRF1 expression was
significantly higher than that of patients with low IRF1 expression
(Fig. 1C). Therefore, IRF1
expression was lower in the tumor tissues and its high expression
was associated with improved survival of the patients.
Both IFN-γ and X-rays induce IRF1
expression
Western blotting was used to detect the expression
levels of IRF1 in different CRC cells, and it was found that there
was no significant difference in the expression levels of IRF1 in
different cell lines (Fig. S1).
Based on the results of a previous study (24), two cell lines (CLL244 and SW480)
were used in in vitro experiments. Consistent with a
previous study (17), the
present study identified that IFN-γ induced IRF1 expression in
colon cancer cells. IRF1 expression gradually increased after IFN-γ
treatment and started to rise within 1 h, as demonstrated by
western blot analysis (Fig. 2A).
Notably, western blot analysis also revealed that IRF1 expression
was induced by X-ray irradiation (Fig. 2B). Immunofluorescence analysis
revealed that IRF1 expression in the nucleus was increased within 3
h after irradiation (Fig. 2C).
In summary, IRF1 expression was induced by both IFN-γ and X-ray
treatment.
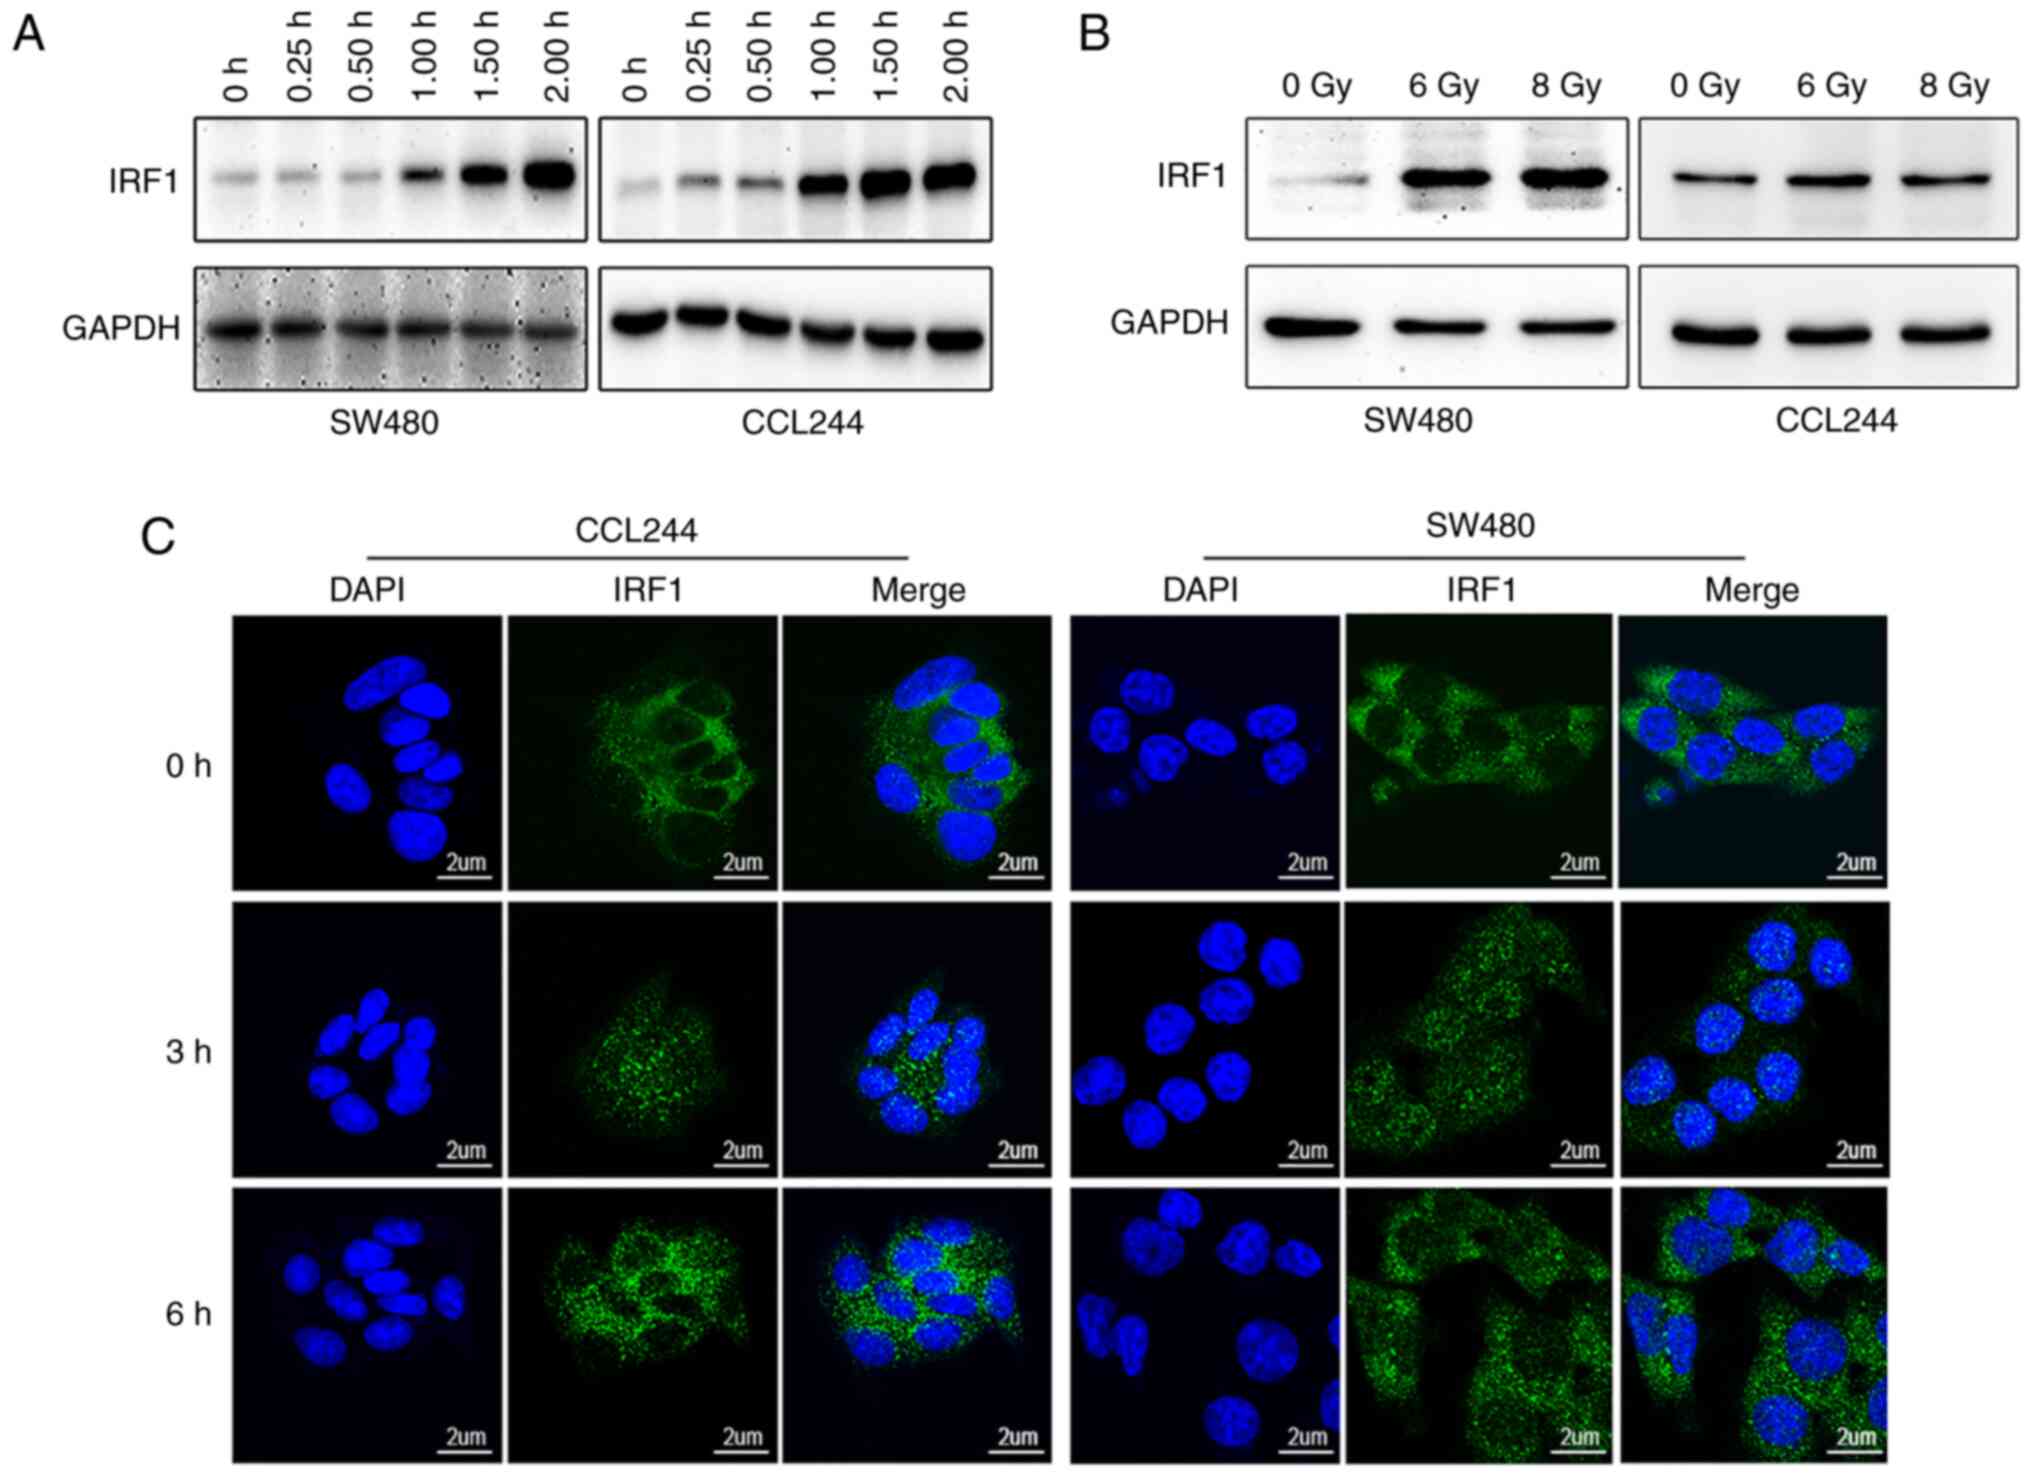 | Figure 2IRF1 expression in colorectal cancer
cell lines is activated by IFN-γ or X-rays. (A) IFN-γ (10 ng/ml)
was added to a 6-well plate containing CCL244 and SW480 cells.
Cells were harvested at 0.25, 0.50, 1.00, 1.50 and 2.00 h after
IFN-γ was added, proteins were extracted and the expression levels
of IRF1 were detected by western blotting. (B) CCL244 and SW480
cells were treated with 0, 6 and 8 Gy X-rays. After 48 h, the cells
were collected for protein extraction, and the expression levels of
IRF1 were detected by western blotting. (C) X-ray irradiation of 0
and 6 Gy was administered to the two cell lines. The cells were
fixed at 0, 3 and 6 h after irradiation, and the distribution and
expression of IRF1 in the cells were detected using
immunofluorescence. Scale bar, 2 µm. IRF1, interferon
regulatory factor 1. |
IRF1 enhances the effect of X-ray
irradiation on the proliferation, apoptosis and cell cycle of CRC
cells
EdU staining was performed to investigate the effect
of IRF1 on the proliferation of CRC cells. Upregulation of IRF1
decreased the proliferation rate compared with the control before
or after radiation (Fig. 3A).
Cell proliferation was monitored using an MTT assay, and this
revealed that IRF1 upregulation could inhibit the proliferation of
SW480 and CCL244 before or after radiation (Fig. 3B). The colony formation assay
demonstrated that the clonogenicity of CRC cells was significantly
reduced after IRF1 upregulation before or after radiation (Fig. 3C). Furthermore, the cell cycle
was analyzed using a fluorescence-activated cell sorter. The
results revealed that the G1 phase was significantly
prolonged following upregulation of IRF1 (Fig. 3D). Overall, these results
demonstrated that IRF1 upregulation inhibited proliferation,
decreased colony formation efficiency and slowed the cell
cycle.
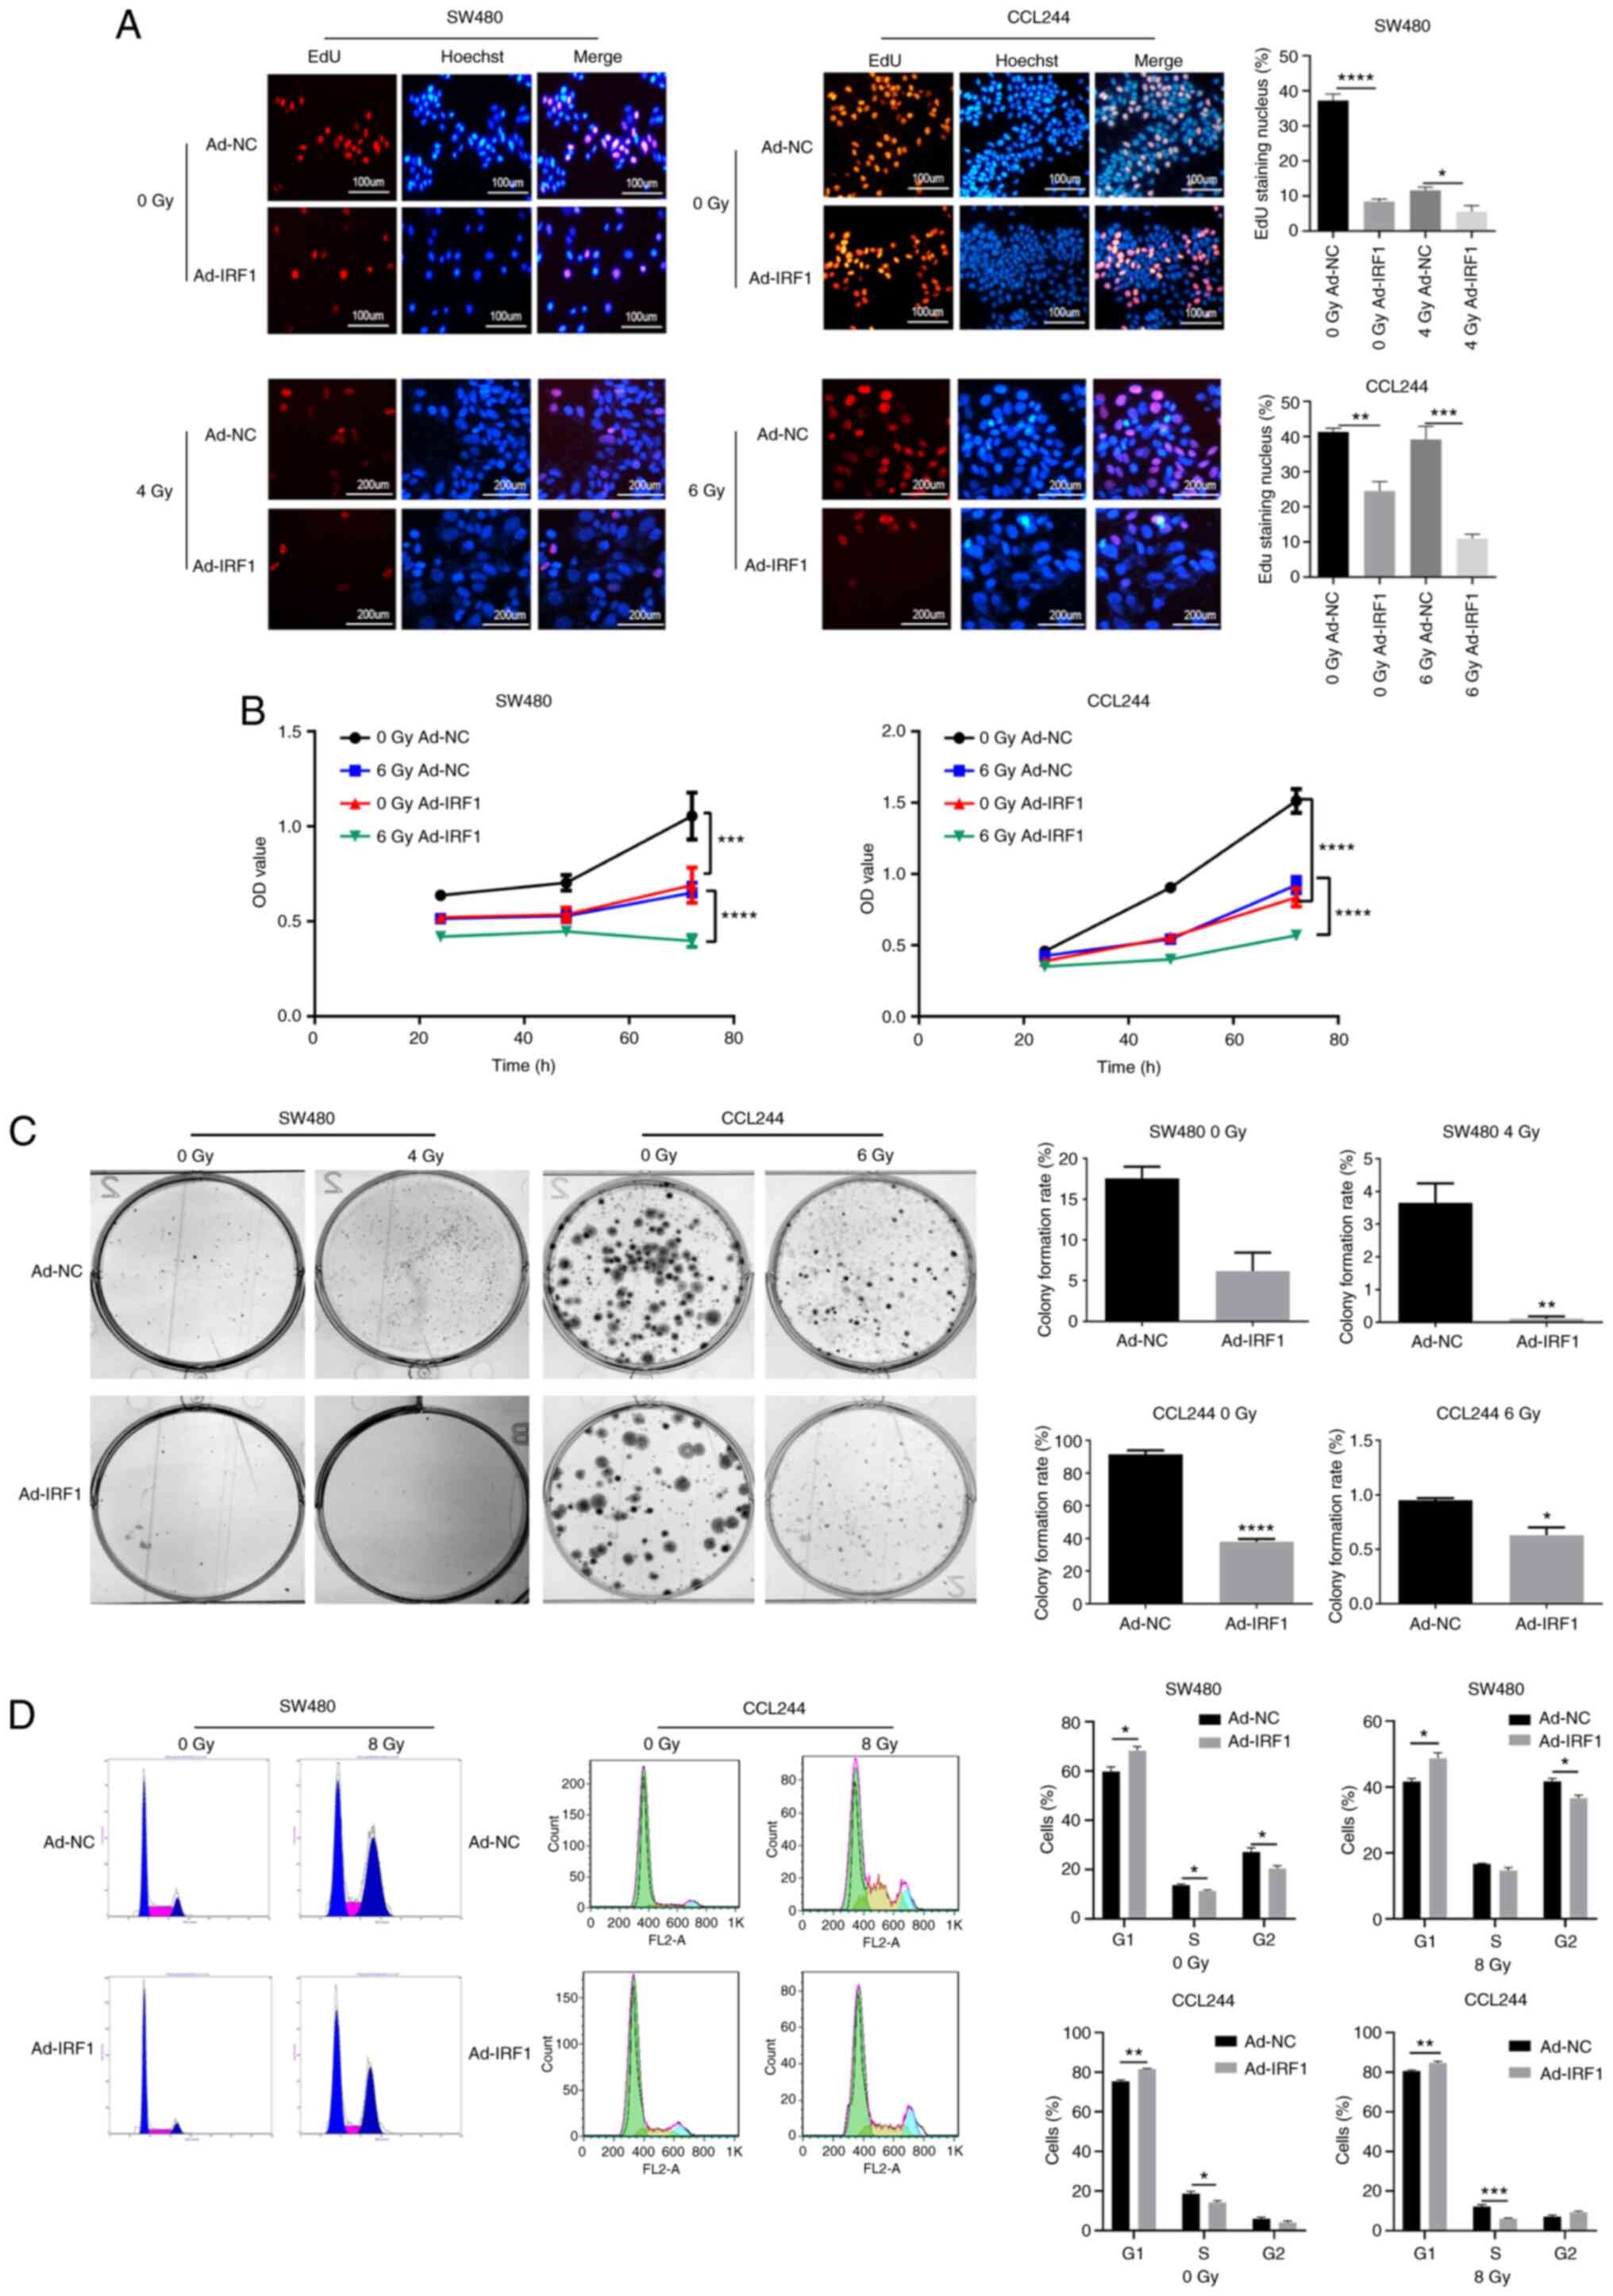 | Figure 3Overexpression of IRF1 inhibits the
proliferation of CRC cells and increases their sensitivity to X-ray
irradiation. (A) Subsequently, 0 and 4 or 6 Gy X-rays were
administered to the cells at 48 h after infection. At 48 h after
irradiation, EdU was used to detect the proliferation of CRC cells.
Scale bar, 100 or 200 µm. (B) Subsequently, 0 and 6 Gy
X-rays were administered to the cells at 48 h after infection. At
24, 48 and 72 h after irradiation, MTT was used to detect the
proliferation of CRC cells. (C) After 14 days, the cells were fixed
with pure methanol and then stained with Giemsa crystal violet, and
the cell colony formation rate was calculated. (D) After 48 h, a
flow cytometer system was used to analyze the cell cycle
*P<0.05, **P<0.01,
***P<0.001 and ****P<0.0001. Ad,
adenovirus expression vector; CRC, colorectal cancer; EdU,
5-ethynyl-20-deoxyuridine; IRF1, interferon regulatory factor 1;
NC, negative control; OD, optical density. |
Resistance to apoptosis is one of the most important
radiation impairments occurring in tumors (34). To explore the effect of IRF1 on
apoptosis induced by X-ray irradiation, flow cytometry analysis was
performed. The results demonstrated that IRF1 upregulation
significantly increased the apoptosis of cells with or without
X-ray exposure. (Fig. 4A).
Western blot analysis demonstrated that upregulation of IRF1
increased the expression levels of Bax, caspase-3 and caspase-9,
and inhibited Bcl-2 expression (Fig.
4B). This further demonstrated that IRF1 may be involved in the
regulation of CRC cell apoptosis.
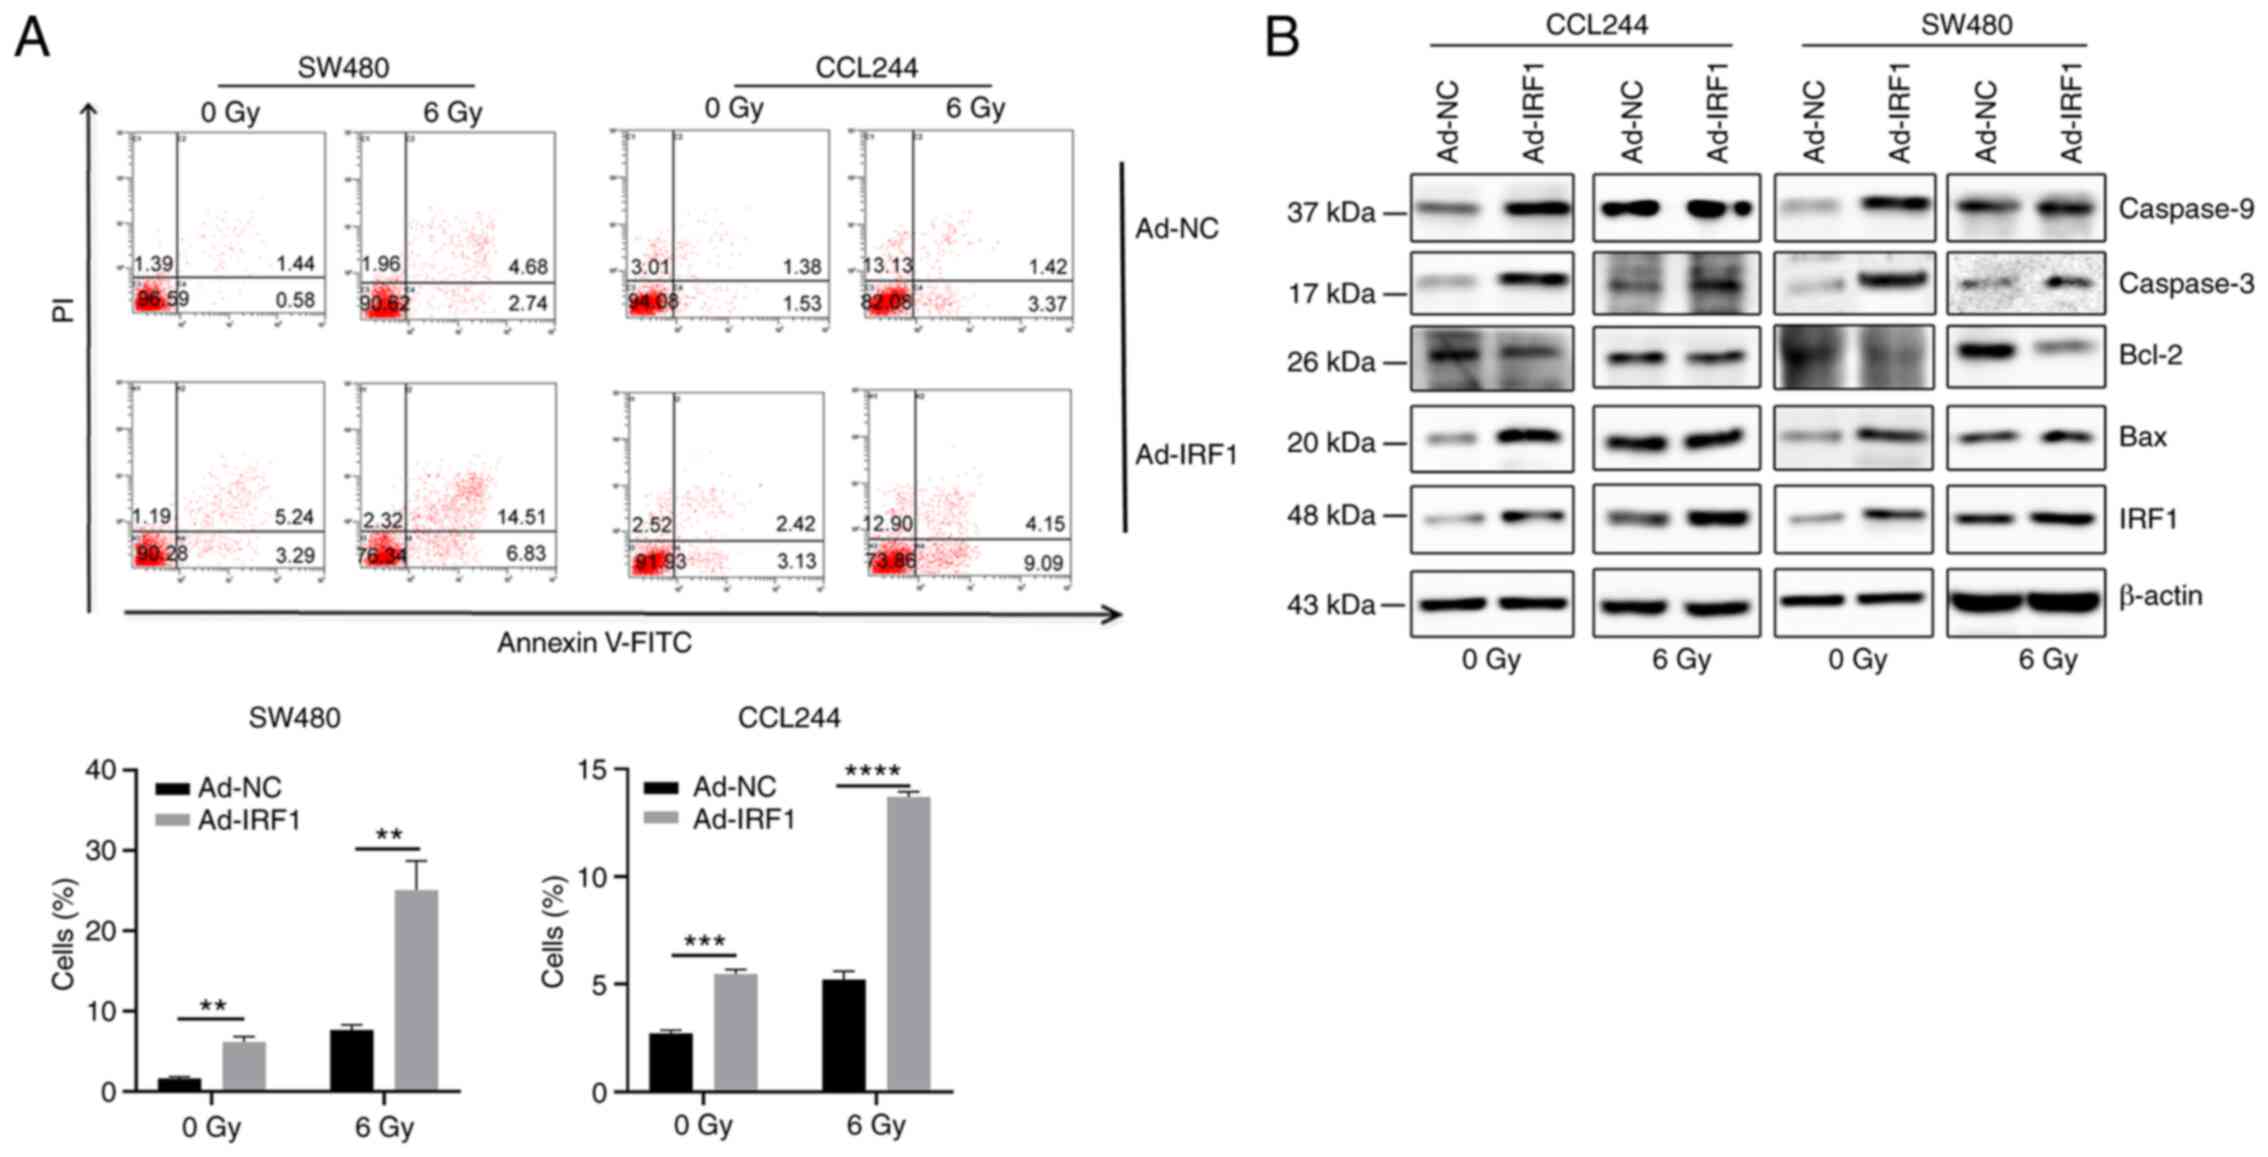 | Figure 4Overexpression of IRF1 increases
X-ray-induced apoptosis. (A) At 48 h after infection, 0 and 6 Gy
X-rays were administered to the cells. After 48 h, a flow cytometer
system was used to detect apoptosis of the cells. (B) At 48 h after
infection, 0 and 6 Gy X-rays were administered to the cells. After
48 h, the cells were harvested for protein isolation and western
blotting to detect the expression levels of the apoptosis-related
proteins Bax, Bcl-2, caspase-3 and caspase-9.
**P<0.01, ***P<0.001 and
****P<0.0001. Ad, adenovirus expression vector; IRF1,
interferon regulatory factor 1; NC, negative control. |
IRF1 promotes radiosensitivity of CRC to
X-rays in vivo
To determine the effect of IRF1 on CRC growth in
vivo, nude mice were inoculated with CCL244 cells that had been
infected with Ad-NC or Ad-IRF1, or transfected with shRNA-NC or
shRNA-IRF1 plasmids. Western blot analysis of IRF1 expression in
CRC cells revealed that compared with the cells infected with
Ad-NC, IRF1 expression in both SW480 and CCL244 cells infected with
Ad-IRF1 was increased and compared with the cells transfected with
shRNA-NC, IRF1 expression in both SW480 and CCL244 cells
transfected with shRNA-IRF1 was reduced (Fig. S2). Nude mice inoculated with
CCL244 cells infected with IRF1 overexpression adenovirus developed
tumors slower than those in the control Ad-NC-infected group. By
contrast, following IRF1 knockdown, the tumors grew much faster
than those in other mouse groups (Fig. 5A). After the nude mice were
sacrificed, tumor, liver and lung tissues were collected. The tumor
volume was the smallest in the IRF1 upregulation group, and the
tumor volume was the largest when IRF1 was downregulated (Fig. 5A). When observing the whole liver
specimens, it was identified that the number of liver metastases
was the lowest in the IRF1-upregulated group, while the number of
metastases was the highest in the IRF1-downregulated group. For
lung tissues, there were no nodules in the solid lung tissue
observed by the naked eye. Therefore, no images were captured. When
lung tissues were cut, there were isolated metastatic lung nodules
in 1 mouse in the shRNA-IRF1 group (Fig. 5B and C). Further pathological
tissue H&E staining revealed that the metastatic lesions in the
IRF1-downregulated group were the largest, while the lesions in the
IRF1-upregulated group were not obvious. In addition, pathological
H&E staining of the lung revealed no metastases in the
IRF1-upregulated group and obvious metastases in the
IRF1-downregulated group (Fig.
5D). Tumor tissues and liver metastases were prepared for
immunohistochemical staining. The results revealed that Bcl-2
protein expression in tumor tissues and liver metastases of the
Ad-IRF1 group was lower than that in the Ad-NC group, while Bcl-2
expression in the IRF1 downregulation group was the highest
(Fig. 5E). These results were
consistent with the results of the present in vitro
experiments. In summary, the present results demonstrated that IRF1
regulation affected tumor growth, metastasis and apoptosis-related
protein Bcl-2 expression in vivo.
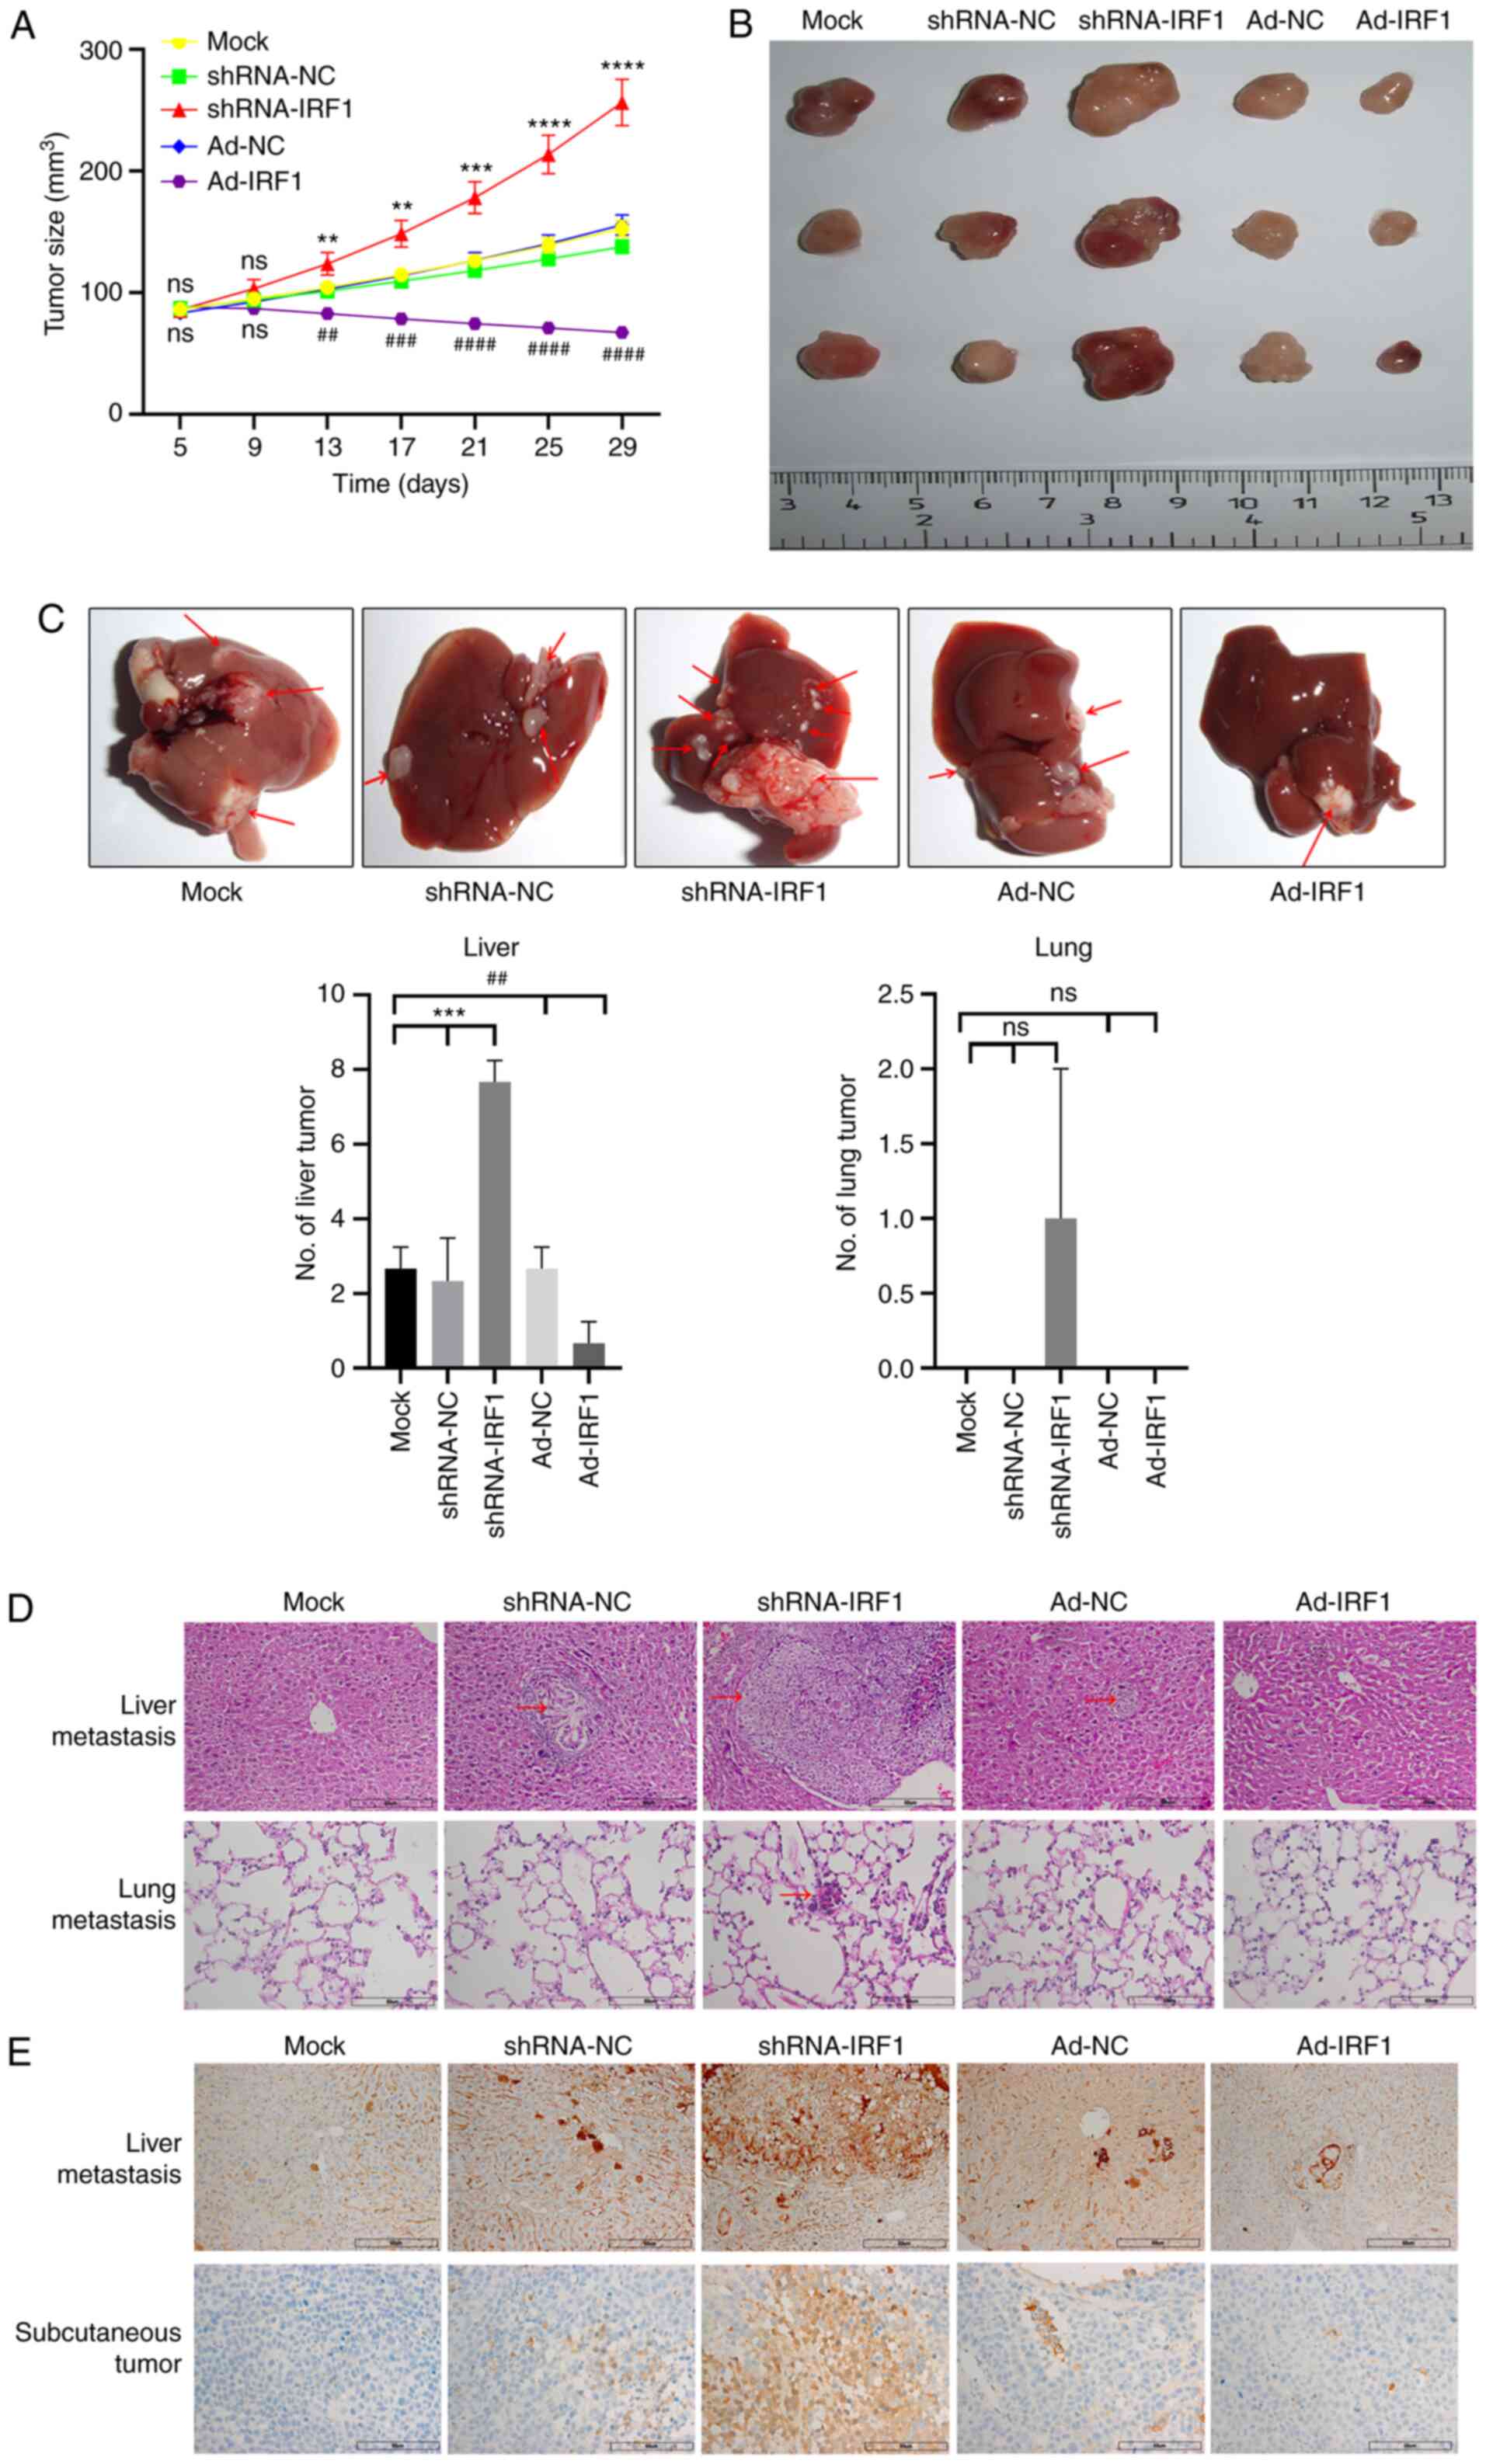 | Figure 5Overexpression of IRF1 promotes
radiosensitivity of CRC to X-rays in vivo. (A) Tumor growth
curve of each group. (B) Representative tumors from each group of
mice. (C) Representative CRC metastases in the liver. Red arrows
indicate lesions. Analysis of the number of liver and lung
metastases in each group. (D) H&E staining of nodules in the
liver and lung for CRC metastasis for each group. Red arrows
indicate lesions. Scale bar, 60 µm. (E) Immunohistochemical
detection of Bcl-2 expression in liver metastases and subcutaneous
tumors for each group. Scale bar, 60 µm.
**P<0.01, ***P<0.001 and
****P<0.0001 (shRNA-IRF1 vs. shRNA-NC/mock);
##P<0.01, ###P<0.001 and
####P<0.0001 (Ad-IRF1 vs. Ad-NC/mock). Ad, adenovirus
expression vector; CRC, colorectal cancer; IRF1, interferon
regulatory factor 1; NC, negative control; ns, not significant;
shRNA, short hairpin RNA. |
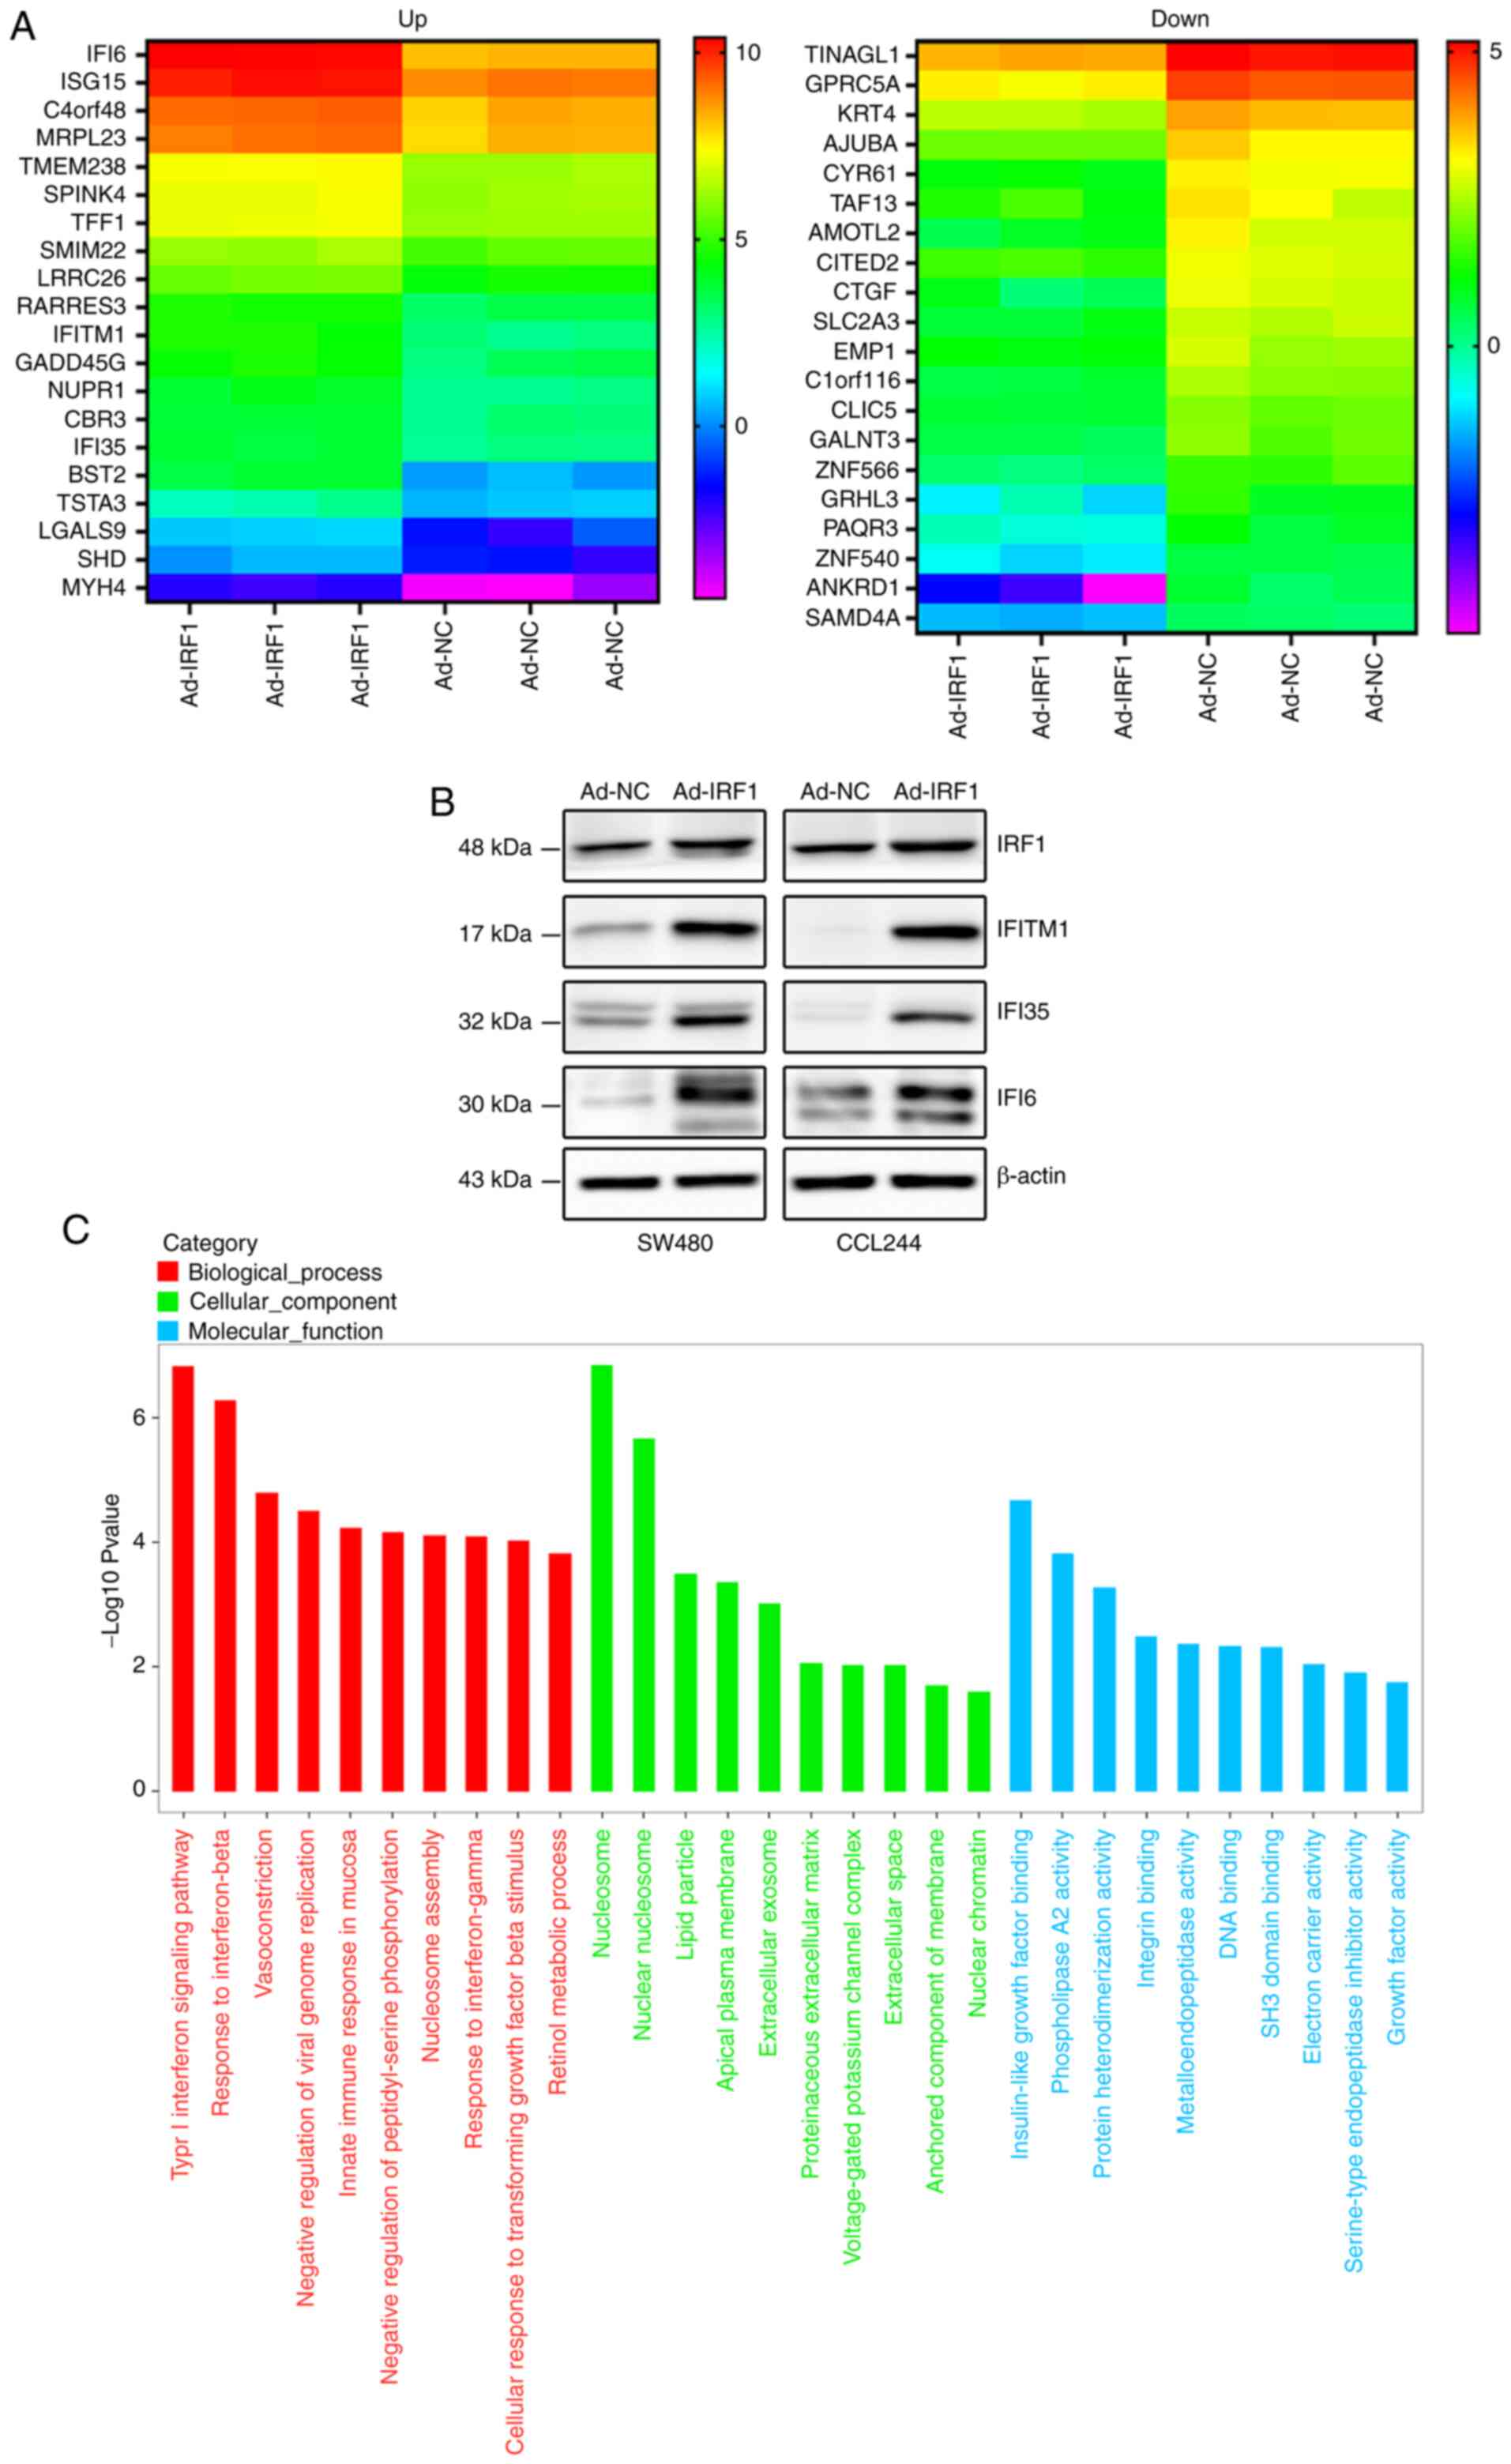
IRF1 affects the biological behavior of
CRC, likely by regulating the expression levels of
interferon-induced proteins
To further explore the effect of IRF1 on the
biological behavior of CRC, the present study examined the
expression levels of mRNAs after IRF1 upregulation by RNA
sequencing. Based on the sequencing results, the present study
identified 20 mRNAs that were upregulated or downregulated, and a
heat map was generated (Fig.
6A). Detailed information is included in Tables I and II. The present study identified that
among the upregulated mRNAs, the expression levels of three
interferon-induced proteins (IFI6, IFITM1 and IFI35) were increased
significantly. Their expression was positively associated with
IRF1, as demonstrated by western blot analysis (Fig. 6B).
 | Table ISignificantly upregulated mRNAs
following the overexpression of IRF1 according to RNA
sequencing. |
Table I
Significantly upregulated mRNAs
following the overexpression of IRF1 according to RNA
sequencing.
| ID | Base mean | Base mean control
sample NC | Base mean case
sample Ad-IRF1 | Fold change | log2
fold change | P-value | Adjusted
P-value | Gene |
|---|
| IFI6 | 8362.5161 | 2804.2397 | 13920.7926 | 4.9642 | 2.3116 | 0 | 0 | Up |
| BST2 | 131.2432 | 23.2430 | 239.2434 | 10.2931 | 3.3636 |
1.65×10−53 |
1.30×10−49 | Up |
| TFF1 | 773.5291 | 480.7576 | 1066.3006 | 2.2180 | 1.1492 |
1.21×10⁻³³ |
1.46×10⁻³⁰ | Up |
| ISG15 | 6329.8561 | 3499.2967 | 9160.4154 | 2.6178 | 1.3883 |
2.49×10⁻³³ |
2.79×10⁻³⁰ | Up |
| TMEM238 | 432.1279 | 251.8244 | 612.4313 | 2.4320 | 1.2821 |
3.19×10⁻³⁰ |
3.13×10⁻²⁷ | Up |
| RARRES3 | 247.1411 | 136.0866 | 358.1957 | 2.6321 | 1.3962 |
4.76×10⁻²³ |
2.49×10⁻²⁰ | Up |
| LRRC26 | 240.0970 | 139.0721 | 341.1219 | 2.4528 | 1.2945 |
1.11×10⁻¹⁹ |
3.49×10⁻¹⁷ | Up |
| NUPR1 | 192.9297 | 105.5262 | 280.3331 | 2.6565 | 1.4095 |
5.60×10⁻¹⁹ |
1.60×10⁻¹⁶ | Up |
| IFITM1 | 180.7444 | 76.9545 | 284.5344 | 3.6974 | 1.8865 |
9.90×10⁻¹⁸ |
2.35×10⁻¹⁵ | Up |
| C4orf48 | 1337.1611 | 856.0667 | 1818.2556 | 2.1240 | 1.0868 |
1.55×10⁻¹⁶ |
2.94×10⁻¹⁴ | Up |
| IFI35 | 245.9523 | 159.7153 | 332.1892 | 2.0799 | 1.0565 |
4.29×10⁻¹⁴ |
5.26×10⁻¹² | Up |
| SPINK4 | 609.8811 | 393.3366 | 826.4257 | 2.1011 | 1.0711 |
6.25×10⁻¹³ |
5.89×10⁻¹¹ | Up |
| CBR3 | 210.2773 | 138.8154 | 281.7391 | 2.0296 | 1.0212 |
7.98×10⁻¹² |
5.91×10⁻¹⁰ | Up |
| GADD45G | 154.6964 | 90.6289 | 218.7639 | 2.4138 | 1.2713 |
2.96×10⁻¹¹ |
1.94×10⁻⁹ | Up |
| MRPL23 | 4537.9171 | 3004.8832 | 6070.9510 | 2.0204 | 1.0146 |
6.21×10⁻¹¹ |
3.68×10⁻⁹ | Up |
| MYH4 | 32.3621 | 10.9477 | 53.7765 | 4.9121 | 2.2964 |
4.95×10⁻⁹ |
1.73×10⁻⁷ | Up |
| SMIM22 | 619.3599 | 411.7948 | 826.9250 | 2.0081 | 1.0058 |
6.72×10⁻⁹ |
2.28×10⁻⁷ | Up |
| LGALS9 | 34.6546 | 12.7458 | 56.5634 | 4.4378 | 2.1498 |
1.10×10⁻⁸ |
3.55×10⁻⁷ | Up |
| TSTA3 | 174.7754 | 109.1525 | 240.3983 | 2.2024 | 1.1391 |
7.56×10⁻⁸ |
1.96×10⁻⁶ | Up |
| SHD | 34.9248 | 14.7999 | 55.0497 | 3.7196 | 1.8951 |
2.99×10⁻⁷ |
6.68×10⁻⁶ | Up |
| Table IISignificantly downregulated mRNAs
following the overexpression of IRF1 according to RNA
sequencing. |
Table II
Significantly downregulated mRNAs
following the overexpression of IRF1 according to RNA
sequencing.
| ID | Base mean | Base mean control
sample NC | Base mean case
sample Ad-IRF1 | Fold change | log2
fold change | P-value | Adjusted
P-value | Gene |
|---|
| CYR61 | 286.7657 | 445.3502 | 128.1812 | 0.2878 | −1.7968 |
5.70×10−39 |
1.79×10⁻³⁵ | Down |
| CTGF | 226.0636 | 362.1031 | 90.0241 | 0.2486 | −2.0080 |
1.09×10−38 |
2.86×10⁻³⁵ | Down |
| SLC2A3 | 411.6516 | 618.3295 | 204.9737 | 0.3315 | −1.5929 |
1.27×10−37 |
2.74×10⁻³⁴ | Down |
| GPRC5A | 861.9170 | 1180.5053 | 543.3287 | 0.4603 | −1.1195 |
1.39×10−37 |
2.74×10⁻³⁴ | Down |
| C1orf116 | 432.2862 | 629.9506 | 234.6219 | 0.3724 | −1.4249 |
3.39×10−36 |
5.92×10⁻³³ | Down |
| TINAGL1 | 717.7809 | 986.1473 | 449.4144 | 0.4557 | −1.1338 |
3.75×10⁻³⁴ |
5.35×10⁻³¹ | Down |
| AMOTL2 | 449.3289 | 700.5839 | 198.0739 | 0.2827 | −1.8225 |
2.93×10⁻²⁹ |
2.70×10⁻²⁶ | Down |
| KRT4 | 454.6213 | 609.3405 | 299.9020 | 0.4922 | −1.0228 |
8.74×10⁻²¹ |
3.35×10⁻¹⁸ | Down |
| ANKRD1 | 44.2735 | 81.4814 | 7.0655 | 0.0867 | −3.5276 |
3.36×10⁻²⁰ |
1.15×10⁻¹⁷ | Down |
| AJUBA | 657.5500 | 909.5501 | 405.5498 | 0.4459 | −1.1653 |
1.63×10⁻¹⁹ |
5.03×10⁻¹⁷ | Down |
| CLIC5 | 348.2467 | 471.4531 | 225.0403 | 0.4773 | −1.0669 |
2.02×10⁻¹⁸ |
5.38×10⁻¹⁶ | Down |
| SAMD4A | 146.1898 | 214.0379 | 78.3416 | 0.3660 | −1.4500 |
1.41×10⁻¹⁵ |
2.27×10⁻¹³ | Down |
| TAF13 | 106.3080 | 155.0966 | 57.5194 | 0.3709 | −1.4310 |
9.57×10⁻¹² |
6.90×10⁻¹⁰ | Down |
| ZNF566 | 209.2546 | 290.5804 | 127.9288 | 0.4403 | −1.1836 |
1.15×10⁻¹¹ |
8.20×10⁻¹⁰ | Down |
| CITED2 | 192.1906 | 259.8504 | 124.5308 | 0.4792 | −1.0612 |
1.96×10⁻¹¹ |
1.35×10⁻⁹ | Down |
| EMP1 | 303.1375 | 421.9202 | 184.3549 | 0.4369 | −1.1945 |
2.02×10⁻¹¹ |
1.38×10⁻⁹ | Down |
| GALNT3 | 306.3284 | 426.9941 | 185.6626 | 0.4348 | −1.2015 |
4.12×10⁻¹¹ |
2.55×10⁻⁹ | Down |
| PAQR3 | 161.8251 | 220.2059 | 103.4443 | 0.4698 | −1.0900 |
1.47×10⁻¹⁰ |
8.01×10⁻⁹ | Down |
| ZNF540 | 118.3167 | 167.1335 | 69.4998 | 0.4158 | −1.2659 |
1.80×10⁻¹⁰ |
9.46×10⁻⁹ | Down |
| GRHL3 | 87.9749 | 134.5827 | 41.3672 | 0.3074 | −1.7019 |
4.25×10⁻¹⁰ |
2.05×10⁻⁸ | Down |
Gene Ontology analysis, based on RNA sequencing
results, indicated that IRF1 could upregulate numerous genes that
are involved in the 'type I interferon signaling pathway',
'response to interferon-beta', 'innate immune response in mucosa'
and 'response to interferon-gamma', suggesting that IRF1
participates in interferon-regulated tumor immunity, as
aforementioned. The signaling pathway analysis also indicated that
IRF1 was involved in the regulation of multiple cellular components
of CRC cells, especially the cellular membrane structure, such as
'nucleosome', 'nuclear nucleosome', 'lipid particle', 'apical
plasma membrane' and 'extracellular exosome'. Furthermore, IRF1 was
demonstrated to affect cellular activity at molecular levels, such
as 'insulin-like growth factor binding', 'phospholipase A2
activity' and 'protein heterodimerization activity' in CRC cells,
which may be achieved by regulating membrane structure (Fig. 6C).
Discussion
The roles IRF1 serves in innate and adaptive tumor
immunity have become a popular research topic in recent years. The
effects of IRF1 on antitumor immunity depend on affecting
mitochondrial dynamics (35) and
glycolysis (36), regulating
programmed death-ligand 1 (PD-L1) (37-40) and even priming tumor-derived
exosomes (41). Lai et al
(42) reported that decitabine
improves the efficiency of anti-programmed cell death protein-1
(PD-1) therapy for lung cancer by activating the hypomethylation of
IRF1/7 in the IFN response signaling pathway. Wu et al
(43) revealed that YAP inhibits
IFNc-inducible PD-L1 expression partially through
microRNA-130a-mediated suppression of vestigial like family member
4 and IRF1 expression, thereby reducing the PD-L1 interaction with
PD-1 to escape T-cell immune surveillance and reduce the
immunotherapeutic effect on tumors. In fact, the role of IRF1
itself is not limited to immunotherapy; it serves a decisive role
in tumor growth, invasion and migration, and tumor radiotherapy and
chemotherapy.
IRF1 also serves an important role in the tumor
response to radiation. As early as 2009, a study reported that IRF1
is an important radiation-specific biomarker of cancers, as
analyzed by microarray and bioinformatics analyses (44). It has been reported that IRF1 is
mainly localized in the cytoplasm and translocates to the nucleus
after activation (20). Similar
to the previous research results, the present study revealed that
when CRC cells were treated with X-rays, the distribution of IRF1
in the cytoplasm and nucleus was altered, and the total protein
expression levels of IRF1 were increased for different radiation
doses and irradiation time points.
It is now clear that IRF1 has anti-oncogenic
activity by blocking cell cycle progression, inducing tumor
suppressor genes, downregulating growth-promoting genes and
upregulating the apoptosis process (6,45). The present study revealed that
when IRF1 was upregulated, the proliferation rate of CRC cells was
decreased, and the tumor size was smaller than that of the control.
The percentage of cells undergoing apoptosis was increased, and the
cell cycle was blocked. Furthermore, all inhibitory effects of
X-ray radiation on CRC were aggravated. Previous studies have
demonstrated that IRF1 affects the migration and invasion of tumor
cells (46-48). Jiang et al (49) reported that downregulation of
IRF1 could increase the invasion capacity and abrogate the
inhibitory effect of myotubularin related protein 2 knockdown on
the invasion of gastric cancer cells. These findings are consistent
with the present results in CRC, revealing that upregulation of
IRF1 inhibited distant metastasis of CRC to the liver and lung
in vivo.
The present results demonstrated that IRF1 regulated
the expression levels of interferon-induced proteins (IFI6, IFITM1
and IFI35), as analyzed by RNA sequencing and western blotting.
These three interferon-induced proteins are mostly involved in
immune responses caused by viral infection (50-52). Their involvement in the
development of cancer is also evident. Studies have identified that
both IFI6 (53) and IFITM1
(54) are involved in the
development of breast cancer, while IFI35 is involved in the
regulation of the innate immune response of astrocytoma (55). Furthermore, these three proteins
are known to have a close association with IRF1. A previous study
reported that both IRF1 and IFI6 are positively associated with the
drug-specific chemosensitivity of gastric cancer (56). Gómez-Herranz et al
(57) revealed that IRF1 is one
of the most dominant IFN-γ inducible proteins whose synthesis is
attenuated in IFITM1/IFITM3-negative cervical cancer cells. Yang
et al (58) reported that
IRF1 could directly bind to one site of the IFI35 promoter and
mediate IFN-γ-dependent transcriptional activation of IFI35 in HeLa
cells. These findings support the hypothesis that IRF1 affects the
biological behavior of CRC by regulating interferon-induced
proteins. Based on the present results and the literature, it was
hypothesized that IRF1 may affect the development and
radiosensitivity of CRC through interferon-induced proteins. This
hypothesis merits further investigation.
In summary, the present study demonstrated that IRF1
expression was downregulated in CRC tissues and that it was
positively associated with patient prognosis. IRF1 upregulation
inhibited the progression and increased the radiosensitivity of CRC
likely by regulating the expression levels of interferon-induced
proteins.
Supplementary Data
Availability of data and materials
The datasets used and/or analyzed during the current
study are available from the corresponding author on reasonable
request.
Authors' contributions
XX, KY and YW conceived and coordinated the study,
designed, performed and analyzed the experiments, and drafted the
manuscript. YH, WD and CX carried out the data collection and
analysis and revised the manuscript. The authenticity of the raw
data was assessed by XX and CX. All authors read and approved the
final manuscript.
Ethics approval and consent to
participate
All patients provided signed, informed consent for
their tissues to be used for scientific research. Ethical approval
for the study was obtained from the Second Hospital of Wuxi
(approval no. KY-2020-001; Wuxi, China). The present study was
approved by the Institutional Animal Care and Use Committee of
Soochow University (Suzhou, China).
Patient consent for publication
Not applicable.
Competing interests
The authors declare that they have no competing
interests.
Acknowledgments
Not applicable.
Funding
The present study was supported by the National Natural Science
Foundation of China (grant no. 81703022), Jiangsu Province Key
Youth Talents Project (grant no. QNRC2016262), Gusu Health Talents
Training Project (grant no. GSWS2019078) and Jiangsu Province
Graduate Research and Practice Innovation Project (grant no.
KYCX17_1995). The funders had no role in study design, data
collection and analysis, decision to publish, or preparation of the
manuscript.
References
|
1
|
González-Quezada BA, Santana-Bejarano UF,
Corona-Rivera A, Pimentel-Gutiérrez HJ, Silva-Cruz R,
Ortega-De-la-Torre C, Franco-Topete R, Franco-Topete K,
Centeno-Flores MW, Maciel-Gutiérrez VM, et al: Expression profile
of NF-κB regulated genes in sporadic colorectal cancer patients.
Oncol Lett. 15:7344–7354. 2018.
|
|
2
|
Siegel RL, Miller KD and Jemal A: Cancer
statistics, 2019. CA Cancer J Clin. 69:7–34. 2019. View Article : Google Scholar : PubMed/NCBI
|
|
3
|
Chiu HM, Hsu WF, Chang LC and Wu MH:
Colorectal cancer screening in Asia. Curr Gastroenterol Rep.
19:472017. View Article : Google Scholar : PubMed/NCBI
|
|
4
|
Abraha I, Aristei C, Palumbo I, Lupattelli
M, Trastulli S, Cirocchi R, De Florio R and Valentini V:
Preoperative radiotherapy and curative surgery for the management
of localised rectal carcinoma. Cochrane Database Syst Rev.
10:Cd0021022018.PubMed/NCBI
|
|
5
|
Liu N, Cui W, Jiang X, Zhang Z, Gnosa S,
Ali Z, Jensen L, Jönsson JI, Blockhuys S, Lam EWF, et al: The
critical role of dysregulated RhoB signaling pathway in
radioresistance of colorectal cancer. Int J Radiat Oncol Biol Phys.
104:1153–1164. 2019. View Article : Google Scholar : PubMed/NCBI
|
|
6
|
Alsamman K and El-Masry OS: Interferon
regulatory factor 1 inactivation in human cancer. Biosci Rep.
38:BSR201716722018. View Article : Google Scholar : PubMed/NCBI
|
|
7
|
Campos Carrascosa L, Klein M, Kitagawa Y,
Lückel C, Marini F, König A, Guralnik A, Raifer H, Hagner-Benes S,
Rädler D, et al: Reciprocal regulation of the Il9 locus by
counteracting activities of transcription factors IRF1 and IRF4.
Nat Commun. 8:153662017. View Article : Google Scholar : PubMed/NCBI
|
|
8
|
Carrascosa LC, Klein M, Kitagawa Y, Lückel
C, Marini F, König A, Guralnik A, Raifer H, Hagner-Benes S, Rädler
D, et al: Reciprocal regulation of the Il9 locus by counteracting
activities of transcription factors IRF1 and IRF4. Nat Commun.
8:153662017. View Article : Google Scholar
|
|
9
|
Ramsauer K, Farlik M, Zupkovitz G, Seiser
C, Kröger A, Hauser H and Decker T: Distinct modes of action
applied by transcription factors STAT1 and IRF1 to initiate
transcription of the IFN-gamma-inducible gbp2 gene. Proc Natl Acad
Sci USA. 104:2849–2854. 2007. View Article : Google Scholar : PubMed/NCBI
|
|
10
|
Cook KL, Schwartz-Roberts JL, Baumann WT
and Clarke R: Linking autophagy with inflammation through IRF1
signaling in ER+ breast cancer. Mol Cell Oncol. 3:e10239282015.
View Article : Google Scholar
|
|
11
|
Walch-Ruckheim B, Pahne-Zeppenfeld J,
Fischbach J, Wickenhauser C, Horn LC, Tharun L, Büttner R, Mallmann
P, Stern P, Kim YJ, et al: STAT3/IRF1 pathway activation sensitizes
cervical cancer cells to chemotherapeutic drugs. Cancer Res.
76:3872–3883. 2016. View Article : Google Scholar : PubMed/NCBI
|
|
12
|
Mao L, Zhang Y, Mo W, Yu Y and Lu H: BANF1
is downregulated by IRF1-regulated microRNA-203 in cervical cancer.
PLoS One. 10:e01170352015. View Article : Google Scholar : PubMed/NCBI
|
|
13
|
Yu M, Xue H, Wang Y, Shen Q, Jiang Q,
Zhang X, Li K, Jia M, Jia J, Xu J and Tian Y: miR-345 inhibits
tumor metastasis and EMT by targeting IRF1-mediated mTOR/STAT3/AKT
pathway in hepatocellular carcinoma. Int J Oncol. 50:975–983. 2017.
View Article : Google Scholar : PubMed/NCBI
|
|
14
|
Ebine K, Kumar K, Pham TN, Shields MA,
Collier KA, Shang M, DeCant BT, Urrutia R, Hwang RF, Grimaldo S, et
al: Interplay between interferon regulatory factor 1 and BRD4 in
the regulation of PD-L1 in pancreatic stellate cells. Sci Rep.
8:132252018. View Article : Google Scholar : PubMed/NCBI
|
|
15
|
Kanayama M, Hayano T, Koebis M, Maeda T,
Tabe Y, Horie S and Aiba A: Hyperactive mTOR induces neuroendocrine
differentiation in prostate cancer cell with concurrent
up-regulation of IRF1. Prostate. 77:1489–1498. 2017. View Article : Google Scholar : PubMed/NCBI
|
|
16
|
Bachmann SB, Frommel SC, Camicia R,
Winkler HC, Santoro R and Hassa PO: DTX3L and ARTD9 inhibit IRF1
expression and mediate in cooperation with ARTD8 survival and
proliferation of metastatic prostate cancer cells. Mol Cancer.
13:1252014. View Article : Google Scholar : PubMed/NCBI
|
|
17
|
Yuan L, Zhou C, Lu Y, Hong M, Zhang Z,
Zhang Z, Chang Y, Zhang C and Li X: IFN-γ-mediated IRF1/miR-29b
feedback loop suppresses colorectal cancer cell growth and
metastasis by repressing IGF1. Cancer Lett. 359:136–147. 2015.
View Article : Google Scholar : PubMed/NCBI
|
|
18
|
Hong M, Zhang Z, Chen Q, Lu Y, Zhang J,
Lin C, Zhang F, Zhang W and Li X, Zhang W and Li X: IRF1 inhibits
the proliferation and metastasis of colorectal cancer by
suppressing the RAS-RAC1 pathway. Cancer Manag Res. 11:369–378.
2019. View Article : Google Scholar : PubMed/NCBI
|
|
19
|
Chen X, Liu L, Mims J, Punska EC, Williams
KE, Zhao W, Arcaro KF, Tsang AW, Zhou X and Furdui CM: Analysis of
DNA methylation and gene expression in radiation-resistant head and
neck tumors. Epigenetics. 10:545–561. 2015. View Article : Google Scholar : PubMed/NCBI
|
|
20
|
Chen J, Markelc B, Kaeppler J, Ogundipe
VML, Cao Y, McKenna WG and Muschel RJ: STING-dependent
interferon-λ1 induction in HT29 cells, a human colorectal cancer
cell line, after gamma-radiation. Int J Radiat Oncol Biol Phys.
101:97–106. 2018. View Article : Google Scholar : PubMed/NCBI
|
|
21
|
Gonzalez RS, Raza A, Propst R, Adeyi O,
Bateman J, Sopha SC, Shaw J and Auerbach A: Recent advances in
digestive tract tumors: Updates from the 5th edition of the world
health organization 'Blue Book'. Arch Pathol Lab Med. Jul
31–2020.Epub ahead of print. View Article : Google Scholar
|
|
22
|
Xu X, Song C, Chen Z, Yu C, Wang Y, Tang Y
and Luo J: Downregulation of HuR inhibits the progression of
esophageal cancer through interleukin-18. Cancer Res Treat.
50:71–87. 2018. View Article : Google Scholar :
|
|
23
|
Thul PJ and Lindskog C: The human protein
atlas: A spatial map of the human proteome. Protein Sci.
27:233–244. 2018. View Article : Google Scholar
|
|
24
|
Yang XD, Xu XH, Zhang SY, Wu Y, Xing CG,
Ru G, Xu HT and Cao JP: Role of miR-100 in the radioresistance of
colorectal cancer cells. Am J Cancer Res. 5:545–559.
2015.PubMed/NCBI
|
|
25
|
Kim D, Langmead B and Salzberg SL: HISAT:
A fast spliced aligner with low memory requirements. Nat Methods.
12:357–360. 2015. View Article : Google Scholar : PubMed/NCBI
|
|
26
|
Roberts A, Trapnell C, Donaghey J, Rinn JL
and Pachter L: Improving RNA-Seq expression estimates by correcting
for fragment bias. Genome Biol. 12:R222011. View Article : Google Scholar : PubMed/NCBI
|
|
27
|
Trapnell C, Williams BA, Pertea G,
Mortazavi A, Kwan G, van Baren MJ, Salzberg SL, Wold BJ and Pachter
L: Transcript assembly and quantification by RNA-Seq reveals
unannotated transcripts and isoform switching during cell
differentiation. Nat Biotechnol. 28:511–515. 2010. View Article : Google Scholar : PubMed/NCBI
|
|
28
|
Anders S, Pyl PT and Huber W: HTSeq-a
Python framework to work with high-throughput sequencing data.
Bioinformatics. 31:166–169. 2015. View Article : Google Scholar
|
|
29
|
Anders S and Huber W: Differential
expression of RNA-Seq data at the gene level - the DESeq package.
European Molecular Biology Laboratory (EMBL); Germany:
|
|
30
|
Zheng Q and Wang XJ: GOEAST: A web-based
software toolkit for gene ontology enrichment analysis. Nucleic
Acids Res. 36:W358–W363. 2008. View Article : Google Scholar : PubMed/NCBI
|
|
31
|
Kanehisa M, Araki M, Goto S, Hattori M,
Hirakawa M, Itoh M, Katayama T, Kawashima S, Okuda S, Tokimatsu T
and Yamanishi Y: KEGG for linking genomes to life and the
environment. Nucleic Acids Res. 36:D480–D484. 2008. View Article : Google Scholar :
|
|
32
|
Xie Y, Zhu S, Song X, Sun X, Fan Y, Liu J,
Zhong M, Yuan H, Zhang L, Billiar TR, et al: The tumor suppressor
p53 limits ferroptosis by blocking DPP4 activity. Cell Rep.
20:1692–1704. 2017. View Article : Google Scholar : PubMed/NCBI
|
|
33
|
Tauriello DVF, Palomo-Ponce S, Stork D,
Berenguer-Llergo A, Badia-Ramentol J, Iglesias M, Sevillano M,
Ibiza S, Cañellas A, Hernando-Momblona X, et al: TGFβ drives immune
evasion in genetically reconstituted colon cancer metastasis.
Nature. 554:538–543. 2018. View Article : Google Scholar : PubMed/NCBI
|
|
34
|
Kim BM and Hong Y, Lee S, Liu P, Lim JH,
Lee YH, Lee TH, Chang KT and Hong Y: Therapeutic implications for
overcoming radiation resistance in cancer therapy. Int J Mol Sci.
16:26880–26913. 2015. View Article : Google Scholar : PubMed/NCBI
|
|
35
|
Gao Z, Li Y, Wang F, Huang T, Fan K, Zhang
Y, Zhong J, Cao Q, Chao T, Jia J, et al: Mitochondrial dynamics
controls anti-tumour innate immunity by regulating CHIP-IRF1 axis
stability. Nat Commun. 8:18052017. View Article : Google Scholar : PubMed/NCBI
|
|
36
|
Cascone T, McKenzie JA, Mbofung RM, Punt
S, Wang Z, Xu C, Williams LJ, Wang Z, Bristow CA, Carugo A, et al:
Increased tumor glycolysis characterizes immune resistance to
adoptive T cell therapy. Cell Metab. 27:977–987.e974. 2018.
View Article : Google Scholar : PubMed/NCBI
|
|
37
|
Xiong W, Deng H, Huang C, Zen C, Jian C,
Ye K, Zhong Z, Zhao X and Zhu L: MLL3 enhances the transcription of
PD-L1 and regulates anti-tumor immunity. Biochim Biophys Acta Mol
Basis Dis. 1865:454–463. 2019. View Article : Google Scholar
|
|
38
|
Lu C, Redd PS, Lee JR, Savage N and Liu K:
The expression profiles and regulation of PD-L1 in tumor-induced
myeloid-derived suppressor cells. Oncoimmunology. 5:e12471352016.
View Article : Google Scholar
|
|
39
|
Garcia-Diaz A, Shin DS, Moreno BH, Saco J,
Escuin-Ordinas H, Rodriguez GA, Zaretsky JM, Sun L, Hugo W, Wang X,
et al: Interferon receptor signaling pathways regulating PD-L1 and
PD-L2 expression. Cell Rep. 29:37662019. View Article : Google Scholar : PubMed/NCBI
|
|
40
|
Shao L, Hou W, Scharping NE, Vendetti FP,
Srivastava R, Roy CN, Menk AV, Wang Y, Chauvin JM, Karukonda P, et
al: IRF1 inhibits antitumor immunity through the upregulation of
PD-L1 in the tumor cell. Cancer Immunol Res. 7:1258–1266. 2019.
View Article : Google Scholar : PubMed/NCBI
|
|
41
|
Yang MQ, Du Q, Varley PR, Goswami J, Liang
Z, Wang R, Li H, Stolz DB and Geller DA: Interferon regulatory
factor 1 priming of tumour-derived exosomes enhances the antitumour
immune response. Br J Cancer. 118:62–71. 2018. View Article : Google Scholar :
|
|
42
|
Lai Q, Wang H, Li A, Xu Y, Tang L, Chen Q,
Zhang C, Gao Y, Song J and Du Z: Decitibine improve the efficiency
of anti-PD-1 therapy via activating the response to IFN/PD-L1
signal of lung cancer cells. Oncogene. 37:2302–2312. 2018.
View Article : Google Scholar : PubMed/NCBI
|
|
43
|
Wu A, Wu Q, Deng Y, Liu Y, Lu J, Liu L, Li
X, Liao C, Zhao B and Song H: Loss of VGLL4 suppresses tumor PD-L1
expression and immune evasion. EMBO J. 38:e995062019. View Article : Google Scholar
|
|
44
|
Eschrich S, Zhang H, Zhao H, Boulware D,
Lee JH, Bloom G and Torres-Roca JF: Systems biology modeling of the
radiation sensitivity network: A biomarker discovery platform. Int
J Radiat Oncol Biol Phys. 75:497–505. 2009. View Article : Google Scholar : PubMed/NCBI
|
|
45
|
Ohsugi T, Yamaguchi K, Zhu C, Ikenoue T,
Takane K, Shinozaki M, Tsurita G, Yano H and Furukawa Y:
Anti-apoptotic effect by the suppression of IRF1 as a downstream of
Wnt/β-catenin signaling in colorectal cancer cells. Oncogene.
38:6031–6064. 2019. View Article : Google Scholar
|
|
46
|
Wan P, Zhang J, Du Q and Geller DA: The
clinical significance and biological function of interferon
regulatory factor 1 in cholangiocarcinoma. Biomed Pharmacother.
97:771–777. 2018. View Article : Google Scholar
|
|
47
|
Qi L, Li T, Shi G, Wang J, Li X, Zhang S,
Chen L, Qin Y, Gu Y, Zhao W and Guo Z: An individualized gene
expression signature for prediction of lung adenocarcinoma
metastases. Mol Oncol. 11:1630–1645. 2017. View Article : Google Scholar : PubMed/NCBI
|
|
48
|
Zhou Y, Wang Q, Chu L, Dai W, Zhang X,
Chen J, Zhang L, Ding P, Zhang X, Gu H, et al: FOXM1c promotes
oesophageal cancer metastasis by transcriptionally regulating IRF1
expression. Cell Prolif. 52:e125532019. View Article : Google Scholar
|
|
49
|
Jiang L, Liu JY, Shi Y, Tang B, He T, Liu
JJ, Fan JY, Wu B, Xu XH, Zhao YL, et al: MTMR2 promotes invasion
and metastasis of gastric cancer via inactivating IFNγ/STAT1
signaling. J Exp Clin Cancer Res. 38:2062019. View Article : Google Scholar
|
|
50
|
Meyer K, Kwon YC, Liu S, Hagedorn CH, Ray
RB and Ray R: Interferon-α inducible protein 6 impairs EGFR
activation by CD81 and inhibits hepatitis C virus infection. Sci
Rep. 5:90122015. View Article : Google Scholar
|
|
51
|
Wu X, Wang S, Yu Y, Zhang J, Sun Z, Yan Y
and Zhou J: Subcellular proteomic analysis of human host cells
infected with H3N2 swine influenza virus. Proteomics. 13:3309–3326.
2013. View Article : Google Scholar : PubMed/NCBI
|
|
52
|
Hussein HA, Briestenska K, Mistrikova J
and Akula SM: IFITM1 expression is crucial to gammaherpesvirus
infection, in vivo. Sci Rep. 8:141052018. View Article : Google Scholar : PubMed/NCBI
|
|
53
|
Cheriyath V, Kaur J, Davenport A, Khalel
A, Chowdhury N and Gaddipati L: G1P3 (IFI6), a mitochondrial
localised antiapoptotic protein, promotes metastatic potential of
breast cancer cells through mtROS. Br J Cancer. 119:52–64. 2018.
View Article : Google Scholar : PubMed/NCBI
|
|
54
|
Lui AJ, Geanes ES, Ogony J, Behbod F,
Marquess J, Valdez K, Jewell W, Tawfik O and Lewis-Wambi J: IFITM1
suppression blocks proliferation and invasion of aromatase
inhibitor-resistant breast cancer in vivo by JAK/STAT-mediated
induction of p21. Cancer Lett. 399:29–43. 2017. View Article : Google Scholar : PubMed/NCBI
|
|
55
|
Shirai K, Shimada T, Yoshida H, Hayakari
R, Matsumiya T, Tanji K, Murakami M, Tanaka H and Imaizumi T:
Interferon (IFN)-induced protein 35 (IFI35) negatively regulates
IFN-β-phosphorylated STAT1-RIG-I-CXCL10/CCL5 axis in U373MG
astrocytoma cells treated with polyinosinic-polycytidylic acid.
Brain Res. 1658:60–67. 2017. View Article : Google Scholar : PubMed/NCBI
|
|
56
|
Jung JJ, Jeung HC, Chung HC, Lee JO, Kim
TS, Kim YT, Noh SH and Rha SY: In vitro pharmacogenomic database
and chemosensitivity predictive genes in gastric cancer. Genomics.
93:52–61. 2009. View Article : Google Scholar
|
|
57
|
Gómez-Herranz M, Nekulova M, Faktor J,
Hernychova L, Kote S, Sinclair EH, Nenutil R, Vojtesek B, Ball KL
and Hupp TR: The effects of IFITM1 and IFITM3 gene deletion on IFNg
stimulated protein synthesis. Cell Signall. 60:39–56. 2019.
View Article : Google Scholar
|
|
58
|
Yang W, Tan J, Liu R, Cui X, Ma Q, Geng Y
and Qiao W: Interferon-g upregulates expression of IFP35 gene in
HeLa cells via interferon regulatory factor-1. PLoS One.
7:e509322012. View Article : Google Scholar
|