Introduction
Colorectal cancer (CRC) is the third most common
cancer in men and the second in women worldwide (1). The main cause of death in CRC
patients is distant metastasis. Identification of factors and
mechanisms underlying CRC development and progression, as well as
detection of early-stage disease markers could effectively prevent
death from CRC.
Alterations in genes are one of the mainsprings of
CRC. This includes inactivation of tumor suppressor genes by
genetic and epigenetic mechanisms. Tumor suppressor genes are
typically inactivated by mutation, deletion, or promoter
methylation which silences gene expression (2). Pleomorphic adenoma gene-like 1 gene
(PLAGL1, also known as ZAC1 or LOT1) is the
candidate tumor suppressor gene that encodes a protein with
antiproliferative activity which is due to the induction of
apoptosis and cell cycle arrest (3).
PLAGL1 is widely expressed in normal tissues
(4), and localized on chromosome
6q24-25, a region maternally imprinted (5), and frequently deleted in many tumors
(6). It was shown that
PLAGL1 may be transcriptionally silenced by DNA methylation
of CpG islands and histone deacetylation (5). Altered expression of PLAGL1
gene was observed in several types of human cancers and
tumor-derived cell lines such as breast (7), ovary (8,9), and
prostate tumors (10), as well as
in nonfunctioning pituitary adenomas (11), head and neck squamous cell
carcinoma (12), and basal cell
carcinoma (6). Expression
profiling of colorectal samples of CRC patients with cDNA
microarrays also demonstrated altered expression of PLAGL1
mRNA in CRC as compared to proximal non-cancerous colorectal mucosa
(13), but there is no previous
comparison of PLAGL1 expression in CRC tissue and colon
mucosa of healthy subjects at the mRNA and protein levels.
Moreover, the prognostic value of the PLAGL1 expression
level in CRC progression and patient survival remains unknown.
Therefore, the main objective of our study was to analyze and
compare PLAGL1 gene expression in samples of tumor and
unchanged colorectal tissues of CRC patients as well as in mucosal
colon biopsies in a group of healthy subjects by quantitative
real-time PCR (qPCR), western blotting and immunohistochemical
(IHC) techniques. Furthermore, we have examined levels of
PLAGL1 mRNA in CRC cell lines. To estimate the prognostic
significance of the PLAGL1 expression level, we analyzed
correlations between the expression level of PLAGL1 and
clinicopathological features of CRC patients, as well as the
overall survival of the patients.
Materials and methods
Ethics
This study was performed in accordance with the
ethical standards, and approved by the Bioethics Committee of the
University of Warmia and Mazury in Olsztyn (decision no. 3/2010 and
34/2010), and informed written consent regarding the use of tissue
was obtained from each patient included in the study.
Patients and collection of colorectal
samples
The specimens were collected at the Hospital of the
Ministry of Internal Affairs and Administration in Olsztyn from
2010 to 2013. The study included 121 patients with CRC (demographic
and clinicopathological data are presented in Table I). None of the CRC patients had a
second neoplastic disease or had previously undergone chemo- or
radiotherapy. The control group consisted of 72 healthy individuals
(24 males and 48 females, average age 57.2±6.65 years, range 36–82
years; mean ± SD) who underwent colonoscopy as a part of a routine
screening for CRC (within the National screening program for early
detection of colorectal cancer). Control subjects had no family
history of CRC. None of the CRC patients or control subjects
suffered from inflammatory bowel disease. Clinical and demographic
data were obtained at the time of enrollment. Data on the overall
survival were collected for all patients. Median follow-up time was
36.1 months.
 | Table IDemographic and clinicopathological
characteristics of studied CRC patients. |
Table I
Demographic and clinicopathological
characteristics of studied CRC patients.
| Parameter | No. of cases | Percentage (%) |
|---|
| Total | 121 | 100.0 |
| Gender | | |
| Male | 67 | 55.4 |
| Female | 54 | 44.6 |
| Age (years) | | |
| ≤67 | 60 | 49.6 |
| >67 | 61 | 50.4 |
| Localization | | |
| Cecum, ascending,
and transverse colon | 44 | 36.4 |
| Descending and
sigmoid colon | 29 | 24.0 |
| Rectum | 48 | 39.7 |
| Depth of invasion
(pT status) | | |
| T1 | 4 | 3.3 |
| T2 | 16 | 13.2 |
| T3 | 80 | 66.1 |
| T4 | 21 | 17.4 |
| Lymph nodes (pN
status) | | |
| N0 | 63 | 52.1 |
| N1 | 38 | 31.4 |
| N2 | 20 | 16.5 |
| Metastasis (pM
status) | | |
| M0 | 106 | 87.6 |
| M1 | 15 | 12.4 |
| TNM stage | | |
| I | 18 | 14.9 |
| II | 41 | 33.9 |
| III | 47 | 38.8 |
| IV | 15 | 12.4 |
CRC samples were obtained during the partial
surgical resection of the large intestine, and control group
specimens were collected during colonoscopy. In CRC patient group,
two types of matched samples were taken within 20 min after tumor
resection: i) tumor tissue and ii) macroscopically unchanged mucosa
from a distant part of resected large intestine. Specimens were
immediately cut in two pieces for qPCR and western blot analyses,
frozen in liquid nitrogen, and stored at −80°C, whereas for routine
histological evaluation and immunohistochemistry, the samples were
fixed in 10% neutral buffered formalin and further processed into
paraffin blocks. In the control group of healthy patients, one
biopsy was fixed in 10% neutral buffered formalin for routine
histological examination, and two specimens from the adjacent
location to the biopsy site were collected for qPCR or western blot
assays.
Cell lines
Human CRC cell lines with different characteristics
(HT-29, SW-480, LoVo) (14) and a
control line, the CCD 841 CoN cell line (epithelial-like,
established from normal colonic tissue) were purchased from the
American Type Culture Collection (ATCC; Manassas, VA, USA). Cells
were cultured under conditions recommended by the manufacturer, and
were harvested at ~80% confluence.
Total RNA extraction and reverse
transcription
Total RNA was extracted from cell lines as well as
paired samples of cancer tissue and unchanged mucosa derived from
121 CRC patients and 40 colonoscopic biopsies of healthy subjects
using a Total RNA Prep Plus kit (A&A Biotechnology, Gdynia,
Poland), following the manufacturer's protocol. Isolated RNA was
quantified with spectrophotometry (NanoDrop 1000, NanoDrop
products, Wilmington, DE, USA). Reverse transcription was carried
out in a vial containing 20 μl reaction mixture of 2 μg of total
RNA, 0.5 μg of oligo dT primers (Sigma-Aldrich, St. Louis, MO,
USA), 200 U of RevertAid™ Reverse Transcriptase, 20 U of RiboLock™
RNase inhibitor, and 1 mM of each dNTP (all Thermo Scientific,
Waltham, MA, USA). Reactions were performed according to the
manufacturer's instructions, and resulting complementary DNAs
(cDNAs) were stored at −20°C after 10-fold dilution with
nuclease-free water to be used as the template in qPCR
analysis.
Real-time quantitative PCR
Quantification of PLAGL1 gene expression was
carried out using ABI 7500/7500 Fast Real-Time PCR system (Life
Technologies, Applied Biosystems, Foster City, CA, USA).
Hypoxanthine phosphoribosyltransferase 1 (HPRT1) gene was
used as an internal control to normalize the transcript levels of
PLAGL1. The levels of PLAGL1 and HPRT1 cDNAs
in collected isolates were determined using TaqMan®Fast
Advanced Master Mix and a respective TaqMan® Gene
Expression assay (all from Life Technologies, Applied Biosystems)
according to the manufacturer's instructions. The primers and
TaqMan probes used were PLAGL1: Hs00414677_m1, and
HPRT1: Hs02800695_m1. All samples were amplified in
duplicates using the following conditions: polymerase activation
for 20 sec at 95°C, followed by 40 cycles of denaturation at 95°C
for 3 sec and annealing/extension at 60°C for 30 sec. No template
control reactions were performed for each qPCR run. Standard curves
consisting of serial dilutions of the appropriate cDNA were used to
control the efficiency of qPCR reactions. Relative quantification
of PLAGL1 expression was evaluated using the ΔΔCt method
(15). The fold change in the
relative PLAGL1 gene expression was determined by
calculating the 2−ΔΔCt value. Fold increase above 1
(2−ΔΔCt >1) indicated PLAGL1 overexpression in
CRC tissue, and fold decrease under 1 (2−ΔΔCt <1)
indicated PLAGL1 downregulation.
Protein extraction and western blot
analysis
Paired samples of tumor tissue and unchanged mucosa
derived from 95 CRC patients and 32 colonoscopic biopsies were
homogenized in RIPA lysis buffer supplied with 1:100 protease
inhibitor cocktail, 1:100 phosphatase inhibitor cocktail 2 and 5 mM
EDTA (all from Sigma-Aldrich). Homogenates were briefly centrifuged
to remove tissue debris. Then, samples were centrifuged twice at
9,000 × g for 10 min at 4°C. After centrifugation, supernatants
were collected and the total protein content was determined by the
Bradford method (16). Samples
were aliquoted and stored at −80°C until further analyses.
To determine the level of PLAGL1 protein in tissue
lysates, the SDS-PAGE followed by western blotting assays were
performed. Isolated protein samples were denatured for 5 min at
95°C and loaded on polyacrylamide gel (40 μg/lane). Gels were run
at the 10 mA/gel during migration in the stacking gel and 15 mA/gel
in the separating gel (10%). Proteins were transferred onto PVDF
membrane (western blotting membrane, Roche, Mannheim, Germany).
Blots were blocked in 5% non-fat dry milk dissolved in
Tris-buffered saline pH 7.5 with 0.1% Tween-20 (TBS-T) followed by
overnight incubation at 4°C with respective primary antibody.
Rabbit anti-human monoclonal antibodies against PLAGL1/ZAC (diluted
1:1,000 in TBS-T; #ab129063, Abcam, Cambridge, UK), and polyclonal
antibodies anti-actin (ACTB; 1:100; #A2066, Sigma-Aldrich) were
used. ACTB level was used as the internal protein load control.
After the incubation, primary antibodies were washed out with
TBS-T. Then, the membranes were treated with the specific
HPR-conjugated goat anti-rabbit IgG secondary antibodies (1:40,000;
#A0545, Sigma-Aldrich) for 90 min at room temperature (RT),
developed with an enhanced chemiluminescence (SuperSignal West Pico
Chemiluminescent Substrate, Thermo Scientific), and visualized with
G:BOX iChemi XR imaging system (Syngene, Cambridge, UK). For the
negative control, a primary antibody was omitted and substituted
with phosphate-buffered saline (PBS). Protein extracts from 293T
cells or HeLa cells (both from Abcam) were used as the positive
controls for PLAGL1 immunoblotting. Molecular weight standard
(Spectra Multicolor Broad Range Protein Ladder, Thermo Scientific)
was included into each blotting experiment to confirm the molecular
weight of detected bands. Band intensity was quantified using
ImageJ software (NIH, Bethesda, MD, USA) (17).
PLAGL1 protein optical density (OD) was normalized
on the basis of ACTB protein OD. OD ratios between tumor and the
corresponding unchanged tissue of CRC patients were calculated. The
ratios >1 indicated that the expression of PLAGL1 protein was
upregulated in CRC tissue while those <1 were regarded as
downregulated.
Immunohistochemistry
PLAGL1 immunoreactivity was analyzed in matched
tumor and unchanged colorectal tissues of 60 CRC patients.
Immunohistochemistry was performed on 4-μm-thick paraffin sections.
Sections were subjected to antigen retrieval procedure by
microwaving for 20 min in retrieval solution buffer, pH 6.0 (Leica,
Wetzlar, Germany), followed by the incubation in 3%
H2O2 in methanol for 10 min, and next in 2.5%
normal horse serum (Vector Laboratories, Burlingame, CA, USA) for
30 min. The sections were incubated overnight at 4°C with rabbit
anti-human monoclonal antibody against PLAGL1/ZAC (diluted 1:2,000
in PBS; #ab129063, Abcam). After washing with PBS, the sections
were treated with HRP-conjugated secondary antibody (ready-to-use
dilution; ImmPRESS Universal reagent Anti-Mouse/Rabbit Ig, Vector
Laboratories) for 30 min at RT. Then, the sections were immersed in
3′,3′-diaminobenzidine (DAB; Dako, Glostrup, Denmark),
counterstained with Harris' haematoxylin (Sigma-Aldrich),
dehydrated in ethanol, cleared in xylene, and mounted with DPX
(Sigma-Aldrich). For each set of staining, the negative controls
were performed by omitting the primary antibody.
The PLAGL1 immunostained sections were evaluated
using Olympus BX41 light microscope (Olympus, Tokyo, Japan) by an
independent pathologist in a blinded manner regarding the clinical
data of the patients. Immunoreactivity of PLAGL1 was assessed in
cancer cells of CRC sections and enterocytes of the unchanged colon
mucosa using the scale based on the reaction intensity (0, no
reaction; 10, ≤10%; 30, 11–30%; 60, 31–60%; 80, 61–80% and 100,
>80%). Ratios in PLAGL1 score between tumor cells and cells of
the matched unchanged tissue of CRC patients were calculated. The
ratios >1 indicated that the immunoreactivity of PLAGL1 in CRC
tissue was upregulated while those <1 were regarded as
down-regulated.
Statistical analyses
Statistical analyses were performed using Prism 6
(GraphPad, La Jolla, CA, USA) and Statistica v.10 (StatSoft, Tulsa,
OK, USA) software. The differences in mRNA and protein levels
between matched tumor and unchanged samples of CRC patients were
examined by the Wilcoxon matched-pairs test, whereas differences
between colon mucosa biopsies of healthy subjects and tissues of
CRC patients as well as between cell lines were assessed by the
Mann-Whitney U test. The correlations between the demographic,
clinicopathological, and molecular parameters were analyzed by the
Fisher's exact and Chi-square tests and confirmed using the
Mann-Whitney U test and Kruskal-Wallis test. Survival curves were
plotted using Kaplan-Meier method. The statistical significance of
differences in survival between groups of patients was evaluated
using the log-rank test and confirmed by Cox regression method. In
all the analyses, results were considered statistically significant
when p<0.05.
Results
PLAGL1 mRNA expression in CRC tissues and
cell lines is downregulated
To determine the expression of PLAGL1 at the
mRNA level, matched tumor and unchanged tissues derived from CRC
patients and colonic biopsies of healthy group were subjected to
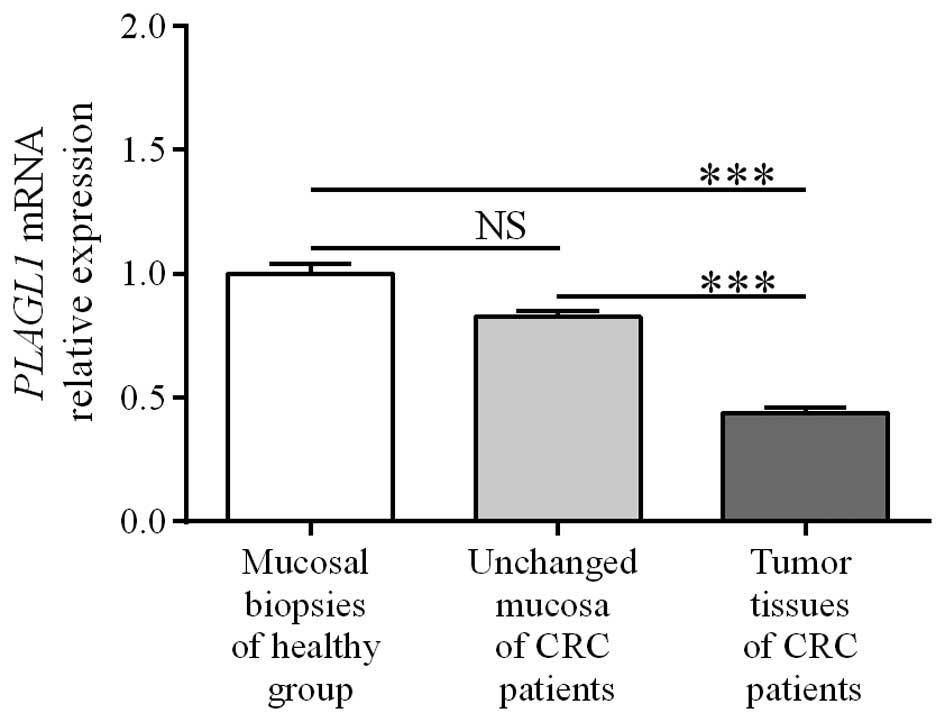
qPCR analysis. PLAGL1 mRNA was found in all studied tissue
samples of CRC patients and colonic biopsies of healthy
individuals. Among the 121 tumor specimens tested, the relative
PLAGL1 mRNA level (tumor tissue vs. matching unchanged
mucosa of CRC patients) was decreased in 87 (71.9%) tumors while it
was increased in 34 (28.1%) cases (Table II). The expression of
PLAGL1 mRNA was significantly decreased in the tumor tissues
when compared to unchanged tissue of CRC patients and the colon
mucosa of healthy individuals (0.44±0.02 vs. 0.83±0.02 and
1.00±0.04, respectively; p<0.0001; Fig. 1). The levels of PLAGL1 mRNA
in unchanged tissues of CRC patients did not differ significantly
from those in colonic biopsies of the healthy group (0.83±0.02 vs.
1.00±0.04; p>0.05; Fig. 1).
| Table IIAssociations between demographic and
clinicopathological features of studied CRC patients and the
relative mRNA expression of PLAGL1 in colorectal tumor
tissues. |
Table II
Associations between demographic and
clinicopathological features of studied CRC patients and the
relative mRNA expression of PLAGL1 in colorectal tumor
tissues.
| | | PLAGL1 mRNA
levels in tumor vs. unchanged tissues of CRC patients | |
|---|
| | |
| |
|---|
| Parameter | No. of cases | Percentage (%) | Down (ratio
<1) | Percentage (%) | Up (ratio
>1) | Percentage (%) | p-values |
|---|
| Total | 121 | 100.0 | 87 | 71.9 | 34 | 28.1 | |
| Gender | | | | | | | |
| Male | 67 | 55.4 | 52 | 77.6 | 15 | 22.4 | 0.1548 |
| Female | 54 | 44.6 | 35 | 64.8 | 19 | 35.2 | |
| Age (years) | | | | | | | |
| ≤67 | 60 | 49.6 | 40 | 66.7 | 20 | 33.3 | 0.2295 |
| >67 | 61 | 50.4 | 47 | 77.0 | 14 | 23.0 | |
| Localization | | | | | | | |
| Cecum, ascending,
and transverse colon | 44 | 36.4 | 32 | 72.7 | 12 | 27.3 | 0.0800 |
| Descending and
sigmoid colon | 29 | 24.0 | 25 | 86.2 | 4 | 13.8 | |
| Rectum | 48 | 39.7 | 30 | 62.5 | 18 | 37.5 | |
| Depth of invasion
(pT status) | | | | | | | |
| T1+T2 | 20 | 16.5 | 13 | 65.0 | 7 | 35.0 | 0.5864 |
| T3+T4 | 101 | 83.5 | 74 | 73.3 | 27 | 26.7 | |
| Lymph nodes (pN
status) | | | | | | | |
| N0 | 63 | 52.1 | 42 | 66.7 | 21 | 33.3 | 0.2259 |
| N1+N2 | 58 | 47.9 | 45 | 77.6 | 13 | 22.4 | |
| Metastasis (pM
status) | | | | | | | |
| M0 | 106 | 87.6 | 75 | 70.8 | 31 | 29.2 | 0.5533 |
| M1 | 15 | 12.4 | 12 | 80.0 | 3 | 20.0 | |
| TNM stage | | | | | | | |
| I+II | 59 | 48.8 | 39 | 66.1 | 20 | 33.9 | 0.3484 |
| III+IV | 62 | 51.2 | 48 | 77.4 | 14 | 22.6 | |
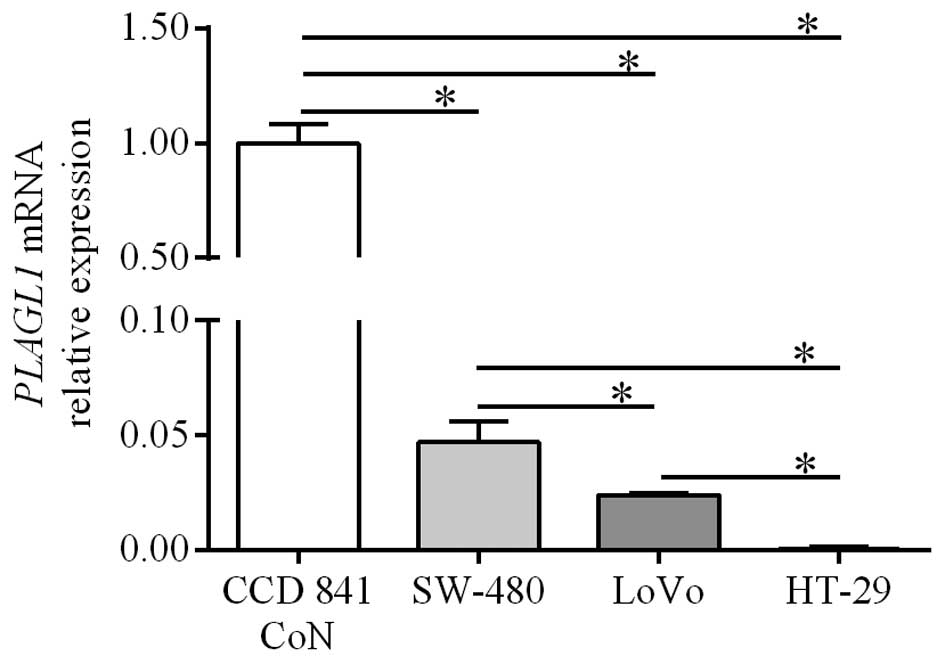
QPCR analysis was also used to determine the
expression of PLAGL1 gene in CRC cell lines and the control
line established from normal colonic tissue. PLAGL1 mRNA
levels in HT-29, LoVo and SW-480 cells were significantly lower
than those in the CCD 841 CoN cell line (0.0004±0.0003,
0.024±0.0006 and 0.047±0.0087, respectively, vs. 1.00±0.0087;
p<0.05; Fig. 2). Among the CRC
cell lines the lowest level of PLAGL1 expression was
observed in HT-29 cells (p<0.05; Fig. 2). The level of PLAGL1 mRNA
in the LoVo cell line was significantly lower than that in SW480
cells (p<0.05; Fig. 2).
The lack of correlation between PLAGL1
mRNA expression in CRC and demographic or clinicopathological
features
To assess the impact of PLAGL1 expression at
the mRNA level on CRC pathogenesis, the relationships between
PLAGL1 mRNA content and selected demographic and
clinicopathological parameters were tested (Table II). The relative PLAGL1
mRNA level did not correlate with the parameters gender, age, tumor
localization, TNM disease stage, depth of invasion, lymph node
involvement, or the presence of metastases (p>0.05; Table II).
Heterogeneous expression of PLAGL1
protein in CRC tissues
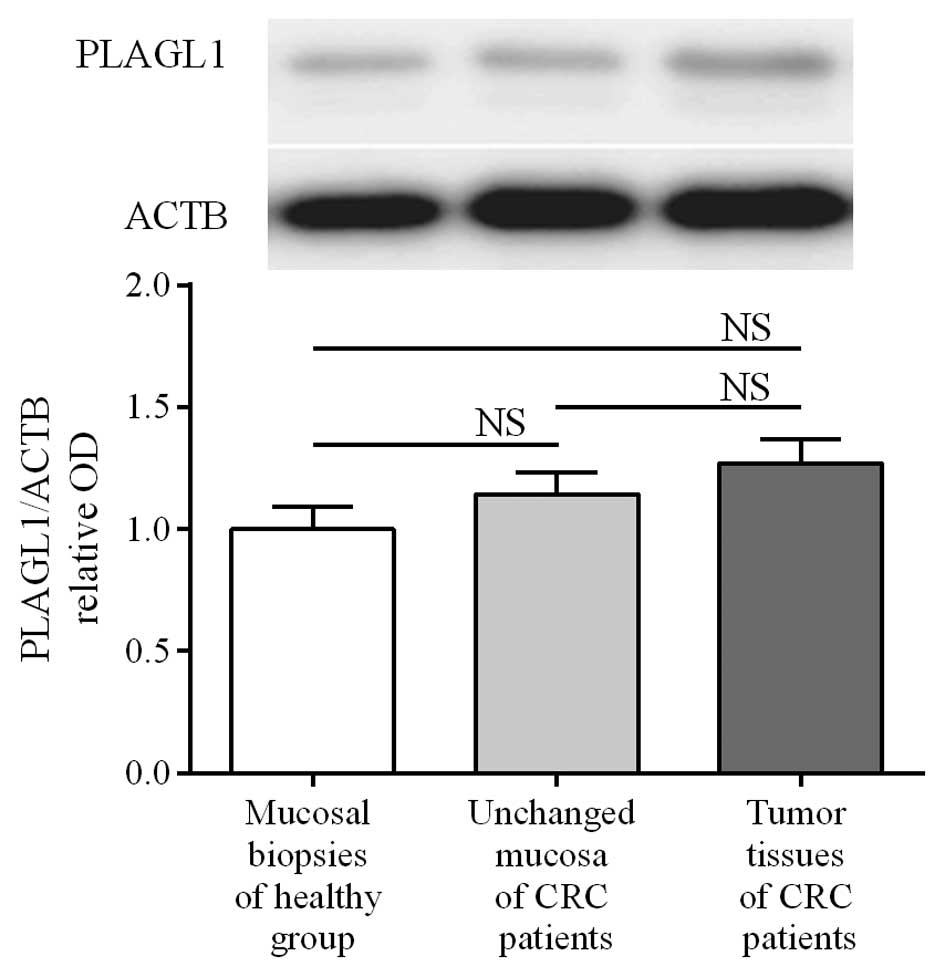
To determine the expression of the PLAGL1
gene at the protein level, matched tumor and unchanged tissues
derived from CRC patients and colonic biopsies of healthy subjects
were analyzed by western blotting. PLAGL1 protein was found in all
studied tissues of CRC patients and in 30/32 (93.75%) colonic
biopsies of healthy subjects. The average content of PLAGL1 protein
did not differ significantly between tumor and unchanged tissues of
CRC patients or the colon mucosa of healthy individuals (3.47±0.27
vs. 3.12±0.24 and 2.73±0.26, respectively; p>0.05; Fig. 3). Among 95 tumor tissue specimens
tested, the relative content of PLAGL1 protein (tumor tissue vs.
matching unchanged mucosa of CRC patients) was downregulated in 47
(49.5%) tumors while it was upregulated in 48 (50.5%) cases
(Table III).
| Table IIIAssociations between demographic and
clinicopathological features of studied CRC patients and the
relative PLAGL1 protein levels (assessed by western blotting) in
colorectal tumor tissues. |
Table III
Associations between demographic and
clinicopathological features of studied CRC patients and the
relative PLAGL1 protein levels (assessed by western blotting) in
colorectal tumor tissues.
| | | PLAGL1 protein
levels in tumor vs. unchanged tissues of CRC patients | |
|---|
| | |
| |
|---|
| Parameter | No. of cases | Percentage (%) | Down (ratio
<1) | Percentage (%) | Up (ratio
>1) | Percentage (%) | p-values |
|---|
| Total | 95 | 100.0 | 47 | 49.5 | 48 | 50.5 | |
| Gender | | | | | | | |
| Male | 53 | 55.8 | 26 | 49.1 | 27 | 50.9 | 1.0000 |
| Female | 42 | 44.2 | 21 | 50.0 | 21 | 50.0 | |
| Age (years) | | | | | | | |
| ≤67 | 47 | 49.5 | 20 | 42.6 | 27 | 57.4 | 0.2204 |
| >67 | 48 | 50.5 | 27 | 56.3 | 21 | 43.8 | |
| Localization | | | | | | | |
| Cecum, ascending,
and transverse colon | 32 | 33.7 | 16 | 50.0 | 16 | 50.0 | 0.9931 |
| Descending and
sigmoid colon | 22 | 23.2 | 11 | 50.0 | 11 | 50.0 | |
| Rectum | 41 | 43.2 | 20 | 48.8 | 21 | 51.2 | |
| Depth of invasion
(pT status) | | | | | | | |
| T1+T2 | 17 | 17.9 | 7 | 41.2 | 10 | 58.8 | 0.5939 |
| T3+T4 | 78 | 82.1 | 40 | 51.3 | 38 | 48.7 | |
| Lymph nodes (pN
status) | | | | | | | |
| N0 | 52 | 54.7 | 19 | 36.5 | 33 | 63.5 | 0.0074a |
| N1+N2 | 43 | 45.3 | 28 | 65.1 | 15 | 34.9 | |
| Metastasis (pM
status) | | | | | | | |
| M0 | 81 | 85.3 | 35 | 43.2 | 46 | 56.8 | 0.0037a |
| M1 | 14 | 14.7 | 12 | 85.7 | 2 | 14.3 | |
| TNM stage | | | | | | | |
| I + II | 49 | 51.6 | 16 | 32.7 | 33 | 67.3 | 0.0010a |
| III+IV | 46 | 48.4 | 31 | 67.4 | 15 | 32.6 | |
Heterogeneous PLAGL1 immunohistochemical
staining in CRC patient tissues
PLAGL1 immunoreactivity was observed in enterocytes
(Fig. 4A) as well as cancer cells
of the analyzed tissues (Fig. 4B, D,
E, G, H and J–M). Immunoreactivity of the PLAGL1 protein was
noted in cancer cells in 49/60 (81.7%) of the analyzed CRC cases,
whereas in enterocytes of unchanged large intestine tissue its
expression was observed in 57/60 (95%) cases. The average intensity
of PLAGL1 immunostaining did not differ significantly between tumor
and unchanged tissues of CRC patients (18.5±2.07 vs. 24.83±2.85,
respectively; p>0.05). Among 60 tumor tissue specimens tested,
the relative intensity of PLAGL1 staining was decreased in 27 (45%)
tumors and elevated in 15 (25%) cases, while 18 (30%) tumor samples
demonstrated similar level of PLAGL1 immunoreactivity as cells of
the corresponding unchanged tissues (Table IV).
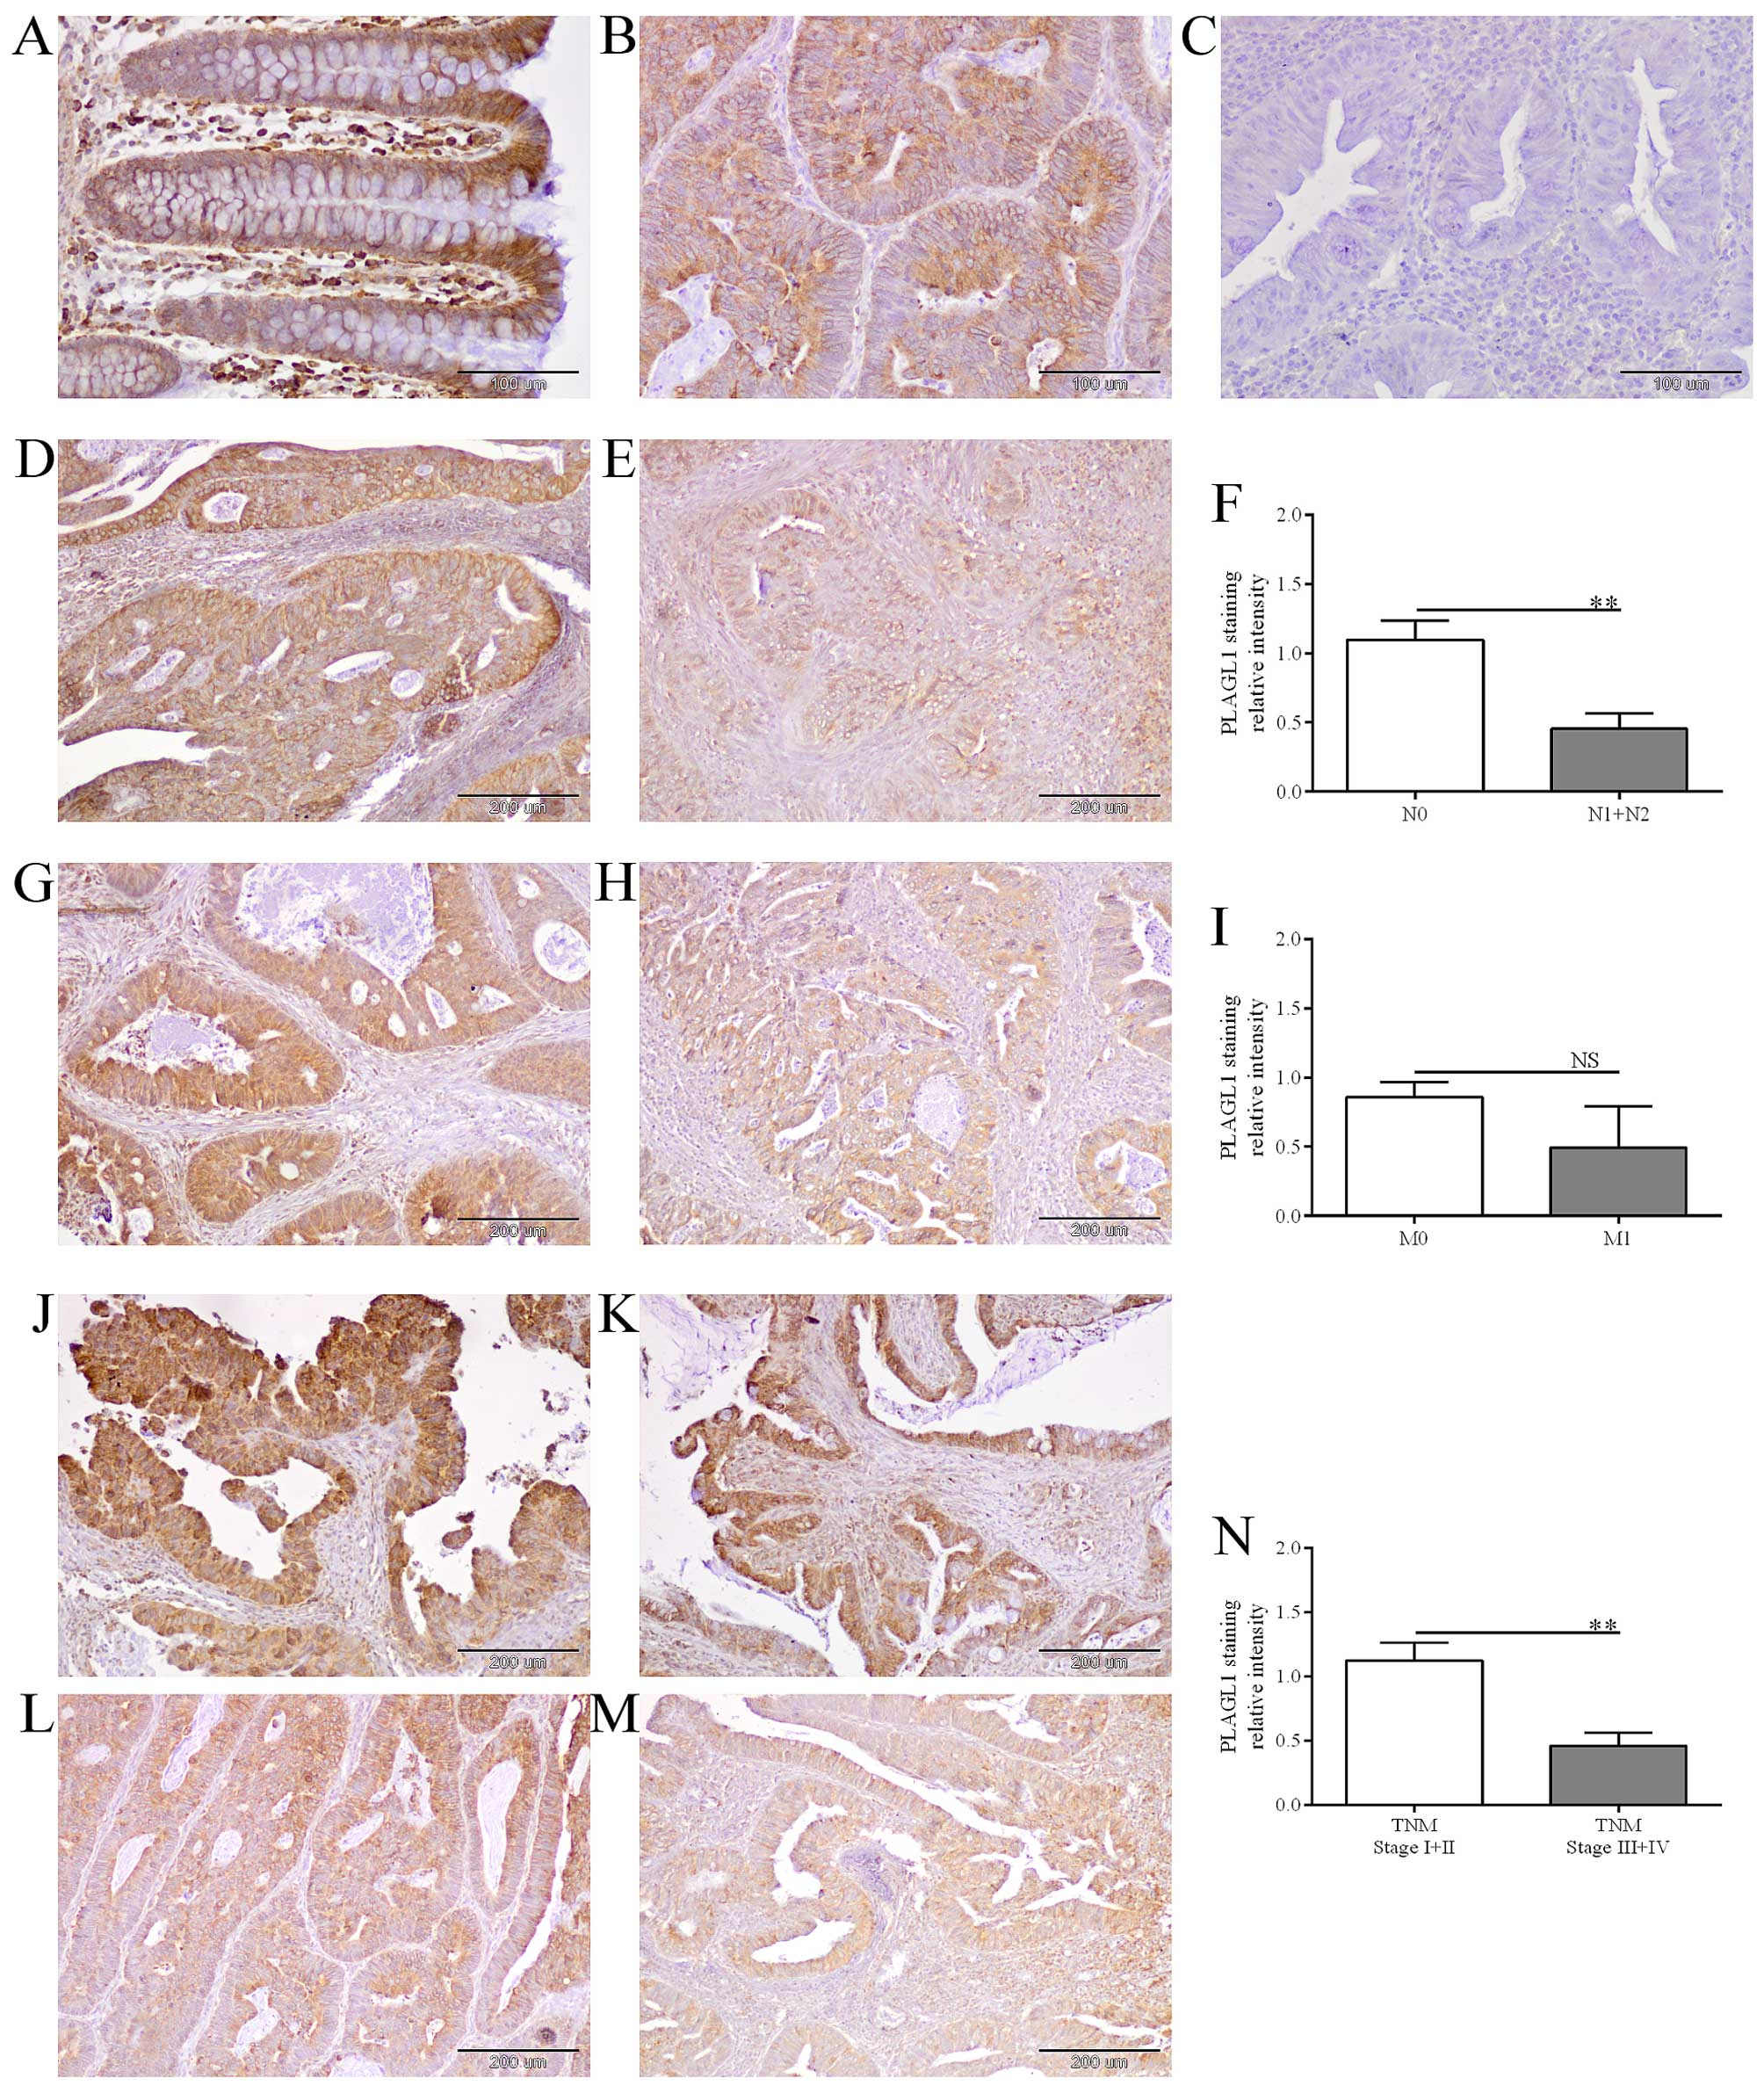 | Figure 4The evaluation of PLAGL1 protein
expression in CRC and unchanged colorectal tissues by
immunohistochemistry. Immunohistochemical staining of PLAGL1
protein in representative unchanged (A) and tumor (B) tissues of
CRC patients. Negative controls were performed by omitting the
primary antibody (C). Heterogeneous intensity of PLAGL1 staining
depending on the lymph node involvement: N0 (D) and N1 (E), the
presence of metastases: M0 (G) and M1 (H), and TNM disease stage: I
(J), II (K), III (L) and IV (M). Magnification ×200 (A–C) and ×100
(D, E, G, H and J–M). The average immunoreactivity of the PLAGL1
protein in tumor specimens with regard to the lymph node
involvement (F), the presence of metastases (I), and TNM disease
stage (N); bars represent mean ± SEM; **p<0.01; NS,
differences not statistically significant (p>0.05). |
| Table IVAssociations between demographic and
clinicopathological features of studied CRC patients and the
relative PLAGL1 immunoreactivity in tumor cells. |
Table IV
Associations between demographic and
clinicopathological features of studied CRC patients and the
relative PLAGL1 immunoreactivity in tumor cells.
| | | | PLAGL1
immunoreactivity in tumor vs. unchanged tissues of CRC
patients | |
|---|
| | | |
| |
|---|
| Parameter | No. of cases | Percentage (%) | Down (ratio
<1) | Percentage (%) | Up (ratio
>1) | Percentage (%) | p-values |
|---|
| Totalb | 42 | 100.0 | 27 | 64.3 | 15 | 35.7 | |
| Gender | | | | | | | |
| Male | 20 | 47.6 | 14 | 70.0 | 6 | 30.0 | 0.5311 |
| Female | 22 | 52.4 | 13 | 59.1 | 9 | 40.9 | |
| Age (years) | | | | | | | |
| ≤67 | 18 | 42.9 | 10 | 55.6 | 8 | 44.4 | 0.3465 |
| >67 | 24 | 57.1 | 17 | 70.8 | 7 | 29.2 | |
| Localization | | | | | | | |
| Cecum, ascending,
and transverse colon | 12 | 28.6 | 9 | 75.0 | 3 | 25.0 | 0.5802 |
| Descending and
sigmoid colon | 9 | 21.4 | 6 | 66.7 | 3 | 33.3 | |
| Rectum | 21 | 50.0 | 12 | 57.1 | 9 | 42.9 | |
| Depth of invasion
(pT status) | | | | | | | |
| T1+T2 | 7 | 16.7 | 3 | 42.9 | 4 | 57.1 | 0.2252 |
| T3+T4 | 35 | 83.3 | 24 | 68.6 | 11 | 31.4 | |
| Lymph nodes (pN
status) | | | | | | | |
| N0 | 24 | 57.1 | 11 | 45.8 | 13 | 54.2 | 0.0081a |
| N1+N2 | 18 | 42.9 | 16 | 88.9 | 2 | 11.1 | |
| Metastasis (pM
status) | | | | | | | |
| M0 | 38 | 90.5 | 24 | 63.2 | 14 | 36.8 | 1.0000 |
| M1 | 4 | 9.5 | 3 | 75.0 | 1 | 25.0 | |
| TNM stage | | | | | | | |
| I + II | 23 | 54.8 | 10 | 43.5 | 13 | 56.5 | 0.0031a |
| III+IV | 19 | 45.2 | 17 | 89.5 | 2 | 10.5 | |
Correlations between PLAGL1 protein
content in CRC and demographic or clinicopathological features
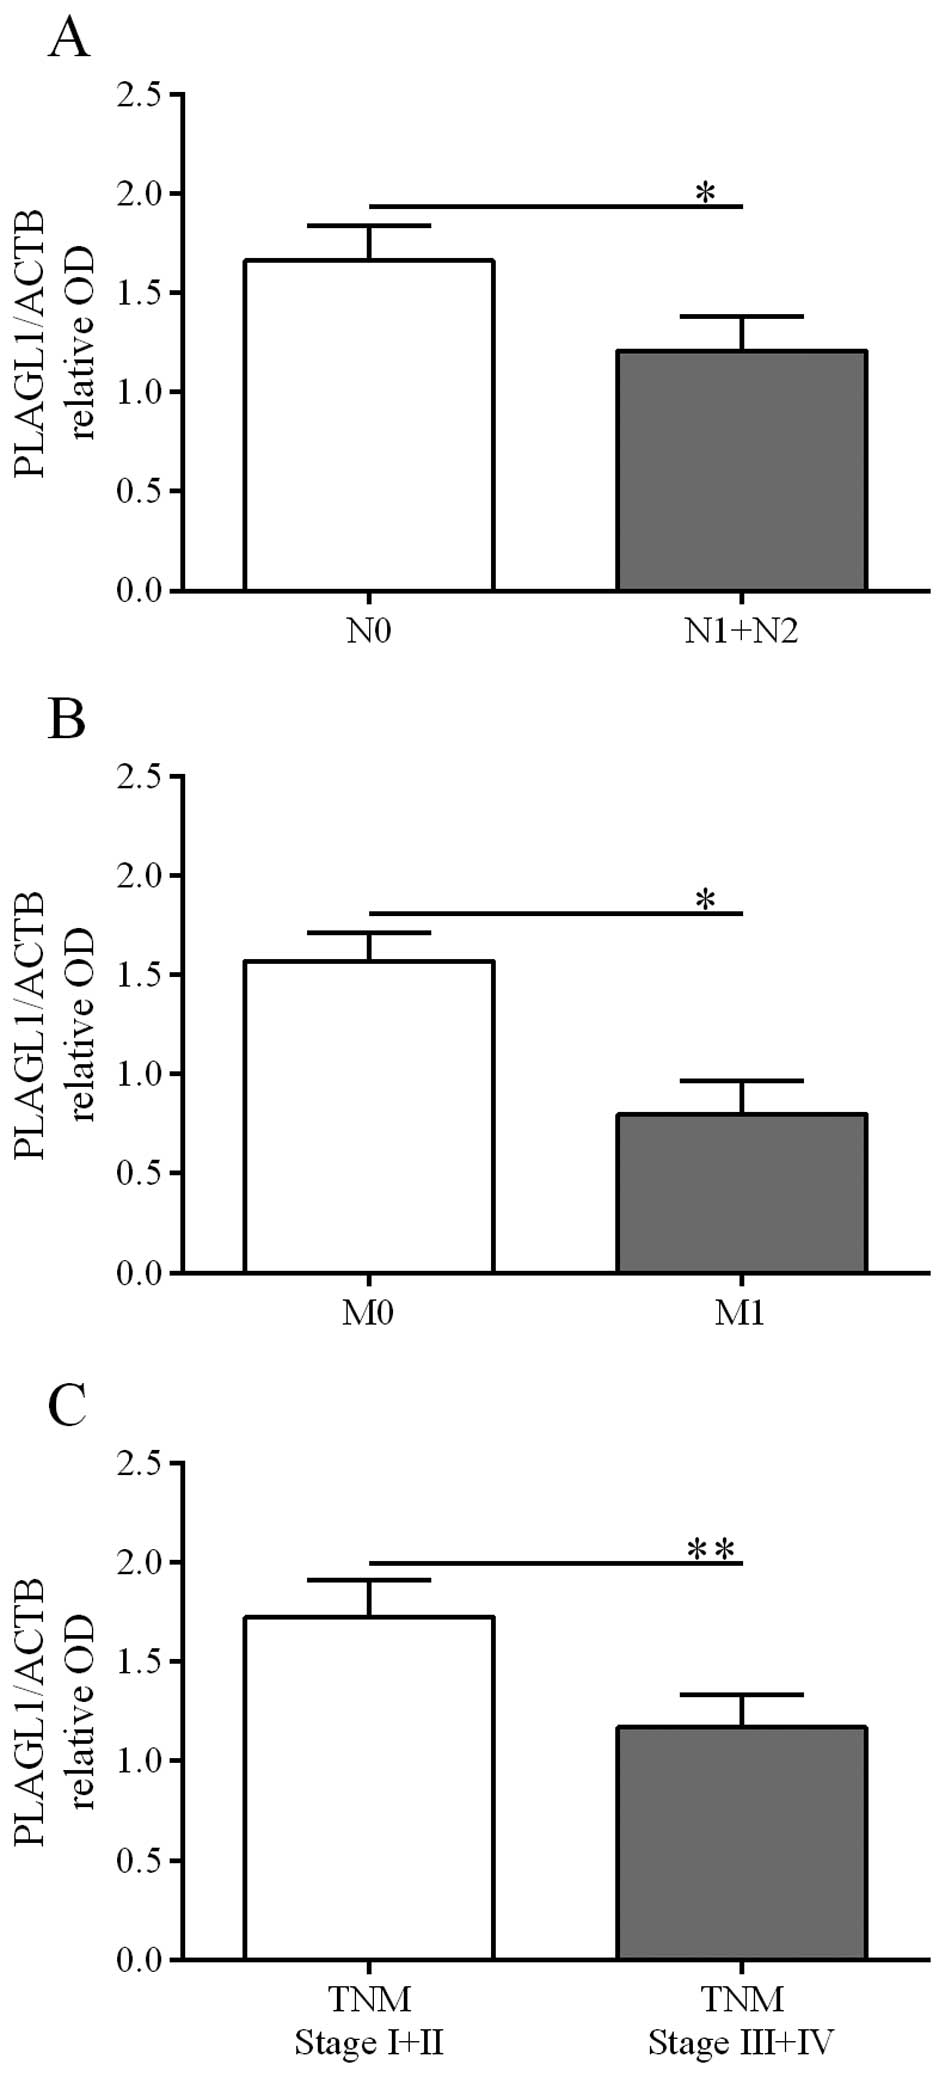
Possible correlations of PLAGL1 expression at the
protein level with selected demographic and clinicopathological
parameters were analyzed based on the results obtained by western
blot and immunohistochemical analyses. The relative PLAGL1 protein
levels in tumor specimens did not correlate with the patient
gender, age, tumor localization, and depth of invasion. However,
PLAGL1 protein content was lower in tumor specimens derived from
patients diagnosed with: i) lymph node involvement [p=0.0074, the
Fisher's exact test, Table III;
confirmed by the Mann-Whitney U test: 1.66±0.18 vs. 1.21±0.17 (N0
vs. N1+N2), p=0.0122, Fig. 5A],
ii) the presence of metastases [p=0.0037, the Fisher's exact test,
Table III; confirmed by the
Mann-Whitney U test: 1.57±0.14 vs. 0.80±0.16 (M0 vs. M1), p=0.0309,
Fig. 5B], and iii) a higher TNM
disease stage [p=0.001, the Fisher's exact test, Table III; confirmed by the Mann-Whitney
U test: 1.73±0.19 vs. 1.17±0.16 (I+II vs. III+IV), p=0.0014,
Fig. 5C].
Similarly, decreased intensity of PLAGL1
immunohistochemical staining in tumor specimens was associated with
lymph node involvement [p=0.0081, the Fisher's exact test, Table IV; confirmed by the Mann-Whitney U
test: 1.10±0.14 vs. 0.45±0.11 (N0 vs. N1+N2), p=0.0020, Fig. 4D–F] and a higher TNM disease stage
[p=0.0031, the Fisher's exact test, Table IV; confirmed by the Mann-Whitney U
test: 1.12±0.14 vs. 0.46±0.10 (I+II vs. III+IV), p=0.0014, Fig. 4J–N].
Expression of the PLAGL1 gene and overall
survival of the patients
To estimate the significance of the PLAGL1
expression level as a prognostic factor, all patients were followed
up for 36.1 months. During this observation period, 43 (35.5%)
patients died.
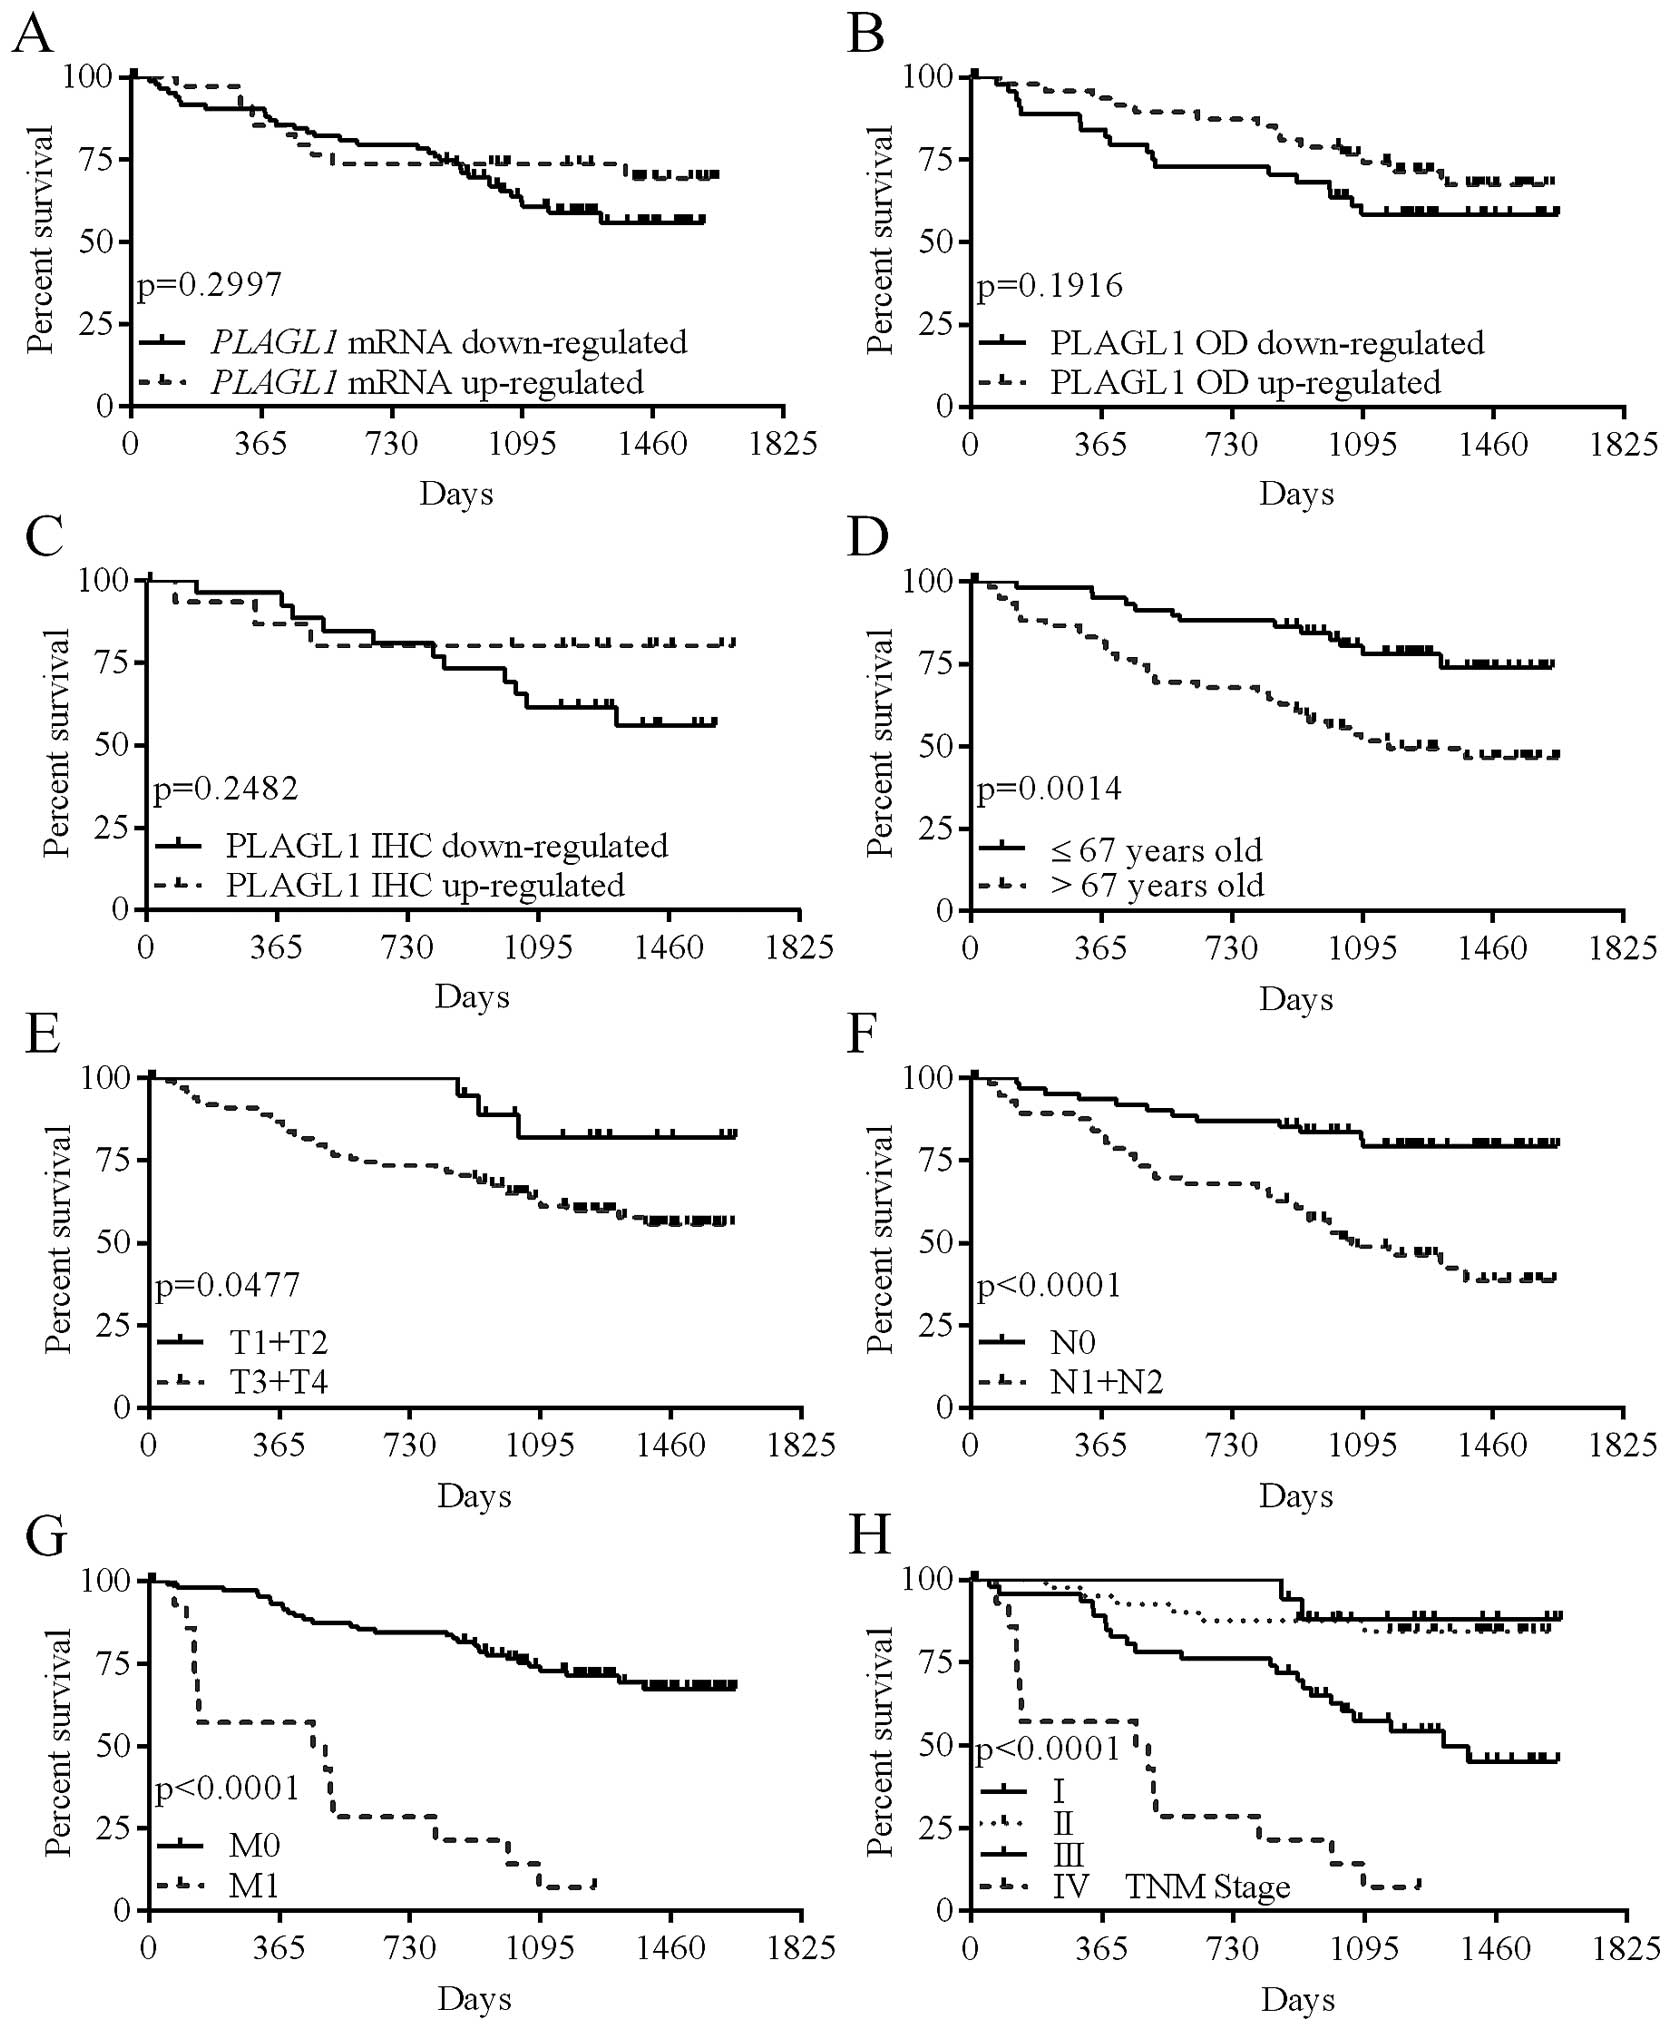
The levels of PLAGL1 mRNA and protein
expression, or the intensity of PLAGL1 immunostaining did not
correlate significantly with the patient overall survival (Table V; Fig.
6A–C); however, the hazard ratio (HR) for patients whose tumor
tissues showed reduced immunostaining of the PLAGL1 protein was
twice higher than in patients whose tumor tissues revealed
increased PLAGL1 immunoreactivity (Table V). Of the analyzed demographic and
clinicopathological parameters, advanced age at diagnosis (>67
years; p=0.0014; Table V and
Fig. 6D), depth of invasion
(p=0.0477; Table V and Fig. 6E), lymph node involvement
(p<0.0001; Table V and Fig. 6F), the presence of metastases
(p<0.0001; Table V and Fig. 6G), and a high TNM disease stage
(p<0.0001; Table V and Fig. 6H) were associated with poor patient
outcome.
| Table VAnalysis of overall survival of CRC
patients in relation to their demographic, clinicopathological and
molecular characteristics. |
Table V
Analysis of overall survival of CRC
patients in relation to their demographic, clinicopathological and
molecular characteristics.
| Parameter | Deaths/cases | Percentage (%) | Hazard ratio | 95% CI of HR | p-values |
|---|
| Gender | | | | | |
| Male | 23/67 | 34.3 | 1.007 | 0.5530–1.833 | 0.9823 |
| Female | 20/54 | 37.0 | (1.00) | | |
| Age (years) | | | | | |
| ≤67 | 13/60 | 21.7 | 0.361 | 0.2055–0.6828 | 0.0014a |
| >67 | 30/61 | 49.2 | (1.00) | | |
| Localization | | | | | |
| Cecum, ascending,
and transverse colon | 12/44 | 27.3 | 0.691 | 0.3437–1.407 | 0.3125 |
| Descending and
sigmoid colon | 12/29 | 41.4 | 1.316 | 0.6286–2.829 | 0.4541 |
| Rectum | 19/48 | 39.6 | (1.00) | | |
| Depth of invasion
(pT status) | | | | | |
| T1+T2 | 3/20 | 15.0 | 0.325 | 0.2144–0.9916 | 0.0477a |
| T3+T4 | 40/101 | 39.6 | (1.00) | | |
| Lymph nodes (pN
status) | | | | | |
| N0 | 12/63 | 19.0 | 0.281 | 0.1579–0.5299 | <0.0001a |
| N1+N2 | 31/58 | 53.4 | (1.00) | | |
| Metastasis (pM
status) | | | | | |
| M0 | 30/106 | 28.3 | 0.148 |
0.003700–0.04558 | <0.0001a |
| M1 | 13/15 | 86.7 | (1.00) | | |
| TNM stage | | | | | |
| I | 2/18 | 11.1 | 0.063 | 0.01695–0.1578 | <0.0001a |
| II | 6/41 | 14.6 | 0.084 |
0.004435–0.05342 | <0.0001a |
| III | 22/47 | 46.8 | 0.266 | 0.04809–0.3322 | <0.0001a |
| IV | 13/15 | 86.7 | (1.00) | | |
| PLAGL1 mRNA | | | | | |
| Downregulated | 33/87 | 37.9 | 1.448 | 0.7378–2.703 | 0.2997 |
| Upregulated | 10/34 | 29.4 | (1.00) | | |
| PLAGL1 protein | | | | | |
| Downregulated | 18/47 | 38.3 | 1.585 | 0.7928–3.194 | 0.1916 |
| Upregulated | 14/48 | 29.2 | (1.00) | | |
| PLAGL1 relative
immunoreactivity | | | | | |
| Downregulated | 11/27 | 40.7 | 2.086 | 0.6393–5.651 | 0.2482 |
| Upregulated | 3/15 | 20.0 | (1.00) | | |
Discussion
Allelic loss at long arm of chromosome 6 occurs in
many types of human cancers, suggesting the presence of at least
one tumor suppressor gene within this region (8,9,18).
The inactivation of tumor suppressor genes that control a variety
of cellular processes including the cell cycle and apoptosis, can
promote tumor formation. Genes which are differentially expressed
in tumors as compared to healthy tissues may be considered as
potential biomarkers for cancer detection, prognostic factors, or
therapeutic targets. PLAGL1, localized at 6q24-q25, encodes
a transcription factor with antiproliferative potential (19) and is ubiquitously expressed in
normal tissues (5), with
especially abundant expression shown in the pituitary and adrenal
glands, as well as in the kidney (20). Expression of this gene was also
confirmed in the colon tissue (20), therefore, we undertook the present
study to compare the level of PLAGL1 expression in tissues
of CRC patients and the healthy colon mucosa, and also to estimate
its prognostic value. This is the first comprehensive report
describing PLAGL1 expression in CRC and healthy colon
tissues at both mRNA and protein levels, examined by the
combination of three different techniques (qPCR, western blotting,
and IHC), as well as in relation to demographic and
clinicopathological features of CRC patients and their overall
survival.
Previous studies revealed that PLAGL1
expression is frequently lost or decreased in several human cancer
types (6–12); however, in the case of salivary
gland tumors, Enlund et al (21) found no significant changes in the
expression of this gene assessed at the mRNA level. We found
PLAGL1 gene expression in all studied tissues of CRC
patients and healthy subjects; however, 72% of CRC tumors showed
decreased PLAGL1 mRNA levels. The results of our study are
corroborated by the findings of Dai et al (13), who observed downregulated
PLAGL1 expression in CRC using cDNA microarray. Our study is
the first to report downregulated PLAGL1 gene expression in
commonly used CRC cell lines as opposed to non-cancerous cells.
Previous studies revealed undetectable or reduced levels of
PLAGL1 mRNA in breast tumor cell lines (7), and human ovarian carcinoma cell lines
(9). We observed the lowest level
of PLAGL1 expression in the HT-29 cell line, which had been
shown to have a high metastatic capacity (14). Xenografts, which were established
by injection of HT-29 cells into mice, produced lymph node
metastases in 83% of tumor-bearing animals (14). Moreover, the level of PLAGL1
mRNA was lower in the LoVo cell line in comparison to the SW-480
cells. The LoVo cell line corresponds to cells of Dukes' type C,
grade IV, colorectal adenocarcinoma that was derived from
metastatic site, whereas SW-480 cells are derived from Dukes' type
B, colorectal adenocarcinoma (according to ATCC). These results
suggest that downregulated PLAGL1 expression may be
associated with the progression of CRC. In prostate cancer it was
found that loss of PLAGL1 expression is associated with
progression from benign to metastatic prostate tumors (10).
So far, little is known about the clinical
significance of the altered PLAGL1 expression in cancers.
Our study failed to reveal any relationship between the level of
PLAGL1 mRNA and clinicopathological and demographic features
of the CRC patients. Interestingly, we found significant
correlations between the reduced PLAGL1 protein content in CRC
tissues and unfavorable clinical parameters. Although we detected
no significant differences between the average content of PLAGL1
protein in samples of healthy colon mucosa and CRC, we observed
significant downregulation of PLAGL1 protein expression in tumor
specimens derived from patients diagnosed with lymph node
involvement, the presence of metastases, and advanced TNM stage.
These findings support the suppressor role of PLAGL1 and suggest
that altered expression of PLAGL1 gene may promote
progression of CRC. Moreover, our assumptions are in agreement with
observations of Jarmalaite et al (22), who suggested an involvement of
PLAGL1 loss in a more aggressive course of pheochromocytoma.
Although we observed an increased hazard ratio for CRC patients
with reduced intensity of PLAGL1 immunohistochemical staining of
tumor tissue, the PLAGL1 expression level was not
significantly correlated with overall survival of the patients.
This may be partly due to the fact that the analysis of survival
was limited by a relatively short period of follow-up.
We did not investigate mechanisms underlying the
observed downregulation of PLAGL1 expression in CRC.
Previous studies established that the transcriptional silencing of
this gene may be regulated by epigenetic processes, such as
methylation of CpG islands and histone deacetylation (5). Moreover, it has been reported that
downregulation of PLAGL1 expression may be mediated via
epidermal growth factor receptor (EGFR) (4,23),
which upon binding to its ligands activates signaling pathways that
promote tumor growth, including cell invasion and metastasis
(24,25). EGFR has been reported to be
overexpressed in CRC (26);
furthermore, Cheirsilpa et al (27), using immunohistochemistry,
demonstrated associations between overexpression of EGFR and lymph
node status, as well as the advanced TNM stages. Our findings
indicate analogous correlations between mentioned
clinicopathological parameters and decreased PLAGL1
immunoreactivity in CRC tissues. These observations raise the
hypothesis that cellular responses activated via the EGFR signaling
cascade, such as proliferation, migration, and apoptosis, may be
partially mediated by altered PLAGL1 expression. It has been
also reported that the protein encoded by the PLAGL1 gene
may act as a regulator of nuclear receptor activity, including the
glucocorticoid receptor (28),
whose expression in colorectal cancer correlated with the
expression of cell cycle-related molecules, such as Rb protein and
p16 (29). Further studies are
necessary to unveil mechanisms underlying the regulation of
PLAGL1 expression in CRC and their implications for the role
of the PLAGL1 protein in the pathogenesis of CRC.
In conclusion, the results of our study suggest that
altered PLAGL1 expression, associated with unfavorable
clinicopathological parameters, may be involved in the progression
of colorectal cancer. However, the expression of PLAGL1 at
the mRNA and protein levels failed to correlate with the patient
survival. The latter calls into question the applicability of the
PLAGL1 expression level as a prognostic factor in colorectal cancer
until a longer period of follow-up will be available for survival
analysis.
Acknowledgements
This study was supported by the National Science
Centre grant no. NN402 452339.
References
|
1
|
Ferlay J, Soerjomataram I, Ervik M,
Dikshit R, Eser S, Mathers C, Rebelo M, Parkin DM, Forman D and
Bray F: GLOBOCAN 2012 v1.0, Cancer Incidence and Mortality
Worldwide: IARC CancerBase No. 11. International Agency for
Research on Cancer; Lyon: 2013, http://globocan.iarc.fr.
Accessed Dec 01, 2014
|
|
2
|
Boland CR, Shin SK and Goel A: Promoter
methylation in the genesis of gastrointestinal cancer. Yonsei Med
J. 50:309–321. 2009. View Article : Google Scholar : PubMed/NCBI
|
|
3
|
Spengler D, Villalba M, Hoffmann A,
Pantaloni C, Houssami S, Bockaert J and Journot L: Regulation of
apoptosis and cell cycle arrest by Zac1, a novel zinc finger
protein expressed in the pituitary gland and the brain. EMBO J.
16:2814–2825. 1997. View Article : Google Scholar : PubMed/NCBI
|
|
4
|
Abdollahi A: LOT1 (ZAC1/PLAGL1) and its
family members: Mechanisms and functions. J Cell Physiol.
210:16–25. 2007. View Article : Google Scholar
|
|
5
|
Abdollahi A, Pisarcik D, Roberts D,
Weinstein J, Cairns P and Hamilton TC: LOT1 (PLAGL1/ZAC1), the
candidate tumor suppressor gene at chromosome 6q24-25, is
epigenetically regulated in cancer. J Biol Chem. 278:6041–6049.
2003. View Article : Google Scholar
|
|
6
|
Basyuk E, Coulon V, Le Digarcher A,
Coisy-Quivy M, Moles JP, Gandarillas A and Journot L: The candidate
tumor suppressor gene ZAC is involved in keratinocyte
differentiation and its expression is lost in basal cell
carcinomas. Mol Cancer Res. 3:483–492. 2005. View Article : Google Scholar : PubMed/NCBI
|
|
7
|
Bilanges B, Varrault A, Basyuk E,
Rodriguez C, Mazumdar A, Pantaloni C, Bockaert J, Theillet C,
Spengler D and Journot L: Loss of expression of the candidate tumor
suppressor gene ZAC in breast cancer cell lines and primary tumors.
Oncogene. 18:3979–3988. 1999. View Article : Google Scholar : PubMed/NCBI
|
|
8
|
Cvetkovic D, Pisarcik D, Lee C, Hamilton
TC and Abdollahi A: Altered expression and loss of heterozygosity
of the LOT1 gene in ovarian cancer. Gynecol Oncol. 95:449–455.
2004. View Article : Google Scholar : PubMed/NCBI
|
|
9
|
Abdollahi A, Roberts D, Godwin AK, Schultz
DC, Sonoda G, Testa JR and Hamilton TC: Identification of a
zinc-finger gene at 6q25: A chromosomal region implicated in
development of many solid tumors. Oncogene. 14:1973–1979. 1997.
View Article : Google Scholar : PubMed/NCBI
|
|
10
|
Jacobs DI, Mao Y, Fu A, Kelly WK and Zhu
Y: Dysregulated methylation at imprinted genes in prostate tumor
tissue detected by methylation microarray. BMC Urol. 13:372013.
View Article : Google Scholar : PubMed/NCBI
|
|
11
|
Pagotto U, Arzberger T, Theodoropoulou M,
Grübler Y, Pantaloni C, Saeger W, Losa M, Journot L, Stalla GK and
Spengler D: The expression of the antiproliferative gene ZAC is
lost or highly reduced in non-functioning pituitary adenomas.
Cancer Res. 60:6794–6799. 2000.
|
|
12
|
Koy S, Hauses M, Appelt H, Friedrich K,
Schackert HK and Eckelt U: Loss of expression of ZAC/LOT1 in
squamous cell carcinomas of head and neck. Head Neck. 26:338–344.
2004. View Article : Google Scholar : PubMed/NCBI
|
|
13
|
Dai YC, Zhu XS, Nan QZ, Chen ZX, Xie JP,
Fu YK, Lin YY, Lian QN, Sang QF and Zhan XJ: Identification of
differential gene expressions in colorectal cancer and polyp by
cDNA microarray. World J Gastroenterol. 18:570–575. 2012.
View Article : Google Scholar : PubMed/NCBI
|
|
14
|
Flatmark K, Maelandsmo GM, Martinsen M,
Rasmussen H and Fodstad Ø: Twelve colorectal cancer cell lines
exhibit highly variable growth and metastatic capacities in an
orthotopic model in nude mice. Eur J Cancer. 40:1593–1598. 2004.
View Article : Google Scholar : PubMed/NCBI
|
|
15
|
Livak KJ and Schmittgen TD: Analysis of
relative gene expression data using real-time quantitative PCR and
the 2(−Delta Delta C(T)) method. Methods. 25:402–408. 2001.
View Article : Google Scholar
|
|
16
|
Bradford MM: A rapid and sensitive method
for the quantitation of microgram quantities of protein utilizing
the principle of protein-dye binding. Anal Biochem. 72:248–254.
1976. View Article : Google Scholar : PubMed/NCBI
|
|
17
|
Schneider CA, Rasband WS and Eliceiri KW:
NIH Image to ImageJ: 25 years of image analysis. Nat Methods.
9:671–675. 2012. View Article : Google Scholar : PubMed/NCBI
|
|
18
|
Fujii H, Zhou W and Gabrielson E:
Detection of frequent allelic loss of 6q23-q25.2 in microdissected
human breast cancer tissues. Genes Chromosomes Cancer. 16:35–39.
1996. View Article : Google Scholar : PubMed/NCBI
|
|
19
|
Bilanges B, Varrault A, Mazumdar A,
Pantaloni C, Hoffmann A, Bockaert J, Spengler D and Journot L:
Alternative splicing of the imprinted candidate tumor suppressor
gene ZAC regulates its antiproliferative and DNA binding
activities. Oncogene. 20:1246–1253. 2001. View Article : Google Scholar : PubMed/NCBI
|
|
20
|
Varrault A, Ciani E, Apiou F, Bilanges B,
Hoffmann A, Pantaloni C, Bockaert J, Spengler D and Journot L: hZAC
encodes a zinc finger protein with antiproliferative properties and
maps to a chromosomal region frequently lost in cancer. Proc Natl
Acad Sci USA. 95:8835–8840. 1998. View Article : Google Scholar : PubMed/NCBI
|
|
21
|
Enlund F, Persson F and Stenman G:
Molecular analyses of the candidate tumor suppressor gene, PLAGL1,
in benign and malignant salivary gland tumors. Eur J Oral Sci.
112:545–547. 2004. View Article : Google Scholar : PubMed/NCBI
|
|
22
|
Jarmalaite S, Laurinaviciene A,
Tverkuviene J, Kalinauskaite N, Petroska D, Böhling T and
Husgafvel-Pursiainen K: Tumor suppressor gene ZAC/PLAGL1: Altered
expression and loss of the nonimprinted allele in
pheochromocytomas. Cancer Genet. 204:398–404. 2011. View Article : Google Scholar : PubMed/NCBI
|
|
23
|
Abdollahi A, Bao R and Hamilton TC: LOT1
is a growth suppressor gene down-regulated by the epidermal growth
factor receptor ligands and encodes a nuclear zinc-finger protein.
Oncogene. 18:6477–6487. 1999. View Article : Google Scholar : PubMed/NCBI
|
|
24
|
Schlessinger J: Cell signaling by receptor
tyrosine kinases. Cell. 103:211–225. 2000. View Article : Google Scholar : PubMed/NCBI
|
|
25
|
Yarden Y: The EGFR family and its ligands
in human cancer. signalling mechanisms and therapeutic
opportunities. Eur J Cancer. 37(Suppl 4): S3–S8. 2001. View Article : Google Scholar : PubMed/NCBI
|
|
26
|
Spano JP, Lagorce C, Atlan D, Milano G,
Domont J, Benamouzig R, Attar A, Benichou J, Martin A, Morere JF,
et al: Impact of EGFR expression on colorectal cancer patient
prognosis and survival. Ann Oncol. 16:102–108. 2005. View Article : Google Scholar
|
|
27
|
Cheirsilpa A, Ruangvejvorachai P, Karalak
A, Sangprakarn S, Pummai S and Sangrajrang S: Determination of
epidermal growth factor receptor (EGFR) in patients with colorectal
cancer (Institutional series). Cancer Ther. 5:137–142. 2007.
|
|
28
|
Huang SM and Stallcup MR: Mouse Zac1, a
transcriptional coactivator and repressor for nuclear receptors.
Mol Cell Biol. 20:1855–1867. 2000. View Article : Google Scholar : PubMed/NCBI
|
|
29
|
Theocharis S, Kouraklis G, Margeli A,
Agapitos E, Ninos S, Karatzas G and Koutselinis A: Glucocorticoid
receptor (GR) immunohistochemical expression is correlated with
cell cycle-related molecules in human colon cancer. Dig Dis Sci.
48:1745–1750. 2003. View Article : Google Scholar : PubMed/NCBI
|