Introduction
Fra-1 is a member of the Fos transcription factor
family (c-Fos, FosB, Fra-1 and Fra-2) that is highly expressed in
multiple malignancy, and playing important roles in proliferation,
transformation and metastasis (1,2).
FRA-1 forms activator protein-1 complexes in association with
members of the JUN family (c-Jun, JunB and JunD) and drives gene
transcription (1,2). Fra-1 can positively regulate
transcription. Fra-1 activity is regulated transcriptionally as
well as post-translationally (3,4).
FRA-1 has been implicated in the development of airway squamous
metaplasia and is frequently overexpressed in squamous cell
carcinomas of the stomach and esophagus (2). Fra-1 gene induction and the
accumulation of Fra-1 protein might contribute to the neoplastic
phenotype in HNSCC (head and neck squamous cell carcinoma)
(3). Fra-1 is required for
invasion and Fra-1 might be a good target for intervention in
colorectal cancer (3,5,6). In
addition to its pro-invasive and pro-migratory effect, Fra-1 might
influence the metastatic potential of breast cancer cells by
changing the expression of adhesion molecules, resulting in
increased adherence to endothelial cells (1,7,8).
Although some evidence has been reported, the mechanism of Fra-1 in
malignancy is not fully understood. Moreover, at present, scarce
information exists to study the relationship between Fra-1 and
gastric. Thus, it is urgent to explore the effect and mechanism of
Fra-1 in gastric cancer.
The PI3K (phosphoinositide 3-kinase)/Akt signaling
pathway is a major driving force in a variety of cellular
functions. Dysregulation of this pathway has been implicated in
many human diseases including cancer (9–12).
Therapy resistance is critical to tumor maintenance and severely
limits cancer patient survival. The PI3K pathway has emerged as a
major driver of resistance to diverse anticancer agents (10). It has been shown that p53 was a
crucial transcription factor and p53 is an important sensor of
cellular stress under genotoxic, chemotoxic, pathological, and even
normal physiological conditions (13,14).
MDM2 is a negative regulator of p53. Abnormalities in the p53 gene
and overexpression of MDM2 are commonly observed in malignancy. The
MDM2-p53 feedback loop plays an important role in tumor progression
(15,16). Mutations activating the PI3K/Akt
signalling pathway and inactivating the p53 tumor suppressor gene
are common mechanisms that cancer cells require to proliferate and
escape pre-programmed cell death (17).
In the present study, we examined the expression
levels of Fra-1 in gastric cancer tissues. Furthermore, we studied
the influence of Fra-1 to gastric cancer and explored the possible
mechanism.
Materials and methods
Cell culture
AGS, a human gastric cancer cell line was cultured
in HAM'S/F-12 (HyClone Laboratories, Logan, UT, USA) supplemented
with 10% fetal bovine serum (FBS; Gibco by Life Technologies™,
Grand Island, NY, USA), 100 U/ml penicillin and 100 μg/ml
streptomycin (GE Healthcare Life Sciences, Logan, UT, USA) at 37°C
in the presence of 5% CO2.
Patient samples
Twenty participants were recruited at the Cancer
Hospital of Hunan province, Central South University (Changsha,
Hunan, China). Consent forms were obtained from each individual
patient, and experimental protocols were approved by the
Institutional Review Board of the Cancer Hospital of Hunan
province. All subjects enrolled in the study were Chinese. All
clinical and biological data were available for the samples
(Table I). Gastric cancer tissue
and corresponding non-tumor normal tissue were collected, and each
biopsy sample was divided into two sections, one was submitted to
routine histological diagnosis, and the remaining section was
studied by qPCR, immunohistochemistry and western blot
experiments.
 | Table ICharacteristics of gastric cancer
patients. |
Table I
Characteristics of gastric cancer
patients.
| Samples | Age (years) | Gender | Histological
diagnosis |
|---|
| 1 | 60 | Female | Gastric
intermediately differentiated adenocarcinoma |
| 2 | 60 | Male | Gastric poorly
differentiated adenocarcinoma |
| 3 | 46 | Male | Gastric
intermediately differentiated adenocarcinoma |
| 4 | 49 | Male | Gastric poorly
differentiated adenocarcinoma |
| 5 | 57 | Male | Gastric poorly
differentiated adenocarcinoma |
| 6 | 72 | Male | Gastric poorly
differentiated adenocarcinoma |
| 7 | 53 | Male | Gastric
intermediately differentiated adenocarcinoma |
| 8 | 63 | Female | Gastric poorly
differentiated adenocarcinoma |
| 9 | 54 | Male | Gastric poorly
differentiated adenocarcinoma |
| 10 | 66 | Female | Gastric poorly
differentiated adenocarcinoma |
| 11 | 57 | Male | Gastric poorly
differentiated adenocarcinoma |
| 12 | 47 | Male | Gastric poorly
differentiated adenocarcinoma |
| 13 | 70 | Male | Gastric poorly
differentiated adenocarcinoma |
| 14 | 54 | Female | Gastric
intermediately differentiated adenocarcinoma |
| 15 | 59 | Male | Gastric poorly
differentiated adenocarcinoma |
| 16 | 62 | Female | Gastric
intermediately differentiated adenocarcinoma |
| 17 | 60 | Male | Gastric poorly
differentiated adenocarcinoma |
| 18 | 73 | Male | Gastric poorly
differentiated adenocarcinoma |
| 19 | 47 | Male | Gastric poorly
differentiated adenocarcinoma |
| 20 | 63 | Female | Gastric poorly
differentiated adenocarcinoma |
Total RNA extraction and quantitative
real-time PCR analysis
Total RNA was extracted from gastric cancer tissues
and corresponding non-tumor normal tissues using TRIzol reagent
(CWBio, Beijing, China) and cDNA synthesis was carried out using
the RevertAid First Strand cDNA Synthesis kit (CWBio) according to
the manufacturer's recommendations. Quantitative real-time PCR
(qRT-PCR) was done with GoTaq® qPCR Master Mix (Promega
Corp., Fitchburg, WI, USA). For detection of Fra-1 mRNA expression
levels, GAPDH was amplified in parallel as an internal control. The
sequences of the primers used for qPCR were as follows: Fra-1
forward, 5′-gcatgggctaaggatttgaa-3′ and reverse,
5′-tcccaaatttagcctgtt gg-3′; GAPDH forward,
5′-cgaccactttgtcaagctca-3′ and reverse, 5′-actgagtgtggcagggactc-3′.
The expression of mRNA was assessed by evaluated threshold cycle
(CT) values. The CT values were normalized with the expression
levels of GAPDH and the relative amount of mRNA specific to each of
the target genes was calculated using the 2−ΔΔCT method
(4,18–21).
qPCR was done with the Bio-Rad CFK96™ Real-Time System (Bio-Rad
Laboratories, Hercules, CA, USA). The data were analyzed by Bio-Rad
CFK manager software (Bio-Rad Laboratories). Expression of mRNA was
assessed by evaluated threshold cycle (CT) values, and GAPDH was
used as an internal control.
Immunohistochemistry (IHC) and evaluation
of staining
Immunohistochemistry was done using the peroxidase
anti-peroxidase technique following a microwave antigen retrieval
procedure. Antibody for Fra-1 was purchased from Wuhan
Boster Biological Technology, Ltd. (Wuhan, China). Antibody against
Fra-1 (1:100) was overlaid on gastric cancer and
corresponding non-tumor normal tissue sections and incubated
overnight at 4°C. Secondary antibody incubation (Santa Cruz
Biotechnology, Inc., Santa Cruz, CA, USA) was performed at room
temperature for 30 min.
Sections were blindly evaluated by two investigators
in an effort to provide a consensus on staining patterns by light
microscopy (Olympus). Fra-1 staining was assessed according to the
methods described by Hara and Okayasu (22) with minor modifications. Each case
was rated according to a score that added a scale of intensity of
staining to the area of staining. At least 10 high-power fields
were chosen randomly, and >1,000 cells were counted for each
section. The intensity of staining was graded on the following
scale: 0, no staining; 1+, mild staining; 2+, moderate staining;
3+, intense staining. The area of staining was evaluated as
follows: 0, no staining of cells in any microscopic fields; 1+,
<30% of tissue stained positive; 2+, between 30 and 60% stained
positive; 3+, >60% stained positive. The minimum score when
summed (extension + intensity) was, therefore, 0, and the maximum,
6. A combined staining score (extension + intensity) of ≤2 was
considered to be negative (low staining); a score between 3 and 4
was considered to be moderate; whereas, a score between 5 and 6 was
considered to be strong.
Construction of pEGFP-N1-Fra-1 vector and
cell transfection
The coding region of Fra-1 gene was generated by PCR
with the primer pair 5′-atactcgaatgaacctggccatcagcat-3′ and
5′-gcggaattct-cacagggacatgaaatccg-3′. The PCR was performed under
the following conditions conditions: one cycle for 5 min at 94°C;
30 cycles for 45 sec at 94°C, 45 sec at 55°C, and 90 sec at 72°C,
and extension of 10 min at 72°C. The fragments were cloned into the
TA vector (Promega) and used to transform E. coli JM109
(Takara Bio, Dalian, China). Following selection and propagation,
the pure plasmid DNA was prepared by standard methods. The DNA
fragments were removed from the TA vector by restriction enzyme
digestion with XhoI and EcoR1 (Promega) to subclone
into the pEGFP-N1 vector. The fusion sequences were verified by DNA
sequencing using ABI 3730.
Cell transfection
Cell transfection was accomplished by using
Lipofectamine, according to the manufacturer's instruction
(Invitrogen, Carlsbad, CA, USA). A 2×10⁵ cells were
planted into each well of a 6-well plate 24 h prior to the
transfection. For each transfection, 2 μg of pEGFP-N1-Fra-1 plasmid
and pEGFP-N1 vector plasmid was transfected into AGS cells,
respectively. The plasmids were diluted with 100 μl of serum-free
media and 4 μl Lipofectamine was added into 100 μl serum-free
media. The two solutions were combined, mixed gently and incubated
at room temperature for 30 min. Then the 200 μl mixture and 200 μl
of serum-free media were added into each well. The cells were then
incubated at 37°C for 24 h, followed by replacing the transfection
media with fresh complete culture media. After an additional 24-h
culture, the cells were harvested for the following western blot
experiments.
Flow cytometric analysis of cell
cycle
The cell cycle was analyzed by flow cytometric
analysis using a Moflo™ XDP high-performance cell sorter (Beckman
Coulter, Brea, CA, USA) propidium iodide (PI) (Nanjing KeyGen
Biotech Co., Ltd., Nanjing, China). Briefly, cells
(2×10⁵) were placed in each well of a 6-well plate 24 h
prior to the transfection. For each transfection, 2 μg of
pEGFP-N1-Fra-1 plasmid and pEGFP-N1 vector plasmid was transfected
into AGS cells, respectively. The plasmids were diluted with 100 μl
of serum-free media and 4 μl Lipofectamine was added into 100 μl
serum-free media. The two solutions were combined, mixed gently and
incubated at room temperature for 30 min. The 200 μl mixture and
200 μl of serum-free media were added into each well. The cells
were then incubated at 37°C for 24 h, followed by replacing the
transfection media with fresh complete culture media. After an
additional 24-h culture, the cells were harvested for cell
apoptosis analysis. The cells were harvested and fixed in 70%
ethanol at 4°C. Subsequently, the cells were washed with cold PBS
and stained with propidium iodide (PI) in working solution (0.5
mg/ml RNase, and 0.1 mg/ml propidium iodide in PBS). The cell cycle
was characterized by flow cytometric analysis using a MoFlo™ XDP
high-performance cell sorter (Beckman Coulter) and the data were
analyzed by the summit 5.2 software (Beckman Coulter).
The effect of Fra-1 to gastric cancer
cell apoptosis
The cell apoptosis was analyzed by flow cytometric
analysis using a MoFlo™ XDP high-performance cell sorter (Beckman
Coulter) propidium iodide (PI) and Hoechst 33342 double staining
(Nanjing KeyGen). Briefly, cells (2×10⁵) were placed in
each well of a 6-well plate 24 h prior to the transfection. For
each transfection, 2 μg of pEGFP-N1-Fra-1 plasmid and pEGFP-N1
vector plasmid was transfected into AGS cells, respectively. The
plasmids were diluted with 100 μl of serum-free media and 4 μl
Lipofectamine was added into 100 μl serum-free media. The two
solutions were combined, mixed gently and incubated at room
temperature for 30 min. The 200 μl mixture and 200 μl of serum-free
media were added into each well. The cells were then incubated at
37°C for 24 h, followed by replacing the transfection media with
fresh complete culture media. After an additional 24-h culture, the
cells were harvested for cell apoptosis analysis. Cells were
collected in an Eppendorf tube for 24 h and washed twice with PBS
by centrifugation. The supernatants were discarded. To detect
apoptosis, 500 μl PBS, 5 μl Hoechst 33342 and 5 μl PI were added to
each tube, and the contents of the tube were mixed in the dark, at
room temperature for 15 min, followed by FCM testing (Beckman
Coulter). The data acquired were analyzed with summit v5.2 software
(Beckman Coulter).
Identification of differential proteins
of Fra-1 overexpressing AGS cells by LC-MS/MS analysis
The cell lysate consisted of 50 mM Tris (pH 7.4),
150 mM NaCl, 1% Triton X-100, 1% sodium deoxycholate, 0.1% SDS and
sodium orthovanadate, sodium fluoride, EDTA, leupeptin,
supplemented with 1X halt protease inhibitor cocktail (CWBio) and
1X halt phosphatase inhibitor cocktail (BestBio). The protein
concentration was estimated by bicinchoninic acid (BCA) method. The
gel was run at 80 V 40 min, then 120 V 90 min. Then, 50 μg of each
preparation was loaded on a 10% SDS-PAGE gel. SDS-PAGE was run at
80 V 40 min, then 120 V 90 min. Protein bands were visualized using
Coomassie brilliant blue G-250 (Sigma, Carlsbad, CA, USA) and
excised. The protein spots were destained using 15 mM
K4Fe(CN)6 and 50 mM sodium thiosulfate 1.25
μg trypsin (1:20 enzyme/substrate ratio) was added to each band and
in-gel-digestion was performed at 37°C overnight (~16 h). The
generated peptides were extracted by sonication (15 min, ice
cooling) of the gel pieces in ~20 μl of 50% acetonitrile in 0.1%
FA, twice. After extracting from gel pieces, peptides were dried by
vacuum centrifugation to ensure a complete removal of acetonitrile
and reconstituted in 20 μl 0.1% FA (23–25).
LC-MS/MS analyses were performed on an Ultimate™
3000 RSLCnano system online coupled to an LTQ Orbitrap Velos Pro
mass spectrometer (both from Thermo Scientific, Bremen, Germany).
Peptide diluted with 0.1% FA, was injected in each analysis of 30
μl sample. After injection, peptides were pre-concentrated with
0.1% FA, 3%ACN on a trap column (μ-Precolumn C18 PepMap 100, 300 μm
× 5 mm, 5 μm, 100 Å; Thermo Fisher Scientific) at a flow rate of
300 nl/min for 5 min. Subsequently, the analyte was transferred to
the analytical column (Acclaim® PepMap RSLC, 75 μm × 15
cm, nano Viper, C18, 2 μm, 100 Å; Thermo Fisher Scientific) and
separated using a 120-min gradient from 5 to 40% solvent B at a
flow rate of 300 nl/min (solvent A, 0.1% formic acid; solvent B,
0.08% FA 80% acetonitrile). The mass spectrometer was operated in a
data-dependent mode. The general mass spectrometric parameters
were: spray voltage, 2.0 kV; capillary temperature, 275°C. For
data-dependent MS/MS analyses, the software Xcalibur (Thermo Fisher
Scientific) was used. Full scan MS spectra were acquired at a mass
resolution of 60,000 (mass range 350–2000 m/z) in the Orbitrap
analyzer. For label-free analyses, tandem mass spectra of the ten
most abundant peaks were acquired in the linear ion trap by peptide
fragmentation using collision-induced dissociation (CID).
Normalized collision energy (NCE) was set to 35% and an isolation
width of 2 m/z was chosen (23–25).
Protein identifications were performed with Proteome
Discoverer software. Briefly, Thermo raw-files were imported and
searched against UniProtKB/Swiss-Prot database (release 2014_10).
For database searches, mass tolerances were set to 10 ppm and 0.8
Da for precursor and fragment ions, respectively. Taxonomy was
restricted to human and one enzymatic miscleavage was allowed. For
label-free analyses, modifications of cysteine (carbamidomethyl,
static) and methionine (oxidation, variable) were considered.
Confidence of peptide identifications was estimated using
percolator function, implemented in Proteome Discoverer. Instead of
determining the peptide confidence based on a singlemetric such as
Mascot ion score, we decided to use percolator as it discriminates
correct from incorrect peptide spectrum matches based on multiple
orthogonal score criteria leading to accurate and sensitive peptide
identifications. Peptide identifications with false discovery rates
N 1% (q-value N 0.01) were discarded (23–25).
Western blot analysis
The gastric cancer tissues, corresponding non-tumor
normal tissues, and AGS cells were lysed in RIPA buffer (CWBio) and
total protein concentration was determined using Pierce®
BCA protein assay kit (Thermo Scientific, Inc., Rockford, IL, USA).
Extracts containing 50 μg of proteins were separated in 10%
SDS-PAGE gels and electroblotted onto nitrocellulose membranes
(HyClone Laboratories). The membranes were inhibited using
Tris-buffered saline/Tween-20 (25 mM Tris-HCl, 150 mM NaCl, pH 7.5
and 0.05% Tween-20) containing 5% non-fat milk followed by
overnight incubation at 4°C with primary antibodies (rabbit
anti-PI3K polyclonal antibody, catalog no. 4292; Cell Signaling
Technology, Inc., Danvers, MA, USA; dilution, 1:500; rabbit
anti-Akt polyclonal antibody, catalog no. 9272, Cell Signaling
Technology; dilution, 1:300; rabbit anti-MDM2 antibody, 1:200 and
rabbit anti-p53 antibody, 1:200; Wuhan Boster). Following three
washes, the membranes were incubated with horseradish
peroxidase-conjugated second antibodies (catalog no. sc-2491; Santa
Cruz Biotechnology, Inc., Santa Cruz, CA, USA; dilution, 1:5,000)
and the specific signals were visualized using an ECL detection
system. Anti-GAPDH antibody (Santa Cruz Biotechnology; 1:3,000) was
used as a loading control.
Statistical analysis
Differences of non-parametric variables were
analyzed by the Mann-Whitney U test. Differences of the
quantitative variables between groups were analyzed by the
Student's t-test using SPSS 11.0 program (SPSS, Inc., Chicago, IL,
USA). A value of P<0.05 was considered statistically
significant.
Results
Fra-1 is highly expressed in gastric
cancer tissue
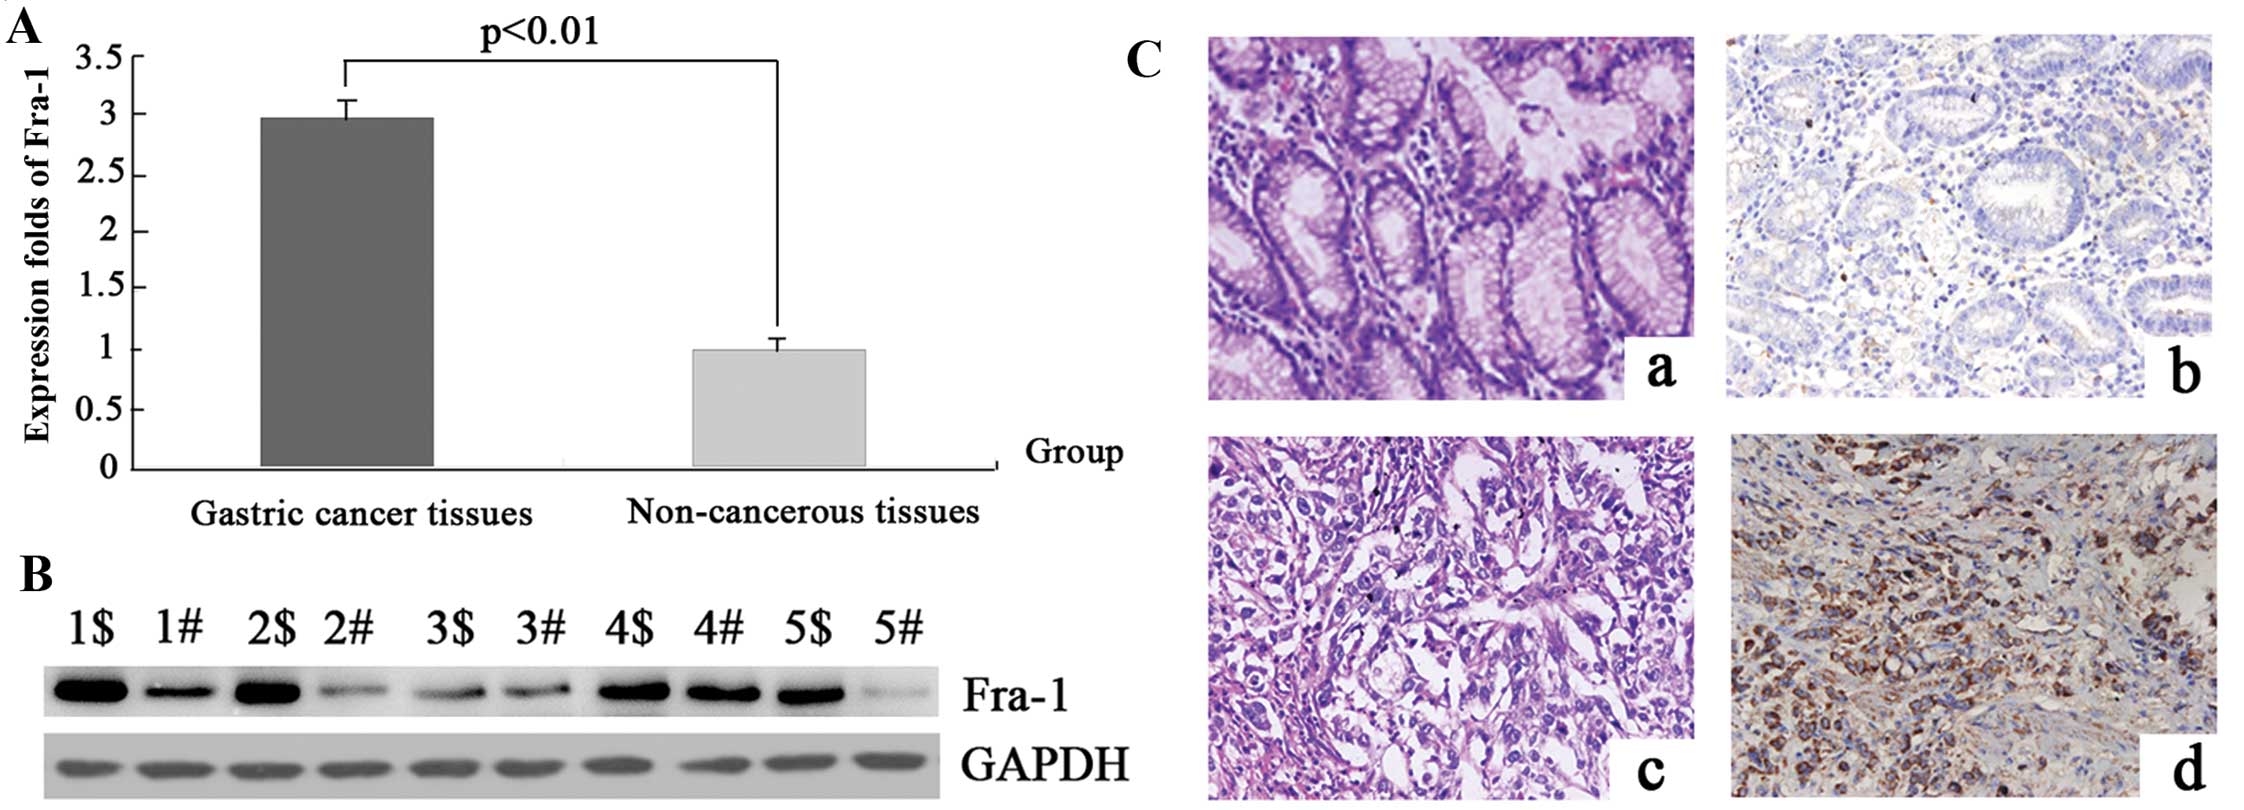
To detect the mRNA expression levels of the Fra-1
molecular in gastric cancer and the adjacent non-cancerous tissues,
20 samples of each were selected to perform qPCR of the Fra-1 gene.
The data were analyzed using the 2−ΔΔCT method and the
fold change in the expression of these genes relative to the
internal control gene, GAPDH, was analyzed. The expression of the
Fra-1 gene was higher in the gastric cancer samples compared with
the adjacent non-cancerous tissues and the normalized Fra-1 gene
expression in gastric cancer was upregulated 2.99-fold (P=0.017)
(Fig. 1A and Table II).
| Table IIIdentification of the mRNA expression
level of Fra-1 in gastric cancer and adjacent non-cancerous tissues
by qPCR. |
Table II
Identification of the mRNA expression
level of Fra-1 in gastric cancer and adjacent non-cancerous tissues
by qPCR.
| Gene | Sample | n | Fra-1 CT (mean ±
SD) | GAPDH CT (mean ±
SD) | ΔCT (mean ±
SD) | ΔΔCT (mean ±
SD) | Folda |
|---|
| Fra-1 | Gastric cancer
tissues | 20 | 26.86±1.05 | 16.27±0.64 | 10.59±0.43 | −1.58±0.52 | 2.99 |
| Non-cancerous
tissues | 20 | 29.34±1.65 | 16.73±0.66 | 12.17±0.45 | | (2.08–4.28) |
To determine whether the Fra-1 gene was expressed at
a higher level in gastric cancer compared with the adjacent
non-cancerous tissues, the protein expression levels of Fra-1 were
further examined by western blot analysis in 1–5 samples (Fig. 1B). In comparison with the adjacent
non-cancerous tissues, the expression level was identified to be
greater in gastric cancer tissues, which corresponded with the qPCR
results.
To confirm the pattern of Fra-1 in gastric cancer,
immunohistochemistry (IHC) was carried out with antibodies against
Fra-1 protein in gastric cancer and the adjacent non-cancerous
tissues. Fra-1 was identified as differentially expressed between
gastric cancer tissues versus the adjacent non-cancerous tissues.
IHC showed a similar pattern in protein expression with western
blot results. There was 61.5% (16/26) high score of Fra-1 in
gastric cancer tissues and 26.9% (7/26) in the adjacent
non-cancerous tissues. The distribution of low score was 23.1%
(6/26) and 42.3% (11/26) in gastric cancer and the adjacent
non-cancerous tissues, respectively (P=0.024) (Fig. 1C and Table III), thus, corresponding with the
qPCR results.
| Table IIIThe difference of Fra-1 expression
between gastric cancer and the adjacent non-cancerous tissues by
immunohistochemistry. |
Table III
The difference of Fra-1 expression
between gastric cancer and the adjacent non-cancerous tissues by
immunohistochemistry.
| | Score |
|---|
| |
|
|---|
| n | Low (0–2) | Moderate (3–4) | High (5–6) | χ2 | P-value |
|---|
| Gastric cancer | 30 | 6 (20.0%) | 8 (26.7%) | 16 (61.5%) | 7.38 | 0.024<0.05 |
| Non-cancerous
tissues | 30 | 15 (42.3%) | 8 (30.8%) | 7 (26.9%) | | |
Analysis of cell cycle in AGS cells
overexpressing Fra-1
Cell cycle progression was assessed in AGS,
AGS/vector and AGS/Fra-1 cells by flow cytometry. For AGS and
AGS/vector cells, the percentages of G0/G1, S and G2/M phases were
59.2, 22.4, 18.4 and 60.1, 22.0, 17.9%, respectively. Whereas, AGS
cells with Fra-1 overexpression were mostly in the proliferative
phase, and showed significant increase in S phase and reduction in
G0/G1 phase, the percentages of G0/G1, S and G2/M phases were 48.9,
32.4 and 18.7%, respectively (Fig.
2A). The results suggested that Fra-1 affected cell cycle
distribution of gastric cancer cells.
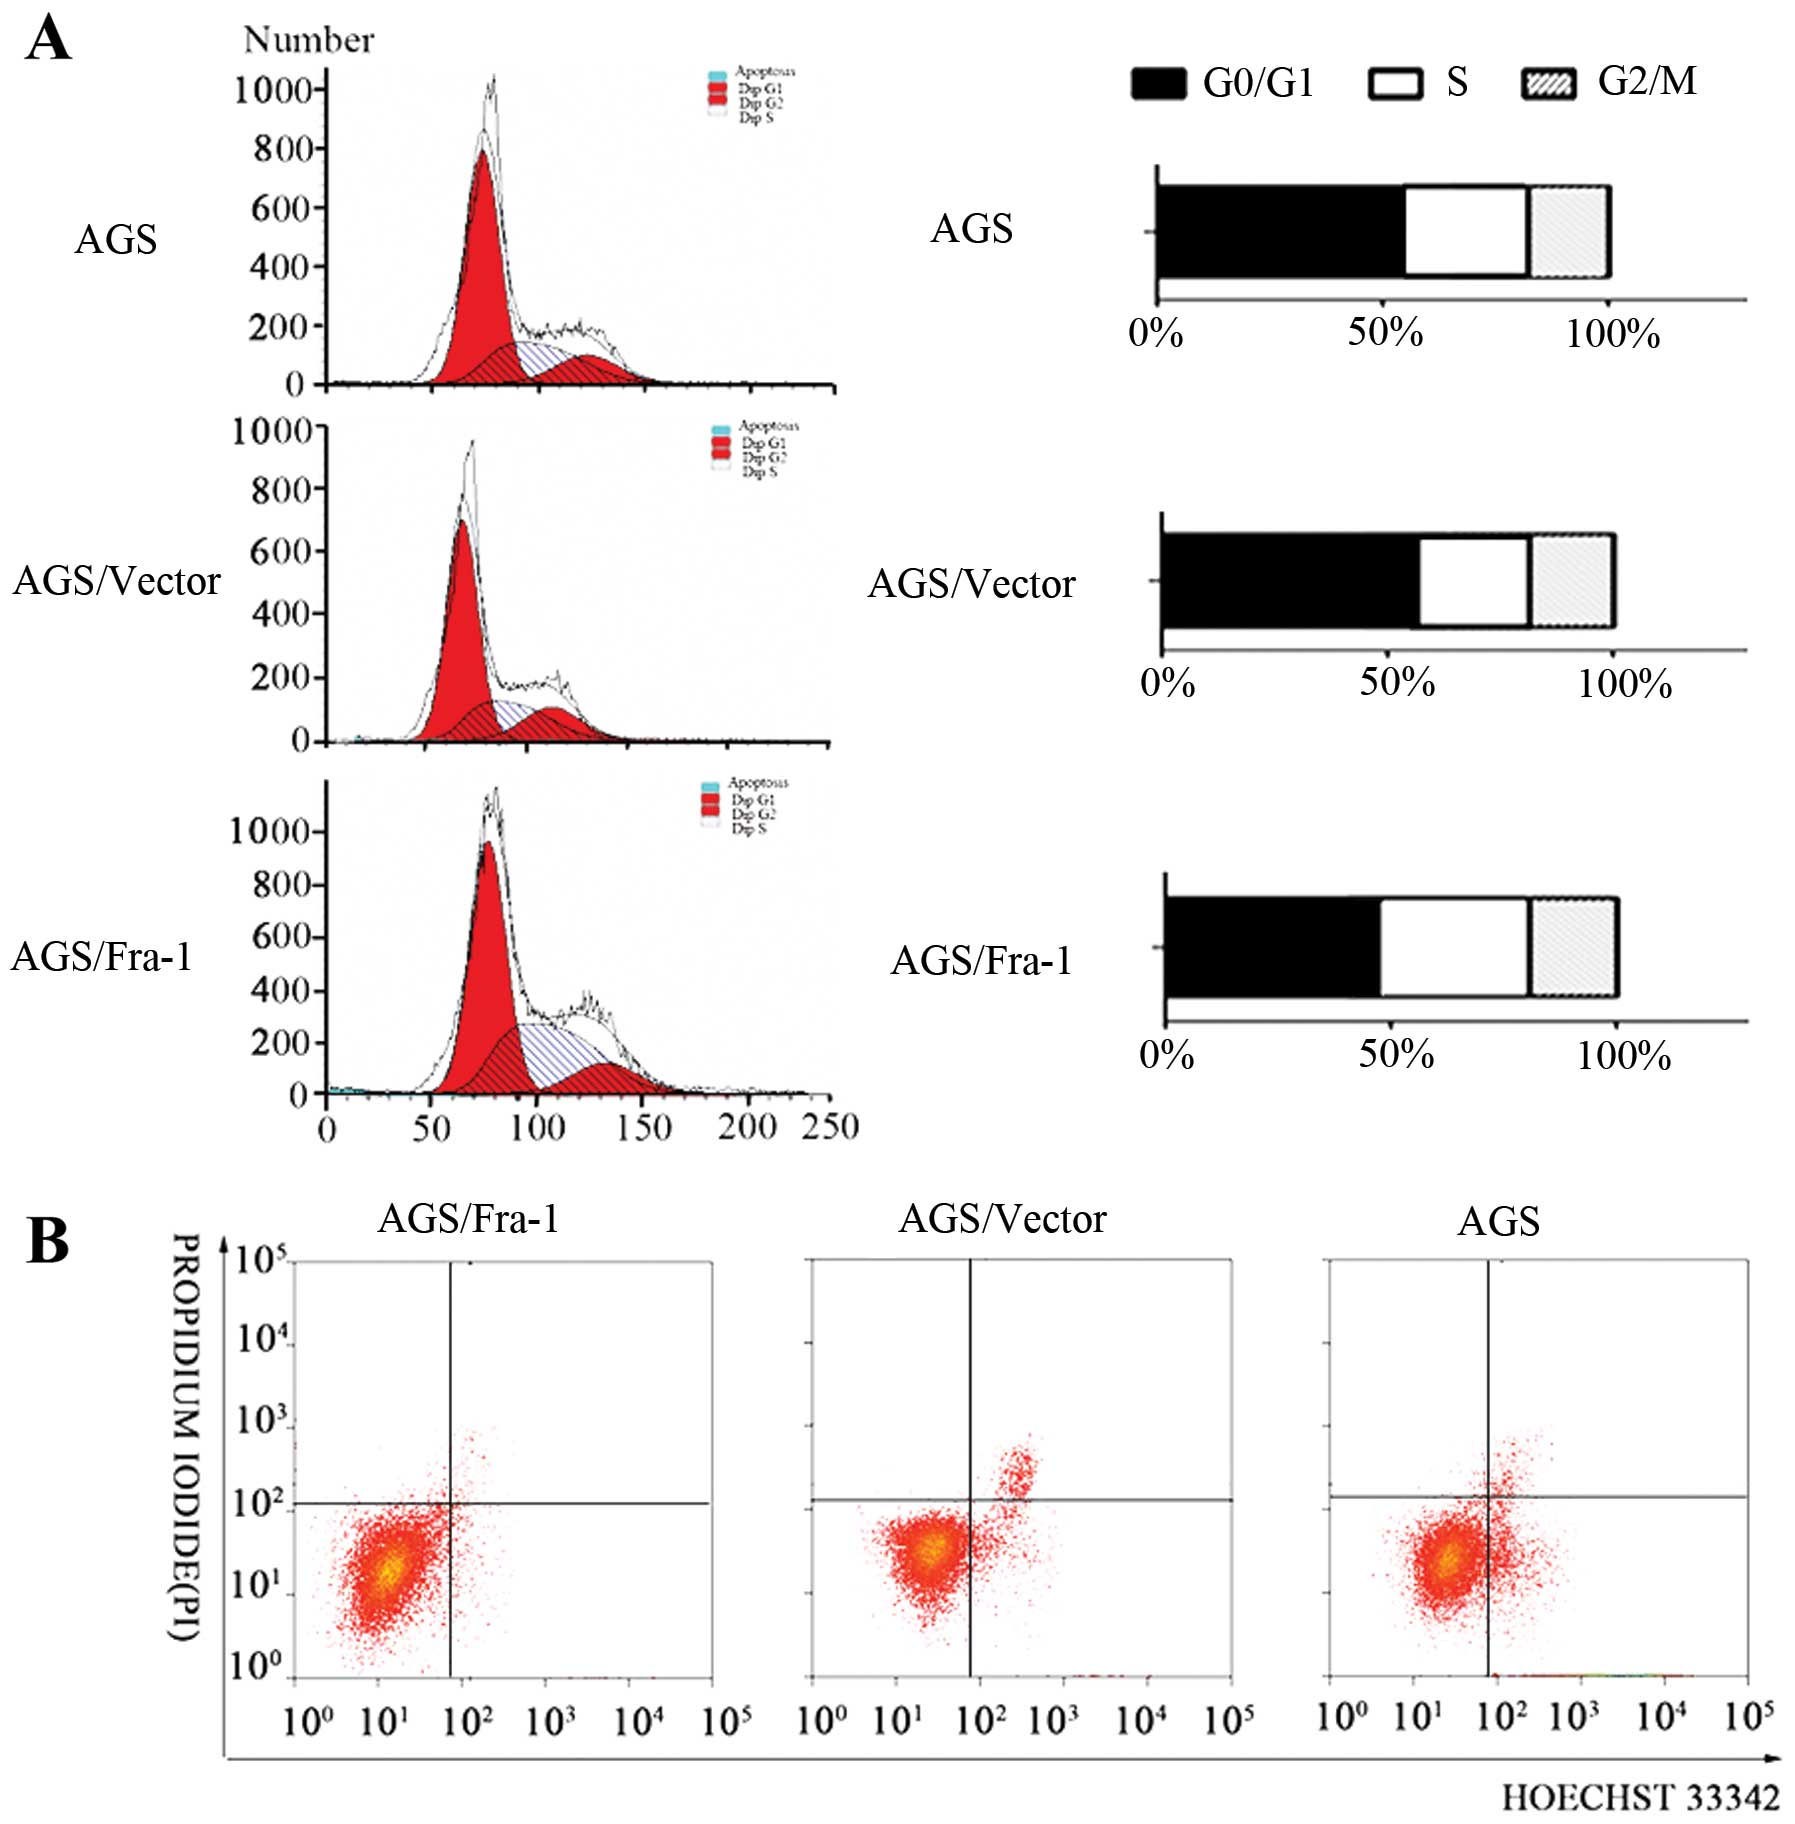 | Figure 2Fra-1 affects the distribution of
cell cycle and inhibits cell apoptosis in AGS gastric cancer cells.
(A) The distribution of the cell cycle in AGS gastric cancer cells.
AGS/Fra-1, transfection with pEGFP-N1-Fra-1 plasmid after 48 h,
AGS/vector, transfection with pEGFP-N1 plasmid after 48 h, AGS,
transfection without plasmid. (B) The effect of Fra-1 to AGS
gastric cancer cells. AGS/Fra-1, transfection with pEGFP-N1-Fra-1
plasmid after 48 h, AGS/vector, transfection with pEGFP-N1 plasmid
after 48 h, AGS, transfection without plasmid. Data are
representative of three independent experiments. |
Fra-1 inhibits gastric cancer cell
apoptosis
Promotion of cell proliferation is usually mediated
by inhibition of cell apoptosis. To determine whether apoptosis
mediated the growth in AGS, AGS/vector and AGS/Fra-1 cells, we
performed a Hoechst 33342/PI double-staining experiment. A
considerable decrease in apoptotic cells was observed for AGS/Fra-1
cells (5.27±0.24%), AGS cells (11.54±0.87%), and AGS/vector cells
(10.97±0.73%) (Fig. 2B). Our
results suggested that Fra-1 inhibited gastric cancer cell
apoptosis.
Identification of proteins affected by
Fra-1 through LC-MS/MS analyses
We found that Fra-1 was highly expressed in gastric
cancer tissues and inhibited apoptosis of gastric cancer cells
in vitro. Furthermore, we identified the differential
molecule affected by Fra-1 through LC-MS/MS analyses. Our results
showed that there were 21 proteins which were only present in
AGS/Fra-1 cells and there were 16 proteins which were only at
present in AGS/vector cells. According to the frequency of unique
peptides, the CARS protein was the highest in AGS/Fra-1 cells
followed by CLTB, CTTN, EHD1, EPS8L2, and EZR (Table III). ACTG1 protein was the
highest in AGS/vector cells (Table
IV).
| Table IVThe differential proteins affected by
FRA-1 through LC-MS/MS analyses. |
Table IV
The differential proteins affected by
FRA-1 through LC-MS/MS analyses.
| AGS/FRA-1 | AGS/vector |
|---|
|
|
|
|---|
| No. | Protein | Unique
peptides | Coverage (%) | Protrin score | Protein | Unique
peptides | Coverage (%) | Protrin score |
|---|
| 1 | CARS | 48 | 25.05 | 262.99 | ACTG1 | 44 | 23.05 | 231.28 |
| 2 | CLTB | 33 | 21.63 | 171.87 | ARF6 | 42 | 11.23 | 224.82 |
| 3 | CTTN | 33 | 19.64 | 132.1 | CSTB | 30 | 24.68 | 150.08 |
| 4 | EHD1 | 32 | 9.13 | 114.32 | DDX56 | 29 | 23.47 | 156.81 |
| 5 | EPS8L2 | 31 | 24.33 | 179.56 | EIF4A1 | 28 | 43.83 | 119.16 |
| 6 | EZR | 31 | 25.90 | 157.76 | LAMB3 | 26 | 16.73 | 137.39 |
| 7 | GIPC1 | 30 | 46.99 | 149.72 | MTA2 | 26 | 16.30 | 72.34 |
| 8 | GPRC5A | 27 | 20.13 | 144.92 | MYOF | 25 | 44.80 | 153.84 |
| 9 | HMBS | 26 | 45.72 | 184.4 | PPM1G | 25 | 18.73 | 110.75 |
| 10 | ITGA3 | 26 | 14.31 | 158.29 | RRP9 | 24 | 28.79 | 121.47 |
| 11 | KRT17 | 24 | 48.59 | 151.03 | S100A16 | 23 | 47.65 | 168.64 |
| 12 | LMO7 | 23 | 17.38 | 132.3 | TBRG4 | 23 | 32.13 | 96.54 |
| 13 | LRRFIP1 | 21 | 26.11 | 104.45 | TM4SF1 | 21 | 37.00 | 175.58 |
| 14 | MRPL17 | 20 | 36.47 | 158.23 | TOR4A | 21 | 51.35 | 167.67 |
| 15 | NOP16 | 20 | 46.78 | 124.36 | TUBA1C | 21 | 12.18 | 102.87 |
| 16 | NUDT5 | 20 | 29.51 | 105.72 | UBC | 20 | 39.47 | 157.66 |
| 17 | RALB | 20 | 17.95 | 101.27 | | | | |
| 18 | TTLL12 | 19 | 39.36 | 216.67 | | | | |
| 19 | TUBB4B | 19 | 48.45 | 135.76 | | | | |
| 20 | TUBG1 | 19 | 35.49 | 117.77 | | | | |
| 21 | VPS26A | 19 | 32.71 | 95.42 | | | | |
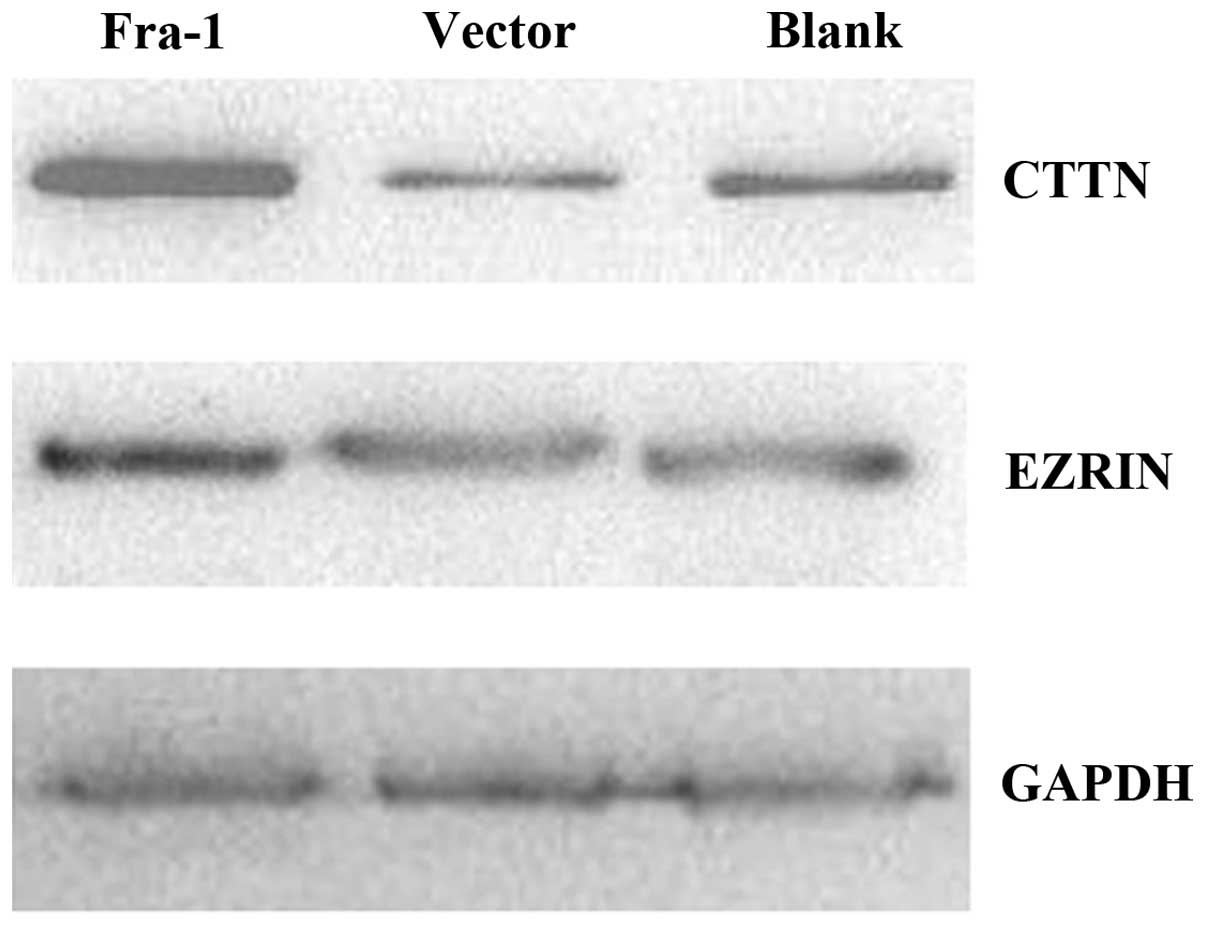
To confirm the reliability of the proteins
identified, we tested the expression levels of CARS, CLTB, CTTN,
EHD1, EPS8L2 and EZR by western blot analysis. The results showed
that CTTN and EZR were upregulated in AGS/Fra-1 cells compared with
AGS/vector cells and AGS cells (Fig.
3). It corresponded with the LC-MS/MS results. Further four
proteins were no significantly different among AGS/Fra-1 cells,
AGS/vector cells and AGS cells.
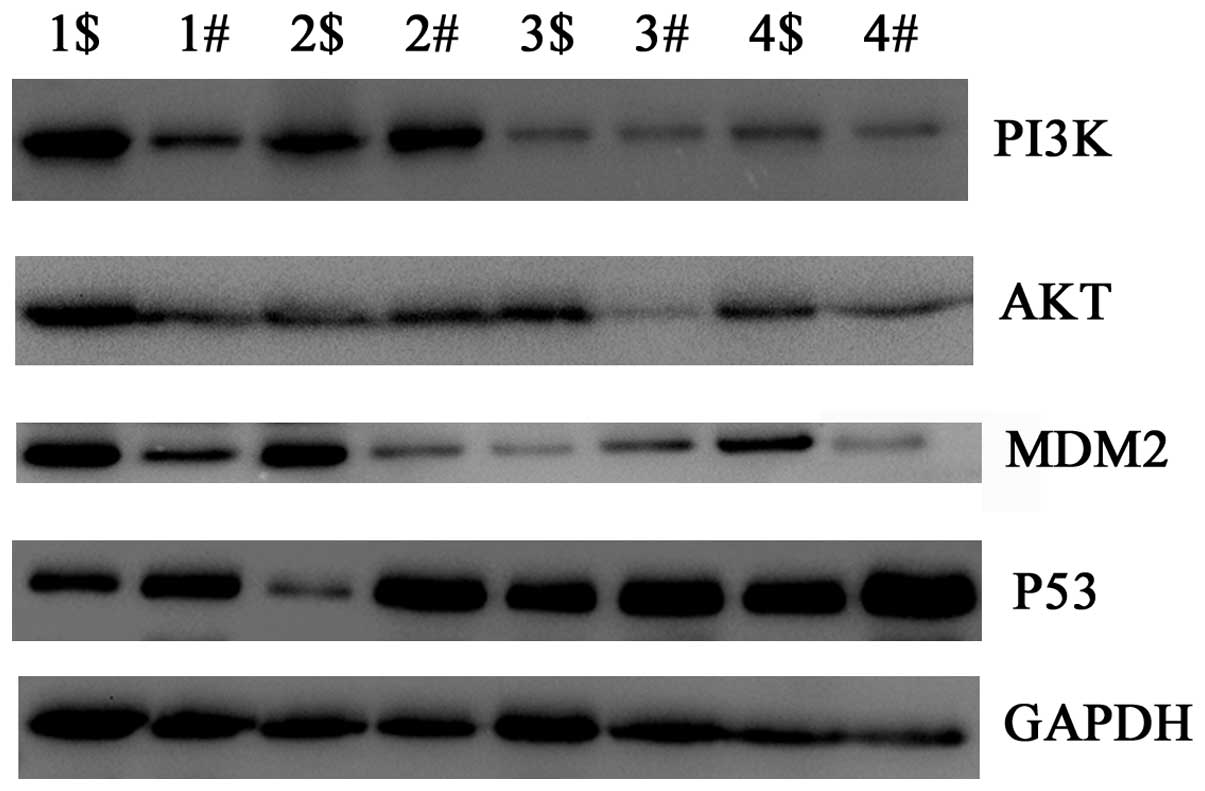
Fra-1 is correlated with dysregulation of
PI3K, Akt, MDM2 and p53 in gastric cancer tissues in vitro
To uncover the possible mechanism of Fra-1 in
gastric cancer, we tested the expression levels of key molecules in
the PI3K/Akt signaling pathway by western blot technology. PI3K and
Akt were upregulated in gastric cancer compared with the adjacent
non-cancerous tissues. MDM2 had the same tendency with PI3K and
Akt, but p53 was downregulated in gastric cancer (Fig. 4). Combined with the above results
in which Fra-1 was highly expressed in gastric cancer, we inferred
that Fra-1 is correlated with dysregulation PI3K/Akt and p53
signaling pathway in gastric cancer tissues in vitro.
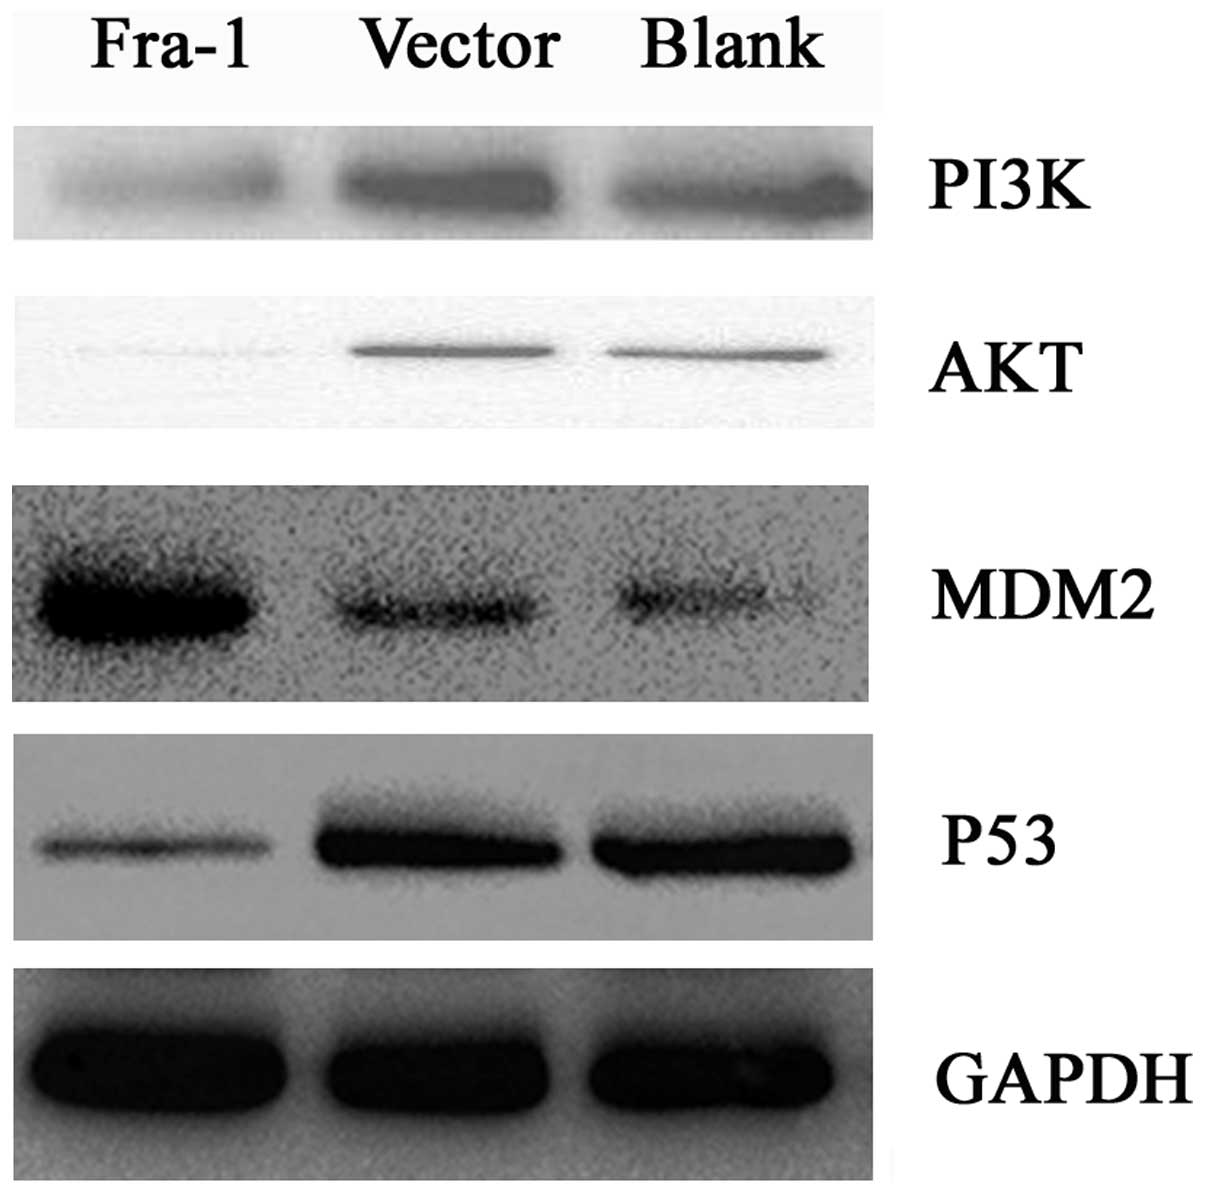
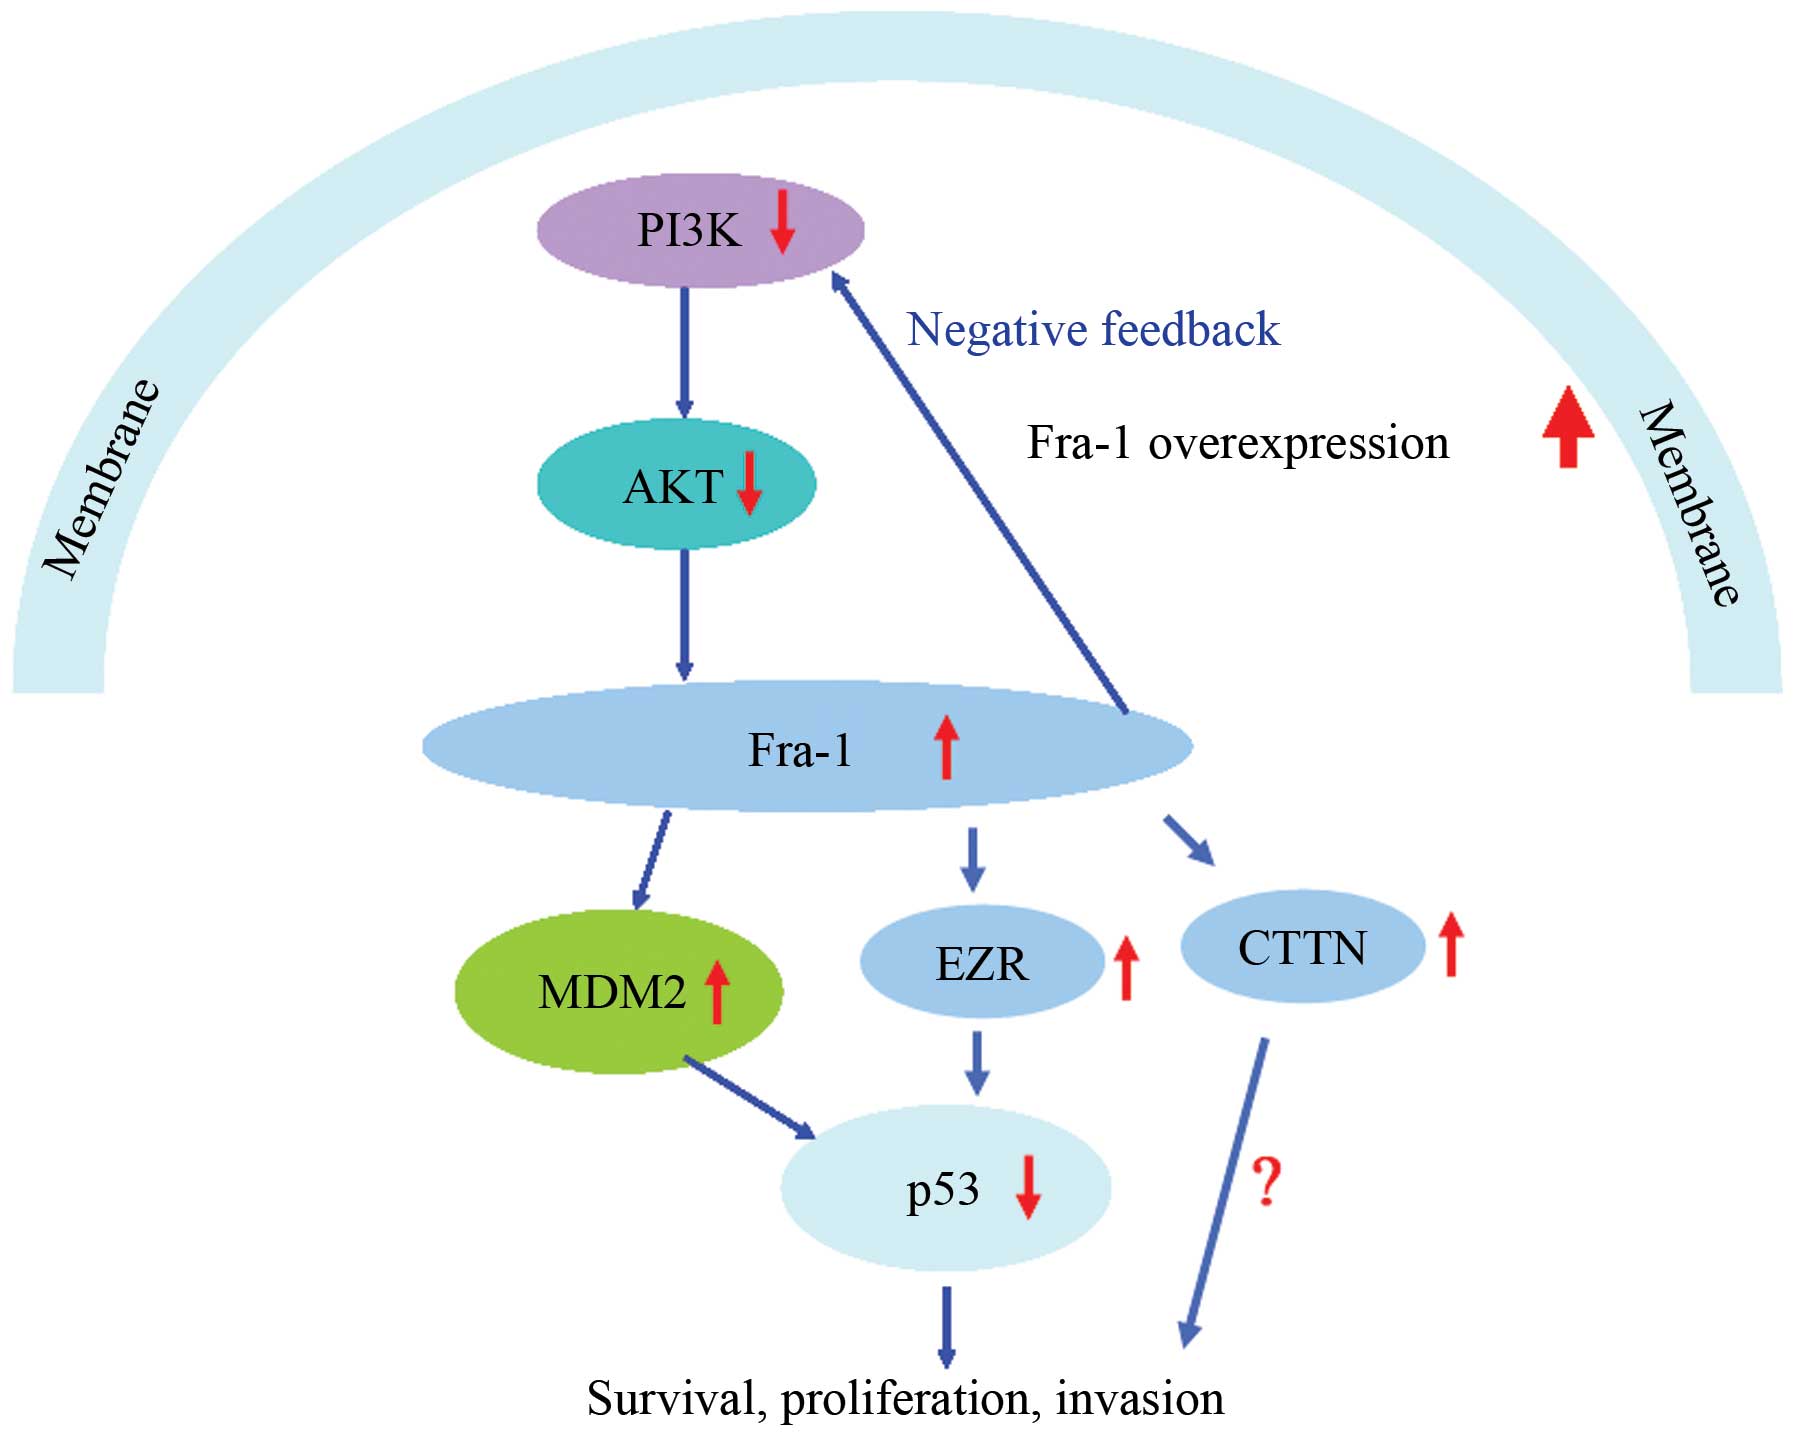
Fra-1 overexpression affects the
expression of PI3K, Akt, MDM2 and p53 in vivo
To confirm whether Fra-1 affects the expression of
PI3K, Akt, MDM2 and p53 in vivo, we constructed the plasmid
pEGFP-N1-Fra-1. The plasmid of pEGFP-N1-Fra-1 and pEGFP-N1 were
transfected into AGS gastric cancer cells. We harvested the cells
after 48 h with transfection and tested the expression levels of
PI3K, Akt, MDM2 and p53 proteins in vivo. The PI3K and Akt
were downregulated in AGS cells which Fra-1 was overexpressed. The
MDM2 was upregulated in AGS cells in which Fra-1 was overexpressed.
Furthermore, p53 was downregulated in AGS cells in which Fra-1 was
overexpressed (Fig. 5). Our
results suggested that Fra-1 overexpression affected the expression
of PI3K, Akt, MDM2 and p53 in vivo (summary in Fig. 6).
Discussion
Despite an overall decline in incidence over the
last several decades, gastric cancer (GC) remains the fourth most
common type of cancer and is the second leading cause of
cancer-related death worldwide (26,27).
Although some evidence has been reported, the mechanism of GC is
not fully understood (28–30). Thus, identifying molecular
aberrations in GC may improve our understanding of gastric
carcinogenesis and help us subdivide patients into biologically and
clinically relevant subgroups, as well as develop novel therapeutic
strategies.
In the present study, we found that the expression
of the Fra-1 gene was higher in the gastric cancer samples compared
with the adjacent non-cancerous tissues and the normalized Fra-1
gene expression in gastric cancer was upregulated 2.99-fold
(P<0.01). Similar tendency was seen by western blot experiments.
IHC showed a similar pattern in protein expression with qPCR
results and western blot results. Adiseshaiah et al
(2) found that FRA-1 was
frequently over-expressed in squamous cell carcinomas of the
stomach and esophagus. High Fra-1 expression is associated with a
more malignant cell phenotype and Fra-1 could have a pivotal role
in breast cancer progression (31). Philips et al (32) found that high Fra-1 concentration
was crucial for the negative regulation of AP-1 activity by
estradiol and that Fra-1 might take part in estradiol-induced
inhibition of cell proliferation in ER alpha-breast cancer cells
transfected with ER alpha expression construct. The results of the
study by Shirsat et al (33) showed that overexpression of Fra-1
could lead to proliferation inhibition of C6 glioma cells. Our
results are consistent with these reports.
Our results showed that Fra-1 was able to inhibit
cell apoptosis of gastric cancer cell and increase the rate of S
phase of cell cycle. Deregulation of the cell cycle underlies the
aberrant cell proliferation that characterizes cancer and loss of
cell cycle checkpoint control promotes genetic instability.
Moreover, we identified and confirmed that Fra-1 affected the
expression level of CTTN and EZR in vitro by LC-MS/MS
analyses. Our results suggested that Fra-1 might function by
regulating the expression of CTTN and EZR. Zhang and Qi (34) found that MTSS1 suppressed cell
migration and invasion by targeting CTTN in glioblastoma. Cortactin
(CTTN) overexpression in osteosarcoma is correlated with its
advanced stage and reduced survival (35). Luo et al (36) found that amplification and
overexpression of CTTN (EMS1) contributed to the metastasis of
esophageal squamous cell carcinoma by promoting cell migration and
anoikis resistance. Our results also hinted that CTTN might play an
important role in the malignancy.
The PI3K/Akt pathway is known to play key roles in
cell apoptosis, cell proliferation, and cell survival in various
kinds of cells (37). It is
generally demonstrated that the PI3K/AKT signaling pathways
regulate metastasis in a variety of cancer cells (38,39).
Our results showed that Fra-1 was correlated with dysregulation of
PI3K/Akt and p53 signaling pathway in gastric cancer tissues in
vitro and that Fra-1 overexpression affected the expression of
PI3K, Akt, MDM2 and p53 in vivo. Degradation of p53 is
regulated by its interaction with specific E3 ubiquitin ligases,
the best known, being encoded by MDM2 (40). Damage to p53-dependent mechanism is
often caused by overexpression of MDM2, which codes for a
p53-regulating protein (41).
In summary, our results suggested that Fra-1 was
upregulated in gastric cancer and affected the expression of CTTN
and EZR in AGS gastric cancer cells. We found that Fra-1 was
involved with dysregulation of PI3K/Akt and p53 signaling pathway
in vitro and that Fra-1 overexpression affected the
expression of PI3K, Akt, MDM2 and p53 in vivo. Thus, as
shown (Fig. 6) we inferred that
Fra-1 functions by regulating the expression of CCTN and EZR and
dysactivation of the PI3K/Akt and p53 signaling pathway.
Acknowledgements
The present study was supported by the National
Natural Science Foundation of China (81272975, 81172302, 81402270
and 81402307); the Key Project of Hunan Provincial Natural Science
Foundation (12JJ2044); the Project of Hunan Provincial Natural
Science Foundation (12JJ3121); the Project of Hunan Provincial
Development and Reform Commission; the Planned Science and
Technology Project of Hunan Province (2010FJ3088 and
2012FJ2014).
Abbreviations:
|
GC
|
gastric cancer
|
|
FOSL1 (also known as Fra-1)
|
FOS-like antigen 1
|
|
CTTN
|
cortactin
|
|
EZR
|
ezrin
|
|
TP53
|
tumor protein p53
|
|
AKT1 (also known as AKT)
|
v-akt murine thymoma viral oncogene
homolog 1
|
|
IHC
|
immunohistochemistry
|
|
GADPH
|
glyceraldehyde-3-phosphate
dehydrogenase
|
References
|
1
|
Lu D, Chen S, Tan X, Li N, Liu C, Li Z,
Liu Z, Stupack DG, Reisfeld RA and Xiang R: Fra-1 promotes breast
cancer chemo-sensitivity by driving cancer stem cells from
dormancy. Cancer Res. 72:3451–3456. 2012. View Article : Google Scholar : PubMed/NCBI
|
|
2
|
Adiseshaiah P, Lindner DJ, Kalvakolanu DV
and Reddy SP: FRA-1 proto-oncogene induces lung epithelial cell
invasion and anchorage-independent growth in vitro, but is
insufficient to promote tumor growth in vivo. Cancer Res.
67:6204–6211. 2007. View Article : Google Scholar : PubMed/NCBI
|
|
3
|
Young MR and Colburn NH: Fra-1 a target
for cancer prevention or intervention. Gene. 379:1–11. 2006.
View Article : Google Scholar : PubMed/NCBI
|
|
4
|
Xiao S, Zhou Y, Yi W, Luo G, Jiang B, Tian
Q, Li Y and Xue M: Fra-1 is downregulated in cervical cancer
tissues and promotes cervical cancer cell apoptosis by p53
signaling pathway in vitro. Int J Oncol. 46:1677–1684.
2015.PubMed/NCBI
|
|
5
|
Liu H, Ren G, Wang T, Chen Y, Gong C, Bai
Y, Wang B, Qi H, Shen J, Zhu L, et al: Aberrantly expressed Fra-1
by IL-6/STAT3 transactivation promotes colorectal cancer
aggressiveness through epithelial-mesenchymal transition.
Carcinogenesis. 36:459–468. 2015. View Article : Google Scholar : PubMed/NCBI
|
|
6
|
Wang HL, Wang J, Xiao SY, Haydon R,
Stoiber D, He TC, Bissonnette M and Hart J: Elevated protein
expression of cyclin D1 and Fra-1 but decreased expression of c-Myc
in human colorectal adenocarcinomas overexpressing beta-catenin.
Int J Cancer. 101:301–310. 2002. View Article : Google Scholar : PubMed/NCBI
|
|
7
|
Oliveira-Ferrer L, Kürschner M, Labitzky
V, Wicklein D, Müller V, Lüers G, Schumacher U, Milde-Langosch K
and Schröder C: Prognostic impact of transcription factor Fra-1 in
ER-positive breast cancer: Contribution to a metastatic phenotype
through modulation of tumor cell adhesive properties. J Cancer Res
Clin Oncol. Feb 10–2015.(Epub ahead of print). View Article : Google Scholar : PubMed/NCBI
|
|
8
|
Belguise K, Milord S, Galtier F,
Moquet-Torcy G, Piechaczyk M and Chalbos D: The PKCθ pathway
participates in the aberrant accumulation of Fra-1 protein in
invasive ER-negative breast cancer cells. Oncogene. 31:4889–4897.
2012. View Article : Google Scholar : PubMed/NCBI
|
|
9
|
Davis WJ, Lehmann PZ and Li W: Nuclear
PI3K signaling in cell growth and tumorigenesis. Front Cell Dev
Biol. 3:242015. View Article : Google Scholar : PubMed/NCBI
|
|
10
|
Brown KK and Toker A: The phosphoinositide
3-kinase pathway and therapy resistance in cancer. F1000Prime Rep.
7:132015. View
Article : Google Scholar : PubMed/NCBI
|
|
11
|
Zheng D, Zhu G, Liao S, Yi W, Luo G, He J,
Pei Z, Li G and Zhou Y: Dysregulation of the PI3K/Akt signaling
pathway affects cell cycle and apoptosis of side population cells
in naso-pharyngeal carcinoma. Oncol Lett. 10:182–188.
2015.PubMed/NCBI
|
|
12
|
Liao S, Xiao S, Zhu G, Zheng D, He J, Pei
Z, Li G and Zhou Y: CD38 is highly expressed and affects the
PI3K/Akt signaling pathway in cervical cancer. Oncol Rep.
32:2703–2709. 2014.PubMed/NCBI
|
|
13
|
Saha T, Kar RK and Sa G: Structural and
sequential context of p53: A review of experimental and theoretical
evidence. Prog Biophys Mol Biol. 117:250–263. 2015. View Article : Google Scholar : PubMed/NCBI
|
|
14
|
Meng X, Franklin DA, Dong J and Zhang Y:
MDM2-p53 pathway in hepatocellular carcinoma. Cancer Res.
74:7161–7167. 2014. View Article : Google Scholar : PubMed/NCBI
|
|
15
|
Zhang Q, Zeng SX and Lu H: Targeting
p53-MDM2-MDMX loop for cancer therapy. Subcell Biochem. 85:281–319.
2014. View Article : Google Scholar : PubMed/NCBI
|
|
16
|
Briest F and Grabowski P: The p53 network
as therapeutic target in gastroenteropancreatic neuroendocrine
neoplasms. Cancer Treat Rev. 41:423–430. 2015. View Article : Google Scholar : PubMed/NCBI
|
|
17
|
Abraham AG and O'Neill E:
PI3K/Akt-mediated regulation of p53 in cancer. Biochem Soc Trans.
42:798–803. 2014. View Article : Google Scholar : PubMed/NCBI
|
|
18
|
Livak KJ and Schmittgen TD: Analysis of
relative gene expression data using real-time quantitative PCR and
the 2(−Delta Delta C(T)) method. Methods. 25:402–408. 2001.
View Article : Google Scholar
|
|
19
|
Zhou Y, Wang W, Zheng D, Peng S, Xiong W,
Ma J, Zeng Z, Wu M, Zhou M, Xiang J, et al: Risk of nasopharyngeal
carcinoma associated with polymorphic lactotransferrin haplotypes.
Med Oncol. 29:1456–1462. 2012. View Article : Google Scholar
|
|
20
|
Zheng D, Liao S, Zhu G, Luo G, Xiao S, He
J, Pei Z, Li G and Zhou Y: CD38 is a putative functional marker for
side population cells in human nasopharyngeal carcinoma Cell Lines.
Mol Carcinog. Jan 28–2015.(Epub ahead of print). View Article : Google Scholar
|
|
21
|
Zhu W, Li J, Su J, Li J, Li J, Deng B, Shi
Q, Zhou Y and Chen X: FOS-like antigen 1 is highly expressed in
human psoriasis tissues and promotes the growth of HaCaT cells in
vitro. Mol Med Rep. 10:2489–2494. 2014.PubMed/NCBI
|
|
22
|
Hara A and Okayasu I: Cyclooxygenase-2 and
inducible nitric oxide synthase expression in human astrocytic
gliomas: Correlation with angiogenesis and prognostic significance.
Acta Neuropathol. 108:43–48. 2004. View Article : Google Scholar : PubMed/NCBI
|
|
23
|
Heo S, Spoerk S, Birner-Gruenberger R and
Lubec G: Gel-based mass spectrometric analysis of hippocampal
transmembrane proteins using high resolution LTQ Orbitrap Velos
Pro. Proteomics. 14:2084–2088. 2014. View Article : Google Scholar : PubMed/NCBI
|
|
24
|
Haddad T and Kümmerer K: Characterization
of photo-transformation products of the antibiotic drug
Ciprofloxacin with liquid chromatography-tandem mass spectrometry
in combination with accurate mass determination using an
LTQ-Orbitrap. Chemosphere. 115:40–46. 2014. View Article : Google Scholar : PubMed/NCBI
|
|
25
|
Zhang JY, Wang F, Zhang H, Lu JQ and Qiao
YJ: Rapid identification of polymethoxylated flavonoids in
traditional Chinese medicines with a practical strategy of stepwise
mass defect filtering coupled to diagnostic product ions analysis
based on a hybrid LTQ-Orbitrap mass spectrometer. Phytochem Anal.
25:405–414. 2014. View Article : Google Scholar : PubMed/NCBI
|
|
26
|
Carcas LP: Gastric cancer review. J
Carcinog. 13:142014. View Article : Google Scholar
|
|
27
|
Jemal A, Bray F, Center MM, Ferlay J, Ward
E and Forman D: Global cancer statistics. CA Cancer J Clin.
61:69–90. 2011. View Article : Google Scholar : PubMed/NCBI
|
|
28
|
Choi B, Lee EJ, Park YS, Kim SM, Kim EY,
Song Y, Kang SW, Rhu MH and Chang EJ: Pentraxin-3 silencing
suppresses gastric cancer-related inflammation by inhibiting
chemotactic migration of macrophages. Anticancer Res. 35:2663–2668.
2015.PubMed/NCBI
|
|
29
|
Saavedra K, Valbuena J, Olivares W,
Marchant MJ, Rodríguez A, Torres-Estay V, Carrasco-Avino G, Guzmán
L, Aguayo F, Roa JC, et al: Loss of expression of reprimo, a
p53-induced cell cycle arrest gene, correlates with invasive stage
of tumor progression and p73 expression in gastric cancer. PLoS
One. 10:e01258342015. View Article : Google Scholar : PubMed/NCBI
|
|
30
|
Praud D, Parpinel M, Serafini M, Bellocco
R, Tavani A, Lagiou P, La Vecchia C and Rossi M: Non-enzymatic
antioxidant capacity and risk of gastric cancer. Cancer Epidemiol.
39:340–345. 2015. View Article : Google Scholar : PubMed/NCBI
|
|
31
|
Belguise K, Kersual N, Galtier F and
Chalbos D: FRA-1 expression level regulates proliferation and
invasiveness of breast cancer cells. Oncogene. 24:1434–1444. 2005.
View Article : Google Scholar
|
|
32
|
Philips A, Teyssier C, Galtier F,
Rivier-Covas C, Rey JM, Rochefort H and Chalbos D: FRA-1 expression
level modulates regulation of activator protein-1 activity by
estradiol in breast cancer cells. Mol Endocrinol. 12:973–985. 1998.
View Article : Google Scholar : PubMed/NCBI
|
|
33
|
Shirsat NV and Shaikh SA: Overexpression
of the immediate early gene fra-1 inhibits proliferation, induces
apoptosis, and reduces tumourigenicity of c6 glioma cells. Exp Cell
Res. 291:91–100. 2003. View Article : Google Scholar : PubMed/NCBI
|
|
34
|
Zhang S and Qi Q: MTSS1 suppresses cell
migration and invasion by targeting CTTN in glioblastoma. J
Neurooncol. 121:425–431. 2015. View Article : Google Scholar
|
|
35
|
Folio C, Zalacain M, Zandueta C, Ormazábal
C, Sierrasesúmaga L, San Julián M, de las Rivas J, Toledo G,
Lecanda F and Patiño-García A: Cortactin (CTTN) overexpression in
osteosarcoma correlates with advanced stage and reduced survival.
Cancer Biomark. 10:35–41. 2012.PubMed/NCBI
|
|
36
|
Luo ML, Shen XM, Zhang Y, Wei F, Xu X, Cai
Y, Zhang X, Sun YT, Zhan QM, Wu M, et al: Amplification and
overexpression of CTTN (EMS1) contribute to the metastasis of
esophageal squamous cell carcinoma by promoting cell migration and
anoikis resistance. Cancer Res. 66:11690–11699. 2006. View Article : Google Scholar : PubMed/NCBI
|
|
37
|
Qiao M, Sheng S and Pardee AB: Metastasis
and AKT activation. Cell Cycle. 7:2991–2996. 2008. View Article : Google Scholar : PubMed/NCBI
|
|
38
|
Vivanco I and Sawyers CL: The
phosphatidylinositol 3-Kinase AKT pathway in human cancer. Nat Rev
Cancer. 2:489–501. 2002. View
Article : Google Scholar : PubMed/NCBI
|
|
39
|
Wagner EF and Nebreda AR: Signal
integration by JNK and p38 MAPK pathways in cancer development. Nat
Rev Cancer. 9:537–549. 2009. View Article : Google Scholar : PubMed/NCBI
|
|
40
|
Chumakov PM: Function of the p53 gene:
Choice between life and death. Biochemistry (Mosc). 65:28–40.
2000.
|
|
41
|
Chipuk JE and Green DR: Dissecting
p53-dependent apoptosis. Cell Death Differ. 13:994–1002. 2006.
View Article : Google Scholar : PubMed/NCBI
|