Introduction
The reverse phase protein array (RPPA), as a
high-throughput proteomic technique, provides quantitative
measurement for protein expression and phosphorylation. The
proteomic data-sets generated from RPPA represent abundance of
proteins under various conditions and have been used to
systematically evaluate protein alterations in signaling networks
(1,2). The application of those proteomic
datasets for expression and phosphorylation (activation status) of
core signaling proteins have provided opportunities to expand
understanding of the molecular characteristics of cancer cell lines
at the systems level in resting and perturbed conditions (3,4). In
order to efficiently integrate targeted therapeutics into clinical
practice, it is critical to understand how signaling pathways
function and how they are controlled by the intracellular and
extracellular factors present in human tumors.
Glucose provides the basic fuel for cell survival,
proliferation and function in both normal and cancer cells. An
ability to tolerate glucose deprivation, which commonly occurs in
the tumor microenvironment, contributes to cancer cell
proliferation, migration, and progression (5). Thus, over the course of the past 20
years, multiple studies have yielded useful information on the role
of energy homeostasis in cancer growth and survival (6,7).
However, a systematic analysis of proteomic changes under
conditions of glucose deprivation has not been performed across a
large set of cancer cell lines representing a broad mutational and
lineage background. Although adaptive responses to glucose
deprivation are key to the survival of cancer cells, they have not
yielded key therapeutic opportunities, partly due to diversity and
flexibility of the adaptive mechanisms used by different cancer
lineages and driven by different mutations in tumor cells.
Here, a large RPPA proteomic dataset was generated
to facilitate evaluation of effects of glucose deprivation on
cancer signaling across ~170 human cancer cell lines, derived from
15 lineage types. Both pan cell line analysis and combined
categories of cancer lineage and mutational genotypes were used to
identify associations with glucose-dependent regulation of protein
expression and phosphorylation. This proteomic dataset and its
analysis will provide an important tool to assist the
implementation of approaches to target adaptive responses to
glucose deprivation.
Materials and methods
Data acquisition
RPPA datasets for ~170 cancer cell lines in normal
glucose and low glucose condition were generated in the Functional
Proteomics Core of the M.D. Anderson Cancer Center, University of
Texas. Cells were grown in RPMI-1640 medium with 10% fetal bovine
serum (FBS) and penicillin/streptavidin (all from Gibco, Grand
Island, NY, USA), and maintained at 37°C in a humidified atmosphere
at 5% CO2. Before protein harvest, cell lines were
starved for the indicated time in medium with 5% FBS, 0.63 g/l
glucose plus 2 mM glutamine without Na pyruvate (low glucose) and
cultured in medium with 10% FBS, 2 g/l glucose plus 4 mM glutamine
and 1 mM Na pyruvate (normal glucose). RPPA assay was done as
previously described (8). The two
RPPA datasets were independently normalized and mean-centered.
Cell line culture and siRNA
transfection
NCI-60 lung cancer cell lines (NCI-H460, A549 and
EKVX) were obtained from National Cancer Institute (NCI DTP), USA.
For siRNA transfection, 2×10⁵ cells/well were plated in
a 6-well plate. After adhering for 24 h, target siRNA (Thermo
Fisher Scientific, Inc., Logan, UT, USA) were added in transfection
medium (Santa Cruz Biotechnology, Inc., Santa Cruz, CA, USA) for 6
h at 37°C in a CO2 incubator. After transfection, cells
were supplemented with RPMI-1640 containing FBS and cultured at
37°C/5% CO2 for another 24 h. Then cells were starved
for 12 h under glucose deprived and replete conditions as described
above. Protein supernatants were isolated using cell lysis buffer
(#9803; Cell Signaling Technology, Inc., Beverly, MA, USA) with
added PMSF.
Western blot analysis
The total protein content (40 μg) from cell lysates
was separated using SDS-PAGE (10%) and transferred to a 0.45-l M
nitrocellulose membrane (Millipore) for 2 h. The membranes were
washed with TBST containing 5% (w/v) BSA. The membranes were
incubated overnight with specific PTEN and AKT_pS473 antibodies
(Cell Signaling Technology, Inc.) and were exposed to secondary
antibodies coupled to horseradish peroxidase for 2 h at room
temperature. The membranes were then washed three times with TBST
at room temperature. Antibody binding was detected using an
enhanced chemiluminescent substrate from Thermo Fisher Scientific,
Inc. (Logan, UT, USA) and analyzed with an LAS 3000 Luminescent
Image Analyzer from Fujifilm (Tokyo, Japan). Equal protein loading
was assessed by the level of α-actin protein (Cell Signaling
Technology, Inc.).
Statistical analysis
Network construction was done using Cytoscape 2.6.3
(9) (www.cytoscape.org). Hierarchical cluster analysis was
done using QCanvas (10)
(http://compbio.sookmyung.ac.kr/~qcanvas/). The
correlation for each pair of proteins was calculated by Pearson's
correlation coefficients (PCCs) and its statistical significance
(P-value). To compare protein levels of different genotypes and/or
lineages, fold-change and Student's t-test P-value were calculated.
The log2 fold-change of a protein is given by the
difference between average of cell lines for each category and
median value of total cell lines. To determine statistical
significance, P-value from t-statistic was calculated. The
different datasets were generated for cell lines by directly
subtracting the logarithmic value in low condition from the
logarithmic value of normal condition.
Results and Discussion
The RPPA dataset consisted of 77 antibodies against
total protein and 38 antibodies against specific phosphorylation
site. These proteins (89 unique protein symbols) were mainly
included in 15 key pathways associated with cancer cell function in
the KEGG database (Table I). These
pathways were grouped into 4 functional categories, cancer related
pathways (pathway in cancer and mTOR signaling pathway), glucose
metabolism pathways (insulin signaling pathway and type II diabetes
mellitus), growth and survival regulating pathways (focal adhesion,
cell cycle, apoptosis, adherens junction and gap junction) and cell
signaling events (ErbB, mTOR, VEGF, p53, Wnt and JAK-STAT signaling
pathways). This pathway-oriented classification of RPPA proteins
enabled us to explore the critical signaling networks associated
with glucose starvation in cancers.
 | Table IFunctional categories of proteins
screened in the present RPPPA experiment. For a total of 89
proteins, 77 total protein antibodies and 38 phospho-antibodies
were used in the screening. Top 15 KEGG pathways are displayed
based on the number of included proteins. Thirteen proteins
screened in the RPPA analysis were not found in these 15
categories. |
Table I
Functional categories of proteins
screened in the present RPPPA experiment. For a total of 89
proteins, 77 total protein antibodies and 38 phospho-antibodies
were used in the screening. Top 15 KEGG pathways are displayed
based on the number of included proteins. Thirteen proteins
screened in the RPPA analysis were not found in these 15
categories.
| Pathway (total) | Count | % | Protein symbol |
|---|
| Pathways in cancer
(328) | 34 | 10.4 | AKT, AR, β.Catenin,
BCl2, c.JUN, c.KIT, c.Myc, Caspase.3, COX2, cRAF, Cyclin.D1,
Cyclin.E1, E.Cadherin, EGFR, ERK2, FAK, Fibronectin,
GSK3A_B,HER2,JNK2,MAPK, MEK1, mTOR, p21, p53, PI3K, PKCa, PTCH,
PTEN, Rb, SMAD3, STAT3, STAT5, XIAP |
| ErbB signaling
pathway (87) | 20 | 23.0 | 4EBP1, AKT, c.JUN,
c.Myc, cRAF, EGFR, ERK2, FAK, GSK3A_B, HER2, JNK2, MAPK, MEK1,
mTOR, p21, p70S6K, PI3K, PKCa, SRC, STAT5 |
| Focal adhesion
(201) | 23 | 11.4 | AKT, β.Catenin, BCl2,
c.JUN, Collagen.VI, cRAF, Cyclin.D1, EGFR, ERK2, FAK, Fibronectin,
GSK3A_B, HER2, JNK2, MAPK, MEK1, PI3K, PKCa, PTEN, SRC,
VASP,VEGFR2, XIAP |
| mTOR signaling
pathway (52) | 13 | 25.0 | 4EBP1, AKT, AMPK,
elF4E, ERK2, LKB1, MAPK, mTOR, p70S6K, p90RSK, PI3K, S6, TSC2 |
| Insulin signaling
pathway (135) | 17 | 12.6 | 4EBP1, ACC, AKT,
AMPK, cRAF, elF4E, ERK2, GSK3A_B, IRS.1, JNK2, MAPK, MEK1, mTOR,
p70S6K, PI3K, S6, TSC2 |
| VEGF signaling
pathway (75) | 13 | 17.3 | AKT, COX2, cRAF,
ERK2, FAK, HSP27, MAPK, MEK1, p38, PI3K, PKCa, SRC, VEGFR2 |
| Cell cycle (125) | 12 | 9.6 | 14-3-3-Beta,
14-3-3-Zeta, c.Myc, Cyclin.B1, Cyclin.D1, Cyclin.E1, GSK3A_B, p21,
p53, PCNA, Rb, SMAD3 |
| MAPK signaling
pathway (267) | 17 | 6.4 | AKT, c.JUN, c.Myc,
Caspase.3, cRAF, EGFR, ERK2, HSP27, JNK2, MAPK, MEK1, p38, p53,
p90RSK, PKCa, Stathamin, TAU |
| p53 signaling pathway
(68) | 9 | 13.2 | Caspase.3, Cyclin.B1,
Cyclin.D1, Cyclin.E1, p21, PTEN, PAI1, TSC2, p53 |
| Apoptosis (87) | 8 | 9.2 | BCl2, XIAP,
Caspase.3, Caspase.7, PI3K, p85_PI3K, p53, AKT |
| Type II diabetes
mellitus (47) | 6 | 12.8 | IRS.1, mTOR, MAPK,
JNK2, PI3K, ERK2 |
| Adherens junction
(77) | 7 | 9.1 | β.Catenin,
E.Cadherin, EGFR, HER2, MAPK, SMAD3, SRC |
| Wnt signaling pathway
(151) | 9 | 6.0 | β.Catenin, c.JUN,
c.Myc, Cyclin.D1, GSK3A_B, JNK2, p53, PKCa, SMAD3 |
| JAK-STAT signaling
pathway (155) | 8 | 5.2 | AKT, c.Myc,
Cyclin.D1, p85_PI3K, PI3K, STAT3, STAT5, STAT6 |
| Gap junction
(89) | 7 | 7.9 | EGFR, MAPK, MEK1,
PKCa, cRAF, SRC, ERK2 |
| etc. | 13 | | BIM, GATA3, MGMT,
YAP, N.Cadherin, ER, IGFBP1, P27, AIB, PAX2, PARP1, TAZ,
Telomerase |
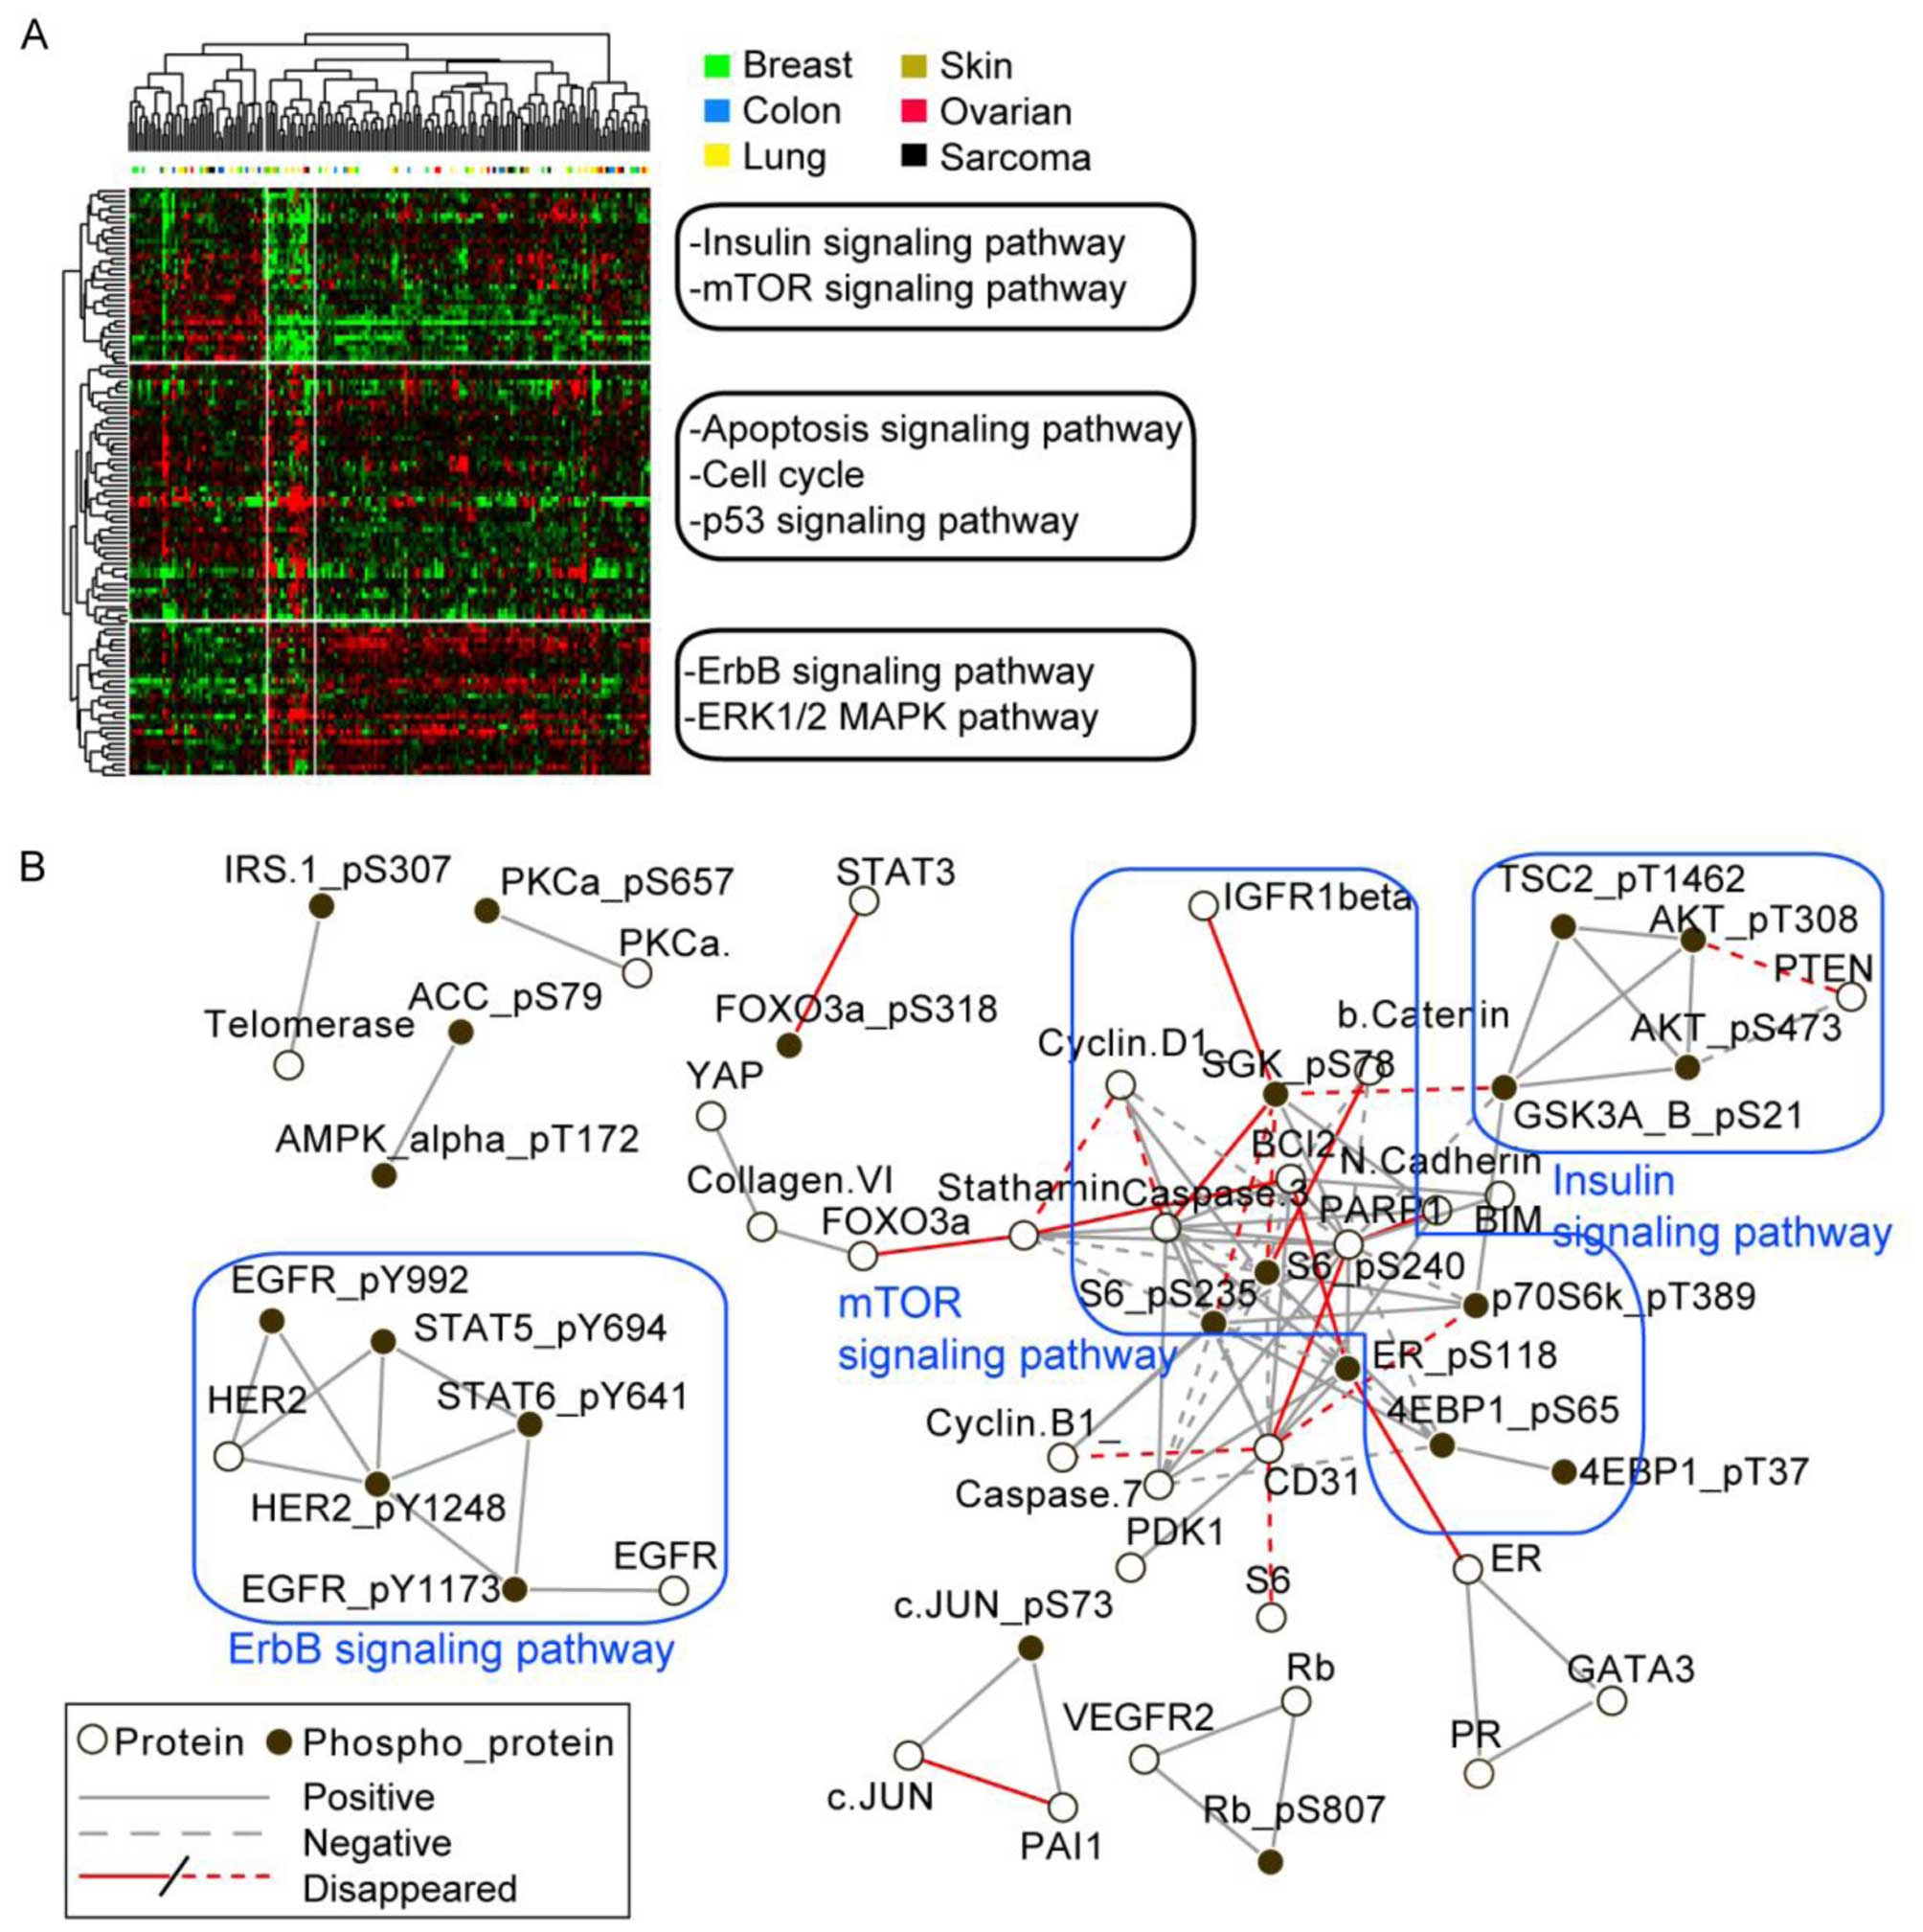
From the unsupervised hierarchical clustering of the
differential total and phosphoprotein levels between low and normal
glucose condition, we observed that proteins generally exhibited
varied response to glucose starvation across all the cancer cell
lines (Fig. 1A). Although proteins
in a pathway tended to vary in parallel across the lines, in
general cell lines in a single lineage demonstrate different
patterns of protein response to glucose starvation and did not
cluster together (Fig. 1A). To
provide further insight into the effects of glucose deprivations
across the cell lines, PCCs and corresponding P-value were
calculated for each protein pair across all the cell lines. The
network structure was generated using protein pairs with PCC>0.5
and P<0.01 for normal glucose condition (Fig. 1B). However, many of pair-wise
correlations in the mTOR pathway were no longer apparent after
glucose starvation, implying that mTOR signaling was differentially
regulated across cell lines by glucose deprivation (Fig. 1B). In contrast, relationships in
the insulin and ErbB pathways, with the exception of the
relationship between AKT and PTEN were conserved under glucose
deprivation.
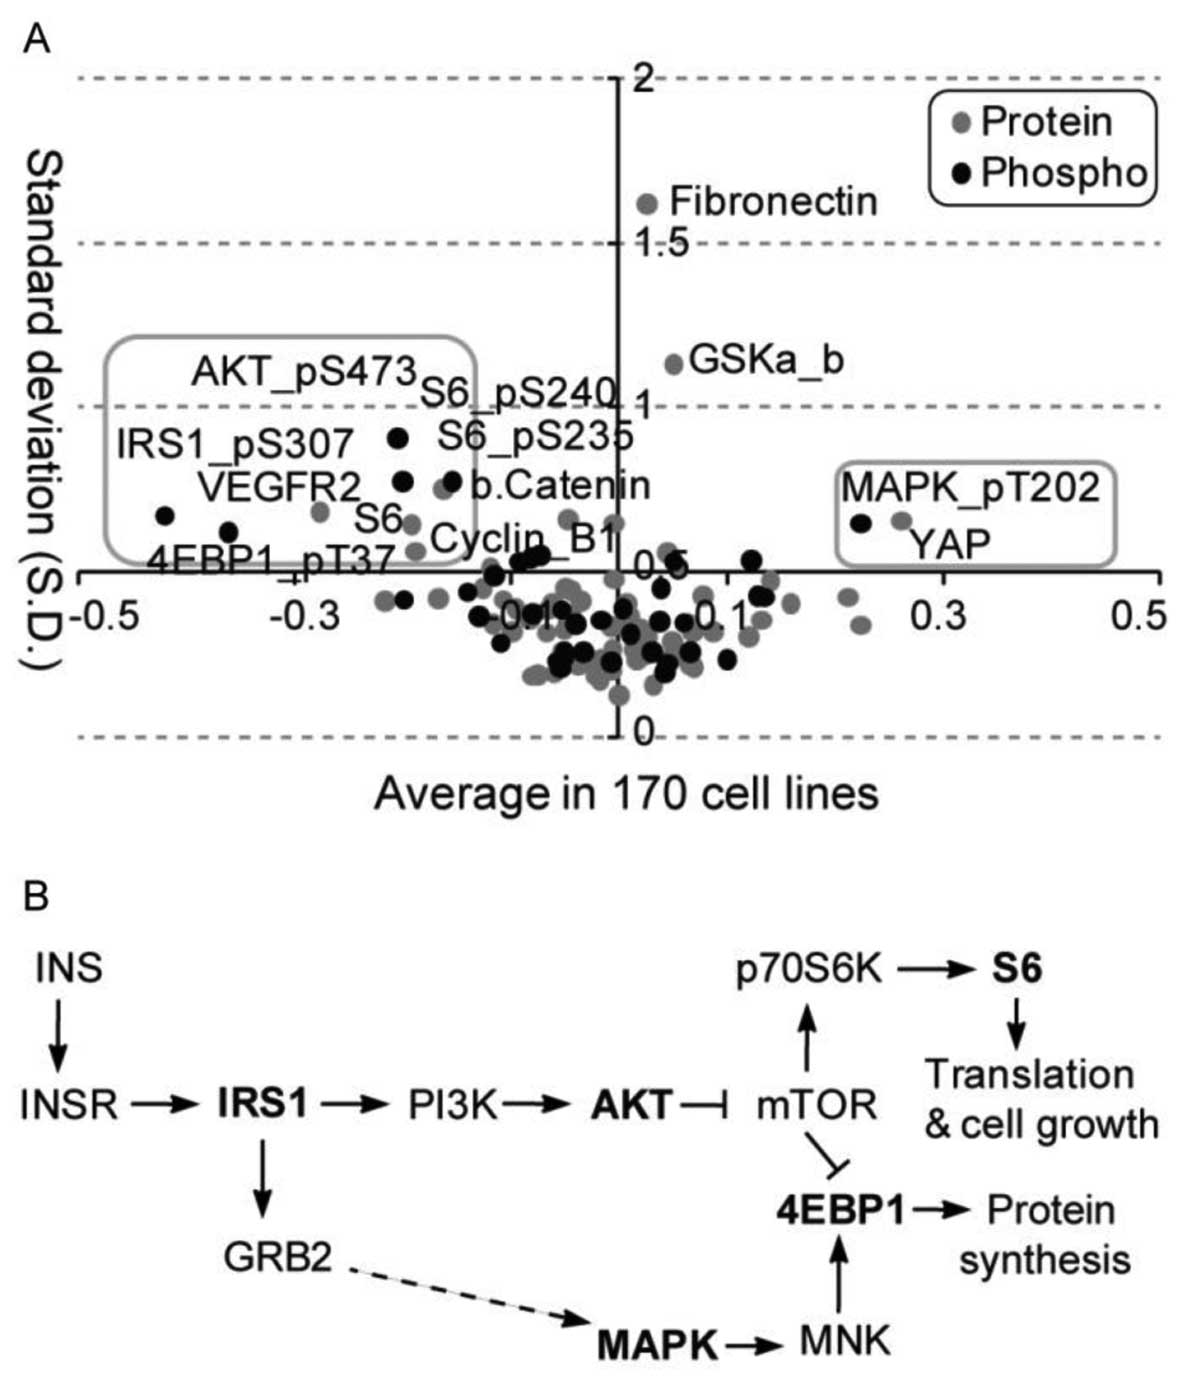
A global analysis of average alteration and
corresponding variation of total and phosphoprotein levels after
glucose deprivation identified diverse regulation patterns across
cell lines (Fig. 2A). A total of
11 protein probes (i.e., antibodies) including 9 downregulated
(AKT_pS473, S6_pS240, S6_pS235, S6, IRS1_pS307, 4EBP1_pT37,
β.Catenin, VEGFR2 and Cyclin D1) and two upregulated (MAPK_pT202
and YAP), presented relatively large changes and variation in total
or phosphoprotein levels across all cell lines after glucose
deprivation. Among them, 5 unique protein symbols for 7 antibodies
were mainly enriched in the mTOR signaling pathway (Fig. 2B). The mTOR pathway has already
been implicated in maintaining glucose homeostasis and
carbohydrate, lipid and protein metabolism (11). Our analysis demonstrates a
selective role for components of the mTOR pathway in the adaptive
response of a cell line to glucose deprivation.
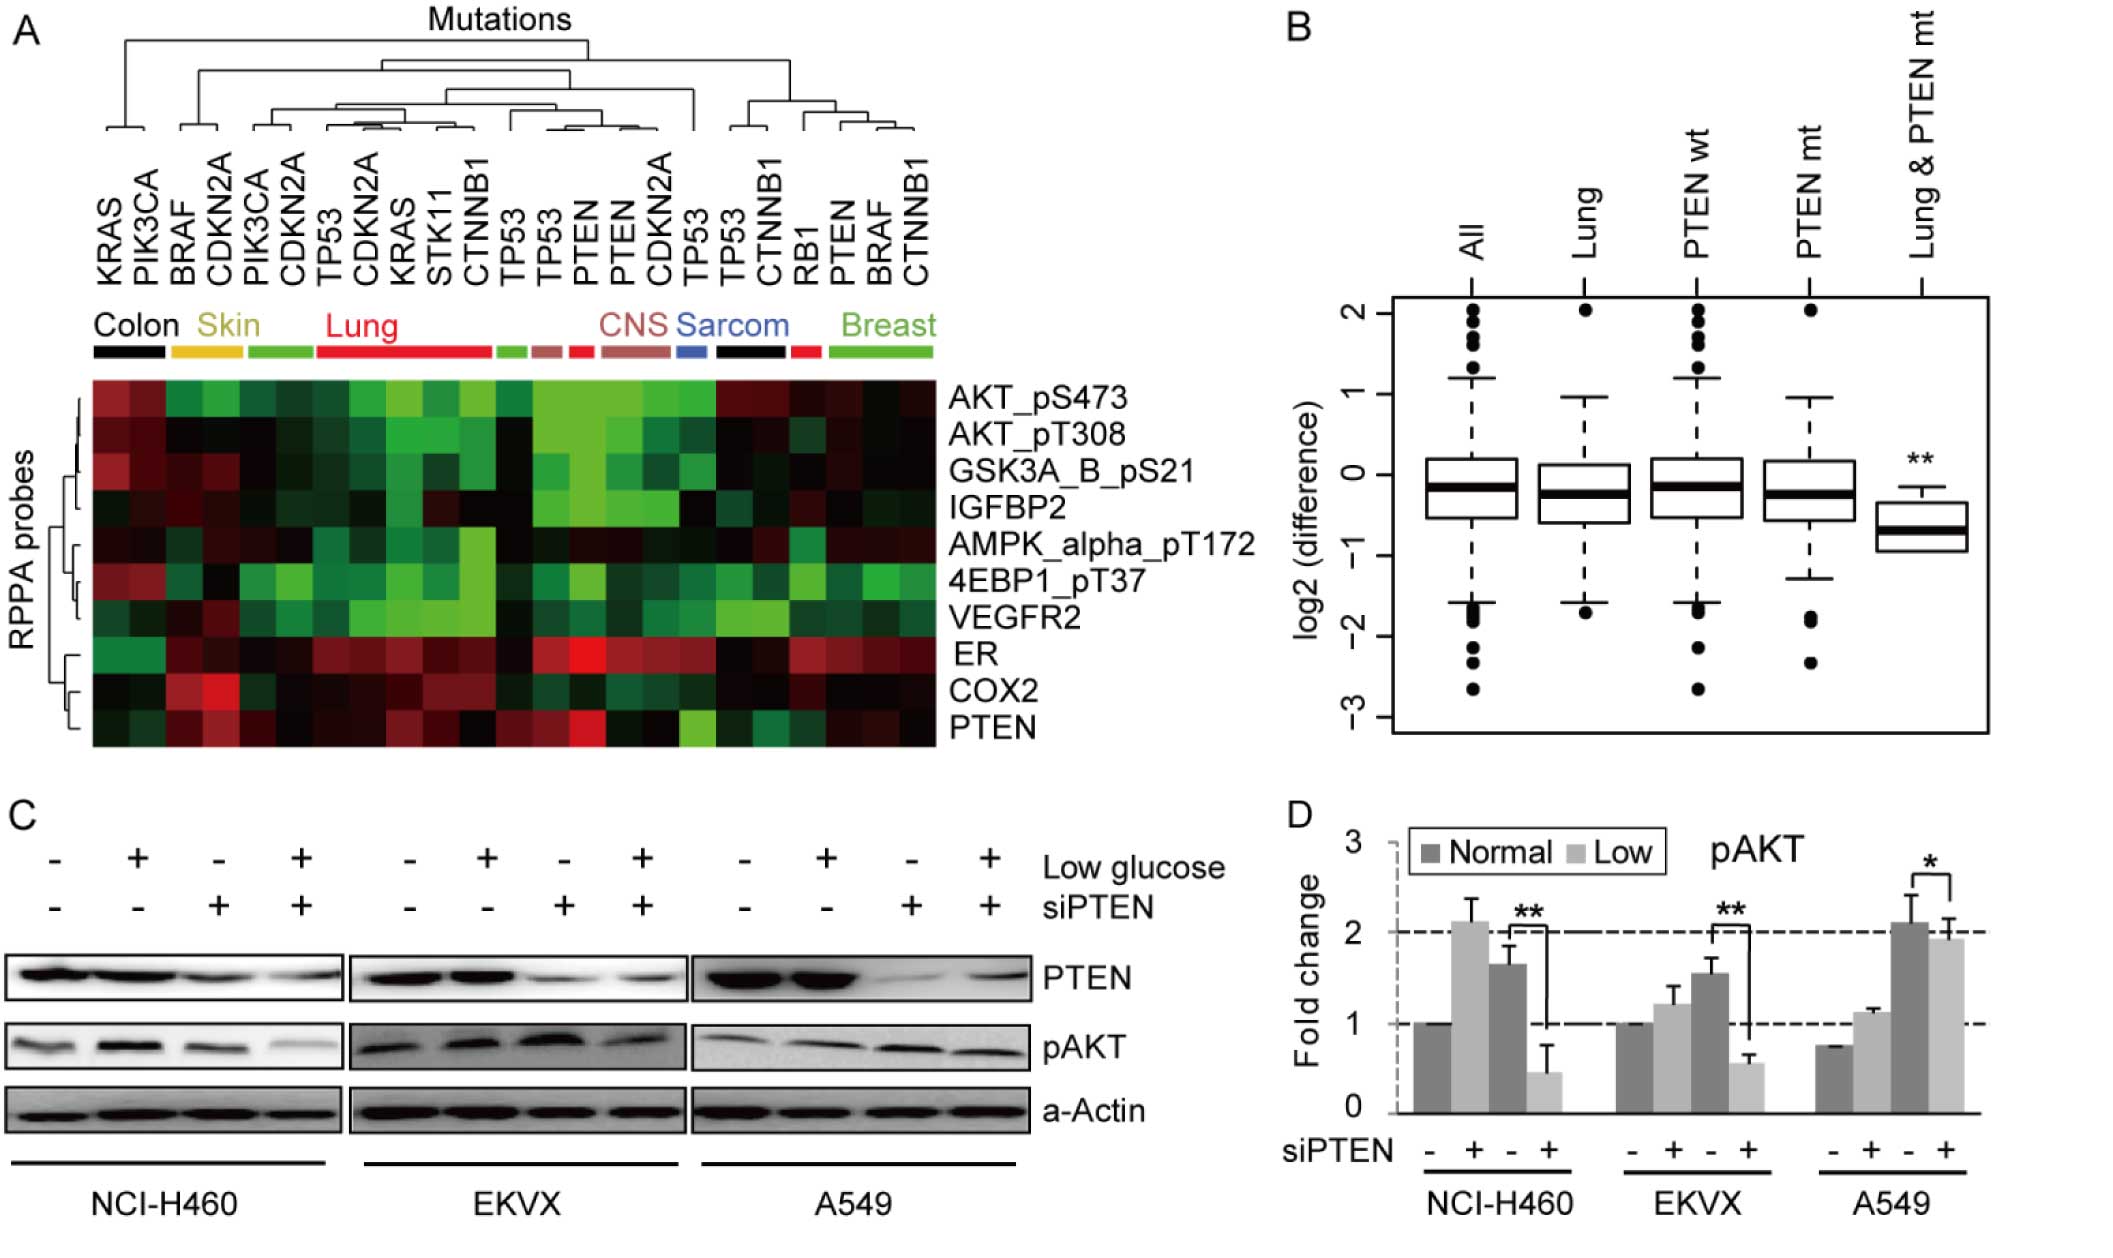
To analyze the association between common cancer
mutations and adaptive responses to glucose deprivation,
differential RPPA data (fold-change) between normal and low glucose
conditions were collapsed into lineage and mutation classes
(Fig. 3A). A total of 10 protein
probes detected significant alterations (P<0.01) specific to
glucose starvation among 23 combined categories of lineage and
mutation. AKT phosphorylation (S473 and T308) were selectively
downregulated in PTEN mutant cell lines by glucose deprivation. The
phosphorylation of GSK3A&B (S21) and expression of IGFBP2 were
also down regulated in a similar pattern with AKT. AMPK-α
phosphorylation (T173) showed a distinct downregulation in lung
cancer cell lines particularly with those with CTNNB1 mutations.
4E-BP1 phosphorylation (T37) and VEGFR2 expression showed a similar
pattern in lung cancer cell lines. ER expression was uniquely
upregulated in the PTEN mutated lung cancer cells. Increased
expression of COX2 was observed in CDKN2A-mutated melanoma cell
lines. PTEN expression was increased in PTEN mutant but decreased
in P53-mutant cell lines by glucose starvation. In terms of
combinations of mutations and lineage, the most striking
observation was that AKT phosphorylation (S473) was significantly
decreased in lung cancer cell lines with PTEN mutation (Fig. 3B). The importance of AKT in glucose
metabolism has been indicated in previous studies, however, the
effects of glucose deprivation have been disparate across cell
lines. Glucose deprivation inhibited AKT phosphorylation of S473
site in an ovarian cancer cell line (12) and leukemic T cells (13), while transient glucose deprivation
activated AKT at both T308 and S473 in HeLa cells (14). To confirm that glucose deprivation
downregulates AKT phosphorylation (S473) in lung cancer cells
lacking functional PTEN, the effect of knockdown of PTEN on AKT
phosphorylation levels was assessed in three PTEN wild-type lung
cancer cell lines (NCI-H460, EKVX, and A549) (Fig. 3C and D). Levels of AKT (S473)
phosphorylation were increased after glucose starvation, when PTEN
was present. Furthermore, as expected AKT phosphorylation was
increased by a functional loss of PTEN under normal glucose
conditions. We confirmed that AKT phosphorylation (S473) was
significantly downregulated by PTEN knockdown under glucose
deprivation conditions in the three lung cancer cell lines, albeit
to a lesser degree in A549 cells. This unexpected observation
suggests that the effects of PTEN on AKT phosphorylation are
context-dependent with PTEN limiting AKT activation under glucose
replete conditions, but increasing AKT activation by an unknown
mechanism under glucose deprived conditions.
Cancer cells typically exhibit high demands for
glucose to provide the energy necessary for cell growth (15,16).
Multiple signaling pathways contributed to the regulation of
glucose metabolism and balance of cellular energy under diverse
contexts. However, in most studies AKT proto-oncogene has been
implicated in increased glucose transportation and aerobic
glycolysis in cancer cells (17,18).
In this study, we analyzed adaptive responses to glucose
deprivation across tumor lineage and mutational genotypes. Combined
categorization of a large cell line panel by lineage and mutation
criteria has been successfully used to find new molecular
signatures from different omics datasets (19,20).
Protein expression and phosphorylation are dependent
on the cell origin, genomic changes, and environment factors.
Measurement of total and phosphoprotein levels in this large cell
line set provided the opportunity to elucidate comprehensive
interactions among functional signaling pathways. Importantly, the
data set generated in this study, which will be made available in
The Cancer Proteome Atlas (TCPAportal. org), will provide a useful
community resource to explore adaptive responses to glucose stress
under many different cancer relevant contexts.
Acknowledgements
The present study was supported by the Sookmyung
Women's University Research grant no. 1-1203-0226.
References
|
1
|
Tibes R, Qiu Y, Lu Y, Hennessy B, Andreeff
M, Mills GB and Kornblau SM: Reverse phase protein array:
validation of a novel proteomic technology and utility for analysis
of primary leukemia specimens and hematopoietic stem cells. Mol
Cancer Ther. 5:2512–2521. 2006. View Article : Google Scholar : PubMed/NCBI
|
|
2
|
Gujral TS, Karp RL, Finski A, Chan M,
Schwartz PE, MacBeath G and Sorger P: Profiling phospho-signaling
networks in breast cancer using reverse-phase protein arrays.
Oncogene. 32:3470–3476. 2013. View Article : Google Scholar :
|
|
3
|
Nishizuka S, Charboneau L, Young L, Major
S, Reinhold WC, Waltham M, Kouros-Mehr H, Bussey KJ, Lee JK, Espina
V, et al: Proteomic profiling of the NCI-60 cancer cell lines using
new high-density reverse-phase lysate microarrays. Proc Natl Acad
Sci USA. 100:14229–14234. 2003. View Article : Google Scholar : PubMed/NCBI
|
|
4
|
Boyd ZS, Wu QJ, O'Brien C, Spoerke J,
Savage H, Fielder PJ, Amler L, Yan Y and Lackner MR: Proteomic
analysis of breast cancer molecular subtypes and biomarkers of
response to targeted kinase inhibitors using reverse-phase protein
microarrays. Mol Cancer Ther. 7:3695–3706. 2008. View Article : Google Scholar : PubMed/NCBI
|
|
5
|
He L, Li X, Luo HS, Rong H and Cai J:
Possible mechanism for the regulation of glucose on proliferation,
inhibition and apoptosis of colon cancer cells induced by sodium
butyrate. World J Gastroenterol. 13:4015–4018. 2007. View Article : Google Scholar : PubMed/NCBI
|
|
6
|
Elf SE and Chen J: Targeting glucose
metabolism in patients with cancer. Cancer. 120:774–780. 2014.
View Article : Google Scholar : PubMed/NCBI
|
|
7
|
Lee AS: Glucose-regulated proteins in
cancer: molecular mechanisms and therapeutic potential. Nat Rev
Cancer. 14:263–276. 2014. View
Article : Google Scholar : PubMed/NCBI
|
|
8
|
Park ES, Rabinovsky R, Carey M, Hennessy
BT, Agarwal R, Liu W, Ju Z, Deng W, Lu Y, Woo HG, et al:
Integrative analysis of proteomic signatures, mutations, and drug
responsiveness in the NCI 60 cancer cell line set. Mol Cancer Ther.
9:257–267. 2010. View Article : Google Scholar : PubMed/NCBI
|
|
9
|
Xu H, Baroukh C, Dannenfelser R, Chen EY,
Tan CM, Kou Y, Kim YE, Lemischka IR and Ma'ayan A: ESCAPE: database
for integrating high-content published data collected from human
and mouse embryonic stem cells. Database (Oxford).
2013.bat0452013.
|
|
10
|
Kim N, Park H, He N, Lee HY and Yoon S:
QCanvas: an advanced tool for data clustering and visualization of
genomics data. Genomics Inform. 10:263–265. 2012. View Article : Google Scholar
|
|
11
|
Saltiel AR and Kahn CR: Insulin signalling
and the regulation of glucose and lipid metabolism. Nature.
414:799–806. 2001. View
Article : Google Scholar : PubMed/NCBI
|
|
12
|
Priebe A, Tan L, Wahl H, Kueck A, He G,
Kwok R, Opipari A and Liu JR: Glucose deprivation activates AMPK
and induces cell death through modulation of Akt in ovarian cancer
cells. Gynecol Oncol. 122:389–395. 2011. View Article : Google Scholar : PubMed/NCBI
|
|
13
|
Coloff JL, Mason EF, Altman BJ, Gerriets
VA, Liu T, Nichols AN, Zhao Y, Wofford JA, Jacobs SR, Ilkayeva O,
et al: Akt requires glucose metabolism to suppress puma expression
and prevent apoptosis of leukemic T cells. J Biol Chem.
286:5921–5933. 2011. View Article : Google Scholar :
|
|
14
|
Gao M, Liang J, Lu Y, Guo H, German P, Bai
S, Jonasch E, Yang X, Mills GB and Ding Z: Site-specific activation
of AKT protects cells from death induced by glucose deprivation.
Oncogene. 33:745–755. 2014. View Article : Google Scholar
|
|
15
|
Taubes G: Cancer research. Ravenous for
glucose. Science. 335:312012. View Article : Google Scholar : PubMed/NCBI
|
|
16
|
Adekola K, Rosen ST and Shanmugam M:
Glucose transporters in cancer metabolism. Curr Opin Oncol.
24:650–654. 2012. View Article : Google Scholar : PubMed/NCBI
|
|
17
|
Gatenby RA and Gillies RJ: Why do cancers
have high aerobic glycolysis? Nat Rev Cancer. 4:891–899. 2004.
View Article : Google Scholar : PubMed/NCBI
|
|
18
|
Neary CL and Pastorino JG: Akt inhibition
promotes hexokinase 2 redistribution and glucose uptake in cancer
cells. J Cell Physiol. 228:1943–1948. 2013. View Article : Google Scholar : PubMed/NCBI
|
|
19
|
Kim N, He N, Kim C, Zhang F, Lu Y, Yu Q,
Stemke-Hale K, Greshock J, Wooster R, Yoon S, et al: Systematic
analysis of genotype-specific drug responses in cancer. Int J
Cancer. 131:2456–2464. 2012. View Article : Google Scholar : PubMed/NCBI
|
|
20
|
He N, Kim N, Song M, Park C, Kim S, Park
EY, Yim HY, Kim K, Park JH, Kim KI, et al: Integrated analysis of
transcriptomes of cancer cell lines and patient samples reveals
STK11/LKB1-driven regulation of cAMP phosphodiesterase-4D. Mol
Cancer Ther. 13:2463–2473. 2014. View Article : Google Scholar : PubMed/NCBI
|