Introduction
Glioblastoma (GBM; WHO defined grade IV astrocytoma)
is the most prevalent and uniformly lethal primary brain tumor
(1). Conventional treatment
modalities including maximum surgical resection, radiotherapy and
chemotherapy extend median survival time of approximately 14 months
after diagnosis (1). Subsequent
use of temozolomide (TMZ or Temodar) offers GBM patients additional
survival time with an acceptable quality of life. In recent years,
efforts have been made to use more targeted or immune-therapies.
Despite all of these attempts, GBM remains an incurable disease.
Genetic and molecular dichotomy, along with specific clinical
course of disease and age of onset of disease, defines GBM into two
broad categories, primary GBM, which develops de novo or
secondary GBM, which progresses from a low-grade or anaplastic
astrocytoma (2). Recent
investigations have stratified GBMs into 4 subclasses, namely
classical, proneural, and mesenchymal based on the levels of
expression and activity of core proteins of signal transduction
pathways such as epidermal growth factor receptor (EGFR), PDGF, and
NF1, respectively, and neural (2).
Furthermore, these genetic classifications are shown
to be better prognostic indicators of disease than defined
histological criteria. Detailed genetic analyses have defined three
signaling pathways, namely RTK/RAS/PI3K, P53 and RB, as critical
for the development of GBM. Mutations of the tumor suppressor,
PTEN, which occur at an estimated frequency of 70–90%, are involved
in gliomagenesis by modulating the function of its associated
downstream proteins (3–6). The tumor suppressive function of PTEN
is shown to be impaired after subtle expression downregulation,
even in the presence of a wild-type gene copy, a process recognized
as functionally haploinsufficient (7), which contributes to tumor formation
(8). Biochemically, PTEN
dephosphorylates the lipid second messenger phosphatidylinositol
3,4,5-trisphosphate to generate phosphatidylinositol
3,4-bisphosphate, which functions antagonistically to the PI3K.
Consequently, the PTEN tumor suppressor is a central negative
regulator of the PI3K/PDK1/AKT signaling axis that controls
multiple cellular functions including cell growth, survival,
proliferation, and angio genesis (9), and loss of PTEN leads to a
constitutive activation of oncogenic pathways. In addition, a lack
of PTEN expression leads to an increase in the pool of
self-renewing neural stem cells and induces loss of homeostatic
control of proliferation, thereby indicating cell cycle
dysregulation during gliomagenesis (10). Moreover, in the absence of PTEN,
there is an upregulation of the phosphoinositide 3-kinase
(PI3K)/AKT pathway involved in regulation of cellular processes
such as transcription, translation, cell cycle progression and
apoptosis (4,11). AKT (protein kinase B), a
serine/threonine protein kinase, regulates cell growth and survival
by activating multiple downstream targets, including GSK-3B, p21,
p27 and NF-κB and activation of AKT plays a crucial role in
gliomagenesis as shown in animal models (11,12).
Mechanistic target of rapamycin (mTOR) functions
through the canonical PI3K/AKT pathway, which is deregulated in
many cancers including GBM (13–15).
mTOR is a serine-threonine kinase which functions via two
multi-protein complexes, namely mTORC1 and mTORC2, each
characterized by different binding partners and confer distinct
functions. mTORC1 integrates signals from growth factor receptors
with cellular nutritional status, and regulates the level of
cap-dependent mRNA translation by altering the activity of key
translational components such as the cap-binding protein and
oncogene eIF4E (16). The mTORC1
complex is composed of proteins such as regulatory associated
protein of mTOR (RAPTOR), which is sensitive to rapamycin
treatment. It has been shown that mTORC1 function is tightly
regulated by PI3K/AKT.
In contrast to mTORC1, the mTORC2 complex is
sensitive to growth factors but not nutrients, and is associated
with the rapamycin-insensitive companion of mTOR (RICTOR) along
with other proteins (15). The
major distinguishing characteristic of the mTORC1 and mTORC2 is
their differential sensitivity to rapamycin (17–20).
mTORC1 regulates protein synthesis through phosphorylating its
downstream substrates, 4EBP1 (also called EIF4EBP1) and p70 S6K1/2
(21,22). The mTOR-dependent phosphorylation
of p70 S6K1/2 promotes translation initiation as well as elongation
and regulates cellular growth (23). mTORC2 modulates growth factor
signaling by phosphorylating the C-terminal hydrophobic motif of
some AGC kinases, such as AKT and SGK (24,25).
Activated mTORC2 activation leads to phosphorylation of
AKTSer473 (26).
Pharmacological inhibition of these complexes has been difficult to
achieve. A phase I trial of rapamycin in PTEN-deficient GBM
patients showed some promising results, although faced some
inherent difficulties of targeting mTOR pathway, as a significant
number of patients showed increased activated levels of
pAKTSer473 following rapamycin treatment, which was
correlated with shorter time to progression (27). The observed AKT activation was
likely due to an alteration of signaling feedback loops, again
highlighting the complexity of prolonged rapamycin treatment
(28).
Growth factor stimulation of PI3K causes activation
of AKT by the phosphorylation of two key amino acid residues,
namely the activation loop at T308 and the C-terminal hydrophobic
motif at S473. Activated AKT promotes cell survival, proliferation
and suppresses apoptosis. The disruption of mTORC2 by different
genetic and pharmacological approaches has variable effects on AKT
phosphorylation. For example, targeting mTORC2 by RNA interference
(RNAi), homologous recombination, or long-term rapamycin treatment
results in loss of AKT hydrophobic motif phosphorylation
(S473), strongly implicating mTORC2 as the kinase
responsible for phosphorylation of this site (29–32).
Rapamycin (sirolimus) and its analogs, such as
RAD001 (everolimus) and CCI-779 (temsirolimus), suppress mTOR
activity through an allosteric mechanism that acts at a distance
from the ATP-binding catalytic site. Major disadvantages of
rapamycin, and other related compounds, are that it suppresses
TORC1 mediated S6K activation, thereby blocking a negative feedback
loop, leading to activation of PI3K/AKT and Ras/MEK/ERK signaling
pathways thus promoting cell survival and growth. In recent years,
novel small ATP binding site molecules have been identified that
directly inhibit mTOR, unlike rapamycin, which is an allosteric
inhibitor of mTOR. In addition, novel ATP-competitive binding
compounds with pyrazolopyrimidines are shown to inhibit members of
the PI3K family, including mTOR. One such compound, PP242, is an
ATP-competitive inhibitor of mTOR, which shows potent and selective
inhibition of mTORC1 and mTORC2 (33). These molecules are often termed
‘TORKinibs’ for their ability to inhibit TOR kinase. In this study,
we compared PP242 with rapamycin and demonstrate that PP242
effectively inhibits mTORC1 and mTORC2 and suppresses GBM cell
proliferation and migration.
Materials and methods
Cell lines
The GBM cell line LN-18 (ATCC, Manassas, VA, USA)
was used to investigate the effect of combined mTORC1/2 inhibitor
to assess its effectiveness as compared to the mTORC1 inhibitor
rapamycin. LN-18 cell line has an underlying p53 mutation at codon
238 where TGT (Cys) --> TCT (Ser) and wild-type PTEN.
Cell culture
Cells were maintained in DMEM (Invitrogen, Carlsbad,
CA, USA) supplemented with 10% FBS and 1%
penicillin/streptomycin/amphotericin in a humidified 5%
CO2 incubator at 37°C. Cells were made quiescent by
serum deprivation 24 h prior to treatment with various combinations
of rapamycin (RAPA, mTOR inhibitor, 100 nM) (EMD Chemicals,
Billerica, MA, USA), Phorbol 12-myristate 13-acetate, PMA, TPA (10
nM) (Sigma-Aldrich, St. Louis, MO, USA), PP242 (1 or 2.2 μM) (EMD
Chemicals), Insulin (10 μM) (Sigma-Aldrich), fibronectin (FN,
extra-cellular matrix, 20 ng/ml) (Sigma-Aldrich).
Isolation of protein
Quiescent cells were subjected to following
treatments: PP242 (1.1 or 2.2 μM) or rapamycin (100 nM) for 24 h,
or Insulin (10 μM) or TPA (10 nM) for 30 min. In addition, cells
were pretreated with rapamycin or PP242 (24 h) followed by
treatment with insulin or TPA for 30 min. Vehicle treated cells
were considered as controls. Protein extraction was done using
whole cell lysis buffer containing 1% Triton X-100, 10 mM Tris-HCl,
pH 7.5, 150 mM NaCl, 5 mM EDTA with phosphatase and protease
inhibitors (Sigma-Aldrich). Protein concentrations were determined
by the modified Lowry Method (Bio-Rad Laboratory, Hercules, CA,
USA).
Western blot analysis
An equal amount of protein (50 μg) was resolved on a
10% SDS-PAGE gel and then electrotransferred onto nitrocellulose
membrane. Membranes were processed according to the manufacturers'
instructions (Santa Cruz Biotechnology, Santa Cruz, CA, USA; Cell
Signaling Technology, Danvers, MA, USA) using primary antibodies
for phosphorylated and total AKT, ERK, p70 S6K and GAPDH bands were
detected by chemiluminescence (Cell Signaling Technology). Blots
were stripped with reagent (EMD Chemicals) and re-probed with actin
or respective total antibodies to ensure equal loading. All
reported bands were analyzed using ImageJ (NIH, Bethesda, MD, USA)
and plotted against total protein values. Experiments were
conducted at least 3 times.
Chemotactic migration
Directional migration was performed using a 48-well
modified Boyden chamber kit (NeuroProbe, Gaithersburg, MD, USA).
Quiescent cells were treated with rapamycin (10 nM) or PP242 (2.2
μM) for 24 h. Vehicle treated cells served as controls. Cells were
aliquoted (3,000 cells/μl) in either serum free media or their
respective treated media. Fibronectin (20 ng/ml) (Sigma-Aldrich)
was used as a chemoattractant and cells were allowed to migrate for
4 h through a PVC membrane (8 μm pore). The membrane was fixed in
70% ethanol, scraped along the non-migrated cell surface, and
stained with DiffQuick (IMEB, San Marcos, CA, USA). Migrated cells
were imaged at 2.5X (Axiovert 100 M) and analyzed as a percentage
of total microscopic field occupied by migrated cells using ImageJ
(NIH).
Cell viability
Cell viability was measured by MTT assay according
to the manufacturer's protocol (Chemicon, Billerica, MA, USA).
Cells (approximately 3,000/well) were seeded onto a 96-well plate
and made quiescent for 24 h prior to treatment. Rapamycin (100 nM)
or PP242 (1 or 2.2 μM) was given to cells in serum-free media for
24 h. After completion of treatment, fresh media (90 μl) with MTT
(10 μl) reagent/well was added and plates were incubated at 37°C
for 4 h. The reaction was stopped by adding DMSO and absorbance
(595 and 630 nM) was measured using Multiskan™ FC Microplate Reader
(Fisher Scientific, Waltham, MA, USA).
EdU incorporation for S-phase entry
analysis
Cell cycle analysis was visualized by utilizing the
Click-iT EdU Imaging kit (Invitrogen, Grand Island, NY, USA).
Quiescent cells were treated with vehicle, rapamycin, PP242 or PDGF
for 4 h and then incubated with 5-ethynyl-2-deoxyuridine (EdU: 10
μM) for 4 h. Cells were subsequently fixed in 4% paraformaldehyde
for 15 min at room temperature and permeabilized for 15 min in 0.1%
Triton X-100 in PBS. EdU incorporation was detected by incubation
with Alexa 488-Click-iT reaction cocktail at room temperature for
30 min. Nascent protein synthesis was estimated by determining the
signal intensity of Alexa 488. Frequency maps of the cell
proliferation were constructed from fluorescence images using a
Zeiss microscope and analyzed by ImageJ (NIH). The number of Alexa
488-labeled cells was recorded against the DAPI labeled cells to
define cells entering into S-phase.
Results
The ATP-competitive binding inhibitor
PP242 inhibits both mTORC1 and mTORC2 activity
Upon activation, mTOR forms two multi-protein
complexes, mTORC1 and mTORC2. P70 S6K is a well-defined substrate
of mTORC1, and mTORC1 activity can be determined by the
phosphorylation status of p70 S6KThr389 or ribosomal
subunit S6KSer235/236. mTORC2 activity can be measured
by assessing the phosphorylation of AKTSer473. To
investigate whether the ATP-competitive binding site inhibitor
PP242 is effective in inhibiting both complexes, we analyzed the
phosphorylation statuses of p70 S6KThr389 and
AKTSer473 after rapamycin or dose-dependent treatments
with PP242 (2.2 or 1 μM) for 24h (Fig.
1).
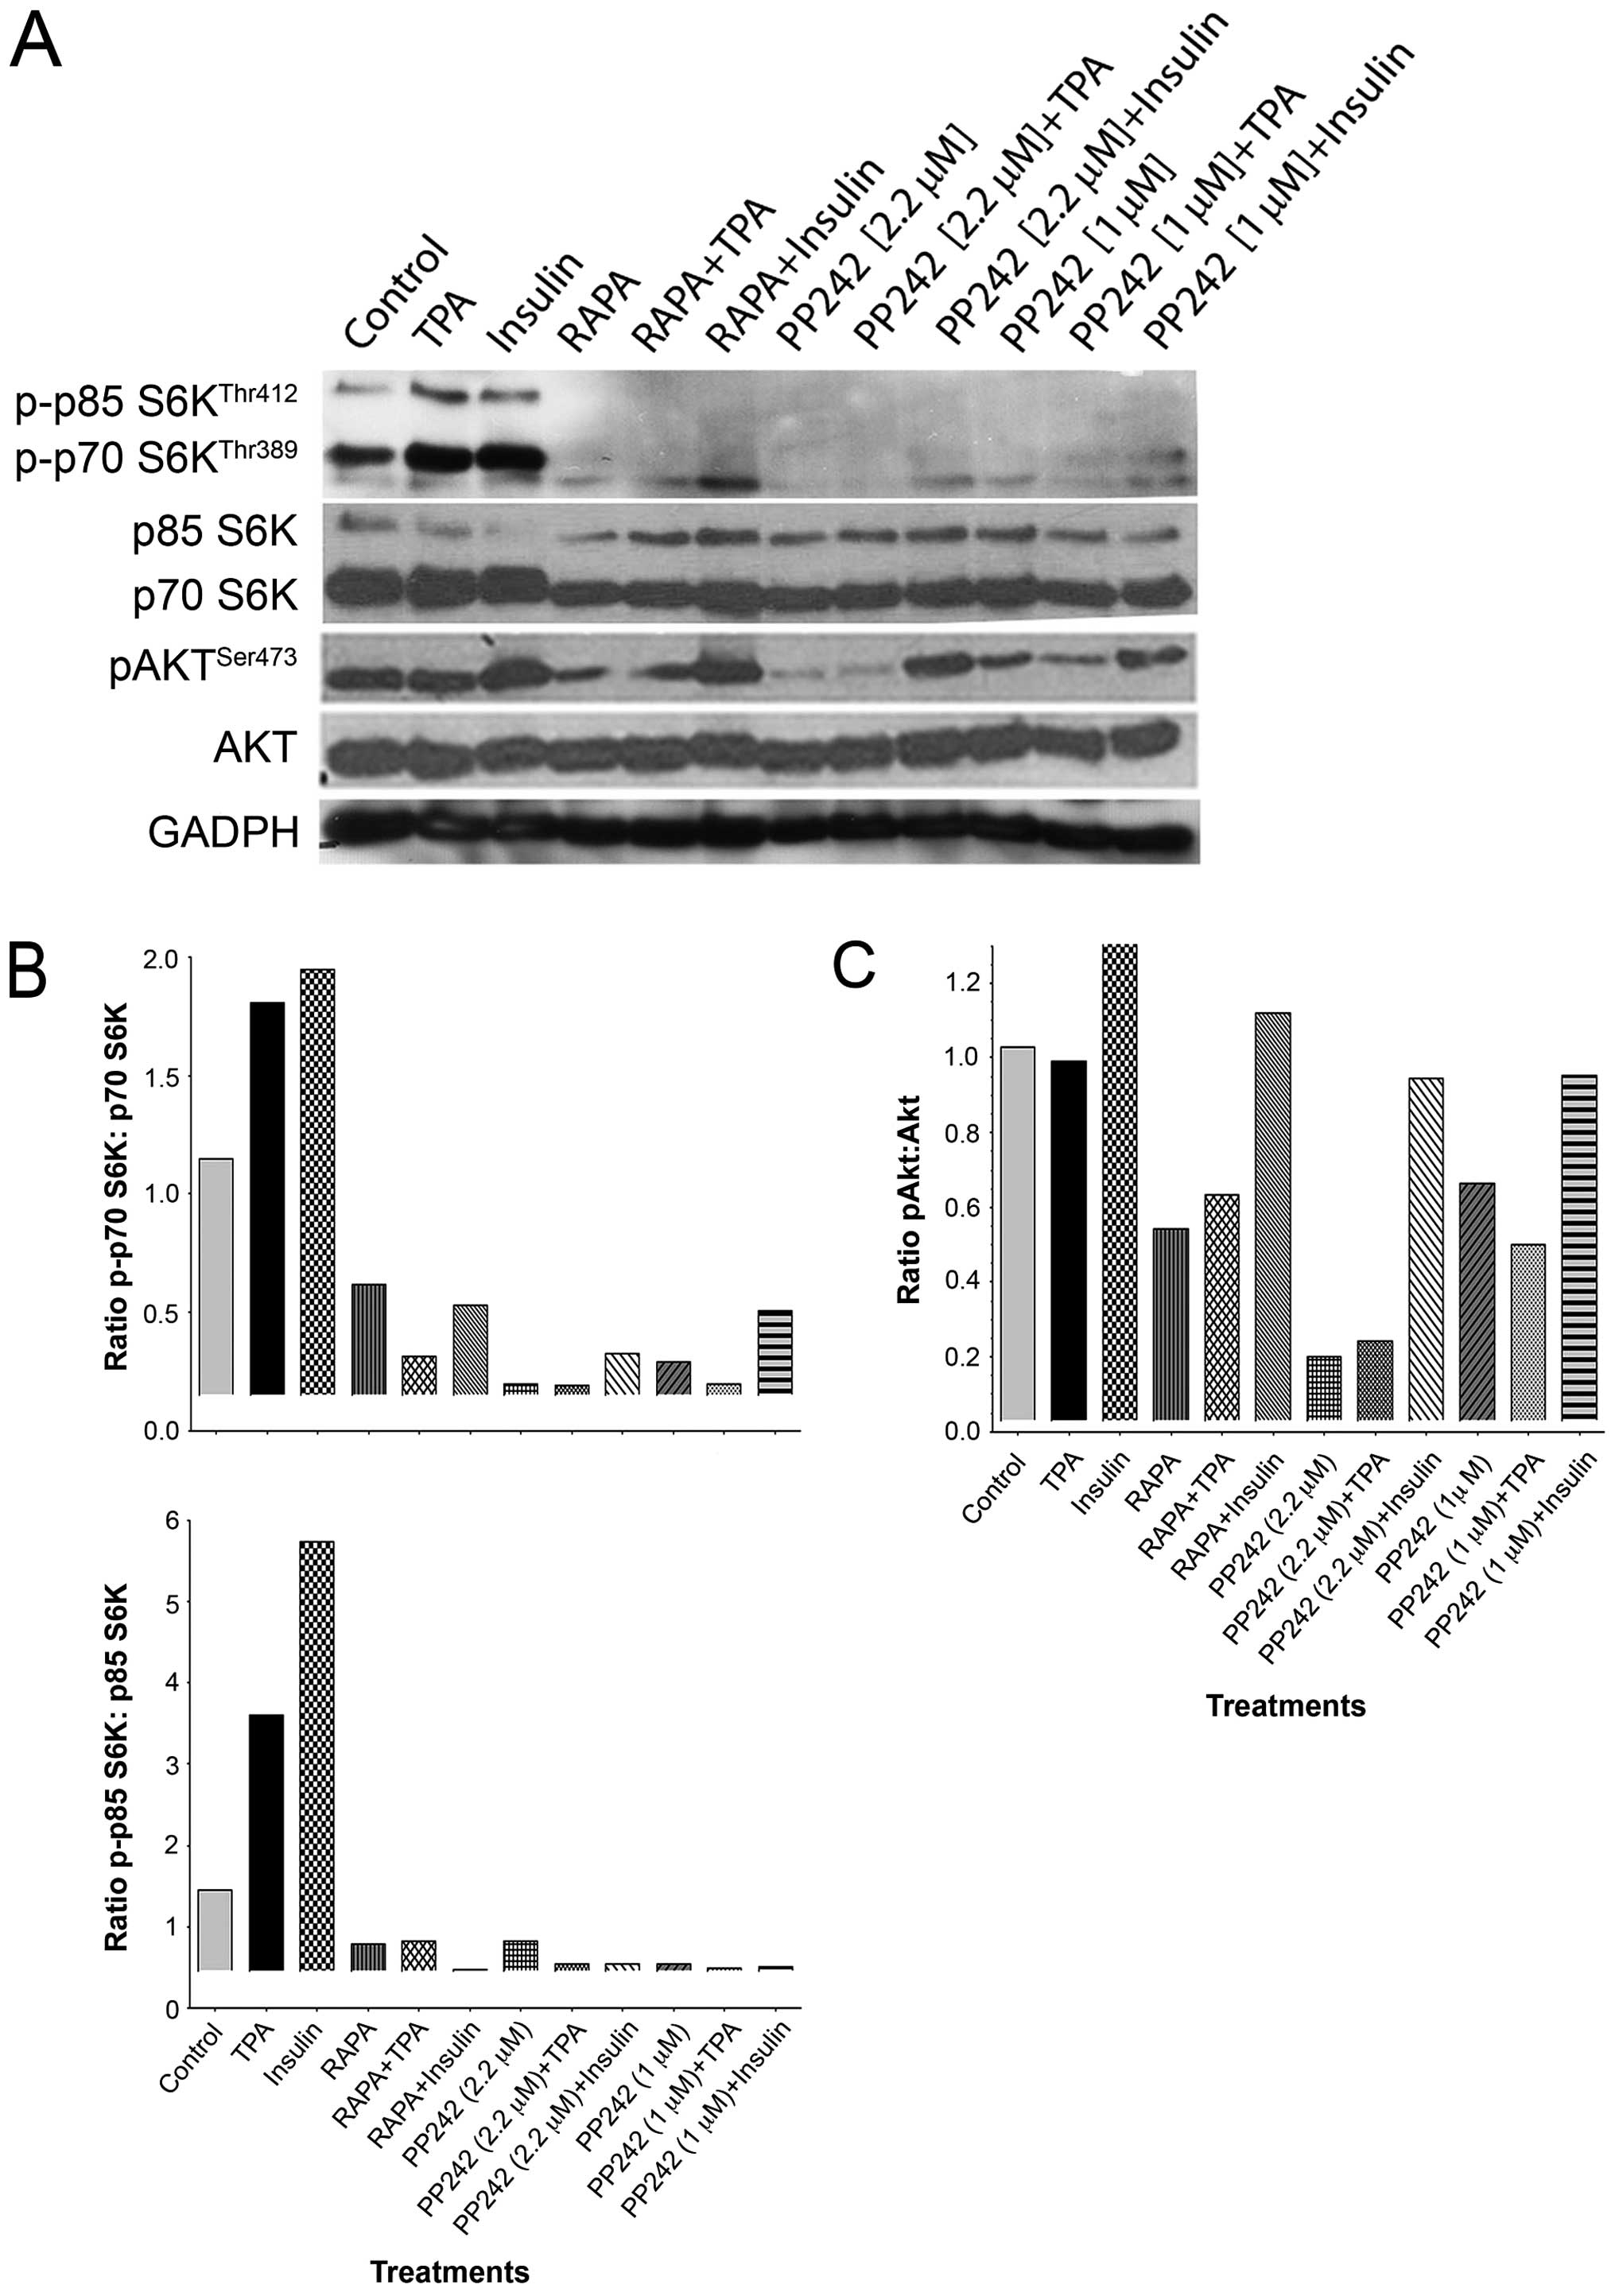 | Figure 1The ATP-competitive binding site
inhibitor PP242, suppresses both mTORC1 and mTORC2 activity, a
comparison with rapamycin. (A) Immunoblotting analysis demonstrated
that the ATP-competitive binding site inhibitor PP242 (1 or 2.2 μM)
significantly suppressed the activation of p70 S6KThr389
and p85 S6KThr412, as demonstrated by reduced expression
of both subunits of this kinase (70 and 85). The known inhibitor of
mTORC1, rapamycin (100 nM), also suppressed activation of p70
S6KThr389 and p85 S6KThr412, albeit to a
lesser extent than PP242 (1 or 2.2 μM). Insulin or TPA induced
activation of p70 S6K was suppressed by pretreatment with PP242 (1
or 2.2 μM), and to a lesser extent by rapamycin (100 nM).
Immunoblotting analysis showed PP242 caused significant inhibition
in pAKTSer473 expression at higher dose (2.2 μM). Low
dose PP242 (1 μM) suppressed pAKTSer473 expression
similar to rapamycin (100 nM). Insulin increased
pAKTSer473, which remained activated in rapamycin
pretreated cells. Pretreatment with PP242 partially reversed
insulin-induced activation of pAKTSer473. TPA failed to
induce the expression of pAKTSer473, which remained
unchanged following pretreatment with rapamycin (100 nM) or PP242
(1 or 2.2 μM). GAPDH expression showed equal protein loading in all
samples. (B) Densitometric quantification of p-p70 S6K/total p70
S6K ratio demonstrated a decline in p70 S6K activity. The effect
was greatest with PP242 (2.2 μM), while PP242 (1 μM) or rapamycin
(100 nM) rendered comparable results (top panel). Analysis of p-p85
S6K/total p85 S6K ratio demonstrated a decline in p85 S6K activity
following treatment with PP242. The effect was greatest for lower
dose PP242 (1 μM), while PP242 (2.2 μM) or rapamycin (100 nM)
yielded comparable results (bottom panel). Analysis of p-p70
S6K/p70 S6K (S70 and S85) showed activation by insulin or TPA
treatment was markedly suppressed by pretreatment with PP242. (C)
Higher dose PP242 (2.2 μM) showed a significant decline in
pAKTSer473 expression. A similar response of lesser
magnitutude was observed for the lower dose PP242 (1 μM) or
rapamycin (100 nM) Following pretreatment with higher dose, PP242
(2.2 μM) was able to partially reverse insulin-induced
pAKTSer473 expression, while TPA had no effect on
pAKTSer473 expression in the presence, or absence, of
rapamycin (100 nM) or PP242 (1 μM). |
Western blots were also stripped and re-probed for
total p70 S6K or Akt antibodies (Fig.
1A). Densitometric quantification of p-p70 S6K/total p70 S6K
(Thr389) and p-p85 S6K/total p85 S6K (Thr412)
ratio demonstrated a significant decline in the phosphorylation of
p70 S6K/p85 S6K, mTORC1 substrates, following treatment of GBM
cells with either rapamycin or PP242 (1 or 2.2 μM) (Fig. 1B). PP242 demonstrated a
dose-dependent suppression of p70 S6K phosphorylation, with PP242
yielding greater suppression of p70 S6K than rapamycin even at the
lower dose (Fig. 1B, top panel).
The lower dose of PP242 (1 μM) suppressed p85 S6K kinase more than
the higher dose of PP242 (2.2 μM) and rapamycin (Fig. 1B, bottom panel). We also stimulated
cells with either Insulin or TPA with or without pretreatment with
rapamycin or PP242 (Fig. 1A). The
densitometric analysis of p-p70 S6K/p70 S6K (S70 and S85)
demonstrated that the phosphorylation of p70 S6K was strongly
increased by insulin or TPA treatments, an effect markedly
suppressed by pretreatment of GBM cells with either rapamycin or
PP242 (Fig. 1B). This may imply
that dose effect saturation was achieved as similar effects were
seen even at the lower dose.
Treatment with mTORC1/2 inhibitor PP242 or rapamycin
suppressed the activity of mTORC2 as shown by decreased
phosphorylation of AKTSer473 in Fig. 1A. Densitometric quantification of
pAKT/total AKT demonstrated a dose-dependent response (Fig. 1C). More specifically, PP242 at a
lower concentration (1 μM) decreased the activation of pAKT by ~40%
while a higher dose (2.2 μM) reduced the expression of pAKT
activation by ~80%. As a comparison, we studied the effect of
rapamycin on activation of AKT and, densitometric quantification
demonstrated that pretreatment with rapamycin also reduced
expression of pAKT, albeit to a lesser extent than did treatment
with PP242 (2.2 μM) (Fig. 1C). The
GBM cells that were treated with rapamycin (100 nM) demonstrated a
50% suppression in the levels of phosphorylated
AKTSer473 (Fig. 1C).
Furthermore, insulin-induced activation of AKT, as seen by higher
expression of pAKTSer473, was suppressed by pretreatment
with rapamycin or PP242 at both doses (1 and 2.2 μM) (Fig. 1C). On the other hand, in this study
we found that TPA was unable to activate AKT, as evidenced by
unchanged pAKT levels with or without pretreatment with PP242
(Fig. 1A and C).
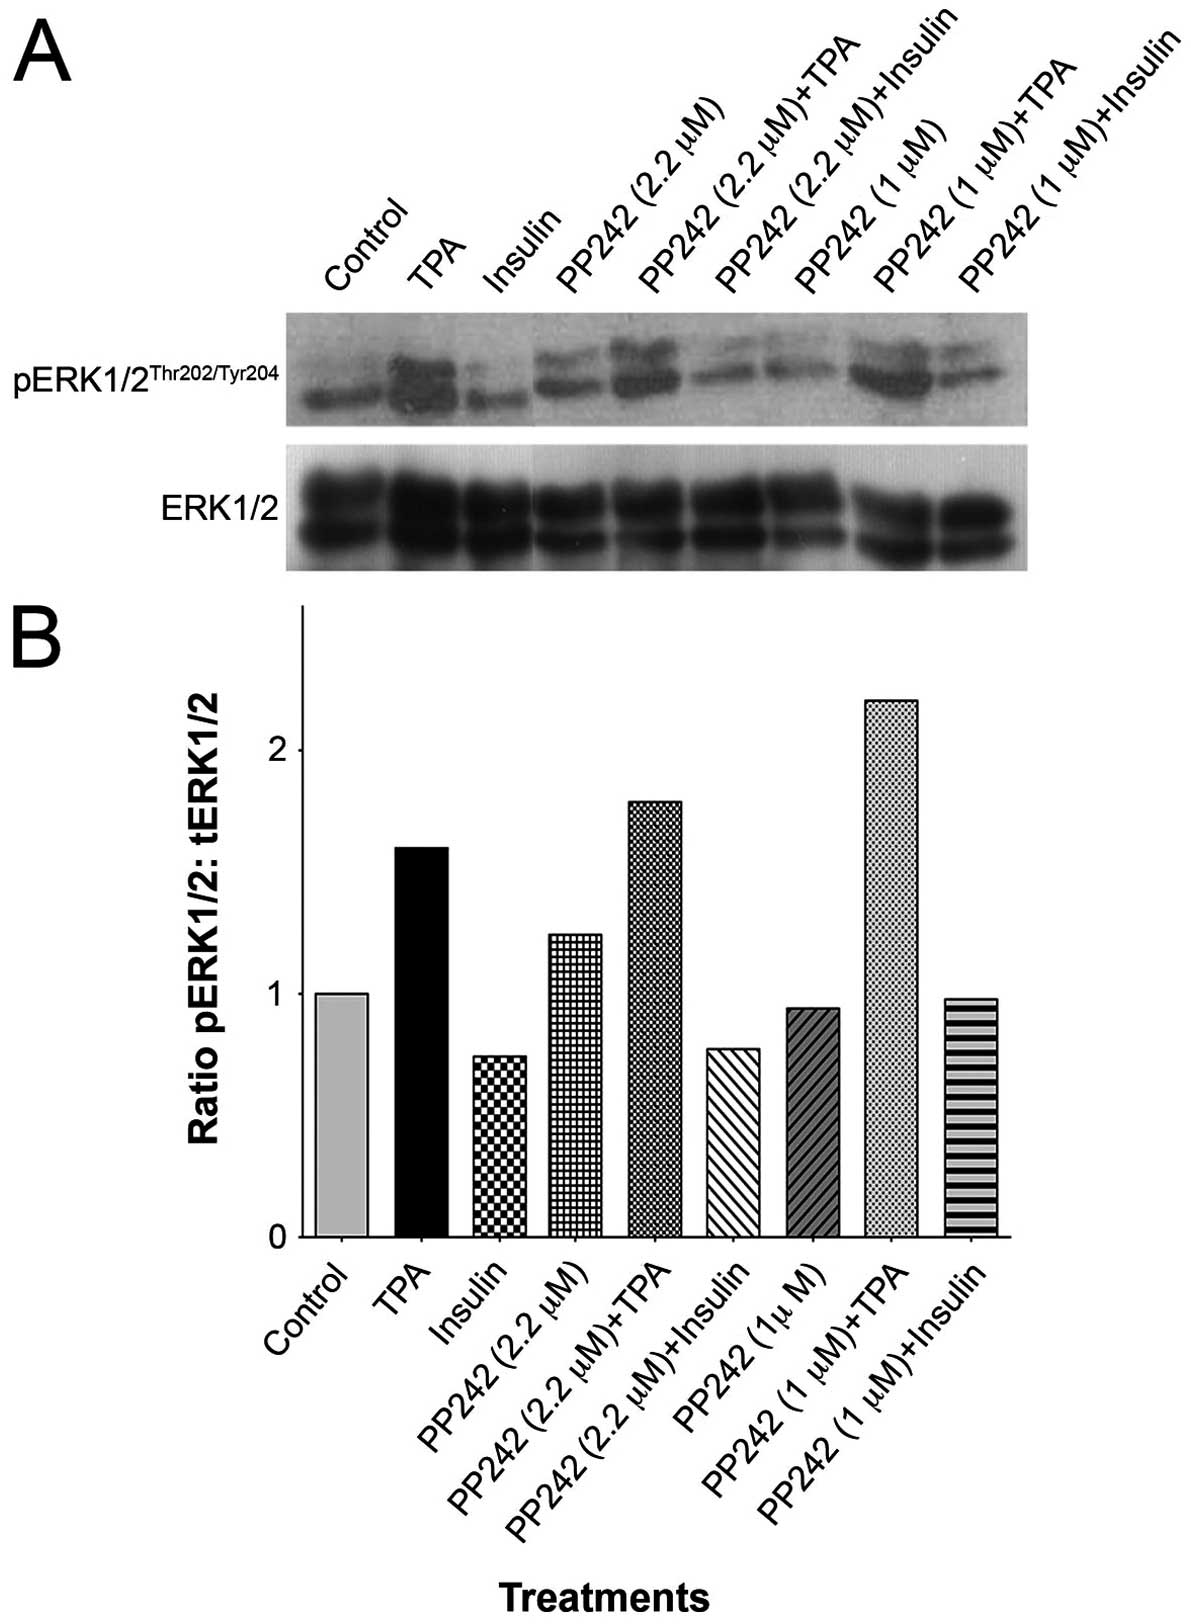
Effect of PP242 on ERK activation
Our previous findings have demonstrated that
prolonged administration of rapamycin caused a progressive increase
in activation of ERK as evident by increased levels in
pERKThr202/Tyr204 (28). Fig.
2A presents western blot analysis of the effect of pretreatment
with PP242 (1 and 2.2 μM), in the presence or absence of TPA or
insulin, on pERK expression (Fig.
2A). Densitometric quantification shows that, at a lower dose
of PP242, practically no activation of ERK was evident; however, a
modest increase in expression of pERKThr202/Tyr204
(~20%) was seen following PP242 (2.2 μM) treatment (Fig. 2B). In our study, Insulin treatment
did not activate ERK, as shown by no difference in levels of
pERKThr202/Tyr204, and further pretreatment of PP242 did
not alter the levels of pERK in insulin treated cells (Fig. 2B). As expected, TPA induced robust
activation of ERK; however, this activation was not suppressed by
pretreatment with PP242 (Fig. 2B).
This implies that TPA induced activation of ERK was not intercepted
by the inhibition of mTOR pathway.
Effect of PP242 and rapamycin on GBM cell
proliferation, S-phase entry and migration
Quiescent cells were treated with rapamycin (100 nM)
or PP242 (1 or 2.2 μM) for 24 h. Results show that GBM cell
proliferation was suppressed by PP242 in a dose-dependent manner.
Rapamycin (100 nM) was able to suppress cell viability in a manner
similar to low dose PP242 (1 μM), while the high dose of PP242 (2.2
μM) was most effective in reducing cell proliferation (Fig. 3A).
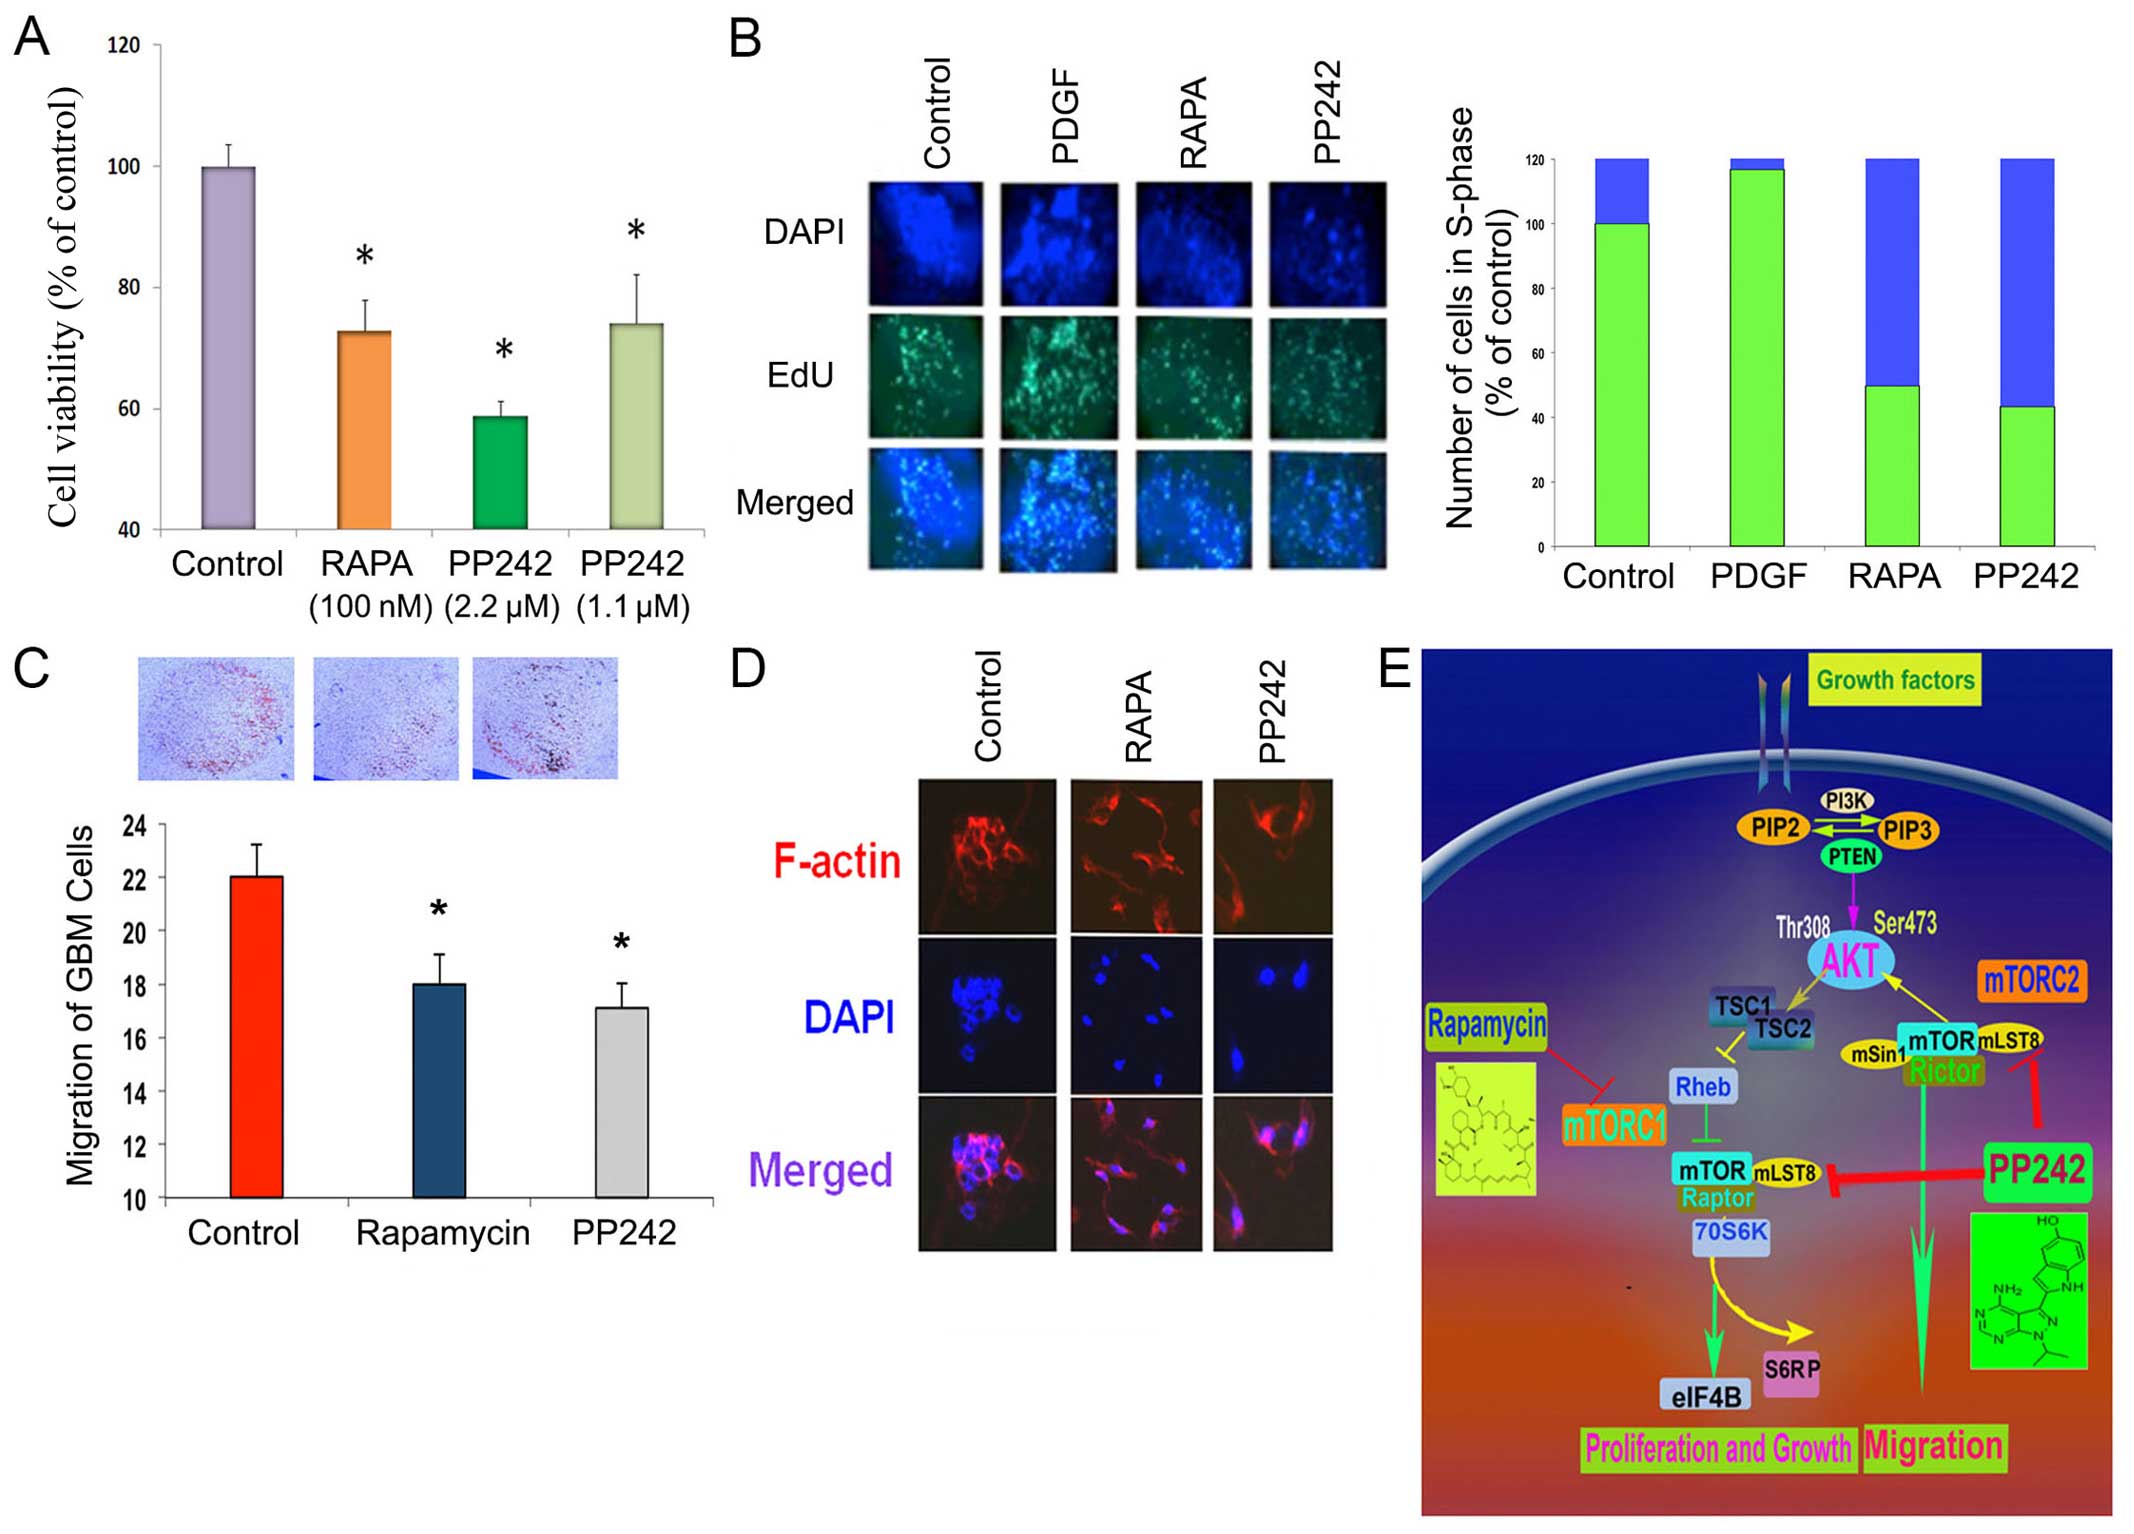 | Figure 3Effect of mTORC1/2 inhibitor on GBM
cell proliferation, cell cycle entry, migration and cell dynamics.
(A) The GBM cell proliferation was determined by MTT assay. GBM
cell proliferation was suppressed in a dose-dependent manner by
treatment with PP242 (2.2 μM and 1.1 μM). Rapamycin also suppressed
cell viability. (B) Cell cycle analysis (left panel), demonstrating
EDU incorporation, showed that PP242 (2.2 μM), more so than
rapamycin (100 nM), significantly suppressed the number of cells
entering S-phase, as compared to controls. Quantitative data (right
panel) presented in stacked bar graphs showed that PDGF treatment
significantly increased the number of EdU positive cells, compared
to controls (set to 100); PP242 (2.2 μM) and rapamycin (100 nM)
demonstrated a reduction in S-Phase entry. (C) The chemotactic
migration demonstrated that both PP242 (2.2 μM) and rapamycin (100
nM) suppressed cell migration after 24 h of treatment; however,
PP242 (2.2 μM) was more effective than rapamycin (100 nM). (D)
F-actin analysis demonstrated that the F-actin expression of
migrating cells was unaffected by rapamycin (100 nM) or PP242 (2.2
μM), suggesting no loss of cellular architecture. Rhodamine
palladine was used to stain F-actin. (E) A schematic representation
of two multiprotein complexes of mTOR, mTOR complex 1 (mTORC1) and
mTOR complex 2 (mTORC2), and inhibitors of rapamycin and PP242
inhibit mTORC1 and mTORC1/mTORC2, respectively. Indication of a ‘p’
before any protein shows that the protein is
phosphorylated/activated. RTK, receptor tyrosine kinase; PI3K,
phosphoinositide 3-kinase; PIP2, phosphatidylinositol bisphosphate;
PIP3, phosphatidylinositol (3,4,5)-trisphosphate; PTEN, phosphatase and
tensin homolog; mTOR, mechanistic target of rapamycin; Raptor,
rapamycin-sensitive adapter protein of mTOR; Rictor,
rapamycin-insensitive companion of mTOR. |
S-phase entry analysis was performed using EdU
incorporation following treatment with PP242, rapamycin, or PDGF
(Fig. 3B). PP242, an inhibitor of
mTORC1/2, caused a significant decrease in the number of cells
entering S-phase. Similarly, rapamycin, which inhibits mTORC1 only,
also showed a decrease in cells entering S-phase but to a lesser
extent than PP242 (2.2 μM) (Fig.
3B). As expected, PDGF caused a significant number cells
entering into S-phase as shown by an increase in the amount of
EdU-incorporation, suggesting a robust increase in cell cycle,
relative to vehicle treated controls (Fig. 3B).
Chemotactic migration was used to determine the
effect of rapamycin and PP242 on GBM cell migration. As shown in
(Fig. 3C), the cells were allowed
to migrate toward fibronectin, an extracellular matrix for 4 h. The
migration of GBM cells was notably suppressed by pretreatment with
PP242 (2.2 μM). Rapamycin (100 nM) also significantly suppressed
the migration of GBM cells. PP242 (2.2 μM) showed greater
suppression of chemotactic migration than rapamycin. The effect of
these compounds was evidently due to their effect on the cell
signaling cascade regulation of cellular migration, since treatment
with rapamycin or PP242 had no effect on cytoskeletal actin
polymerization (Fig. 3D), as
demonstrated by treated GBM cells stained with rhodamine
palladine.
Discussion
The results of this study clearly demonstrated that
a combined inhibitor of mTORC1/2 effectively suppressed both
complexes and thereby inhibited cell proliferation as well as
migration. PP242 treatment abolished the activation of mTORC1
substrate p70 S6K and mTORC2 substrate AKTSer473. This
effect was stable since treatment with tumor promoting agent TPA
failed to restore the activation of p70 S6K in PP242 treated cells.
Similarly, in cells pretreated with PP242, TPA treatment remained
ineffective at restoring pAKT expression. Moreover, we demonstrated
that the rapamycin reduced the activation of mTORC2 substrate,
although the effect was somewhat weaker. The analysis of cell
proliferation and growth showed that PP242 was more effective than
rapamycin in suppressing GBM cell proliferation as well as S-phase
entry. GBM cell motility was suppressed more by PP242 than
rapamycin.
We provided evidence that both mTORC1 and mTORC2
complexes will need to be targeted in order to effectively block
mTOR activity in GBM (30).
Prolonged treatment with rapamycin may lead to activation of ERK
pathway and mTORC2 complex, which promotes growth and cell motility
in GBM cells (28,30,34).
Administration of rapamycin caused an increased sensitivity to
radiation of a U87 xenograft and significantly increased the
re-growth delay of tumor, which was attributed to the rapamycin
effect on decreased cell proliferation and cell cycle arrest
(35). PP242 is an inhibitor of
mTORC1 and mTORC2 as it completely inhibited the activation of p70
S6K, as well as AKT, while rapamycin only inhibits the mTORC1
complex (36). We observed both
subunits of p70 S6K were dephosphorylated by PP242 treatment.
Downstream of mTORC1, the kinase S6K1 is a key regulator of protein
synthesis linked with diverse mitogenic stimuli. p70 S6K exists in
two distinct S6 kinases, p90 S6K and p70/85 S6K. The latter kinase
consists of two isoforms, one 70-kD cytoplasmic isoform (p70 S6K)
and the other nuclear (p85 S6K). Both isoforms appear to
phosphorylate the S6 protein and mediate translation of
polypyrimidine tract mRNA. Furthermore, studies have shown that the
translational control of DNA synthesis, in particular the
transition from G1 to S-phase, is regulated by its nuclear
localization.
The best-known substrates of mTORC1 are S6 kinase
(S6K) and 4E-BP1 (eukaryotic initiation factor 4E-binding
protein-1); the main substrates of TORC2 are AKT and related
kinases (15). Rapamycin
(sirolimus) and its analogs, such as RAD001 (everolimus) and
CCI-779 (temsirolimus), suppress mTOR activity through an
allosteric mechanism that acts at a distance from the ATP-catalytic
binding site. Mechanistically, rapamycin has two main drawbacks.
First, the drug suppresses mTORC1-mediated S6K activation, thereby
blocking a negative feedback loop, but it does not inhibit mTORC2.
In many cancer cells, this leads to elevated PI3K/AKT signaling,
thereby promoting cell survival. Second, rapamycin is an incomplete
inhibitor of mTORC1, reducing phosphorylation of 4E-BP1 only
partially in most cell contexts. mTOR pathway activation can be
achieved through multiple pathways. Activating mutations of
PI3K/mTOR are common in a majority of GBM patients, resulting in an
increased phoshorylation of key signaling proteins in the PI3K
pathway (37,38). Our results show that both subunits
of p70 S6K were de-phosphorylated by treatment with PP242. PI3K and
mTOR pathway in GBM can also be activated by amplification of EGFR
due to the presence of an activating mutation, most commonly
occurring at EGFRvIIII. In addition, c-MET and PDGFRα are other
RTKs that also contribute to activation of the PI3K pathway.
Upon activation, mTOR forms two distinct
multi-protein complexes, mTORC1 and mTORC2. mTORC1 displays
sensitivity to rapalogues such as rapamycin, everolimus and
temsirolimus, and mTORC2 is considered resistant to rapamycin and
insensitive to nutrient signals. The second subunit of the mTORC1
complex, mLST8, is considered to bind to the kinase domain of mTOR
and to positively regulate its kinase activity. mLST8 is also
important in maintaining the interaction between mTOR and either
RAPTOR or RICTOR (Rapamycin-insensitive companion of mTOR), which
is part of the mTORC2 complex and thus, thought to be important for
shuttling mTOR between the two complexes as well as for sustaining
the intracellular equilibrium of mTORC1 and mTORC2 (29,39,40).
We show herein that a selective, active-site mTOR
kinase inhibitor has potent effects. Active-site inhibition of
TORC1/2 addresses rapamycin-resistant mTORC1 outputs and prevents
activation of AKT resulting from feedback regulation (Fig. 1). mTORC1/2 inhibition caused
selective growth suppression of which the likely mechanism is that
the PI3K/AKT/mTOR pathway which is sustained by nutrients and
growth factors. One possibility is that rapamycin alters a
non-catalytic scaffolding-binding site of mTOR without affecting
the active binding site. PP242, an ATP-competitive binding
inhibitor of mTOR, is one of the new generations of mTOR
inhibitors. Compared with rapamycin, PP242 more efficiently
inhibits mTORC1, as evidenced by diminished p70 S6K phophorylation.
Unlike rapamycin, PP242 nearly abolishes activation of AKT thus
inhibiting the mTORC2. Rapamycin suppression of pAKT was also not
further influenced by treatment with TPA, implying that TPA has a
limited effect on pAKT expression. Insulin was able to activate
AKT, which was suppressed in part by pretreatment with rapamycin
and PP242.
Furthermore, the dose-dependent PP242-induced pAKT
suppression was not observed following treament of GBM cells with
insulin. Importantly TPA was unable to affect the activation of
AKTSer473, suggesting that TPA does not affect the
PI3K/AKT axis in these cells, and further pretreatment with PP242
or rapamycin remained ineffective. These findings suggest that
PP242 was effective in suppressing mTORC1 and mTORC2 activity
(Fig. 1).
Our results show that the ATP-competitive binding
inhibitor PP242, unlike rapamycin, remained less effective in
inducing ERK activation (Fig. 2)
(28). Notably, prolonged exposure
to allosteric mTOR inhibitor rapamycin caused activation of a
mitogenic pathway due to alteration of signaling feedback loops
(28). At the range of
IC50 dose (2.2 μM) of PP242, GBM cell proliferation was
strongly suppressed in vitro. PP242 is more effective in
preventing the occurrence of negative feedback loops by enhancing
its inhibitory effect on mTORC2. Therefore, PP242 is a more potent
inhibitor of proliferation and migration of GBM cells. These
results suggest that ATP kinase mTOR inhibitors may have far
superior effects by virtue of their ability to fully inhibit
rapamycin sensitive and insensitive complexes.
Whether mTORC1/2 specific inhibitors offer an
advantage over pan-PI3K/mTORC1/2 pathway inhibitors is still not
fully defined. However, several studies have provided evidence that
PI3K/mTORC1/2 inhibitors (P103) have effectively suppressed
downstream pathways in many cancers (41). However, whether pan-PI3K/mTORC1/2
inhibitors will provide an acceptable therapeutic window in GBM
remains to be seen. PI3K has numerous roles in cell survival,
differentiation, metabolism and migration, some of which are
independent of AKT and mTOR. Findings of this study suggest that,
whereas mTORC1/2 and mTORC1 inhibitors both affect proliferation
and migration, the mTORC1/2 inhibitors cause greater suppression.
Feedback loop regulation of PI3K/mTOR signaling has a significant
on impact therapeutic responses, in particular monotherapy groups.
For example, activation of p70 S6K by mTORC1 causes feedback
inhibition of IGF-1/insulin signaling by phosphorylating IRS-1
(insulin receptor substrate 1), causing IRS-1 degradation, and
leads to decreased PI3K signaling and reduced AKT T308
phosphorylation. However, rapalogue-induced inhibition of mTORC1
consequently inhibits p70S6K phosphorylation, reciprocally
activating negative feedback loops but relieves this feedback and
induces AKT T308 re-phosphorylation, and thus increases mTORC2
activation (30,42–45).
In addition, resistance to chemotherapy, and hypersensitivity to
the mTORC1 inhibitor, rapamycin, in tumors with low expression of
the tumor suppressor gene PTEN (reviewed in ref. 46), may be overcome by the use of the
ATP-competitive binding inhibitor of mTORC1/2, PP242.
Results herein indicate that selective mTORC1/2
inhibition is an attractive alternative approach that provides
better efficacy for suppressing GBM growth and invasion. Moreover,
these findings provide support for further preclinical and clinical
studies of selective active-site mTOR inhibitors in brain
tumors.
Acknowledgements
We thank Ms. Archina Marathi and Smita Ravichandran
for their excellent technical assistance. We gratefully acknowledge
The Advanced Research Foundation for funding support.
References
|
1
|
Stupp R, Mason WP, van den Bent MJ, Weller
M, Fisher B, Taphoorn MJ, Belanger K, Brandes AA, Marosi C, Bogdahn
U, et al; European Organisation for Research and Treatment of
Cancer Brain Tumor and Radiotherapy Groups; National Cancer
Institute of Canada Clinical Trials Group. Radiotherapy plus
concomitant and adjuvant temozolomide for glioblastoma. N Engl J
Med. 352:987–996. 2005. View Article : Google Scholar : PubMed/NCBI
|
|
2
|
Ohgaki H and Kleihues P: Genetic pathways
to primary and secondary glioblastoma. Am J Pathol. 170:1445–1453.
2007. View Article : Google Scholar : PubMed/NCBI
|
|
3
|
Verhaak RG, Hoadley KA, Purdom E, Wang V,
Qi Y, Wilkerson MD, Miller CR, Ding L, Golub T, Mesirov JP, et al;
Cancer Genome Atlas Research Network. Integrated genomic analysis
identifies clinically relevant subtypes of glioblastoma
characterized by abnormalities in PDGFRA, IDH1, EGFR, and NF1.
Cancer Cell. 17:98–110. 2010. View Article : Google Scholar : PubMed/NCBI
|
|
4
|
Phillips HS, Kharbanda S, Chen R, Forrest
WF, Soriano RH, Wu TD, Misra A, Nigro JM, Colman H, Soroceanu L, et
al: Molecular subclasses of high-grade glioma predict prognosis,
delineate a pattern of disease progression, and resemble stages in
neurogenesis. Cancer Cell. 9:157–173. 2006. View Article : Google Scholar : PubMed/NCBI
|
|
5
|
Hu X, Pandolfi PP, Li Y, Koutcher JA,
Rosenblum M and Holland EC: mTOR promotes survival and astrocytic
characteristics induced by Pten/AKT signaling in glioblastoma.
Neoplasia. 7:356–368. 2005. View Article : Google Scholar : PubMed/NCBI
|
|
6
|
Nutt C and Louis D: Cancer of the Nervous
System. 2nd edition. McGraw-Hill; New York: 2005
|
|
7
|
Berger AH and Pandolfi PP:
Haplo-insufficiency: A driving force in cancer. J Pathol.
223:137–146. 2011. View Article : Google Scholar
|
|
8
|
Di Cristofano A, Pesce B, Cordon-Cardo C
and Pandolfi PP: Pten is essential for embryonic development and
tumour suppression. Nat Genet. 19:348–355. 1998. View Article : Google Scholar : PubMed/NCBI
|
|
9
|
Carracedo A and Pandolfi PP: The PTEN-PI3K
pathway: Of feedbacks and cross-talks. Oncogene. 27:5527–5541.
2008. View Article : Google Scholar : PubMed/NCBI
|
|
10
|
Groszer M, Erickson R, Scripture-Adams DD,
Dougherty JD, Le Belle J, Zack JA, Geschwind DH, Liu X, Kornblum HI
and Wu H: PTEN negatively regulates neural stem cell self-renewal
by modulating G0–G1 cell cycle entry. Proc Natl Acad Sci USA.
103:111–116. 2006. View Article : Google Scholar
|
|
11
|
Hay N and Sonenberg N: Upstream and
downstream of mTOR. Genes Dev. 18:1926–1945. 2004. View Article : Google Scholar : PubMed/NCBI
|
|
12
|
Holland EC: Gliomagenesis: Genetic
alterations and mouse models. Nat Rev Genet. 2:120–129. 2001.
View Article : Google Scholar : PubMed/NCBI
|
|
13
|
Guertin DA and Sabatini DM: Defining the
role of mTOR in cancer. Cancer Cell. 12:9–22. 2007. View Article : Google Scholar : PubMed/NCBI
|
|
14
|
Jacinto E and Hall MN: Tor signalling in
bugs, brain and brawn. Nat Rev Mol Cell Biol. 4:117–126. 2003.
View Article : Google Scholar : PubMed/NCBI
|
|
15
|
Sabatini DM: mTOR and cancer: Insights
into a complex relationship. Nat Rev Cancer. 6:729–734. 2006.
View Article : Google Scholar : PubMed/NCBI
|
|
16
|
Ruggero D, Montanaro L, Ma L, Xu W, Londei
P, Cordon-Cardo C and Pandolfi PP: The translation factor eIF-4E
promotes tumor formation and cooperates with c-Myc in
lymphomagenesis. Nat Med. 10:484–486. 2004. View Article : Google Scholar : PubMed/NCBI
|
|
17
|
Hara K, Maruki Y, Long X, Yoshino K,
Oshiro N, Hidayat S, Tokunaga C, Avruch J and Yonezawa K: Raptor, a
binding partner of target of rapamycin (TOR), mediates TOR action.
Cell. 110:177–189. 2002. View Article : Google Scholar : PubMed/NCBI
|
|
18
|
Jacinto E, Loewith R, Schmidt A, Lin S,
Rüegg MA, Hall A and Hall MN: Mammalian TOR complex 2 controls the
actin cytoskeleton and is rapamycin insensitive. Nat Cell Biol.
6:1122–1128. 2004. View
Article : Google Scholar : PubMed/NCBI
|
|
19
|
Kim DH, Sarbassov DD, Ali SM, King JE,
Latek RR, Erdjument-Bromage H, Tempst P and Sabatini DM: mTOR
interacts with raptor to form a nutrient-sensitive complex that
signals to the cell growth machinery. Cell. 110:163–175. 2002.
View Article : Google Scholar : PubMed/NCBI
|
|
20
|
Sarbassov DD, Ali SM, Kim DH, Guertin DA,
Latek RR, Erdjument-Bromage H, Tempst P and Sabatini DM: Rictor, a
novel binding partner of mTOR, defines a rapamycin-insensitive and
raptor-independent pathway that regulates the cytoskeleton. Curr
Biol. 14:1296–1302. 2004. View Article : Google Scholar : PubMed/NCBI
|
|
21
|
Brown EJ, Beal PA, Keith CT, Chen J, Shin
TB and Schreiber SL: Control of p70 s6 kinase by kinase activity of
FRAP in vivo. Nature. 377:441–446. 1995. View Article : Google Scholar : PubMed/NCBI
|
|
22
|
Gingras AC, Kennedy SG, O'Leary MA,
Sonenberg N and Hay N: 4E-BP1, a repressor of mRNA translation, is
phosphorylated and inactivated by the Akt(PKB) signaling pathway.
Genes Dev. 12:502–513. 1998. View Article : Google Scholar : PubMed/NCBI
|
|
23
|
Ruvinsky I and Meyuhas O: Ribosomal
protein S6 phosphorylation: From protein synthesis to cell size.
Trends Biochem Sci. 31:342–348. 2006. View Article : Google Scholar : PubMed/NCBI
|
|
24
|
García-Martínez JM and Alessi DR: mTOR
complex 2 (mTORC2) controls hydrophobic motif phosphorylation and
activation of serum- and glucocorticoid-induced protein kinase 1
(SGK1). Biochem J. 416:375–385. 2008. View Article : Google Scholar : PubMed/NCBI
|
|
25
|
Sarbassov DD, Guertin DA, Ali SM and
Sabatini DM: Phosphorylation and regulation of Akt/PKB by the
rictor-mTOR complex. Science. 307:1098–1101. 2005. View Article : Google Scholar : PubMed/NCBI
|
|
26
|
Han EK, Leverson JD, McGonigal T, Shah OJ,
Woods KW, Hunter T, Giranda VL and Luo Y: Akt inhibitor A-443654
induces rapid Akt Ser-473 phosphorylation independent of mTORC1
inhibition. Oncogene. 26:5655–5661. 2007. View Article : Google Scholar : PubMed/NCBI
|
|
27
|
Cloughesy TF, Yoshimoto K, Nghiemphu P,
Brown K, Dang J, Zhu S, Hsueh T, Chen Y, Wang W, Youngkin D, et al:
Antitumor activity of rapamycin in a Phase I trial for patients
with recurrent PTEN-deficient glioblastoma. PLoS Med. 5:e82008.
View Article : Google Scholar : PubMed/NCBI
|
|
28
|
Albert L, Karsy M, Murali R and
Jhanwar-Uniyal M: Inhibition of mTOR activates the MAPK pathway in
glioblastoma multiforme. Cancer Genomics Proteomics. 6:255–261.
2009.PubMed/NCBI
|
|
29
|
Guertin DA, Stevens DM, Thoreen CC, Burds
AA, Kalaany NY, Moffat J, Brown M, Fitzgerald KJ and Sabatini DM:
Ablation in mice of the mTORC components raptor, rictor, or mLST8
reveals that mTORC2 is required for signaling to Akt-FOXO and
PKCalpha, but not S6K1. Dev Cell. 11:859–871. 2006. View Article : Google Scholar : PubMed/NCBI
|
|
30
|
Gulati N, Karsy M, Albert L, Murali R and
Jhanwar-Uniyal M: Involvement of mTORC1 and mTORC2 in regulation of
glioblastoma multiforme growth and motility. Int J Oncol.
35:731–740. 2009.PubMed/NCBI
|
|
31
|
Jacinto E, Facchinetti V, Liu D, Soto N,
Wei S, Jung SY, Huang Q, Qin J and Su B: SIN1/MIP1 maintains
rictor-mTOR complex integrity and regulates Akt phosphorylation and
substrate specificity. Cell. 127:125–137. 2006. View Article : Google Scholar : PubMed/NCBI
|
|
32
|
Sarbassov DD, Ali SM, Sengupta S, Sheen
JH, Hsu PP, Bagley AF, Markhard AL and Sabatini DM: Prolonged
rapamycin treatment inhibits mTORC2 assembly and Akt/PKB. Mol Cell.
22:159–168. 2006. View Article : Google Scholar : PubMed/NCBI
|
|
33
|
Feldman ME, Apsel B, Uotila A, Loewith R,
Knight ZA, Ruggero D and Shokat KM: Active-site inhibitors of mTOR
target rapamycin-resistant outputs of mTORC1 and mTORC2. PLoS Biol.
7:e382009. View Article : Google Scholar : PubMed/NCBI
|
|
34
|
Chang SM, Wen P, Cloughesy T, Greenberg H,
Schiff D, Conrad C, Fink K, Robins HI, De Angelis L, Raizer J, et
al; North American Brain Tumor Consortium and the National Cancer
Institute. Phase II study of CCI-779 in patients with recurrent
glioblastoma multiforme. Invest New Drugs. 23:357–361. 2005.
View Article : Google Scholar : PubMed/NCBI
|
|
35
|
Eshleman JS, Carlson BL, Mladek AC,
Kastner BD, Shide KL and Sarkaria JN: Inhibition of the mammalian
target of rapamycin sensitizes U87 xenografts to fractionated
radiation therapy. Cancer Res. 62:7291–7297. 2002.PubMed/NCBI
|
|
36
|
Gulati P and Thomas G: Nutrient sensing in
the mTOR/S6K1 signalling pathway. Biochem Soc Trans. 35:236–238.
2007. View Article : Google Scholar : PubMed/NCBI
|
|
37
|
Cancer Genome Atlas Research Network.
Comprehensive genomic characterization defines human glioblastoma
genes and core pathways. Nature. 455:1061–1068. 2008. View Article : Google Scholar : PubMed/NCBI
|
|
38
|
Parsons DW, Jones S, Zhang X, Lin JC,
Leary RJ, Angenendt P, Mankoo P, Carter H, Siu IM, Gallia GL, et
al: An integrated genomic analysis of human glioblastoma
multiforme. Science. 321:1807–1812. 2008. View Article : Google Scholar : PubMed/NCBI
|
|
39
|
Kim DH, Sarbassov DD, Ali SM, Latek RR,
Guntur KV, Erdjument-Bromage H, Tempst P and Sabatini DM: GbetaL, a
positive regulator of the rapamycin-sensitive pathway required for
the nutrient-sensitive interaction between raptor and mTOR. Mol
Cell. 11:895–904. 2003. View Article : Google Scholar : PubMed/NCBI
|
|
40
|
Zeng Z, Sarbassov D, Samudio IJ, Yee KW,
Munsell MF, Ellen Jackson C, Giles FJ, Sabatini DM, Andreeff M and
Konopleva M: Rapamycin derivatives reduce mTORC2 signaling and
inhibit AKT activation in AML. Blood. 109:3509–3512. 2007.
View Article : Google Scholar
|
|
41
|
Knight ZA, Gonzalez B, Feldman ME, Zunder
ER, Goldenberg DD, Williams O, Loewith R, Stokoe D, Balla A, Toth
B, et al: A pharmacological map of the PI3-K family defines a role
for p110alpha in insulin signaling. Cell. 125:733–747. 2006.
View Article : Google Scholar : PubMed/NCBI
|
|
42
|
Jhanwar-Uniyal M, Albert L, McKenna E,
Karsy M, Rajdev P, Braun A and Murali R: Deciphering the signaling
pathways of cancer stem cells of glioblastoma multiforme: Role of
Akt/mTOR and MAPK pathways. Adv Enzyme Regul. 51:164–170. 2011.
View Article : Google Scholar
|
|
43
|
Jhanwar-Uniyal M, Jeevan D, Neil J,
Shannon C, Albert L and Murali R: Deconstructing mTOR complexes in
regulation of Glioblastoma Multiforme and its stem cells. Adv Biol
Regul. 53:202–210. 2013. View Article : Google Scholar
|
|
44
|
Jhanwar-Uniyal M, Labagnara M, Friedman M,
Kwasnicki A and Murali R: Glioblastoma: Molecular pathways, stem
cells and therapeutic targets. Cancers (Basel). 7:538–555. 2015.
View Article : Google Scholar
|
|
45
|
Jhanwar-Uniyal M, Gillick JL, Neil J,
Tobias M, Thwing ZE and Murali R: Distinct signaling mechanisms of
mTORC1 and mTORC2 in glioblastoma multiforme: A tale of two
complexes. Adv Biol Regul. 57:64–74. 2015. View Article : Google Scholar
|
|
46
|
McCubrey JA, Abrams SL, Fitzgerald TL,
Cocco L, Martelli AM, Montalto G, Cervello M, Scalisi A, Candido S,
Libra M, et al: Roles of signaling pathways in drug resistance,
cancer initiating cells and cancer progression and metastasis. Adv
Biol Regul. 57:75–101. 2015. View Article : Google Scholar
|