Introduction
Medulloblastoma (MB) represents a genetically and
epigenetically heterogeneous group of neuroepithelial primary
tumors arising from the cerebellum (1). The World Health Organization (WHO)
has classified four histological variants of MB which include
classic, desmoplastic nodular (MB/N), MB with extensive nodularity
(MBEN) and large cell/anaplastic type (LC/A) (2). Later, Garré et al proposed the
classification of MB into two groups, standard-risk (SR) and
high-risk (HR) groups (3,4) according to the risk-adapted
treatments. In 2012, an international collaborative microarray
study established four molecular subgroups in MB (WNT, SHH, group 3
and 4) (5,6). It is noteworthy that Gibson et
al (7) found that WNT- and
SHH-subtype medulloblastoma have different anatomical locations.
For example, the WNT-Subtype is located within the IV ventricle and
arises at the dorsal surface of the brain-stem, while the
SHH-subtype arises within the cerebellar hemispheres. Current
treatment protocols are dependent on the age of patients; for
patients older than 36 months of age options include maximal safe
tumor resection followed by craniospinal radiotherapy and
chemotherapy. Infants younger than 36 months do not receive
radiotherapy due the risk of severe side-effects (8). Cure rates are dependent on the MB
molecular subtype. Patients with MB-WNT have a cure rate of over
90%, while in patients with MB-group 3 40–60% face chemo or
radio-resistance or relapse (8,9).
This variation in treatment response is a motivation to better
understand the biology of these tumors, including gene expression
patterns, in order to increase cure rates and/or to reduce
treatment-related sequelae.
An earlier comprehensive sequence analysis study in
88 pediatric MB samples led to the discovery of a gene,
histone-lysine N-methyltransferase MLL2, not previously
known to be altered in MBs (10).
In 14% of MB patients in the same study somatic mutations were
observed in MLL2, which is known to be a member of the
trithorax complex that induces epigenetic marks that correlate with
accessible euchromatin (11). The
connection between MLL2 alterations and tumorigenesis has not been
investigated in medulloblastoma. One possibility is that, the
MLL2 gene (new approved symbol KMT2D), which codifies the
MLL2 protein and which plays a role in maintaining HOX gene
expression (10,12) might deregulate HOX gene
expression in cancer. HOX genes encode evolutionarily
conserved homeodomain-containing transcription factors and in
humans there are four clusters named HOXA, HOXB,
HOXC and HOXD, which are located on chromosomes 7p14,
17a21, 12q13 and 2q31, respectively.
An additional motivation for studying HOX gene
expression in MB arises from the role of HOX genes in cerebellum
development. As described in Wang and Zoghbi (13), cerebellum development commences
from the dorsal region of the posterior neural tube. Two of the
regions of the posterior neural tube, the mesencephalon and the
metencephalon depend on molecular signals received from the Isthmus
Organizer (IO). The Otx-2 (MB oncogene) plays a role in IO
development while various genes in HOX family affect
metencephalon development (13).
Moreover, the expression of HOX genes is not
limited to the embryonic phase of development (14). Takahashi et al (15) studied the expression profiles of 39
HOX genes in 20 different human adult normal organs by real-time
PCR. They showed that in the cerebellum six HOX genes are
expressed, among them: HOXB2, HOXB3, HOXB4, HOXC4, HOXD1 and HOXD3.
Other studies have investigated the expression of HOX genes in
cerebellum suggesting that the number of HOX genes transcribed in
the cerebellum can be even higher. For example, recently, Hutlet
et al (16) demonstrated
low expression of 21 specific HOX genes in adult mice cerebella,
all belonging to paralogy groups (PG) 1–8 (16). These data suggest complex patterns
of HOX expression in the cerebellum, which in turn suggest the
relevance of multiple HOX gene regulation mechanisms. These
mechanisms include the use of multiple promoters, alternative
splicing, antisense transcripts, long non-coding RNA, miRNA, as
well as some translation controls (16,17).
In some cancers, certain HOX genes may
function as oncogene or tumor suppressor genes (18). For example, in prostate, breast and
colorectal cancers loss-of-function of HOXB13 mutations
suggests that HOXB13 may function as a tumor suppressor gene
(19). On the other hand, in
breast and colorectal cancer, upregulation of HOXB7 promotes
cell proliferation, which implies that it might function as an
oncogene (20,21). Apart from loss of function,
additional progress has been made in understanding changes in
expression levels and the activation of certain HOX genes
and cancer development (22,23).
In brain tumors, the deregulation of HOX genes has been
described in glioblastoma (24–27)
neuroblastoma (28,29), tumor atypical teratoid rhabdoid,
juvenile pilocytic astrocytoma and ependymomas (30). In medulloblastoma, Bodey et
al (31) observed by
immunocytochemistry techniques that HOXB3, HOXB4 and
HOXC6 proteins were expressed in medulloblastoma tissues. In
2014, Chakravadhanula et al (30) reported that HOXC4-6,
HOXC8-13, HOXD3-4, HOXD8-11 and HOXD13
genes were upregulated and HOXD1 gene was downregulated in
medulloblastoma tissues when compared to control tissues.
Recently, in order to elucidate epigenetic changes
that contribute to medulloblastoma progression, Vo et al
(32) demonstrated through the use
of engineered deletions of Ezh2 by gene editing nucleases,
that inactivation of Ezh2 drives aggressive medulloblastoma.
Ezh2 is a member of the polycomb complex known to induce
marks that correlate with heterochromatinization and mediate
repression of HOX genes (33). In addition to repression, the
authors showed that loss of Ezh2 is also accompanied by
upregulation of several HOX genes (32).
These studies suggest that several epigenetic
mechanisms of HOX regulation might play a role in
medulloblastoma. However, the role of HOX gene dysregulation
in medulloblastoma has not been investigated. In 2011, a seminal
study (34) suggested ten
attributes which are acquired by tumor cells and which also sustain
the malignant behavior in various types of cancer. In this study,
we investigate the role of two specific HOX genes,
HOXA10 and HOXB4, in two of these attributes in
meduloblastoma: migration and proliferation potential.
Materials and methods
Cell lines
Four independent medulloblastoma cell lines (UW402,
UW473, DAOY and ONS-76) were used in this study. UW402 and UW473
cell lines, have been previously characterized regarding
chromosomal heterogeneity, instability profiles, cell morphology,
cell population doubling time, colony-forming efficiency as well as
chemo-sensitivity heterogeneity (35). Both DAOY and ONS-76 cell lines are
long-established MB cell lines (36–38).
The ONS-76, UW402 and UW473 cell lines were kindly provided by the
Laboratory of Pediatric Oncology of the Clinical Hospital of the
Medical School of Ribeirão Preto (CHMSRP), while the DAOY cell line
was purchased from the American Type Culture Collection (ATCC:
HTB-186; ATTC, Manassas, VA, USA).
The three cerebellum primary cultures (CP4, CP5 and
CP6) were generated from cerebellum specimens that were harvested
from infants at autopsy in the Pathology Service of the CHMSRP. CP4
was obtained from cerebellum of a full term newborn who died at two
months old. CP5 and CP6 were collected from the cerebella of two
infants born at 22 and 23 weeks of gestation, respectively, who
died soon after birth. The causes of the babies' deaths were not
brain related.
The primary cells were cultured in Dulbecco's
modified Eagle's medium (DMEM)-F12 medium (Gibco, Grand Island, NY,
USA) with 10% fetal bovine serum (FBS; HyClone Laboratories, Inc.,
Logan, UT, USA), the same medium in which UW402 and UW473 cell
lines were cultured. The DAOY cell line was cultured in a-MEM
(Gibco) 10% FBS and ONS-76 cell line was cultured in RPMI-1640
medium (Gibco) 10% FBS in an incubator at 37°C and 5%
CO2. All culture media contained penicillin at 100
units/ml and streptomycin 100 μg/ml (Gibco). The study was
approved by the Ethics Research Committee of the Clinical Hospital
of Ribeirão Preto and Medical School of Ribeirão Preto of the
University of São Paulo under protocol number 14920/2011. All the
animal procedures of the present study were conducted in agreement
with the ethical principles in animal research adopted by the
Brazilian College of Animal Experimentation (COBEA) and this study,
under protocol number 137/2011, was also approved by the Medical
School of Ribeirão Preto of the University of São Paulo, Ethics
Commission of Ethics in Animal Research (CETEA).
Preparation of total RNA and microarray
experiments
Total RNA was isolated from cerebellum primary
cultures and medulloblastoma cell lines using RNeasy Mini kit
according to the manufacturer's instructions (Qiagen, Hilden,
Germany). The quantity and purity of the total RNA was determined
by spectrophotometer (NanoDrop; Thermo Fisher Scientific, Waltham,
MA, USA) and samples with OD 260/289 between 1.8 and 2.0 were used.
In order to check the integrity of the RNA 500 ng of RNA with
loading-buffer (xylene cyanol containing gelred fluorescente dye
from Biotium) was loaded in a 1% miniagarose gel in
Tris-Acetate-EDTA buffer. After electrophoresis, the gel was
analyzed using the ImageQuant 350 transilluminator (GE Healthcare)
with short-wave-length UV illumination to visualize 28S and 18S
bands. The integrity of the total RNA was also evaluated by
microfluidic-based electrophoresis (Agilent 2100 Bioanalyzer;
Agilent Technologies, Santa Clara, CA, USA) and samples with RIN
>7.0 were used for microarray experiments.
A total of 200 ng of RNA of samples and reference
were reverse transcribed by the Low RNA Input linear amplification
kit and then transcribed to Cy3-labelled (samples) or Cy5-labelled
(reference) according to the manufacturer's instructions (Agilent
Technologies). The protocols used were described in de Oliveira
et al (39). Briefly, the
reverse transcription reaction was incubated at 40°C for 2 h and
then incubated at 70°C for 15 min to degrade the excessive RNA.
Next, in vitro transcription was carried out using the T7
RNA polymerase and the dyes Cy3 and Cy5. This reaction was
incubated at 40°C for 2 h. After labeling and purification (Mini
Spin kit; GE Healthcare), the efficiency of Cy3 and Cy5 labeling
was quantified using the NanoDrop 1000 spectrophotometer (Thermo
Fisher Scientific). The numerical values for the labeling
efficiency were determined by the base-to-dye ratios of Cy3-dCTP
and Cy5-dCTP per μg of cRNA. The values obtained were
consistent with those recommended for hybridization onto cDNA
microaarrays. Next, the labeled samples and reference were
fragmented according to the manufacturer's instructions and the
hybridization buffer added. After the arrays were loaded, the
arrays were incubated at 65°C for 17 h for hybridization.
Dye normalization was performed by the linear lowess
method. For the spike in controls, the expected log ratio was
plotted against the observed log ratio as a quality control check.
For each lamina, the log ratio was plotted against the log
processed signal to ensure that the signal strength distribution
for upregulated and downregulated features were comparable.
Microarray data analysis
The raw data were obtained from a two-color Agilent
platform (SurePrint G3 Human Gene Expression 8×60K Microarray kit;
G4851A) using DAOY1 as a common reference. Quantile normalization
was performed on the raw data after hybridization followed by
normalization between arrays to obtain the gene expression levels.
Expression levels for the various HOX genes were obtained by
mapping probe names to the HOX genes using the NCBI GenBank.
Whenever there were multiple probes present for the same HOX
gene, the average over all probes was taken to determine the
expression level for that particular gene.
All heatmaps were generated using the gplots package
of Bioconductor. The identification of differentially expressed
genes was performed using the Limma package in Bioconductor. A
significance threshold of 0.05, along with P-values adjusted
according to the Benjamini-Hochberg method, was used to determine
which genes were differentially expressed. Anova contrasts were
used to identify differentially expressed genes in the various
comparisons shown in Fig. 1C and
D. All P-values were converted to their log to the base 10
equivalents before use in Fig. 1C and
D. The log fold change values used in the figures were those
obtained from the Limma output.
The raw data from high-throughput microarray
experiments are available on the Gene Expression Omnibus (GEO)
website under accession number GSE95684.
Real-time PCR
The cDNA was directly synthesized from 1 μg
total RNA from cerebellum primary cultures and medulloblastoma cell
lines using the High Capacity cDNA Reverse Transcription kit (Life
Technologies, Carlsbad, CA, USA) according to the manufacturer's
protocol. Each 25 μl cDNA synthesis reaction solution
contained 1 μg of total RNA, 1X buffer, 1X random primers,
dNTP (8 mM), RNase inhibitor (2 U) and 62 U of MultiScribe Reverse
Transcriptase (Life Technologies). The cDNA synthesis was carried
out with 1 cycle at 25°C for 10 min, 1 cycle at 37°C for 120 min
followed by heating to 85°C for 5 min to terminate the reaction.
Gene expression of the two HOX genes were quantified using the
TaqMan Universal Master Mix as previously reported by Covas et
al (40) and Fontes et
al (41). Briefly, cDNA (2
μl of cDNA diluted 1:10) was applied in the real-time PCR
assay with TaqMan probes (Applied Biosystems, Waltham, MA, USA)
HOXA10 (Hs00172012_m1), HOXB4 (Hs00256884_m1) and the
TaqMan Universal Master Mix according to the manufacturer's
protocol. Beta actin (ACTB) gene (4310881E) was used as reference
gene. Cycling was done for 2 min at 50°C, followed by denaturation
at 95°C for 10 min. The amplification was carried out with 40
cycles of 15 sec at 95°C and 60 sec at 60°C. We obtained the number
of amplification cycles needed for reaching the threshold
fluorescence within the log-linear phase of the amplification
curves after setting the appropriate baseline in each color channel
of the GeneAmp® 7500 software using the manual baseline
method. The relative expression level of target gene was shown as
expression relative units (ERU) and was quantified according to the
formula ERU = 10,000/2dCT following Albesiano et
al (42), where ΔCT = CT
target sample - CT reference sample. As in the study by Albesiano,
the reference gene level (in our case ACTB level) is set equal
10,000. For each sample in Fig. 2A and
B, cDNA was independently synthesized three times, and two
technical replicates were carried out on each batch of
independently synthesized cDNA. The same procedure was followed for
the samples in Fig. 3C and E.
Gene silencing
The lentiviral particles (Santa Cruz Biotechnology,
Santa Cruz, CA, USA) used contained the sequences of short hairpin
for human HOXA10 gene (shHOXA10), the green fluorescent
protein (GFP) reporter gene and the resistance gene to the
puromycin antibiotic (PUR), described as shHOXA10-GFP-PUR,
and the empty vector control containing only the GFP and
PUR gene sequences (sh-GFP-PUR). The DAOY cell line was
transduced using hexadimethrine bromide (6 μg/ml;
Sigma-Aldrich, St. Louis, MO, USA) at a multiplicity of infection
(MOI) of 5. After 24 h, the cells were treated with puromycin
antibiotic (1 μg/ml; Sigma-Aldrich, Hamburg, Germany) for 6
days. Cell lines were identified as
DAOY/shHOXA10+ and DAOY/control. The cell
transduction efficiency was evaluated by fluorescence microscopy
and flow cytometry for GFP, and gene silencing efficiency was
evaluated by real-time PCR and western blot analysis.
Gene overexpression
The human HOXB4 gene was over-expressed in
UW473 the cell line by the cell transduction method. The vector
used contained the sequences of human HOXB4 gene, the
GFP reporter gene and the resistance gene to the antibiotic
puromycin, described as HOXB4-PUR-GFP (VB150311-10017;
Cyagen Biosciences, Santa Clara, CA, USA). As a control, we used an
empty vector containing only the GFP and PUR gene
sequences (VB150311-10018; Cyagen Biosciences). Vectors related to
the viral capsid (8.91) and viral envelope (VSV-G) were used as
accessory vectors for the production of lentiviruses by
transfection of the 293FT cell line using Lipofectamine™ 2000
(Invitrogen, Carlsbad, CA, USA) according to the manufacturer's
protocol. The UW473 cell line was transduced with
HOXB4-GFP-PUR and control lentiviral particles with a MOI of
2. After 24 h, the cells were treated with puromycin antibiotic (1
μg/ml; Sigma-Aldrich) for 6 days. Cell lines were identified
as UW473/HOXB4+ and UW473/control. The cell
transduction efficiency was evaluated by fluorescence microscopy
and flow cytometry for GFP, and HOXB4 overexpression efficiency was
evaluated by real-time PCR and western blot analysis.
Western blot analysis
Total protein was extracted using RIPA buffer
(Sigma-Aldrich, St. Louis, MO, USA) supplemented with protease
inhibitor (Complete Mini Protease Inhibitor Cocktail; Roche
Diagnostics GmbH, Mannheim, Germany) and phosphatase (PhosSTOP
phosphatase inhibitor cocktail; Roche Diagnostics), and quantified
using the BCA protein assay kit (Pierce, Rockford, IL, USA)
according to the manufacturer's protocol. Proteins were separated
by SDS-PAGE using 10% polyacrylamide gels (Mini-PROTEAN TGX;
Bio-Rad Laboratories, Hercules, CA, USA), transferred from the gel
to a nitrocellulose membrane (40 μm, Hybond-C extra;
Amersham Biosciences, Little Chalfont, UK) and incubated in a 5%
skim milk blocking solution. The following primary antibodies were
used: mouse anti-human HOXA10 (E-12) (1:250, sc-271139;
Santa Cruz Biotechnology), mouse anti-human HOXB4 (D-1)
(1:500, sc-365927; Santa Cruz Biotechnology), rabbit anti-human
β-actin (1:4,000, #4967; Cell Signaling Technology, Danvers, MA,
USA) and rabbit anti-human GAPDH (14C10) (1:4,000, #2118;
Cell Signaling Technology). Mouse anti-sheep IgG (1:4,000, NA931V;
GE Healthcare, Aurora, OH, USA) and goat anti-mouse IgG rabbit
(1:4000, #7074; Cell Signaling Technology) HRP-conjugated secondary
antibodies were used. The proteins bands on the membrane were
developed using ECL Western Blotting Detection Reagent Prime kit
(GE Healthcare) according to the manufacturer's instructions. As
mentioned by Ferguson et al (43) β-actin and β-tubulin proteins (both
being part of the cytoskeleton of eukaryotic cells), and GAPDH
enzyme (glyceraldehyde-3-phosphate dehydrogenase), are classically
used as internal standards for normalization of signals in western
blot analysis in order to compare differences in the expression of
the target proteins among samples and eliminating variations
arising from technical reasons, such as differences in amount of
total load protein (43). The
protocols have been previously used by various co-authors of this
study, as described in Thomé et al (44) (β-actin) and Palma et al
(45) who have used both these
control antibodies. As in this study, in Palma et al
(45) both control antibodies,
β-tubulin and GAPDH, were used.
In vitro proliferative and migration
potential assay
The proliferative potential was assessed by cell
counting in a Neubauer chamber. Initially, 8×10⁴ viable
cells were cultured in 75-cm2 flask for a period of 120
h. Next, the cells were trypsinized and viable cells were counted
in the Neubauer Chamber with trypan blue in quadruplicate. The
proliferative potential (PP) was calculated as PP = N - No, in
which N is the final number of cells and No is the initial number
of cells.
Scratch assay was used to evaluate the migration
potential. Cells were cultured in 6-well plates (in triplicate for
each cell line), and when they reached ~95% confluence a scratch
was made. The wells were photodocumented by phase contrast
microscopy (Olympus IX71 and PD controller software, USA) in two
different points along the scratch in each well, and identified as
time 0. After 16 or 20 h, the wells were again photodocumented at
the same positions using the TScratch software (software developed
by Tobias Gebäck and Schulz, ETH Zurich, Switzerland). The
percentage of scratch area was measured in the images of initial
and final time. The migration potential was calculated as
percentage of migrated area (%MA), %MA = 1- (N/No), in which N is
the final area (%) and No is the initial area (%).
In vivo tumorigenic potential assay
Male nude mice weighing 20–25 g were obtained from
the Central Animal House of the University of São Paulo (Ribeirão
Preto, Brazil), and were housed at 23±2C with 12-h light/dark
cycle. This experimental protocol was approved by the Animal
Research Ethical Committee of the Medical School of Ribeirão Preto,
USP (protocol number 137/2011).
For the evaluation of the tumorigenic potential,
3×10⁶ cells of medulloblastoma cell lines in 100
μl of Matrigel (Matrigel® Matrix; Corning, Inc.,
Corning, NY, USA) were infused subcutaneously into the backs of
nude mice, which were previously anesthetized with a mixture of 2%
isoflurane and oxygen. The mice were monitored in the periods 7,
15, 30 and 60 days after cell infusion, for the detection and
quantification of GFP fluorescence using the in vivo imaging
system IVIS Lumina and Living Image software (Perkin-Elmer,
Waltham, MA, USA); and for measurement of the nodular Volume using
a digital caliper. The nodular volume (NV) was calculated as: NV= L
× W × H × 4/3 π, where L is the length, W is the width and H is the
nodule height.
Statistical analysis
The Student's t-test and the one-way ANOVA test were
used to evaluate the HOX expression level differences, as
well as migration and proliferation potential, before and after
genetic modification of the MB cell lines. For these assays,
statistical tests were performed using the GraphPad Prism 5 for Mac
OS X. All results were expressed as mean ± standard deviation. R
was used for all other statistical analyses. Tests were declared
statistically significant for P<0.05.
Results
Higher numbers of HOX genes are
significantly deregulated in DAOY and ONS-76 cell lines compared to
UW473 and UW402 cell lines
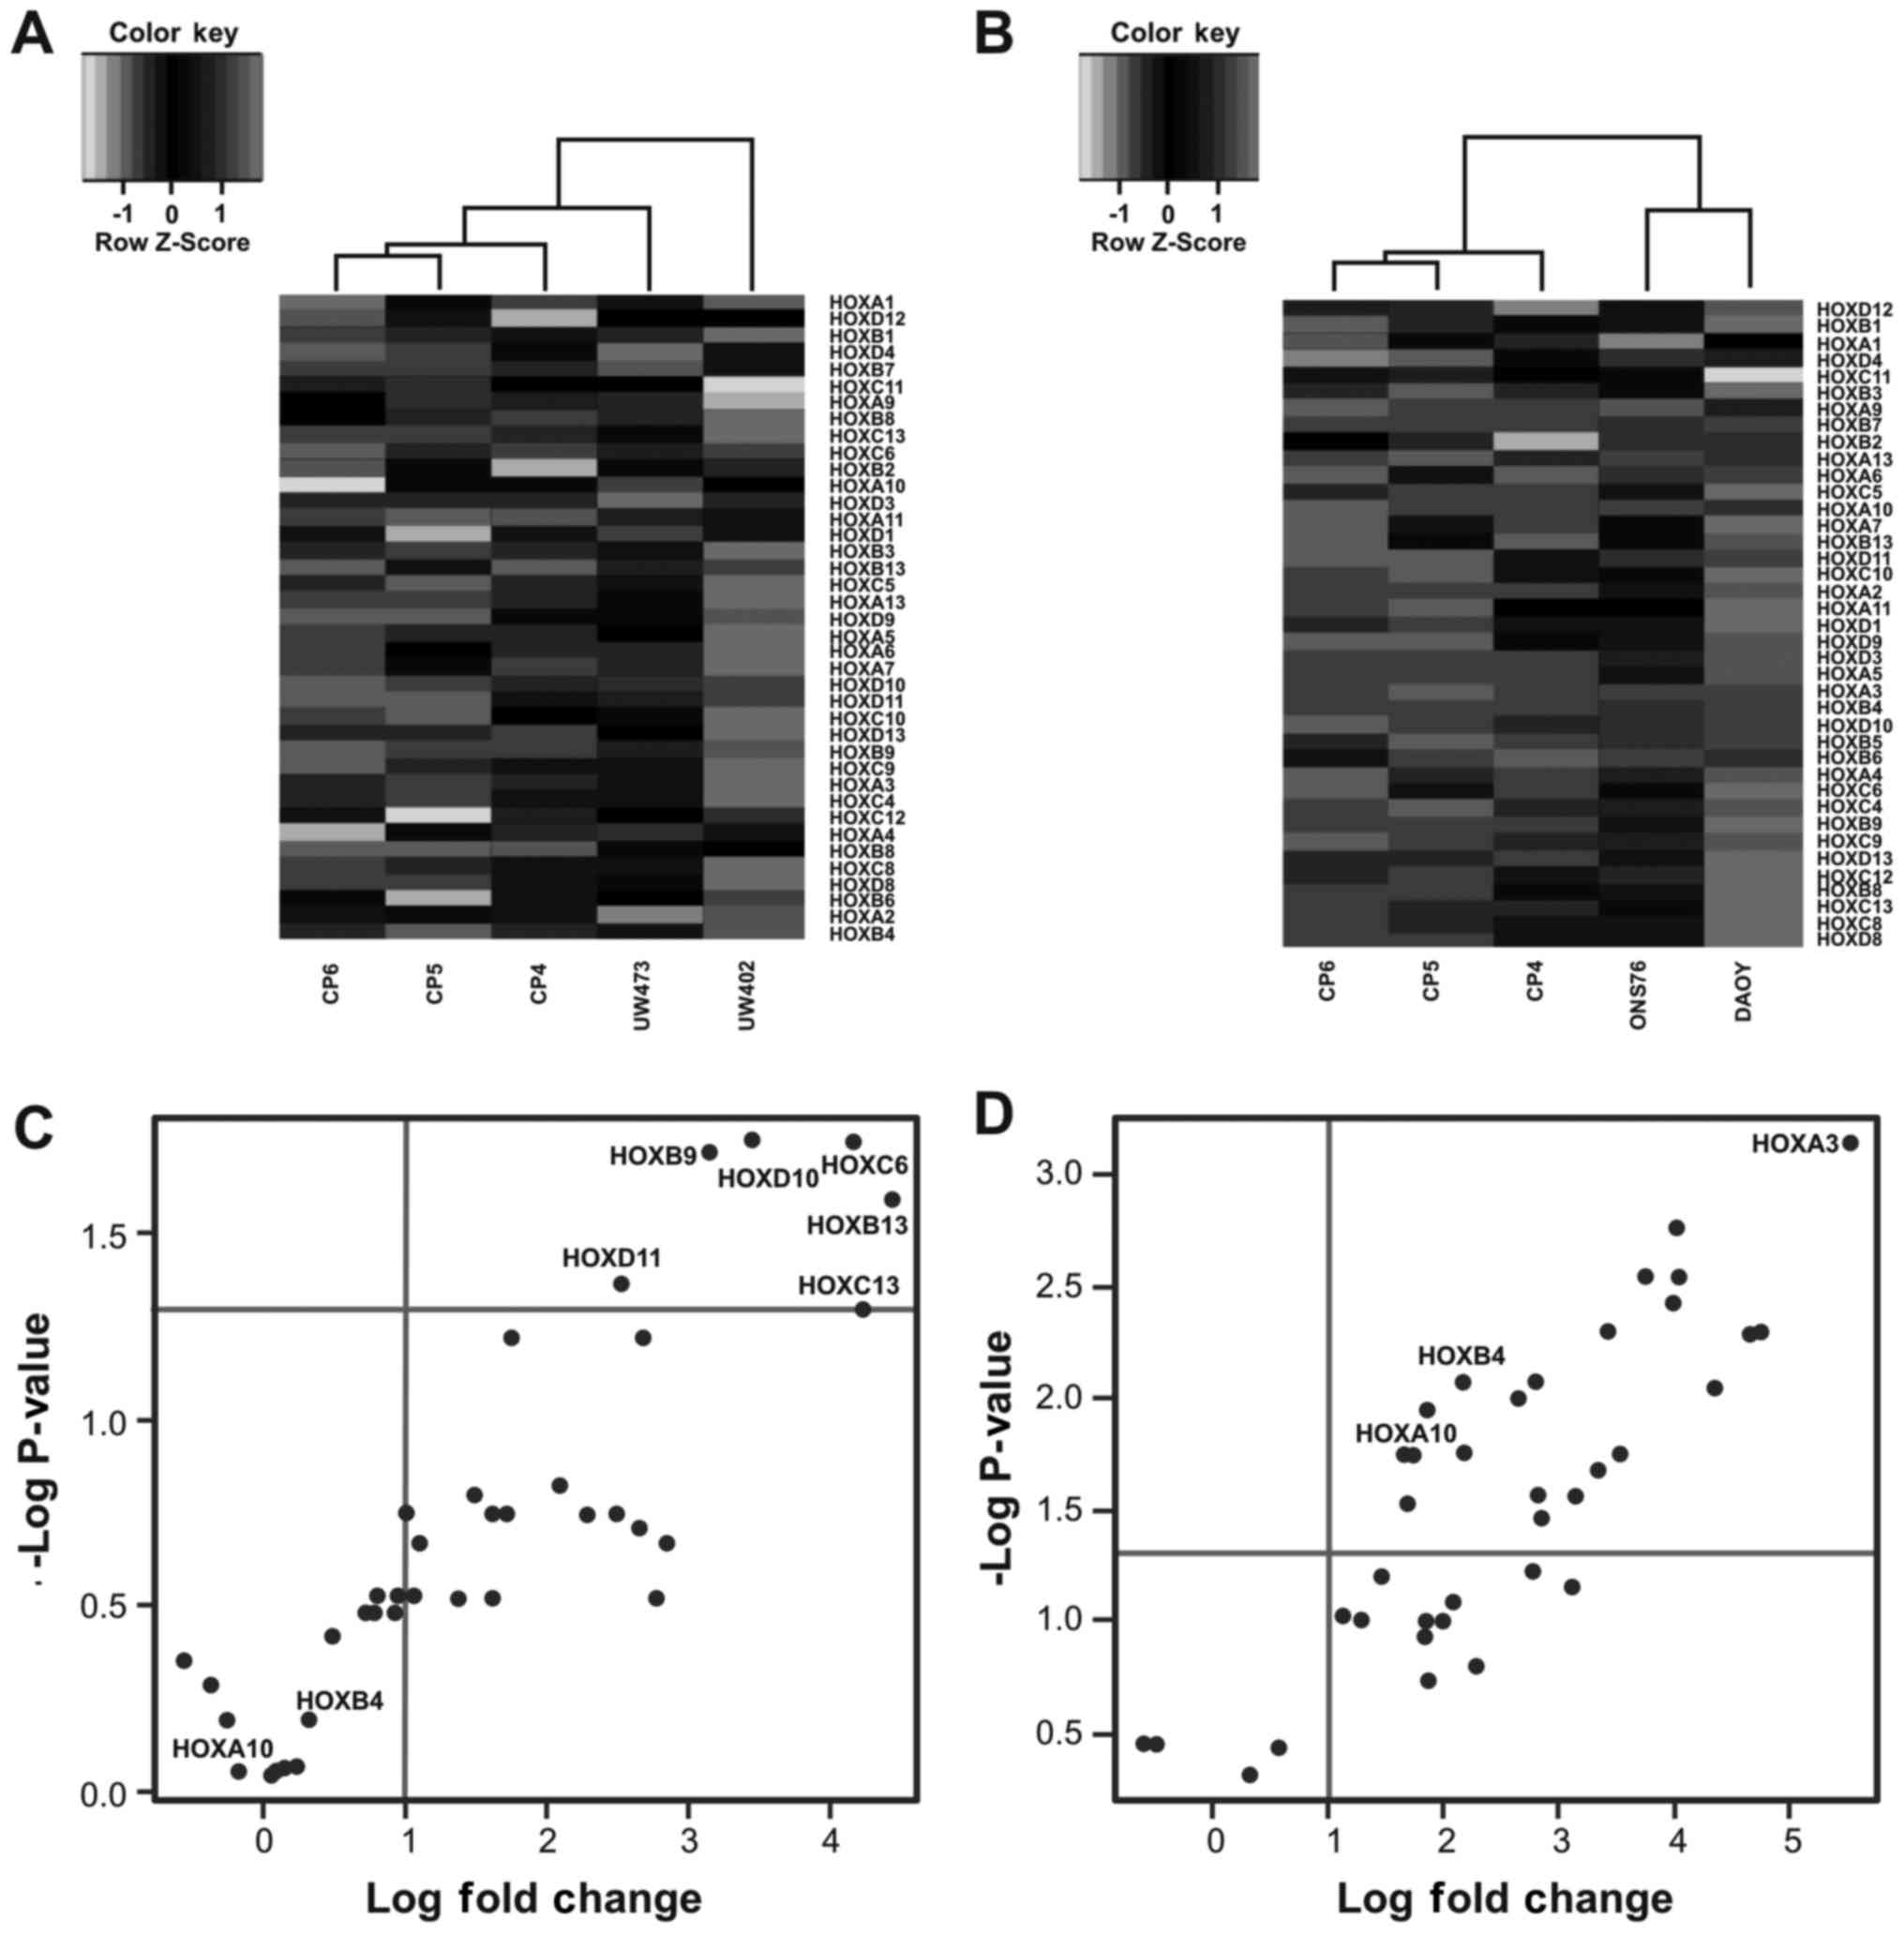
In Fig. 1 we show
the results of hierarchical clustering of 39 HOX genes with tumor
cell lines which are not characterized (UW473 and UW402 cell lines)
and primary cell cultures from the cerebellum (CP4, CP5 and CP6),
and also 39 HOX genes with tumor cell lines which are
characterized as being from the SHH subgroup (ON-S76 and DAOY cell
lines) (Fig. 1A and B) (35,46,47).
In both dendograms tumor cell lines and primary cell
cultures fall into two distinct groups. For the DAOY and ONS-76
cell lines this distinction is even clearer producing two distinct
clusters (Fig. 1B). We observed
that in DAOY and ONS-76 cell lines several HOX genes are
expressed, while these genes are not expressed in primary cell
cultures. As regards the other two cell lines, we observed a
distinction between HOX gene profiles in UW473 and UW402
cell lines. HOX genes are more expressed in UW402 cell line
compared with UW473 cell line (Fig.
1A).
To visualize the significantly dysregulated HOX
genes we constructed the volcano plot. We observed that in the
UW402 and UW473 cell lines only 6 HOX genes are
significantly upregulated (HOXB9, HOXB13,
HOXC6, HOXC13, HOXD10 and HOXD11)
compared with the primary cell lines from cerebellum (Fig. 1C). On the other hand, in the DAOY
and ONS-76 cell lines 24 HOX genes are significantly upregulated:
nine from HOXA group (HOXA2, HOXA3,
HOXA4, HOXA5, HOXA6, HOXA7,
HOXA9, HOXA10 and HOXA13), six from
HOXB group (HOXB2, HOXB4, HOXB5,
HOXB6, HOXB7 and HOXB9), six from HOXC
group (HOXC4, HOXC5, HOXC6, HOXC9,
HOXC10 and HOXC13) and three from HOXD group
(HOXD3, HOXD10 and HOXD11) (Fig. 1D). Out of these 24 HOX genes,
HOXA3 was the most dysregulated gene, however, upregulation
of this gene has not been demonstrated in medulloblastoma or other
tumor from the central nervous systems (CNS). These results are
summarized in Table I, which
contains all log fold change values. Gene names in bold face are
those mentioned above as being statistically significantly
upregulated.
 | Table IComparison of fold change using
microarray data set from HOX genes in UW402 and UW473 vs.
cerebellum primary cells and DAOY and ONS-76 vs. cerebellum primary
cells. |
Table I
Comparison of fold change using
microarray data set from HOX genes in UW402 and UW473 vs.
cerebellum primary cells and DAOY and ONS-76 vs. cerebellum primary
cells.
UW473 and UW402
| DAOY and ONS-76
|
|---|
| Genes | Log fold
change | Genes | Log fold
change |
|---|
| HOXA1 | −0.569958863 | HOXA1 | −0.597828379 |
| HOXA2 | 0.095698182 | HOXA2 | 2.656257452 |
| HOXA3 | 2.500799762 | HOXA3 | 5.535882266 |
| HOXA4 | 0.803518199 | HOXA4 | 3.429616377 |
| HOXA5 | 1.091665053 | HOXA5 | 2.184209412 |
| HOXA6 | 1.611731106 | HOXA6 | 2.779732951 |
| HOXA7 | 1.371254281 | HOXA7 | 2.825761681 |
| HOXA9 | −0.262664551 | HOXA9 | 1.664946587 |
| HOXA10 | 0.131334357 | HOXA10 | 1.866723269 |
| HOXA11 | 0.143180662 | HOXA11 | 1.846451081 |
| HOXA13 | 2.670226837 | HOXA13 | 3.755042843 |
| HOXB1 | 0.946528446 | HOXB1 | 0.324546332 |
| HOXB2 | −0.182254131 | HOXB2 | 3.150953293 |
| HOXB3 | 2.293320983 | HOXB3 | 1.472715878 |
| HOXB4 | 0.483773574 | HOXB4 | 4.027400665 |
| HOXB5 | 0.726902915 | HOXB5 | 4.049698398 |
| HOXB6 | 2.769873572 | HOXB6 | 3.992872898 |
| HOXB7 | 1.744203467 | HOXB7 | 2.169081951 |
| HOXB8 | 0.213373435 | HOXB8 | 2.286976211 |
| HOXB9 | 3.155648057 | HOXB9 | 4.359008666 |
| HOXB13 | 4.43490889 | HOXB13 | 2.78047806 |
| HOXC4 | 2.657559554 | HOXC4 | 4.752524627 |
| HOXC5 | 0.994376614 | HOXC5 | 1.697798782 |
| HOXC6 | 4.164237557 | HOXC6 | 3.346096371 |
| HOXC8 | 1.042329918 | HOXC8 | 1.991863755 |
| HOXC9 | 2.852715702 | HOXC9 | 4.663234774 |
| HOXC10 | 2.095372335 | HOXC10 | 2.858686398 |
| HOXC11 | −0.378263228 | HOXC11 | −0.496091564 |
| HOXC12 | 0.317817366 | HOXC12 | 1.876619216 |
| HOXC13 | 4.232848464 | HOXC13 | 3.531212456 |
| HOXD1 | 0.307750142 | HOXD1 | 1.833684289 |
| HOXD3 | 0.779984978 | HOXD3 | 1.743693697 |
| HOXD4 | 0.924886063 | HOXD4 | 1.133382434 |
| HOXD8 | 1.49312174 | HOXD8 | 2.089211292 |
| HOXD9 | 1.620166724 | HOXD9 | 1.288963756 |
| HOXD10 | 3.44561321 | HOXD10 | 4.045820474 |
| HOXD11 | 2.529309801 | HOXD11 | 2.805492204 |
| HOXD12 | 0.064926757 | HOXD12 | 0.579149569 |
| HOXD13 | 1.71540358 | HOXD13 | 3.112325861 |
From the results of these analyses, we continued
the present study with focus on two genes HOXA10 and
HOXB4, which are significantly upregulated in DAOY and
ONS-76 cell lines but not in UW402 and UW473. In mice MB-derived
cancer stem cell (CSC), HOXA10 has been found to be one of
the top-ranking genes highly expressed in highly tumorigenic
(HT)-CSCs. Also, HOXA10 was found to have a high protein
expression level in glioblastoma-derived neurospheres, and is
associated with poor outcomes and treatment resistance in
glioblastoma multiforme (GBM) (48). Moreover, the HOXA10 locus
was associated with expression of a stem cell related
HOX-signature in glioblastoma and with temozolomide
resistance (49). HOXB4 was
found to be expressed in medulloblastoma tissues (31) and recently, loss of Ezh2, an
epigenetic regulator of HOX genes, drives aggressive
medulloblastoma and was accompanied by upregulation of HOXB4
(32).
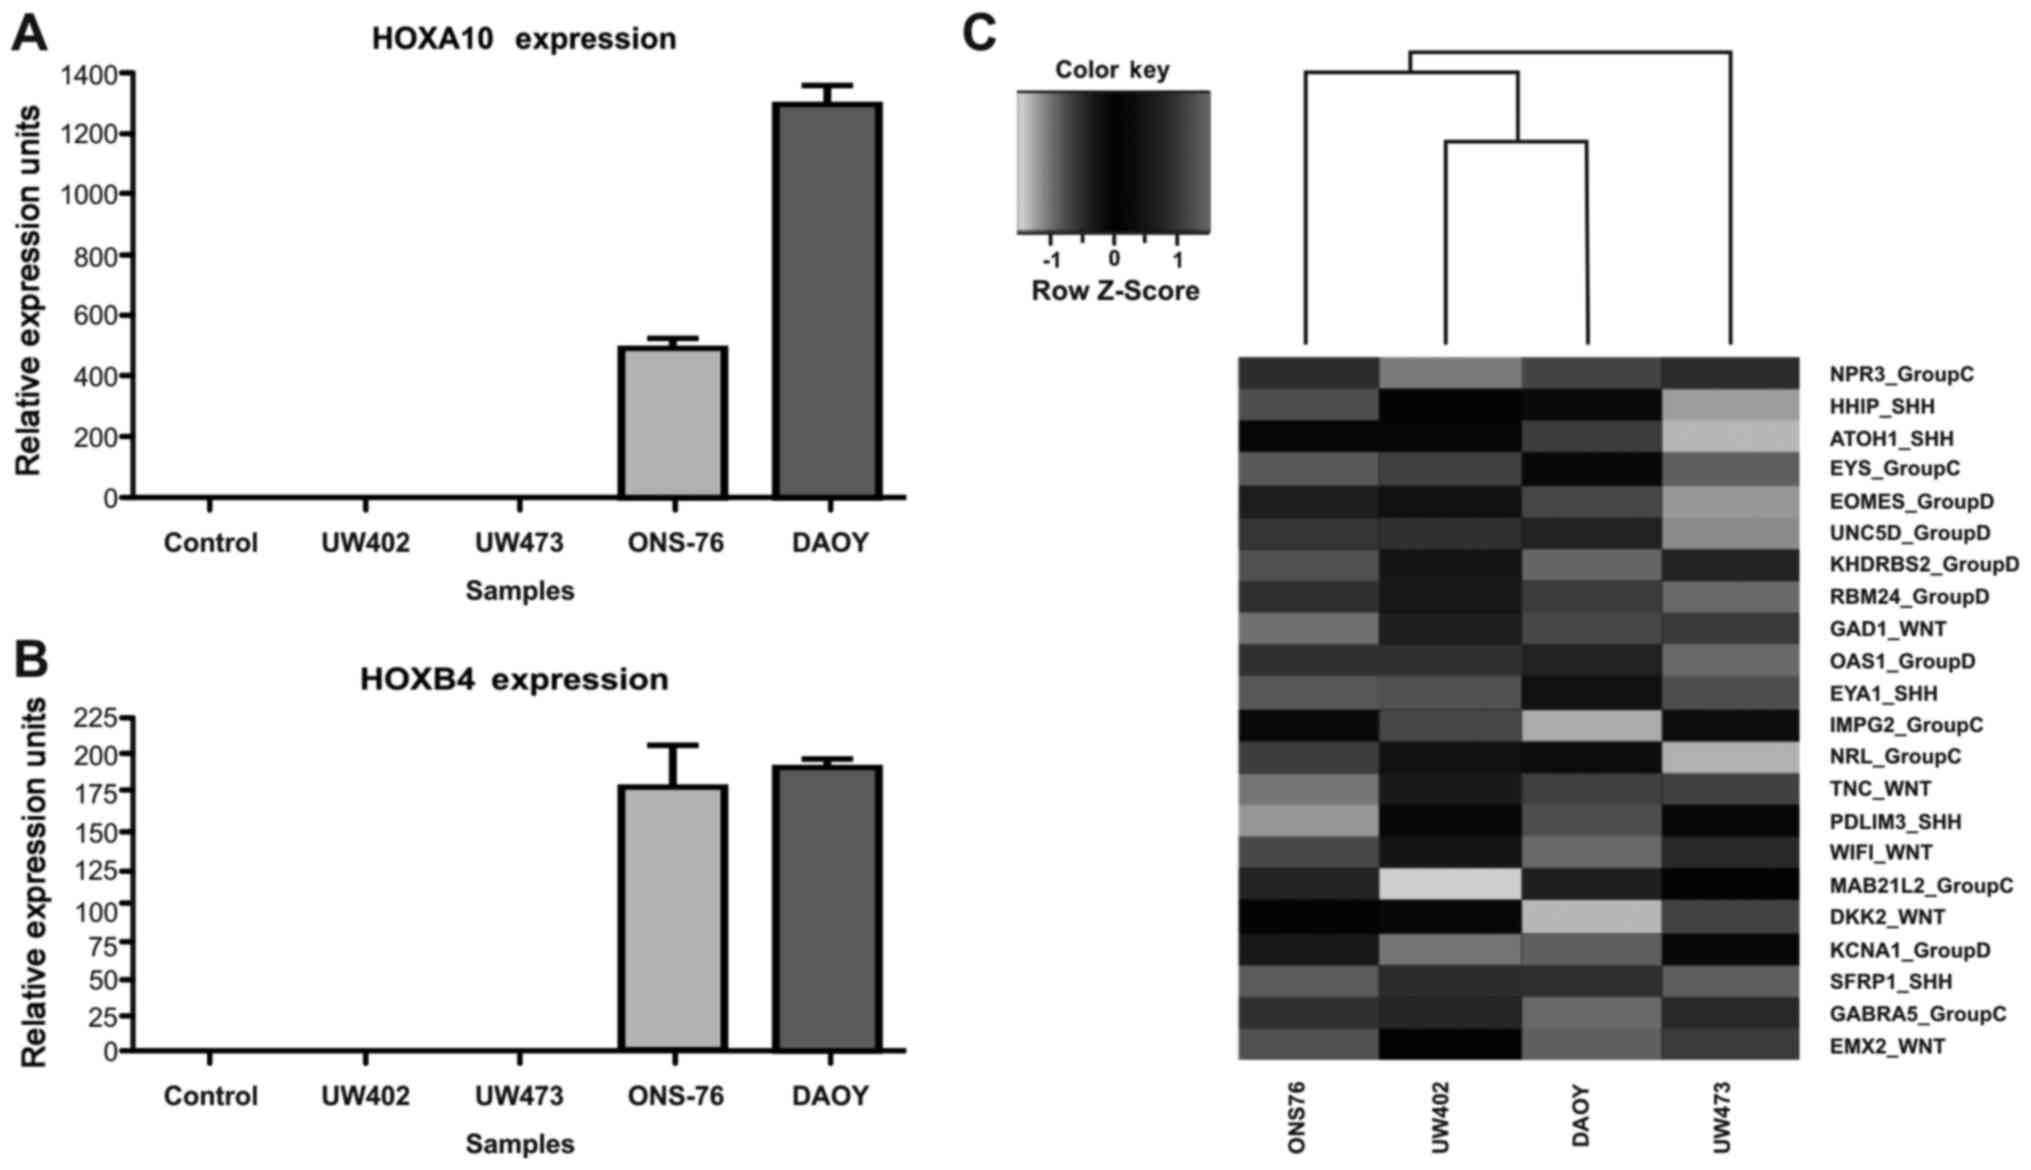
We validated the microarray data of HOXA10
and HOXB4 genes and compared gene expression levels by
RT-qPCR in these four MB cell lines and control cells. As seen from
Fig. 2A and B, HOXA10 and
HOXB4 are upregulated in ONS-76 and DAOY, consistent with
the results from the microarray analysis. The analysis showed that
HOXA10 and HOXB4 transcripts are not expressed in
primary cerebellum cells. Previous studies by Takahashi et
al (15) and Hutlet et
al (16) have demonstrated the
absence of HOXA10 expression in human and mouse cerebellum
tissues. These authors also showed the expression of HOX genes
belonging to the 8 paralogy groups (PG1-8), which includes HOXB4,
but not HOXA10. Therefore, one possible explanation for the absence
of the HOXB4 expression in our primary cerebellum culture
could be due to the differences between tissues and isolated cells.
In cell therapy studies differences in gene expression between
tissues and isolated cells have been previously observed (40,50).
In our analysis of cell lines, HOXA10 transcripts are not
expressed in two of the MB cell lines, UW402 and UW473. In the
ONS-76 and DAOY cell lines, the observed expression levels of
HOXA10 are 502.4±16.07 and 1305±22.42 URE, respectively
(Fig. 2A). As regards the
HOXB4 transcripts, they are expressed at low level in the
UW402 and UW473 cell lines 1.05±0.16 URE and 1.072±0.33 URE,
respectively. In the ONS-76 and DAOY cell lines, the expression
levels of HOXB4 transcripts are 178.4±15.85 URE and
192.5±1.97 URE, respectively (Fig.
2B).
To better understand the classification of these
four MB cell lines, we examine the expression levels of 22
signature genes proposed by Northcott et al (6) for molecular characterization of MB
subgroups (Shh, Wnt, group C and group D). As shown
Fig. 2C, we observed that under
our culture conditions, in the DAOY cell line two Shh
markers (EYA1 and PDL) but also the Wnt marker
(WIF1) and the group C marker (GABRA5) are expressed.
In the ONS-76 cell line the Shh marker (HHIP) and the
group C markers (MAB21L2, EYS and NPR3) are
expressed. On the other hand, in the UW473 cell line, genes from
the four subgroups [GAD1 (from WNT), EYA1 [from
Shh], EYS and NPR3 (from group C)] and
OAS1 and RBM24 (from group D) are expressed and in
the UW402 cell line genes from four subgroups [TNC and
GAD1 (from Wnt), SFRP1 (from Shh),
IMPG2 (from group C) and EOMES (from group D)]
(Fig. 2C) are expressed.
Next, we investigated whether or not the
HOXA10 gene has a direct effect on the in vivo
tumorigenic potential and on the in vitro proliferative and
migration potential of DAOY cell line by knockdown of this
transcript. We also investigated whether or not HOXB4
transcripts have a direct effect on the in vivo and the
in vitro properties in UW473 cell line after overexpression
of this gene.
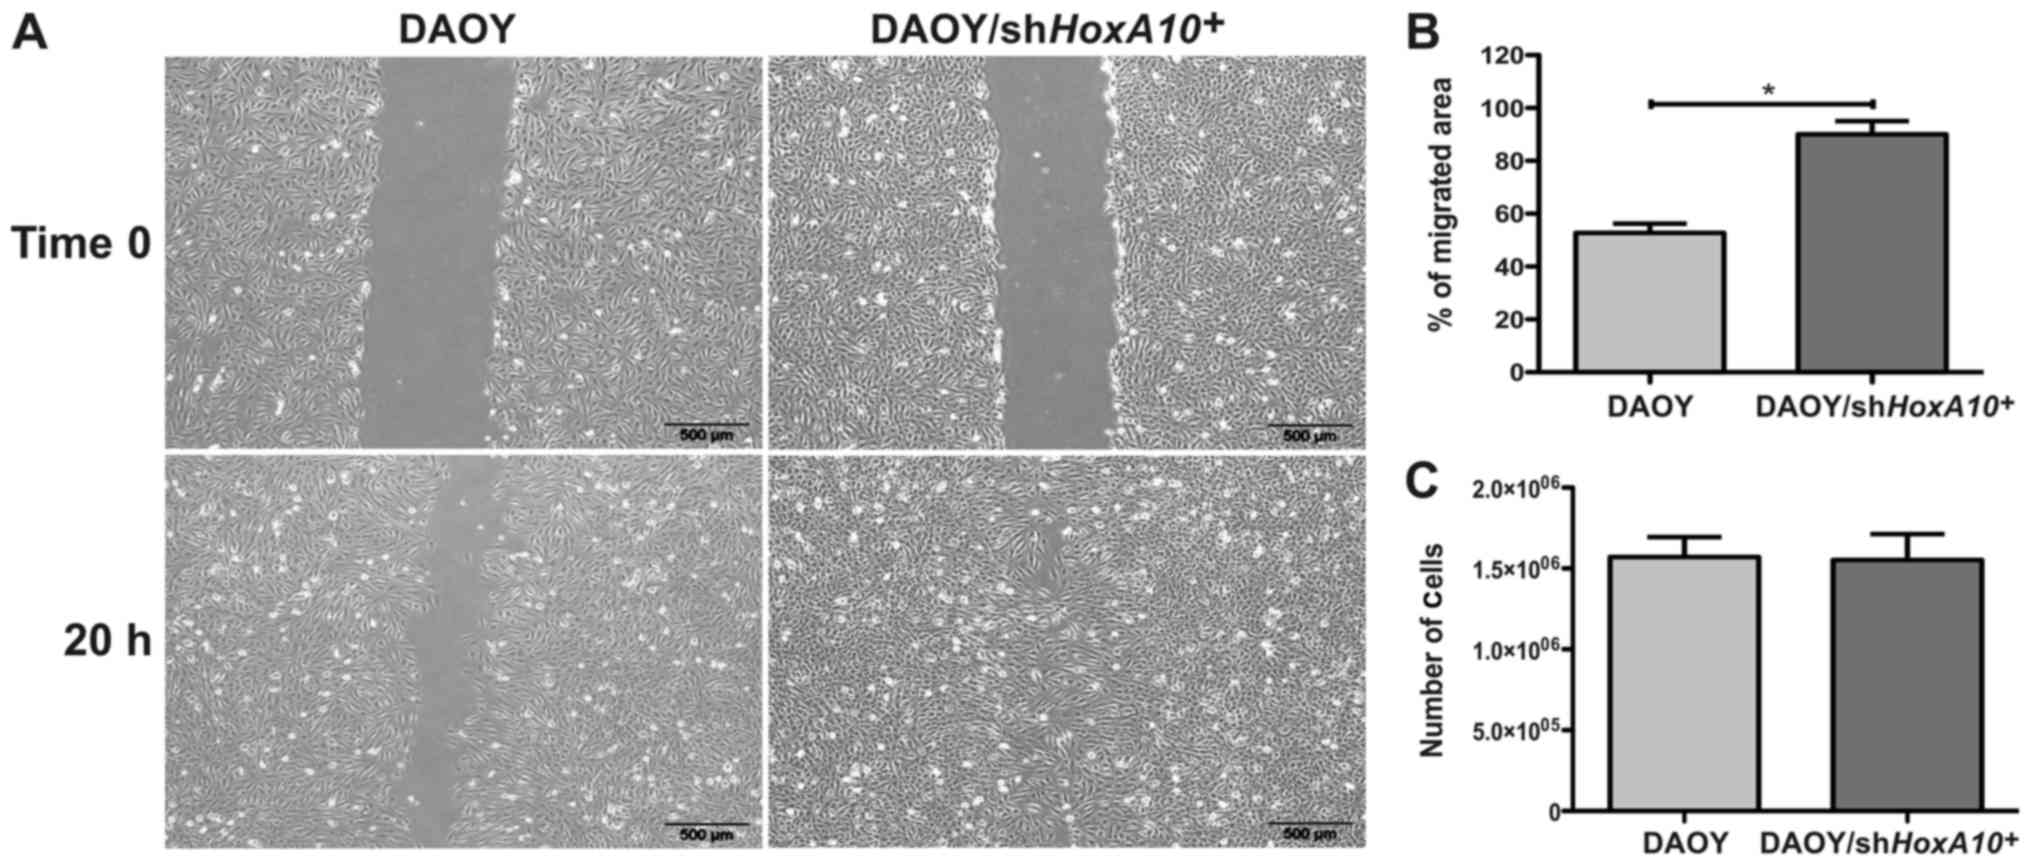
HOXA10 knockdown increases the migration
potential but does not affect the proliferative potential of the
DAOY medulloblastoma cell line
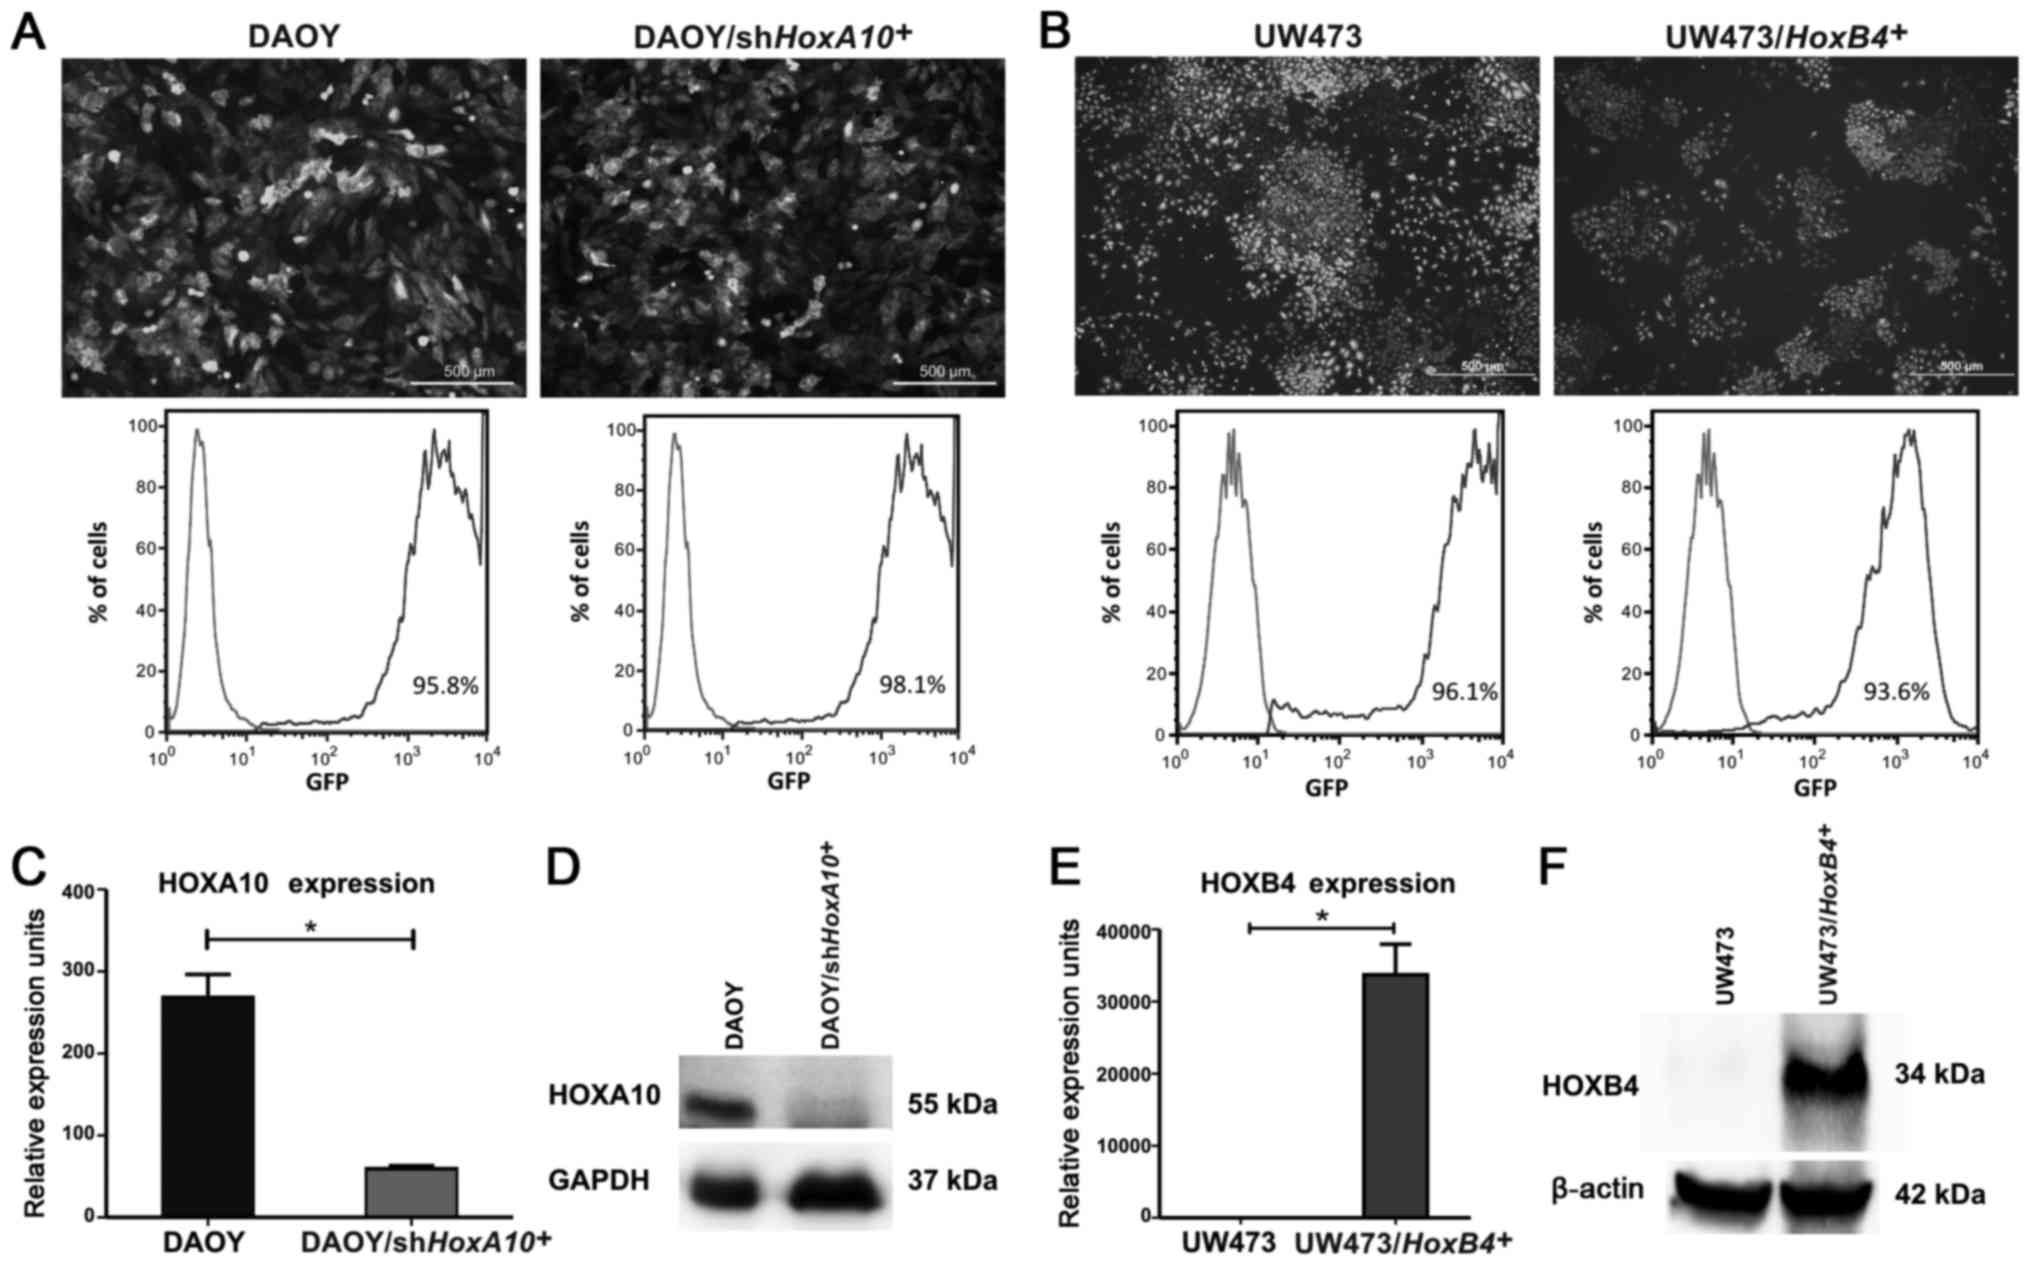
The HOXA10 gene was silenced in the DAOY
cell line by shHOXA10 and an empty vector was used as
control. The transduction efficiency was evaluated by fluorescence
microscopy and flow cytometry, which showed that >95% of
DAOY/shHOXA10+ cells were GFP+
(Fig. 3A). The HOXA10
knockdown was confirmed; the HOXA10 mRNA levels were reduced
by 78% in comparison with the DAOY-control cells (268.1±16.25 vs.
59.20±2.1 URE) (P=0.0002) (Fig.
3C). The HOXA10 protein levels were also reduced in
DAOY/shHOXA10+ cells (Fig. 3D). Analyzing the migration
potential, the DAOY/shHOXA10+ cells displayed
showed a migrated area 37±8% bigger when compared to DAOY-control
cells (P=0.0046) (Fig. 4A and B).
However, no difference was observed in the proliferative potential
in which DAOY/shHOXA10+ and DAOY/control cells
showed a similar amount of viable cells after 120 h of cell culture
(P=0.868) (Fig. 4C). This result
suggests that the low expression of HOXA10 gene is
associated with an increase in the in vitro migration
potential; however, there is no relationship with the in
vitro proliferative potential of the DAOY medulloblastoma cell
line.
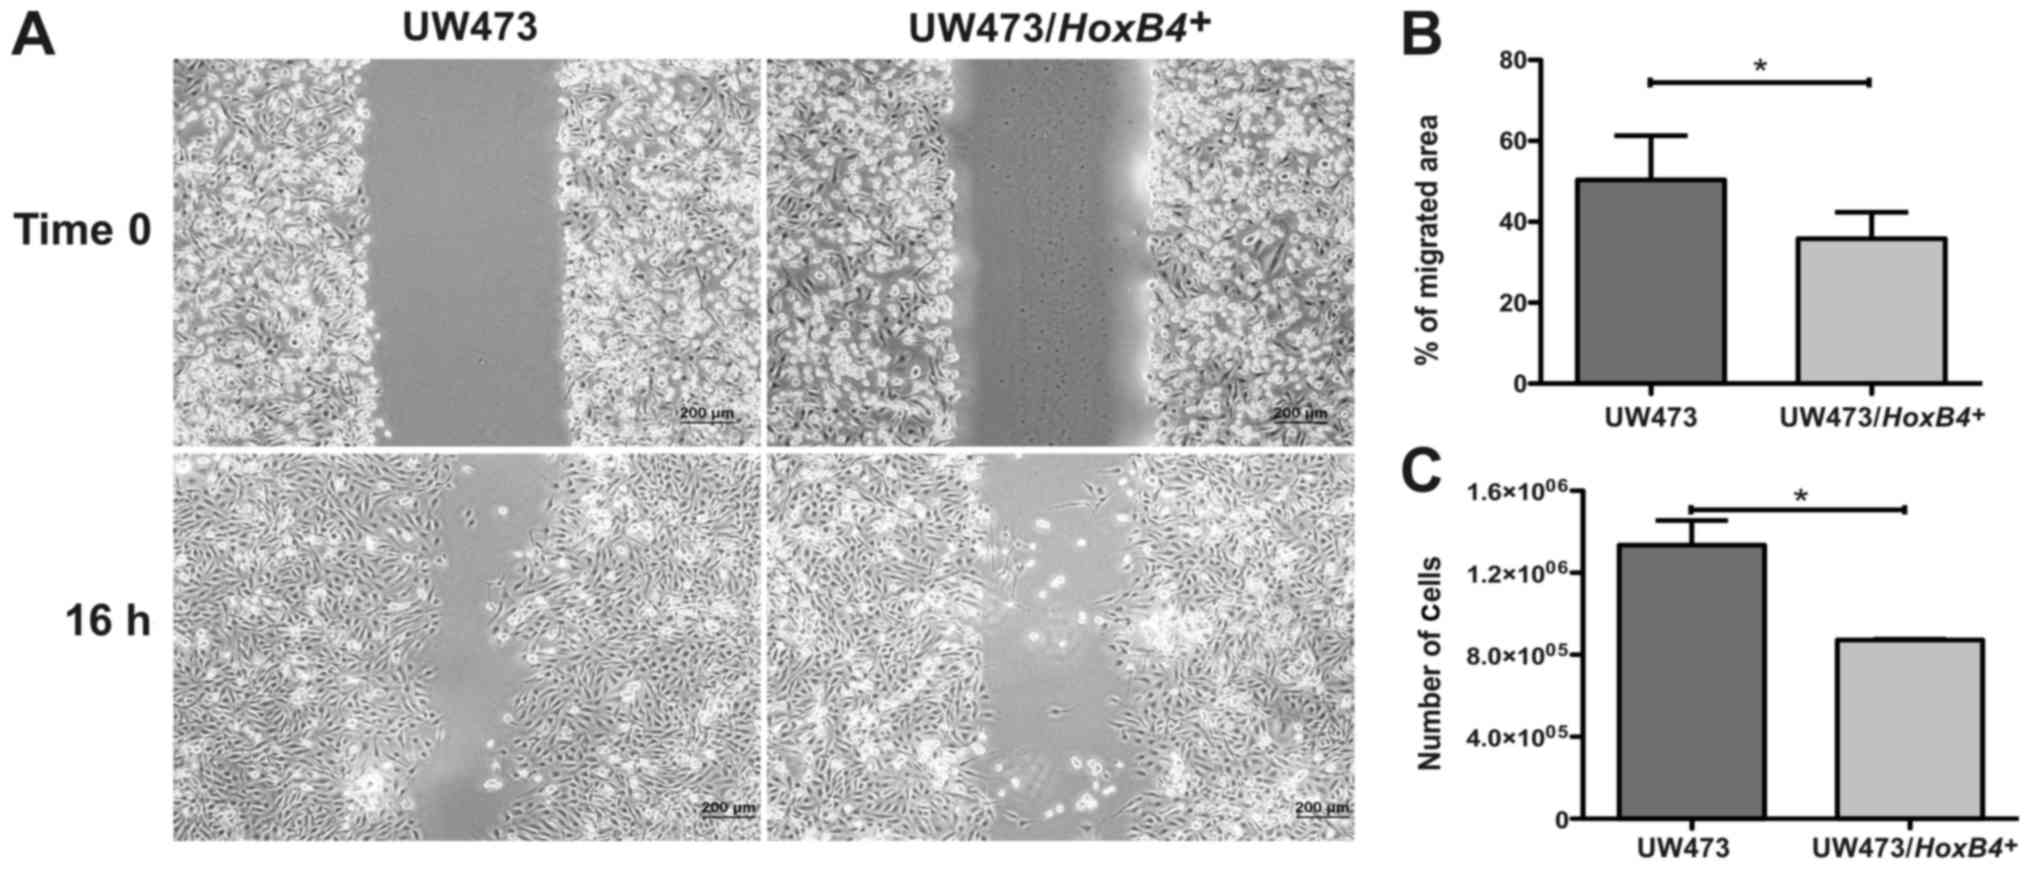
HOXB4 overexpression decreases the
proliferative and migration potential of the UW473 medulloblastoma
cell line
The HOXB4 gene was overexpressed in the
UW473 cell line and the transduction efficiency was evaluated by
fluorescence microscopy and flow cytometry, which showed that
>93% of cells were GFP+ in
UW473/HOXB4+ and UW473-control cells (Fig. 3B). We also compared gene expression
levels of HOXB4 by qPCR in UW473-control cells and in
UW473/HOXB4+ cells. We observed that in
UW473-control cells HOXB4 mRNA is present at a very low
level (1.05±0.69 URE). However, in UW493/HOXB4+
cells the expression level of HOXB4 is 33.735±2.971 URE (P=0.0077)
(Fig. 3E and F). Assessing the
migration potential, the UW473/HOXB4+ cell line
showed a migrated area 32±15% smaller when compared to the
UW473-control cells (P=0.033) (Fig. 5A
and B). The UW473/HOXB4+ cells line also
showed a proliferative potential 34±6% lower compared to the
UW473-control cells (P=0.032; Fig.
5C). These results suggest that the high expression of the
HOXB4 gene is associated with a decrease in the in
vitro proliferative and migration potential of the UW473
medulloblastoma cell line.
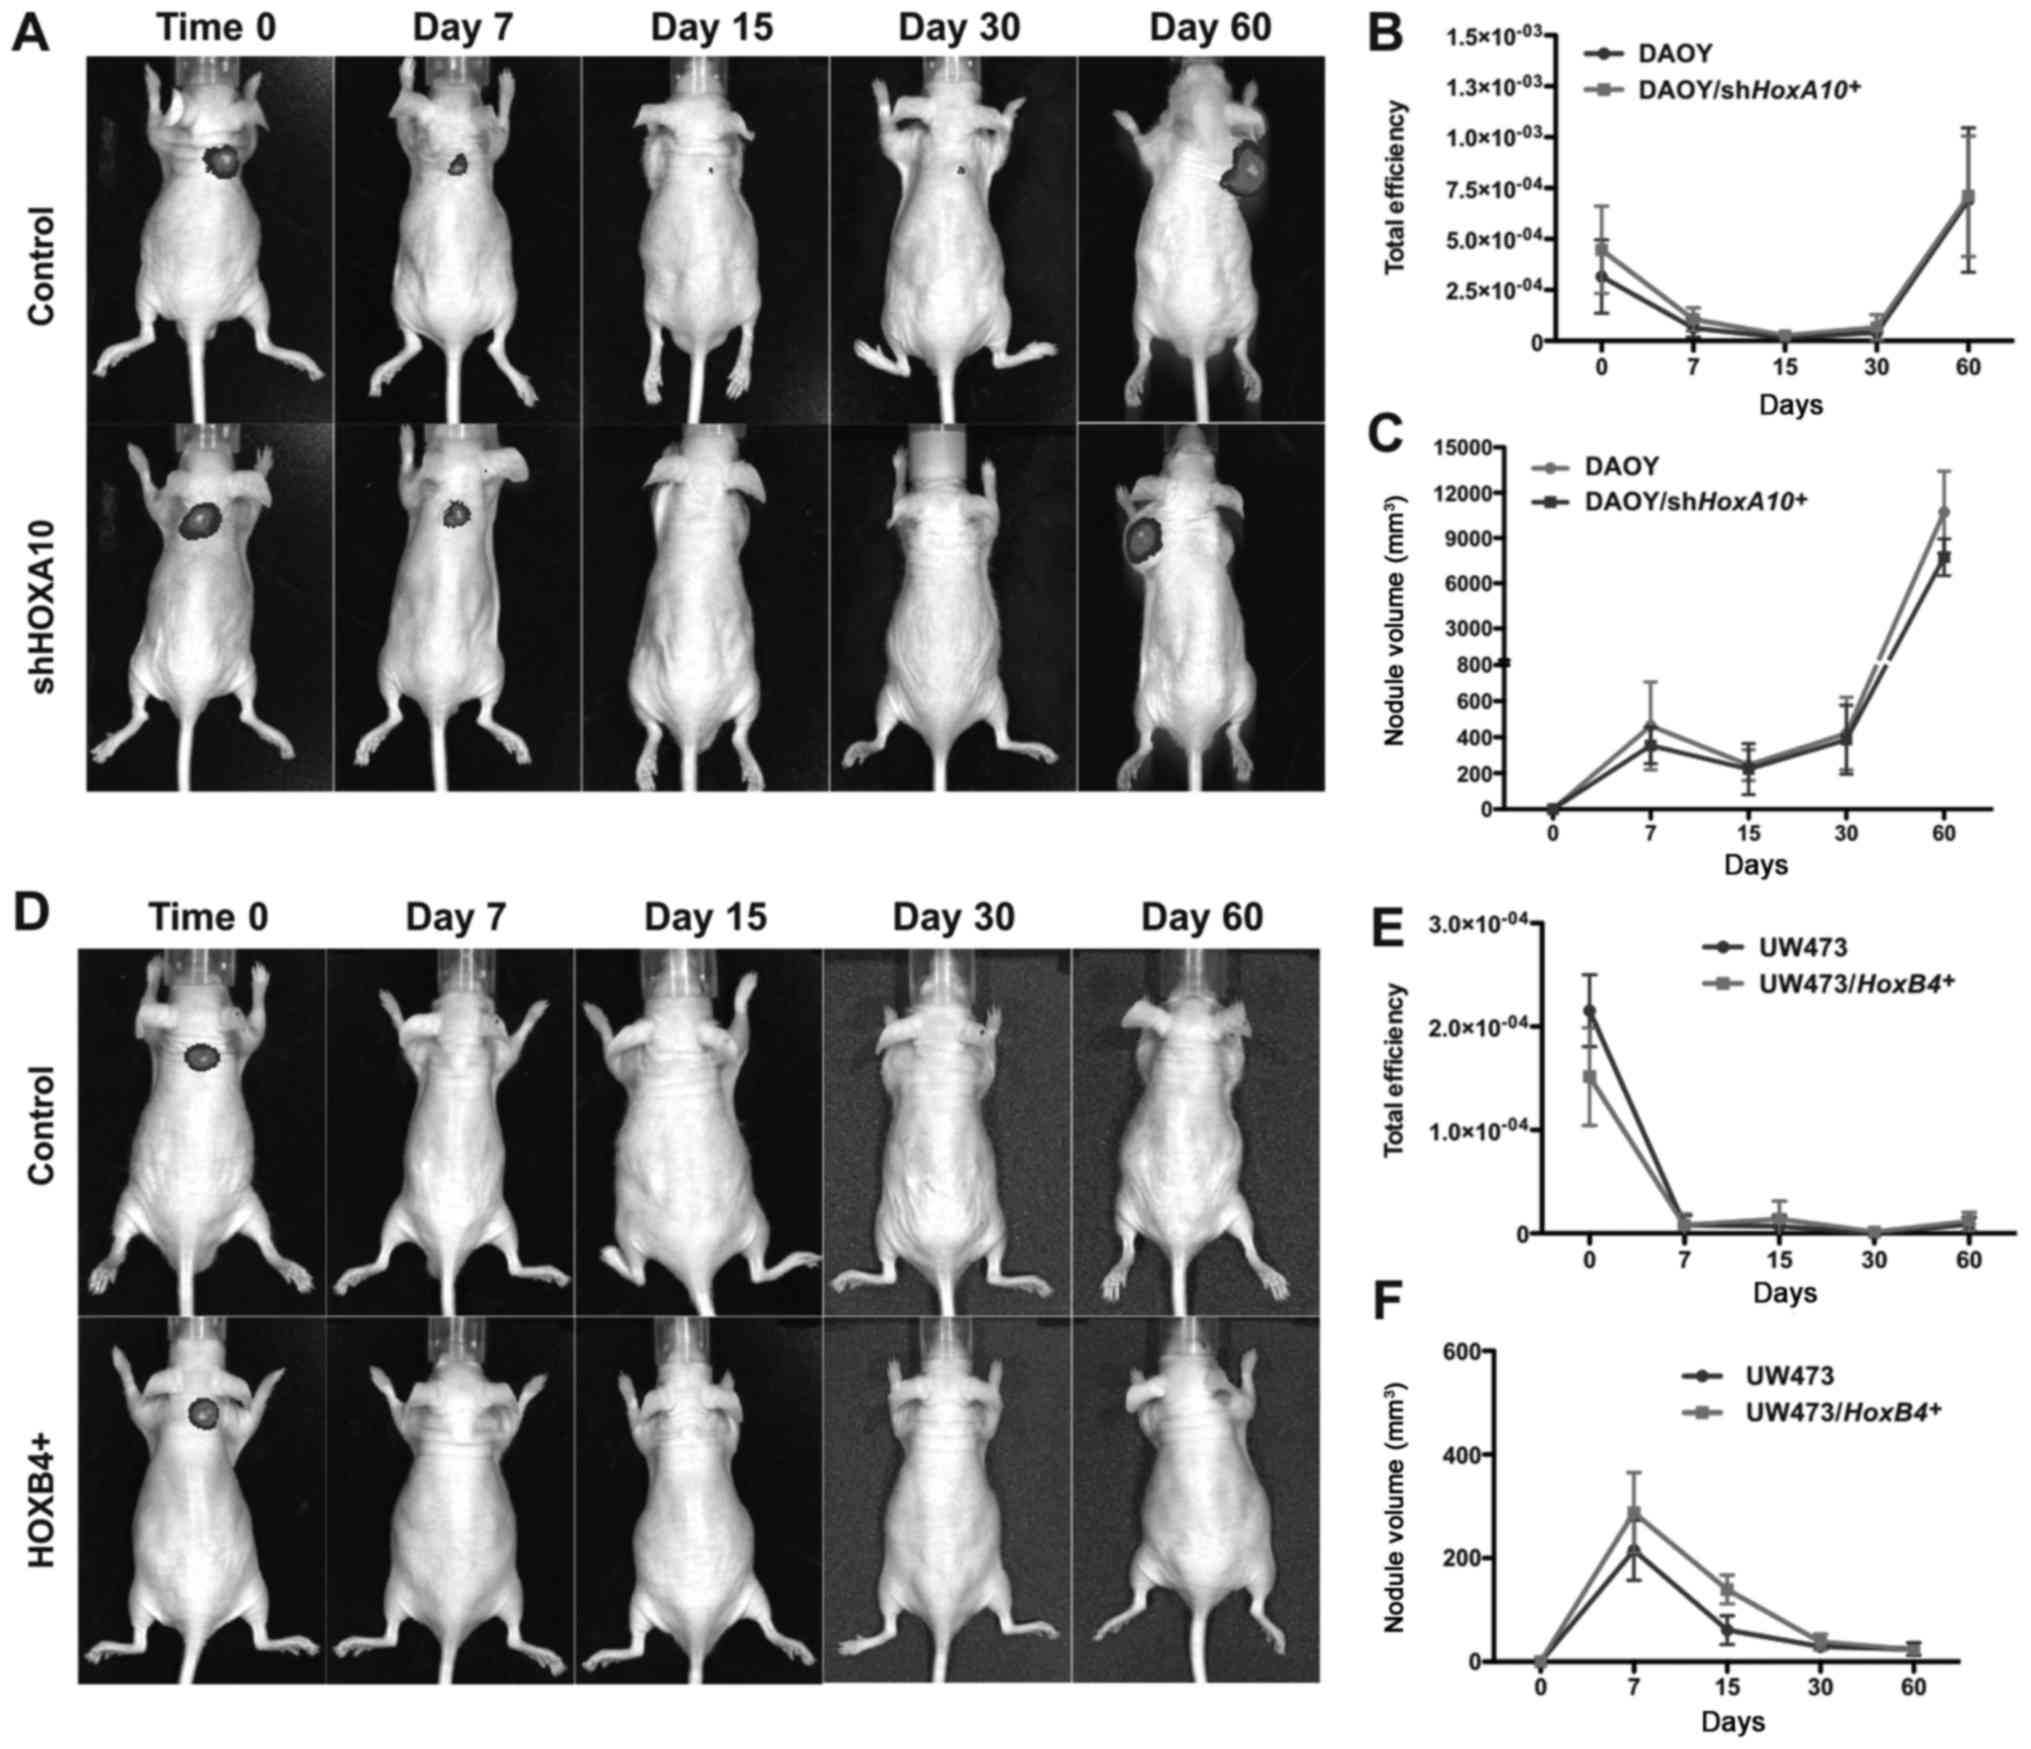
HOXA10 gene silencing and HOXB4 gene
overexpression do not affect the tumorigenic potential of
medulloblastoma cell lines
The effect of HOXA10 gene inhibition and
HOXB4 gene overexpression on the tumorigenic potential of
medulloblastoma cell lines was evaluated.
DAOY/shHOXA10+, UW473/HOXB4+,
DAOY-control and UW473-control cells were injected subcutaneously
in mice and the GFP fluorescence intensity and tumor volume were
monitored for a period of 7, 15, 30 and 60 days. After 60 days, the
GFP fluorescence intensity (Fig. 6A and B) and tumor volume (Fig. 6C) were similar in DAOY-control and
DAOY/shHOXA10+ cell lines with both cell groups
giving rise to tumor nodules. No formation of tumor nodules was
observed in either UW473-control or UW473/HOXA10+
cell lines, GFP fluorescence intensity (Fig. 6D and E) and tumor volume (Fig. 6F) were similar in both cell groups.
These results demonstrate that the modulation of HOXA10 and
HOXB4 gene expression did not change the tumorigenic
potential of these medulloblastoma cell lines in nude mice.
Discussion
This study evaluated the differences in aberrant
upregulated HOX gene expression among the UW402, UW473, DAOY
and ONS-76 human medulloblastoma cell lines and investigated the
role of two HOX genes (HOXA10 and HOXB4) in
the in vitro proliferative and migration potential and in
vivo tumorigenic potential of these cell lines. Moreover,
medulloblastoma is a heterogeneous disease and 22 transcripts have
been used to stratify MB subgroups (6). Therefore, in order to understand
these differences according to MB subtypes we compared the 22
transcript signatures in these MB-derived cell lines.
This study shows that different groups of
HOX genes are differentially expressed according to
MB-derived cell line. We identify 6 HOX genes (HOXB9,
HOXB13, HOXC6, HOXC13, HOXD10 and
HOXD11) whose expression levels are significant upregulated
between UW402 and UW473 cell lines and normal cerebellum primary
cells; and 24 HOX genes (HOXA2, HOXA3,
HOXA4, HOXA5, HOXA6, HOXA7,
HOXA9, HOXA10, HOXA13, HOXB2,
HOXB4, HOXB5, HOXB6, HOXB7,
HOXB9, HOXC4, HOXC5, HOXC6,
HOXC9, HOXC10, HOXC13, HOXD3,
HOXD10 and HOXD11) whose expression levels are
significantly different between DAOY and ONS-76 cell lines and
normal cerebellum primary cells.
To the best of our knowledge this is the first
study that analyzes the expression pattern of all 39 HOX
genes in MB-derived cell lines. HOX mRNA expression has been
detected in MB tissues, Chakravadhanula et al (30) examined 10 MB tissues and studied
the expression levels of 21 HOX genes. They showed that 10
HOX genes (HOXC4-6, HOXC8-10, HOXD3-4,
HOXD8 and HOXD10) were significantly upregulated in
medulloblastoma tissues when compared to control tissues. Also,
Bodey et al (31) observed
by immunocytochemistry techniques that HOXB3, HOXB4
and HOXC6 proteins were expressed in medulloblastoma
tissues. In this study some of these HOX genes are also
significantly upregulated. Two of them (HOXC6 and HOXD10) are
significantly upregulated in these four MB cell lines (UW473,
UW402, DAOY and ONS-76) and another five (HOXC4-5, HOXC9-10 and
HOXD3) were identified as significantly upregulated in DAOY and
ONS-76 cells.
The noticeable change in expression levels of most
HOX genes in DAOY and ONS-76 cell lines compared with UW402 and
UW473 merits attention. In order to determine whether differences
in HOX deregulation are related to MB subtype we used the
22-transcript predictor in these 4 MB cell lines. We observed that
UW473 and UW402 cell lines express genes from all four MB groups,
and DAOY and ONS-76 previously classified as SHH subtype (38) also express genes from the other MB
subtypes. DAOY expresses SHH, WNT and group C markers and ONS-76
expresses SHH and group C markers. These results suggest that under
our cell culture conditions these cell lines cannot be classified
as belonging to a unique molecular subtype and therefore the
interesting differences in HOX pattern expression among
these four MB cell lines cannot be directly associated with MB
subtype. A similar effect has been observed in the D238-MB cell
line, which has been classified as group 4 or group 3 (51,52).
Among the HOX genes significantly
overexpressed in DAOY and ONS-76 cell lines compared to the UW402
and UW473 cell lines we selected HOXA10 and HOXB4 as mentioned
earlier. In mouse medulloblastoma (MB)-derived cancer stem cell
(CSC) the role of miR-135a, which binds to HOXA10
3'UTR in other cancers, was investigated (53,54).
Hemmesi et al (54) showed
that induced overexpression of miR-135a in mouse MB-derived
CSC was responsible for a significant decrease in the expression of
HOXA10 at mRNA level, but not at the protein level.
Moreover, considering that miR-135a restoration inhibits
tumor progression in CSC-derived MBs with no change in
HOXA10 protein level, which suggests that in MB-CSCs
HOXA10 can contribute to the malignant properties of MB
cells depending on genetic background. HOXA10 is also one of
the HOX genes, which shows a markedly higher expression in
glioblastoma-derived neurospheres and was associated with worse
outcome in patients assigned to TMZ/RT-TMZ therapy (48). From our initial analysis which
showed that HOXA10 is differentially overexpressed in DAOY
and ONS-76 cell lines but not in UW402 and UW473 cell lines, we
decided to investigate whether knockdown of HOXA10 in DAOY
cell line will result in changes in vitro migration and
proliferation potential changes and in vivo tumor growth. We
observe that knockdown of HOXA10 does in fact lead to an
increase in the in vitro migration potential of the DAOY
medulloblastoma cell line, however, there was no relationship
between the HOXA10 expression level and the in vitro
proliferative and the in vivo tumorigenic potential of that
cell line. Altogether, although the exact mechanism that accounts
for these effects in MB is unknown, these data might indicate that
HOXA10 could contain different epigenetic regulators and has
a role in several physiological processes.
Regarding the HOXB4 gene, we investigated
whether or not overexpression of HOXB4 in the UW473 cell
line promotes proliferation, migration and in vivo MB
tumorigenesis. In the present study, we showed that the
HOXB4 expression level is associated with a decrease in the
in vitro proliferative and migration potential of the
UW473/HOXB4+ cell line, however, it did not
influence the in vivo tumorigenic potential of that cell
line. It was previously known that HOXB4 is expressed in MB
tissues (31) but the effect of
this gene in medulloblastogenesis was not investigated. A recent
study by Vo et al (32)
measured RNA levels of HOXB4 gene in MB cells after
gene-editing systems to induce loss-of-function mutation in
Ezh2. In these Ezh2-mutated cells, HOXB4 was
expressed more highly and the tumor became more aggressive.
Ezh2 is an epigenetic regulator of HOX expression as
a member of polycomb-repressive complex 2 (PRC2) together with EED,
SUZ12 and other accessory proteins. Altogether, these results
suggest that in UW473/HOXB4+ cells additional
changes at the genetic or epigenetic levels are required to
inactivate essential genes necessary for normal cellular
development and function and to induce tumorigenesis.
To conclude, the present study was motivated by an
earlier study of the importance of MLL2 in MB and the observation
that MLL2 is an epigenetic regulator of the HOX gene. From the
results of the microarray analysis presented (which were validated
by RT-qPCR), we selected two HOX genes for functional analysis
in vitro and in a mouse model. The in vitro analysis
showed that these genes could be involved in migration and
proliferative potential. The in vivo study with mice was not
conclusive, which may be due to a variety of different causes.
Other members of the HOX gene family could be involved. Another
possibility is that MLL2 deletions have an effect on MB, but via
other genes for example the MB oncogene named OTX2 or β-catenin
known to regulate Wnt pathways, and which is implicated in one of
the medulloblastoma subtype. Studies similar to the one we have
undertaken should be extended to other genes and could help
identify potential drug targets.
Acknowledgments
We thank the Conselho Nacional de Desenvolvimento
Científico e Tecnológico (CNPq) (Process no. 310619/2012-2) and
Fundação de Amparo à Pesquisa do Estado de São Paulo (FAPESP)
(Process nos. 2011/20829-4 and 2011/18664-7) for the financial
support for the present study. We also thank Sandra Navarro
Bresciani of the Regional Blood Center of Ribeirão Preto-FMRP-USP,
Brazil for help with the figures.
References
|
1
|
Gilbertson RJ and Ellison DW: The origins
of medulloblastoma subtypes. Annu Rev Pathol. 3:341–365. 2008.
View Article : Google Scholar
|
|
2
|
Louis DN, Ohgaki H, Wiestler OD, Cavenee
WK, Burger PC, Jouvet A, Scheithauer BW and Kleihues P: The 2007
WHO classification of tumours of the central nervous system. Acta
Neuropathol. 114:97–109. 2007. View Article : Google Scholar : PubMed/NCBI
|
|
3
|
Garrè ML, Cama A, Bagnasco F, Morana G,
Giangaspero F, Brisigotti M, Gambini C, Forni M, Rossi A, Haupt R,
et al: Medulloblastoma variants: Age-dependent occurrence and
relation to Gorlin syndrome - a new clinical perspective. Clin
Cancer Res. 15:2463–2471. 2009. View Article : Google Scholar
|
|
4
|
Ramaswamy V, Remke M, Bouffet E, Bailey S,
Clifford SC, Doz F, Kool M, Dufour C, Vassal G, Milde T, et al:
Risk stratifi-cation of childhood medulloblastoma in the molecular
era: The current consensus. Acta Neuropathol. 131:821–831. 2016.
View Article : Google Scholar : PubMed/NCBI
|
|
5
|
Northcott PA, Dubuc AM, Pfister S and
Taylor MD: Molecular subgroups of medulloblastoma. Expert Rev
Neurother. 12:871–884. 2012. View Article : Google Scholar : PubMed/NCBI
|
|
6
|
Northcott PA, Shih DJ, Remke M, Cho YJ,
Kool M, Hawkins C, Eberhart CG, Dubuc A, Guettouche T, Cardentey Y,
et al: Rapid, reliable, and reproducible molecular sub-grouping of
clinical medulloblastoma samples. Acta Neuropathol. 123:615–626.
2012. View Article : Google Scholar :
|
|
7
|
Gibson P, Tong Y, Robinson G, Thompson MC,
Currle DS, Eden C, Kranenburg TA, Hogg T, Poppleton H, Martin J, et
al: Subtypes of medulloblastoma have distinct developmental
origins. Nature. 468:1095–1099. 2010. View Article : Google Scholar : PubMed/NCBI
|
|
8
|
Coluccia D, Figuereido C, Isik S, Smith C
and Rutka JT: Medulloblastoma: Tumor biology and relevance to
treatment and prognosis paradigm. Curr Neurol Neurosci Rep.
16:432016. View Article : Google Scholar : PubMed/NCBI
|
|
9
|
Khatua S: Evolving molecular era of
childhood medulloblastoma: Time to revisit therapy. Future Oncol.
12:107–117. 2016. View Article : Google Scholar
|
|
10
|
Parsons DW, Li M, Zhang X, Jones S, Leary
RJ, Lin JC, Boca SM, Carter H, Samayoa J, Bettegowda C, et al: The
genetic landscape of the childhood cancer medulloblastoma. Science.
331:435–439. 2011. View Article : Google Scholar :
|
|
11
|
Roy DM, Walsh LA and Chan TA: Driver
mutations of cancer epigenomes. Protein Cell. 5:265–296. 2014.
View Article : Google Scholar : PubMed/NCBI
|
|
12
|
Schuettengruber B, Martinez AM, Iovino N
and Cavalli G: Trithorax group proteins: Switching genes on and
keeping them active. Nat Rev Mol Cell Biol. 12:799–814. 2011.
View Article : Google Scholar : PubMed/NCBI
|
|
13
|
Wang VY and Zoghbi HY: Genetic regulation
of cerebellar development. Nat Rev Neurosci. 2:484–491. 2001.
View Article : Google Scholar : PubMed/NCBI
|
|
14
|
Ruddle FH: The role of Hox and Dlx gene
cluster in evolution and development. Inborn Errors of Development.
Epstein CJ, Erickson RP and Wynshaw-Boris A: Oxford University
Press; New York: pp. 653–658. 2008
|
|
15
|
Takahashi Y, Hamada J, Murakawa K, Takada
M, Tada M, Nogami I, Hayashi N, Nakamori S, Monden M, Miyamoto M,
et al: Expression profiles of 39 HOX genes in normal human adult
organs and anaplastic thyroid cancer cell lines by quantitative
real-time RT-PCR system. Exp Cell Res. 293:144–153. 2004.
View Article : Google Scholar : PubMed/NCBI
|
|
16
|
Hutlet B, Theys N, Coste C, Ahn MT,
Doshishti-Agolli K, Lizen B and Gofflot F: Systematic expression
analysis of Hox genes at adulthood reveals novel patterns in the
central nervous system. Brain Struct Funct. 221:1223–1243. 2016.
View Article : Google Scholar
|
|
17
|
Mallo M and Alonso CR: The regulation of
Hox gene expression during animal development. Development.
140:3951–3963. 2013. View Article : Google Scholar : PubMed/NCBI
|
|
18
|
Shah N and Sukumar S: The Hox genes and
their roles in oncogenesis. Nat Rev Cancer. 10:361–371. 2010.
View Article : Google Scholar : PubMed/NCBI
|
|
19
|
Quinonez SC and Innis JW: Human HOX gene
disorders. Mol Genet Metab. 111:4–15. 2014. View Article : Google Scholar
|
|
20
|
Wu X, Chen H, Parker B, Rubin E, Zhu T,
Lee JS, Argani P and Sukumar S: HOXB7, a homeodomain protein, is
overexpressed in breast cancer and confers epithelial-mesenchymal
transition. Cancer Res. 66:9527–9534. 2006. View Article : Google Scholar : PubMed/NCBI
|
|
21
|
Liao WT, Jiang D, Yuan J, Cui YM, Shi XW,
Chen CM, Bian XW, Deng YJ and Ding YQ: HOXB7 as a prognostic factor
and mediator of colorectal cancer progression. Clin Cancer Res.
17:3569–3578. 2011. View Article : Google Scholar : PubMed/NCBI
|
|
22
|
Wang Y, Dang Y, Liu J and Ouyang X: The
function of homeobox genes and lncRNAs in cancer. Oncol Lett.
12:1635–1641. 2016.PubMed/NCBI
|
|
23
|
Rodrigues MF, Esteves CM, Xavier FC and
Nunes FD: Methylation status of homeobox genes in common human
cancers. Genomics. 108:185–193. 2016. View Article : Google Scholar : PubMed/NCBI
|
|
24
|
Costa BM, Smith JS, Chen Y, Chen J,
Phillips HS, Aldape KD, Zardo G, Nigro J, James CD, Fridlyand J, et
al: Reversing HOXA9 oncogene activation by PI3K inhibition:
Epigenetic mechanism and prognostic significance in human
glioblastoma. Cancer Res. 70:453–462. 2010. View Article : Google Scholar : PubMed/NCBI
|
|
25
|
Tabuse M, Ohta S, Ohashi Y, Fukaya R,
Misawa A, Yoshida K, Kawase T, Saya H, Thirant C, Chneiweiss H, et
al: Functional analysis of HOXD9 in human gliomas and glioma cancer
stem cells. Mol Cancer. 10:602011. View Article : Google Scholar : PubMed/NCBI
|
|
26
|
Se YB, Kim SH, Kim JY, Kim JE, Dho YS, Kim
JW, Kim YH, Woo HG, Kim SH, Kang SH, et al: Underexpression of
HOXA11 is associated with treatment resistance and poor prognosis
in glioblastoma. Cancer Res Treat. 49:387–398. 2017. View Article : Google Scholar :
|
|
27
|
Munthe S, Sørensen MD, Thomassen M, Burton
M, Kruse TA, Lathia JD, Poulsen FR and Kristensen BW: Migrating
glioma cells express stem cell markers and give rise to new tumors
upon xenografting. J Neurooncol. 130:53–62. 2016. View Article : Google Scholar : PubMed/NCBI
|
|
28
|
Manohar CF, Salwen HR, Furtado MR and Cohn
SL: Up-regulation of HOXC6, HOXD1, and HOXD8 homeobox gene
expression in human neuroblastoma cells following chemical
induction of differentiation. Tumour Biol. 17:34–47. 1996.
View Article : Google Scholar : PubMed/NCBI
|
|
29
|
Zhang X, Hamada J, Nishimoto A, Takahashi
Y, Murai T, Tada M and Moriuchi T: HOXC6 and HOXC11 increase
transcription of S100beta gene in BrdU-induced in vitro
differentiation of GOTO neuroblastoma cells into Schwannian cells.
J Cell Mol Med. 11:299–306. 2007. View Article : Google Scholar : PubMed/NCBI
|
|
30
|
Chakravadhanula M, Ozols VV, Hampton CN,
Zhou L, Catchpoole D and Bhardwaj RD: Expression of the HOX genes
and HOTAIR in atypical teratoid rhabdoid tumors and other pediatric
brain tumors. Cancer Genet. 207:425–428. 2014. View Article : Google Scholar : PubMed/NCBI
|
|
31
|
Bodey B, Bodey B Jr, Siegel SE and Kaiser
HE: Immunocytochemical detection of the homeobox B3, B4, and C6
gene products in childhood medulloblastomas/primitive
neuroectodermal tumors. Anticancer Res. 20:1769–1780.
2000.PubMed/NCBI
|
|
32
|
Vo BT, Li C, Morgan MA, Theurillat I,
Finkelstein D, Wright S, Hyle J, Smith SMC, Fan Y, Wang YD, et al:
Inactivation of Ezh2 upregulates Gfi1 and drives aggressive
Myc-driven group 3 medulloblastoma. Cell Rep. 18:2907–2917. 2017.
View Article : Google Scholar : PubMed/NCBI
|
|
33
|
Margueron R and Reinberg D: The Polycomb
complex PRC2 and its mark in life. Nature. 469:343–349. 2011.
View Article : Google Scholar : PubMed/NCBI
|
|
34
|
Hanahan D and Weinberg RA: Hallmarks of
cancer: The next generation. Cell. 144:646–674. 2011. View Article : Google Scholar : PubMed/NCBI
|
|
35
|
Castro-Gamero AM, Borges KS, Lira RC,
Andrade AF, Fedatto PF, Cruzeiro GA, Silva RB, Fontes AM, Valera
ET, Bobola M, et al: Chromosomal heterogeneity and instability
characterize pediatric medulloblastoma cell lines and affect
neoplastic phenotype. Cytotechnology. 65:871–885. 2013. View Article : Google Scholar : PubMed/NCBI
|
|
36
|
Jacobsen PF, Jenkyn DJ and Papadimitriou
JM: Establishment of a human medulloblastoma cell line and its
heterotransplantation into nude mice. J Neuropathol Exp Neurol.
44:472–485. 1985. View Article : Google Scholar : PubMed/NCBI
|
|
37
|
Yamada M, Shimizu K, Tamura K, Okamoto Y,
Matsui Y, Moriuchi S, Park K, Mabuchi E, Yamamoto K, Hayakawa T, et
al: Establishment and biological characterization of human
medulloblastoma cell lines. No To Shinkei. 41:695–702. 1989.In
Japanese. PubMed/NCBI
|
|
38
|
Ivanov DP, Coyle B, Walker DA and
Grabowska AM: In vitro models of medulloblastoma: Choosing the
right tool for the job. J Biotechnol. 236:10–25. 2016. View Article : Google Scholar : PubMed/NCBI
|
|
39
|
de Oliveira GP, Alves CJ and Chadi G:
Early gene expression changes in spinal cord from
SOD1G93A Amyotrophic Lateral Sclerosis animal model.
Front Cell Neurosci. 7:2162013.
|
|
40
|
Covas DT, Panepucci RA, Fontes AM, Silva
WA Jr, Orellana MD, Freitas MC, Neder L, Santos AR, Peres LC, Jamur
MC, et al: Multipotent mesenchymal stromal cells obtained from
diverse human tissues share functional properties and
gene-expression profile with CD146+ perivascular cells
and fibroblasts. Exp Hematol. 36:642–654. 2008. View Article : Google Scholar : PubMed/NCBI
|
|
41
|
Fontes AM, Melo FU, Greene LJ, Faça VM,
Lin Y, Gerson SL and Covas DT: Production of human factor VIII-FL
in 293T cells using the bicistronic MGMT(P140K)-retroviral vector.
Genet Mol Res. 11:775–789. 2012. View Article : Google Scholar : PubMed/NCBI
|
|
42
|
Albesiano E, Messmer BT, Damle RN, Allen
SL, Rai KR and Chiorazzi N: Activation-induced cytidine deaminase
in chronic lymphocytic leukemia B cells: Expression as multiple
forms in a dynamic, variably sized fraction of the clone. Blood.
102:3333–3339. 2003. View Article : Google Scholar : PubMed/NCBI
|
|
43
|
Ferguson RE, Carroll HP, Harris A, Maher
ER, Selby PJ and Banks RE: Housekeeping proteins: A preliminary
study illustrating some limitations as useful references in protein
expression studies. Proteomics. 5:566–571. 2005. View Article : Google Scholar : PubMed/NCBI
|
|
44
|
Thomé CH, dos Santos GA, Ferreira GA,
Scheucher PS, Izumi C, Leopoldino AM, Simão AM, Ciancaglini P, de
Oliveira KT, Chin A, et al: Linker for activation of T-cell family
member2 (LAT2) a lipid raft adaptor protein for AKT signaling, is
an early mediator of alkylphospholipid anti-leukemic activity. Mol
Cell Proteomics. 11:1898–1912. 2012. View Article : Google Scholar : PubMed/NCBI
|
|
45
|
Palma CS, Grassi ML, Thomé CH, Ferreira
GA, Albuquerque D, Pinto MT, Ferreira Melo FU, Kashima S, Covas DT,
Pitteri SJ, et al: Proteomic analysis of epithelial to mesenchymal
transition (EMT) reveals cross-talk between SNAIL and HDAC1
proteins in breast cancer cells. Mol Cell Proteomics. 15:906–917.
2016. View Article : Google Scholar :
|
|
46
|
Triscott J, Lee C, Foster C, Manoranjan B,
Pambid MR, Berns R, Fotovati A, Venugopal C, O'Halloran K,
Narendran A, et al: Personalizing the treatment of pediatric
medulloblastoma: Polo-like kinase 1 as a molecular target in
high-risk children. Cancer Res. 73:6734–6744. 2013. View Article : Google Scholar : PubMed/NCBI
|
|
47
|
Bobola MS, Silber JR, Ellenbogen RG, Geyer
JR, Blank A and Goff RD: O6-methylguanine-DNA
methyltransferase, O6-benzylguanine, and resistance to
clinical alkylators in pediatric primary brain tumor cell lines.
Clin Cancer Res. 11:2747–2755. 2005. View Article : Google Scholar : PubMed/NCBI
|
|
48
|
Murat A, Migliavacca E, Gorlia T, Lambiv
WL, Shay T, Hamou MF, de Tribolet N, Regli L, Wick W, Kouwenhoven
MC, et al: Stem cell-related 'self-renewal' signature and high
epidermal growth factor receptor expression associated with
resistance to concomitant chemoradiotherapy in glioblastoma. J Clin
Oncol. 26:3015–3024. 2008. View Article : Google Scholar : PubMed/NCBI
|
|
49
|
Kurscheid S, Bady P, Sciuscio D, Samarzija
I, Shay T, Vassallo I, Criekinge WV, Daniel RT, van den Bent MJ,
Marosi C, et al: Chromosome 7 gain and DNA hypermethylation at the
HOXA10 locus are associated with expression of a stem cell related
HOX-signature in glioblastoma. Genome Biol. 16:162015. View Article : Google Scholar : PubMed/NCBI
|
|
50
|
Perkins EJ, Bao W, Guan X, Ang CY,
Wolfinger RD, Chu TM, Meyer SA and Inouye LS: Comparison of
transcriptional responses in liver tissue and primary hepatocyte
cell cultures after exposure to
hexahydro-1,3,5-trinitro-1,3,5-triazine. BMC Bioinformatics.
7(Suppl 4): S222006. View Article : Google Scholar
|
|
51
|
Snuderl M, Batista A, Kirkpatrick ND, Ruiz
de Almodovar C, Riedemann L, Walsh EC, Anolik R, Huang Y, Martin
JD, Kamoun W, et al: Targeting placental growth factor/neuropilin 1
pathway inhibits growth and spread of medulloblastoma. Cell.
152:1065–1076. 2013. View Article : Google Scholar : PubMed/NCBI
|
|
52
|
Sengupta S, Weeraratne SD, Sun H, Phallen
J, Rallapalli SK, Teider N, Kosaras B, Amani V, Pierre-Francois J,
Tang Y, et al: α5-GABAA receptors negatively regulate MYC-amplified
medulloblastoma growth. Acta Neuropathol. 127:593–603. 2014.
View Article : Google Scholar
|
|
53
|
Tang W, Jiang Y, Mu X, Xu L, Cheng W and
Wang X: MiR-135a functions as a tumor suppressor in epithelial
ovarian cancer and regulates HOXA10 expression. Cell Signal.
26:1420–1426. 2014. View Article : Google Scholar : PubMed/NCBI
|
|
54
|
Hemmesi K, Squadrito ML, Mestdagh P, Conti
V, Cominelli M, Piras IS, Sergi LS, Piccinin S, Maestro R, Poliani
PL, et al: miR-135a inhibits cancer stem cell-driven
medulloblastoma development by directly repressing Arhgef6
expression. Stem Cells. 33:1377–1389. 2015. View Article : Google Scholar : PubMed/NCBI
|