Introduction
Triple-negative breast cancer (TNBC), defined as a
clinical breast cancer subtype that is negative for estrogen
receptor (ER) and progesterone receptor (PgR) expression and human
epidermal growth factor receptor 2 (HER2) gene amplification,
accounts for 15% of all invasive breast cancer cases. TNBC
comprises a heterogeneous group of tumors with different
histological and molecular characteristics. Clinically, as TNBC
patients do not benefit from endocrine therapies (selective
estrogen receptor modulators, selective estrogen receptor
downregulators and aromatase inhibitors) (1–3) or
anti-HER2 drugs (trastuzumab, lapatinib, pertuzumab and trastuzumab
emtansine) (4) due to a lack of
targeted therapeutic receptors (5,6),
these therapies are not recommended in National Comprehensive
Cancer Network guidelines (7).
Therefore, chemotherapy using conventional cytotoxic agents,
including anthracyclines, cyclophosphamides, taxanes, platinum
agents and eribulin (8,9), is currently the mainstay of systemic
treatment, although patients with TNBC have worse outcomes
following chemotherapy than patients with breast cancer of other
subtypes, including hormone receptor-positive and HER2-positive
breast cancer (5,6,10).
Thus, since there is no optimized standard chemotherapy protocol
for TNBC, detailed subtyping of TNBC is necessary to identify more
effective molecular-targeted therapies.
Current omics-based studies, such as genomics and
transcriptomics, can provide data that can be used to categorize
TNBC. Recent gene expression profiling-based cluster analysis using
a dataset consisting of 587 TNBC cases from 21 independent datasets
identified six subtypes, including two basal-like subtypes, as well
as an immunomodulatory, a mesenchymal, a mesenchymal stem-like and
a luminal androgen receptor subtype (11). Moreover, next generation sequencing
(NGS)-based studies detected tumor protein p53 and
phosphatidylinositol-4,5-bisphosphate 3-kinase catalytic subunit α
mutations in 80 and 9% of TNBC cases, respectively (12), highlighting these gene mutations as
key genetic events in this subtype. Notably, additional NGS studies
led to the identification of actionable molecular characteristics,
including 'BRCAness', defined as a defect in homologous
recombination repair due to BRCA1 DNA repair associated (BRCA1) or
BRCA2 mutation, in TNBC (13,14).
Recently, poly(ADP-ribose) polymerase inhibitors were shown to take
advantage of synthetic lethality in targeting TNBC with BRCAness
(15,16). Furthermore, the nuclear factor-κB
(NF-κB) signaling pathway is constitutively activated in the
basal-like subtype of breast cancer cells, ~80% of which include
TNBC (17). However, the
underlying causes of NF-κB signaling activation have remained
poorly understood.
To characterize the molecular features of TNBC,
RNA-sequencing (RNA-seq) analysis was performed in the present
study and it was found that leucine-rich repeat (LRR)-containing 26
(LRRC26), a member of the LRR super-family, was frequently
downregulated in patients with TNBC. LRRC26, also known as
CAPC, is reported to act as a negative regulator of NF-κB activity,
and to inhibit cancer cell proliferation and migration (18). However, the pathophysiological role
of LRRC26 in carcinogenesis and TNBC progression,
particularly the mechanisms regulating LRRC26 expression,
has not yet been elucidated.
The present study aimed to characterize the
molecular mechanism of LRRC26 downregulation in TNBC.
Materials and methods
Cell lines and clinical specimens
The human breast cancer cell lines, MDA-MB-231,
HCC1143, BT-20, BT-549, HCC1395, HCC1937, MDA-MB-157, HCC38, HCC70,
MDA-MB-468, BT-474, SK-BR-3, T-47D and ZR-75-1, were purchased from
the American Type Culture Collection (Rockville, MD, USA). MCF-7
cells were obtained from the Health Science Research Resources Bank
(Osaka, Japan). 293T cells and MDA-MB-453 cells were provided by
the RIKEN BioResource Center (Tsukuba, Japan). KPL-3C cells were
kindly provided by Dr Junichi Kurebayashi (Kawasaki Medical School,
Kurashiki, Okayama, Japan) (19).
Each cell line was cultured according to optimal conditions
recommended by their respective depositors (Table I). No Mycoplasma contamination was
detected in any of the cultures using a Mycoplasma Detection kit
(Takara Bio, Inc., Otsu, Japan). A total of 26 TNBC samples and 26
normal mammary tissues were surgically resected with informed
consent from patients who were treated at the Tokushima Breast Care
Clinic (Tokushima, Japan), as previously described (20) (Table
II). Samples were immediately embedded in TissueTek OCT
compound (Sakura, Tokyo, Japan), frozen and stored at −80°C.
 | Table IA usage list of the breast cancer
cell lines. |
Table I
A usage list of the breast cancer
cell lines.
| Cell line |
Temperature
(°C) | Atmosphere | Media +
supplements | Analyses
performed |
|---|
| MDA-MB-231 | 37 | Air, 100% | Leibovitz's L-15 +
10% FBS with 1% Ab | qPCR,
pyrosequencing |
| HCC1143 | 37 | Air, 95%;
CO2, 5% | RPMI-1640 + 10% FBS
with 1% Ab | qPCR,
pyrosequencing |
| BT-20 | 37 | Air, 95%;
CO2, 5% | MEM + 10% FBS with
1% Ab | qPCR,
pyrosequencing, bisulfite-sequencing |
| BT-549 | 37 | Air, 95%;
CO2, 5% | RPMI-1640 + 10% FBS
with 1% Ab | qPCR |
| HCC1395 | 37 | Air, 95%;
CO2, 5% | RPMI-1640 + 10% FBS
with 1% Ab | qPCR |
| HCC1937 | 37 | Air, 95%;
CO2, 5% | RPMI-1640 + 10% FBS
with 1% Ab | qPCR,
pyrosequencing, bisulfite-sequencing |
| MDA-MB-157 | 37 | Air, 100% | Leibovitz's L-15 +
10% FBS with 1% Ab | qPCR,
pyrosequencing |
| HCC38 | 37 | Air, 95%;
CO2, 5% | RPMI-1640 + 10% FBS
with 1% Ab | qPCR |
| HCC70 | 37 | Air, 95%;
CO2, 5% | RPMI-1640 + 10% FBS
with 1% Ab | qPCR,
pyrosequencing, bisulfite-sequencing |
| MDA-MB-468 | 37 | Air, 100% | Leibovitz's L-15 +
10% FBS with 1% Ab | qPCR |
| BT-474 | 37 | Air, 95%;
CO2, 5% | MEM + 10% FBS with
1% Ab | qPCR,
pyrosequencing |
| MDA-MB-453 | 37 | Air, 100% | Leibovitz's L-15 +
10% FBS with 1% Ab | qPCR,
pyrosequencing |
| SK-BR3 | 37 | Air, 95%;
CO2, 5% | McCoy's 5a + 10%
FBS with 1% Ab | qPCR |
| T-47D | 37 | Air, 95%;
CO2, 5% | RPMI-1640 + 10% FBS
with 1% Ab | qPCR |
| ZR-75-1 | 37 | Air, 95%;
CO2, 5% | RPMI-1640 + 10% FBS
with 1% Ab | qPCR |
| KPL-3C | 37 | Air, 95%;
CO2, 5% | RPMI-1640 + 10% FBS
with 1% Ab | qPCR |
| MCF-7 | 37 | Air, 95%;
CO2, 5% | MEM + 10% FBS with
1% Ab, 0.1 mM NEAA, 1 mM sodium pyruvate and 10 µg/ml
insulin | qPCR |
| Table IIClinical and pathological features of
26 triple-negative breast cancer cases enrolled in RNA-seq and qPCR
analyses. |
Table II
Clinical and pathological features of
26 triple-negative breast cancer cases enrolled in RNA-seq and qPCR
analyses.
| Case_ID | Age (years) | Gender | ER | PgR | HER2 | Histology | T-stage | Node |
|---|
| 10 | 57 | F | (−) | (−) | 1+ | Papillotubular >
scirrhous | T2 | + |
| 19a | 44 | F | (−) | (−) | 0 | Papillotubular | T1 | − |
| 36 | 50 | F | (−) | (−) | 0 | Solid-tubular >
papillotubular | T2 | + |
| 53a | 55 | F | (−) | (−) | 0 | Papillotubular >
scirrhous | T1 | − |
| 54a | 77 | F | (−) | (−) | 0 | Solid-tubular | T1 | − |
| 56a | 58 | F | (−) | (−) | 0 | Solid-tubular | T1 | + |
| 101 | 60 | F | (−) | (−) | 0 | Scirrhous >
solid-tubular | T2 | + |
| 110a | 77 | F | (−) | (−) | 1+ | Scirrhous >
papillotubular | T2 | + |
| 114a | 76 | F | (−) | (−) | 0 | Solid-tubular | T2 | + |
| 133 | 50 | F | (−) | (−) | 0 | Solid-tubular | T1 | − |
| 150a | 58 | F | (−) | (−) | 0 | Papillotubular | T2 | − |
| 159a | 75 | F | (−) | (−) | 1+ | Papillotubular | T1 | − |
| 171 | 37 | F | (−) | (−) | 1+ | Solid-tubular | T1 | + |
| 179a | 61 | F | (−) | (−) | 0 | Solid-tubular | T2 | − |
| 188 | 50 | F | (−) | (−) | 1+ | Solid-tubular >
scirrhous | T1 | − |
| 192a | 50 | F | (−) | (−) | 0 | Solid-tubular | T1 | + |
| 209a | 50 | F | (−) | (−) | 0 | Solid-tubular >
scirrhous | T2 | + |
| 242 | 58 | F | (−) | (−) | 0 | Unknown (large
cell) | T3 | + |
| 270a | 47 | F | <5 | <5 | 0 | Solid-tubular | T1 | − |
| 272a | 88 | F | <5 | <5 | 0 | Solid-tubular | T2 | − |
| 284a | 58 | F | (−) | (−) | 0 | Papillotubular | T2 | + |
| 292a | 69 | F | <5 | <5 | 0 | Solid-tubular >
scirrhous | T2 | + |
| 306 | 83 | F | <5 | <5 | 1+ | Invasive
lobular | T2 | − |
| 320 | 70 | F | (−) | (−) | 0 | Scirrhous >
papillotubular | T1 | − |
| 329 | 32 | F | <5 | <5 | 0 | Papillotubular | T1 | − |
| 334 | 63 | F | <5 | <5 | 0 | Adenoid cystic | T1 | − |
The present study, as well as the use of all
clinical materials aforementioned, was approved by the Ethics
Committee of Tokushima University (Tokushima, Japan).
RNA-seq analysis
Total RNA was extracted from frozen tumors and
adjacent normal breast tissues from the 15 out of 26 TNBC samples
that could produce a large enough amount of RNA for RNA seq
analysis using the Nucleospin RNA II system (Takara Bio, Inc.)
according to the manufacturer's protocols. Whole-transcriptome RNAs
seq analysis was performed using the SureSelect strand-specific RNA
library preparation kit (Agilent Technologies, Inc., Santa Clara,
CA, USA) according to the manufacturer's protocols, followed by
paired-end 100-bp sequencing on an Illumina HiSeq 1500 platform
(Illumina, Inc., San Diego, CA, USA). All primary sequence data
files are deposited in the DNA Data Bank of Japan (accession no.
JGAS00000000116; http://www.ddbj.nig.ac.jp/). Data were analyzed using
CLC Biomedical Genomics Workbench version 4.0 (Qiagen GmbH, Hilden,
Germany) with default parameters. Transcript abundance was
calculated as transcript per million.
Quantitative PCR (qPCR) and
semi-quantitative PCR
Total RNA extracted from clinical breast cancer
samples and breast cancer cell lines using the NucleoSpin RNA II
system (Takara Bio, Inc.) and the poly A-RNAs of a normal human
mammary gland (Clontech Laboratories, Inc., Mountainview, CA, USA)
were reverse transcribed using SuperScript II (Life Technologies;
Thermo Fisher Scientific, Inc., Waltham, MA, USA). qPCR analysis
using the ABI PRISM 7500 Real-Time PCR system was performed with
SYBR® Premix Ex Taq (both from Applied Biosystems;
Thermo Fisher Scientific, Inc.). The thermocycling conditions were
10 min at 94°C, followed by 45 cycles of denaturation at 94°C for
15 sec, 1 min annealing and extension at 60°C, and reading of the
fluorescence. Following threshold-dependent cycling, melting curve
analysis was performed from 60 to 94°C. The quantitative
calculation was analyzed using 2−ΔΔCq (21). Semi-quantitative PCR analysis was
performed as described previously (22,23).
Gene-specific primers used for qPCR and semi-quantitative PCR were
as follows: LRRC26 forward, 5′-CTGCTGCTGGACCACAACC-3′ and
reverse, 5′-AGAAGGCTCGCACATGCAC-3′; interleukin-6 (IL-6)
forward, 5′-GGGCATTCCTTCTTCTGG-3′ and reverse,
5′-ACTGCATAGCCACTTTCCA-3′; IL-8 forward,
5′-GCAAAATTGAGGCCAAGG-3′ and reverse, 5′-GGCACAGTGGAACAAGGA-3′; and
C-X-C motif chemokine ligand-1 (CXCL-1) forward,
5′-GCTCTTCCGCTCCTCTCACA-3′ and reverse, 5′-GCTTCCTCCTCCCTTCTGGT-3′.
The β-actin primer sequences used as quantitative controls were as
follows: Forward, 5′-ATTGCCGACAGGATGCAG-3′ and reverse,
5′-CTCAGGAGGAGCAATGATCTT-3′ for qPCR; and forward,
5′-GAGGTGATAGCATTGCTTTCG-3′ and reverse,
5′-CAAGTCAGTGTACAGGTAAGC-3′ for semi-quantitative PCR.
Methylation analysis using bisulfite
pyrosequencing and bisulfite sequencing
Genomic DNA (1 µg) extracted from clinical
samples and cell lines was modified with sodium bisulfite using an
EpiTect Bisulfite kit (Qiagen GmbH), subsequent to which bisulfite
pyrosequencing was performed as previously described (24). The methylation ratio (%) of
LRRC26 in each sample was analyzed using PyroMark Q96
software version 2.5.8 (Qiagen GmbH). For bisulfite sequencing,
thermocycling conditions were 10 min at 94°C, followed by 45 cycles
of denaturation at 94°C for 1 min, annealing at 60°C for 1 min and
extension at 72°C for 10 min. Amplified PCR products were cloned
into the pCR2.1-TOPO vector (Thermo Fisher Scientific, Inc.), and
11 clones from HCC1937, 12 clones from BT-20 and 15 clones from
HCC70 were sequenced using an ABI3130x automated sequencer (Thermo
Fisher Scientific, Inc.). Primer sequences and PCR product sizes
are listed in Table III.
| Table IIIPrimer sequences used for bisulfite
pyrosequencing and bisulfite sequencing of LRRC26. |
Table III
Primer sequences used for bisulfite
pyrosequencing and bisulfite sequencing of LRRC26.
| Primer | Primer
sequences | Size (bp) |
|---|
| Bisulfite
pyrosequence | | |
| Forward primer
(Seq.1–2) |
TGGGCGGTGTTTTGTTGTTTAGGTTA | 119 |
| Reverse primer
(Seq.1–2) |
Bio_AAAACTCCAAACTACTCTTAACTCAAC | |
| Forward primer
(Seq.TCGA) |
AGGTTTTATTTAGTATGGGAATGGGATT | 123 |
| Reverse primer
(Seq.TCGA) |
Bio_AACCCAAAAATCCTACTCCTCACCC | |
| Sequencing primer
(Seq.1) |
TTGTTTAGGTTAGGGTT | |
| Sequencing primer
(Seq.2) |
GAGGTGGTTTTGATAG | |
| Sequencing primer
(Seq.TCGA) |
GGAATGGGATTATTTTTG | |
| Sequence to
analyze (Seq.1) | CGGCGGGCG | |
| Sequence to
analyze (Seq.2) | CGTTGTGGTCGGCG | |
| Sequence to
analyze (Seq.TCGA) |
CGTGGGGGTTATTTCGTATGTGTACG | |
| Bisulfite
sequence | | |
| Forward primer
(Seq.1–2) |
TGGGCGGTGTTTTGTTGTTTAGGTTA | 343 |
| Reverse
primer |
AACCCCGCATAAAAACAACCCCCC | |
5′-aza-dC treatment
To restore epigenetically silenced LRRC26
gene expression, HCC1937 cells were plated onto 6-well dishes at a
density of 3.5×10⁵ cells/well and treated with several
concentrations (0, 1, 2.5, 5 and 10 µM) of 5′-aza-dC
(Sigma-Aldrich; Merck KGaA, Darmstadt, Germany) for 5 days,
replacing the reagent and RPMI-1640 (Sigma-Aldrich; Merck KGaA)
medium every 24 h. LRRC26 gene expression following
treatment with 5′-aza-dC was monitored by semi-quantitative PCR as
aforementioned.
Small interfering RNA (siRNA)-mediated
gene silencing
ON-TARGETplus siRNA-SMARTpool (4 types of siRNA;
catalog no. L-029447-01-0005; GE Healthcare Dharmacon, Inc.,
Lafayette, CO, USA) was used to knockdown LRRC26 expression
in the HCC70 cells, with siRNA against enhanced green fluorescent
protein (si-EGFP) used as a control. HCC70 cells were plated in
6-well dishes at 1.0×10⁵ cells/well. Transfection of 10
nM ON-TARGETplus siRNAs was performed using Lipofectamine RNAiMax
(Thermo Fisher Scientific, Inc.) according to the manufacturer's
protocols. Knockdown efficiency was evaluated by qPCR using the
aforementioned protocol at 48, 72, 96 and 120 h post-transfection.
Cell proliferation assays were performed using Cell Counting Kit-8
(Dojindo Molecular Technologies, Inc., Kumamoto, Japan) as
previously described (20). All
experiments were performed in triplicate.
Soft agar colony formation assay
Anchorage-independent growth was assessed by the
soft agar assay. HCC70 cells were transfected with 10 nM
ON-TARGETplus siRNAs for 36 h, and 2.5×10³ cells were
plated in triplicate in 5 ml RPMI-1640 medium containing 0.4% soft
agarose, overlaid on 5 ml 0.72% agarose in 6-cm dishes and cultured
at 37°C for 11 days. Colonies per well were counted on a Power IX71
microscope (Olympus Corporation, Tokyo, Japan).
Migration assay
BD Falcon Cell Culture Inserts (24 wells,
8-µm pore size; BD Biosciences, Franklin Lakes, NJ, USA)
were rehydrated with serum-free RPMI-1640 at 37°C in a 5%
CO2 incubator for 2 h. Following rehydration, the medium
was removed and 0.5 ml RPMI-1640 was added to the upper chamber,
and 0.5 ml RPMI-1640 with 10% fetal bovine serum (FBS) was added to
the lower chamber. RPMI/FBS medium (0.5 ml) containing
2.5×10⁴ HCC70 cells previously transfected with siRNA
for 36 h was added to each insert. The HCC70 cells in the migration
chamber underwent incubation at 37°C for 48 h. Following
incubation, the chamber inserts were fixed (4% paraformaldehyde for
10 min) prior to being stained with 1% Giemsa at room temperature
for 2 days. The total number of migrated cells for each treatment
was calculated from five random fields for each insert counted on a
Power IX71 microscope (Olympus Corporation) at ×40 magnification.
The number of migrated cells per well for each treatment was
averaged from duplicate samples and expressed as the mean ±
standard deviation.
Invasion assay
Matrigel invasion chambers (24 wells, 8-µm
pore size; Corning Inc., Corning, NY, USA) were rehydrated with
serum-free RPMI at 37°C in a 5% CO2 incubator for 2 h.
Following rehydration, the medium was removed and 0.5 ml RPMI-1640
was added to the upper chamber, and 0.5 ml RPMI-1640 plus 10% FBS
was added to the lower chamber. RPMI/FBS medium (0.5 ml) containing
2.5×10⁴ HCC70 cells previously transfected with siRNA
for 36 h was added to each insert. The HCC70 cells in the invasion
chamber were incubated at 37°C for 48 h. Following incubation,
chamber inserts were fixed with 4% paraformaldehyde for 10 min
prior to being stained with 1% Giemsa at room temperature for 2
days. The total number of migrated cells for each treatment was
calculated from five random fields for each insert counted on a
Power IX71 microscope (Olympus Corporation) at ×40 magnification.
The number of invaded cells per well for each treatment was
averaged from duplicate samples and expressed as the mean ±
standard deviation.
Construction of expression vectors
pCAGGSSnHC and pCAGGSn3FC, in which an HA-tag and a
3xFLAG-tag, respectively, are inserted in the C-terminus of the
cloning sites of pCAGGS vector, were constructed and gifted by Dr
Yusuke Nakamura (University of Tokyo, Tokyo, Japan). Briefly, to
construct the LRRC26 and B cell receptor associated protein
31 (BAP31) expression vectors, the entire coding sequences
of LRRC26 and BAP31 cDNAs were amplified by PCR using
KOD-Plus DNA polymerase (Toyobo, Osaka, Japan) with the following
primers: LRRC26 forward,
5′-GGAATTCATGCGGGGCCCTTCCTGGTCG-3′ and reverse,
5′-CCGCTCGAGGGCTTGGGCGGCAGCGGCGG-3′; and BAP31 forward,
5′-CGGAATTCACCATGGGTGCCGAGGCGTC CTC-3′ and reverse,
5′-CCGCTCGAGCTCTTCCTTCTTGTCCATGGGAC-3′ (bold indicates the
restriction enzyme sites). The thermocycling conditions were as
follows: For LRRC26, an initial denaturation of 2 min at
94°C, followed by 35 cycles of denaturation at 94°C for 15 sec,
annealing at 62°C for 30 sec and elongation at 68°C for 80 sec; for
BAP31, an initial denaturation of 2 min at 94°C, followed by 30
cycles of denaturation at 94°C for 15 sec, annealing at 52°C for 30
sec and elongation at 68°C for 1 min. BAP31 is an a transmembrane
protein associated with the endoplasmic reticulum (ER) and ER-Golgi
intermediates, and has been involved in apoptosis and protein
trafficking (25,26). Each PCR product was inserted into
the EcoRI and XhoI sites of pCAGGSnHA in frame with
the C-terminal HA-tag (pCAGGSSnHC-LRRC26) and pCAGGSn3FC in
frame with the C-terminal FLAG-tag (pCAGGSSn3FC-BAP31),
respectively. To construct the pGL3-NF-κB expression vector for the
luciferase reporter assay as described next, the oligonucleotides
for NF-κB-U (5′-CTGGGGACTTTCCGCTGGGGACTTTCCGCTGGGGACTTTCCGCTGGGGACTTTCCGCTATATAC-3′)
and NF-κB-L (5′-TCGAGTATATAGCGGAAAGTCCCCAGCGGAAAGTCCCCAGCGGAAAGTCCCCAGCGGAAAGTCCCCAGGTAC-3′)
(bold font indicates restriction enzyme sites and underlining
indicates 4× NF-κB binding sites) was annealed, and cloned into the
KpnI and XhoI sites of pGL3-basic (Promega
Corporation, Madison, WI, USA). The DNA sequence of all constructs
were confirmed by DNA sequencing (ABI3500xL; Thermo Fisher
Scientific, Inc.).
Luciferase reporter assay
293T cells (2.0×10⁵ cells/well in 6-well
plates) were co-transfected with 200 ng pGL3-NF-κB in combination
with 1.0 µg pCAGGSnHC-LRRC26 or the mock vector using
Fugene 6 (Promega Corporation). pRL-TK (Promega Corporation) was
used as an internal control. After 24 h, the cells were treated
with TNF-α (40 ng/ml; Sigma-Aldrich; Merck KGaA) for 0, 4, 8 and 12
h. Next, the cells were harvested and analyzed for Firefly
luciferase and Renilla luciferase activity using the
PicaGene Dual Sea Pansy Luminescence kit (Wako Pure Chemical
Industries, Ltd., Osaka, Japan) according to the manufacturer's
protocols. Data are expressed as the fold increase over
mock-transfected cells (set at 1.0) and represented as the mean ±
standard error of two independent experiments.
Analysis of public database of RNA
expression and methylation in breast cancer
Publicly available gene expression and methylation
data from The Cancer Genome Atlas (TCGA; http://cancergenome.nih.gov/) were downloaded.
Differential expression (by fold-change value) between breast
cancer and the adjacent normal breast tissues was calculated
according to the normalized gene expression value of each
sample.
Microarray analysis
HCC70 cells were seeded at a density of
2×10⁵ cells/well onto 6-well plates, followed by
transfection with 10 nM siEGFP (Sigma-Aldrich; Merck KGaA) or
siLRRC26 (GE Heathcare Dharmacon, Inc.) using Lipofectamine RNAiMAX
(Thermo Fisher Scientific, Inc.) according to the manufacturer's
protocols. After 48 and 72 h of siRNA transfection, total RNA was
extracted using a NucleoSpin RNA kit (Takara Bio, Inc.) according
to the manufacturer's protocols. A total of 100 ng total RNA from
each sample was amplified and Cy3-labeled. Next, 0.825 µg
Cy3-labeled cRNA was fragmented, hybridized onto the Agilent
SurePrint G3 Hmn GE 8×60K Ver 2.0 platform (Agilent Technologies,
Inc.) and then incubated with rotation at 65°C for 17 h. Data were
analyzed using GeneSpring software version 13.0 (Agilent
Technologies, Inc.) as previously described (20). To identify genes that were
significantly altered between siLRRC26-treated cells and
siEGFP-treated cells, the mean signal intensity values in each
analysis were compared. The extent and direction of the
differential expression between 48 and 72 h were determined by
calculating the fold-change value. Data from this microarray
analysis have been submitted to the NCBI Gene Expression Omnibus
archive as series GSE90582.
Functional gene annotation
clustering
The Database for Annotation, Visualization and
Integrated Discovery (DAVID 6.8) was approved to detect functional
gene annotation clusters based on gene expression profiling by gene
annotation enrichment analysis (http://david.abcc.ncifcrf.gov/) (27,28).
The clusters from the gene annotation enrichment analysis were
selected in this study based on a previous study (29).
Scratch wound cell migration and invasion
assays by IncuCyte
BT20 cells (2.0×10⁵ cells/well in 6-well
plates) were transfected with 2.0 µg pCAGGSnHC-LRRC26
or the mock vector. For migration assay, after 48 h, cells
(2.5×10⁴ cells/well) were re-seeded onto the 96-well
ImageLock™ plate (Essen BioScience, Ann Arbor, MI, USA), which was
coated with Matrigel (100 µg/ml) prior to seeding the cells.
After 4 h, the wound area was created in the cell monolayer with a
96-well WoundMaker™ (Essen BioScience). The plate was washed with
phosphate-buffered saline (PBS) (−) to remove detached cells, and
100 µl fresh medium was added. For the invasion assay, the
cells were covered with 50 µl Matrigel solution (8 mg/ml)
and incubated for 30 min. Next, 100 µl of additional culture
media was added to each well and the plates were placed into the
IncuCyte ZOOM (Essen Bioscience). The two plate types were scanned
every 2 h for 72 h. Data were analyzed using ZOOM software version
2016B (Essen BioScience) according to the manufacturer's protocols.
Cell migration and invasion were expressed as relative wound
density.
Immunocytochemical staining analysis
To examine the subcellular localization of the
LRRC26 protein in TNBC cells, BT20 cells (2.0×10⁵
cells/well in 6-well plates) were transfected with 2.0 µg
pCAGGSnHC-LRRC26 or the mock vector using FuGENE HD
transfection regent (Roche Diagnostics GmbH, Mannheim, Germany). In
addition, BT-20 cells were co-transfected with 2.0 µg
pCAGGSnHC-LRRC26 and pCAGGSn3FC-BAP31 or the empty
vector (Mock). At 48 h post-transfection, BT-20 cells
(2.0×10⁴ cells/well) were plated onto an 8-well glass
slide chamber (Thermo Fisher Scientific, Inc.). After 24 h of
incubation, the cells were fixed with 4% paraformaldehyde for 30
min at 4°C and then peameabilized with 0.1% Triton X-100 for 2 min
at room temperature. Next, the cells were covered with 3% bovine
serum albumin for 1 h at room temperature and then incubated with
anti-HA antibody (1:1,000 dilution; cat. no. 1867423; Roche
Diagnostics GmbH) and anti-FLAG M2 (1:1,000 dilution; cat. no.
F-3165; Sigma-Aldrich; Merck KGaA) or anti-78-kDa glucose-regulated
protein (GRP78; 1:200 dilution; cat. no. ab108615; Abcam,
Cambridge, UK) antibodies overnight at 4°C. Subsequent to washing
with PBS (−), the cells were stained with Alexa 488-conjugated
anti-rat (cat. no. A-21210) and Alexa 594-conjugated anti-mouse
(cat. no. A-11032) or anti-rabbit (cat. no. A-11037) antibodies
(1:1,000 dilution; Molecular Probes; Thermo Fisher Scientific,
Inc.) at room temperature for 1 h, respectively. The nuclei were
stained with 4′,6′-diamidine-2′-phenylindole dihydrochloride.
Fluorescence was observed was obtained using an IX71 microscope
(Olympus Corporation). Scale bars indicate 20 µm.
Immunoblotting analyses
Immunoblotting analyses were conducted as previously
described (30). Briefly, cell
lysates were prepared with lysis buffer at 48 h post-transfection.
The lysates were electrophoresed, transferred to a nitrocellulose
membrane and blocked with 4% BlockAce solution (Dainippon Sumimoto
Pharma Co., Ltd., Osaka, Japan) for 1 h. Subsequently, the membrane
were incubated with anti-HA (1:3,000 dilution; cat. no. 1867423)
and anti-α/β-Tubulin antibodies (1:1,000 dilution; cat. no. 2148)
(Cell Signaling Technology, Inc., Danvers, MA, USA) at 4°C
overnight, respectively. Following incubation with a horseradish
peroxidase-conjugated secondary antibody (1:5,000 dilution; catalog
no. sc-2006 for anti-rat antibody; catalog no. sc-2004 for
anti-rabbit antibody; Santa Cruz Biotechnology, Inc., Dallas, TX,
USA) at room temperature for 1 h, the membranes were developed with
an enhanced chemiluminescence system (GE Healthcare Life Sciences,
Little Chalfont, UK) and were scanned using an Image Reader
LAS-3000 mini (Fujifilm, Tokyo, Japan).
Statistical analysis
Statistical significance was calculated using the
Kruskal-Wallis test and Dunnett's post-hoc test with SPSS version
20.0 software (IBM, Armonk, NY, USA) for the comparison between the
gene expression and methylation levels from the TCGA dataset. For
multiple comparisons of Figs. 1D
and 2B, a one-way analysis of
variance with Dunnett's and Tukey's post hoc tests, respectively,
were performed. Wilcoxon signed rank test was performed using JMP
12.1.0 (SAS Institute Japan, Ltd., Tokyo, Japan) to assess
methylation levels between tumor and paired normal tissues. The
χ2 test was performed using Microsoft® Excel
2016 to assess the associations between the expression of the
LRRC26 gene and patient characteristics. Student's two-sided
t-test was performed using Microsoft® Excel 2016 to
calculate statistical significance in experiments for the gene
expression, methylation status, colony formation, migration,
invasion and luciferase activity. P<0.05 was considered to
indicate a statistically significant difference.
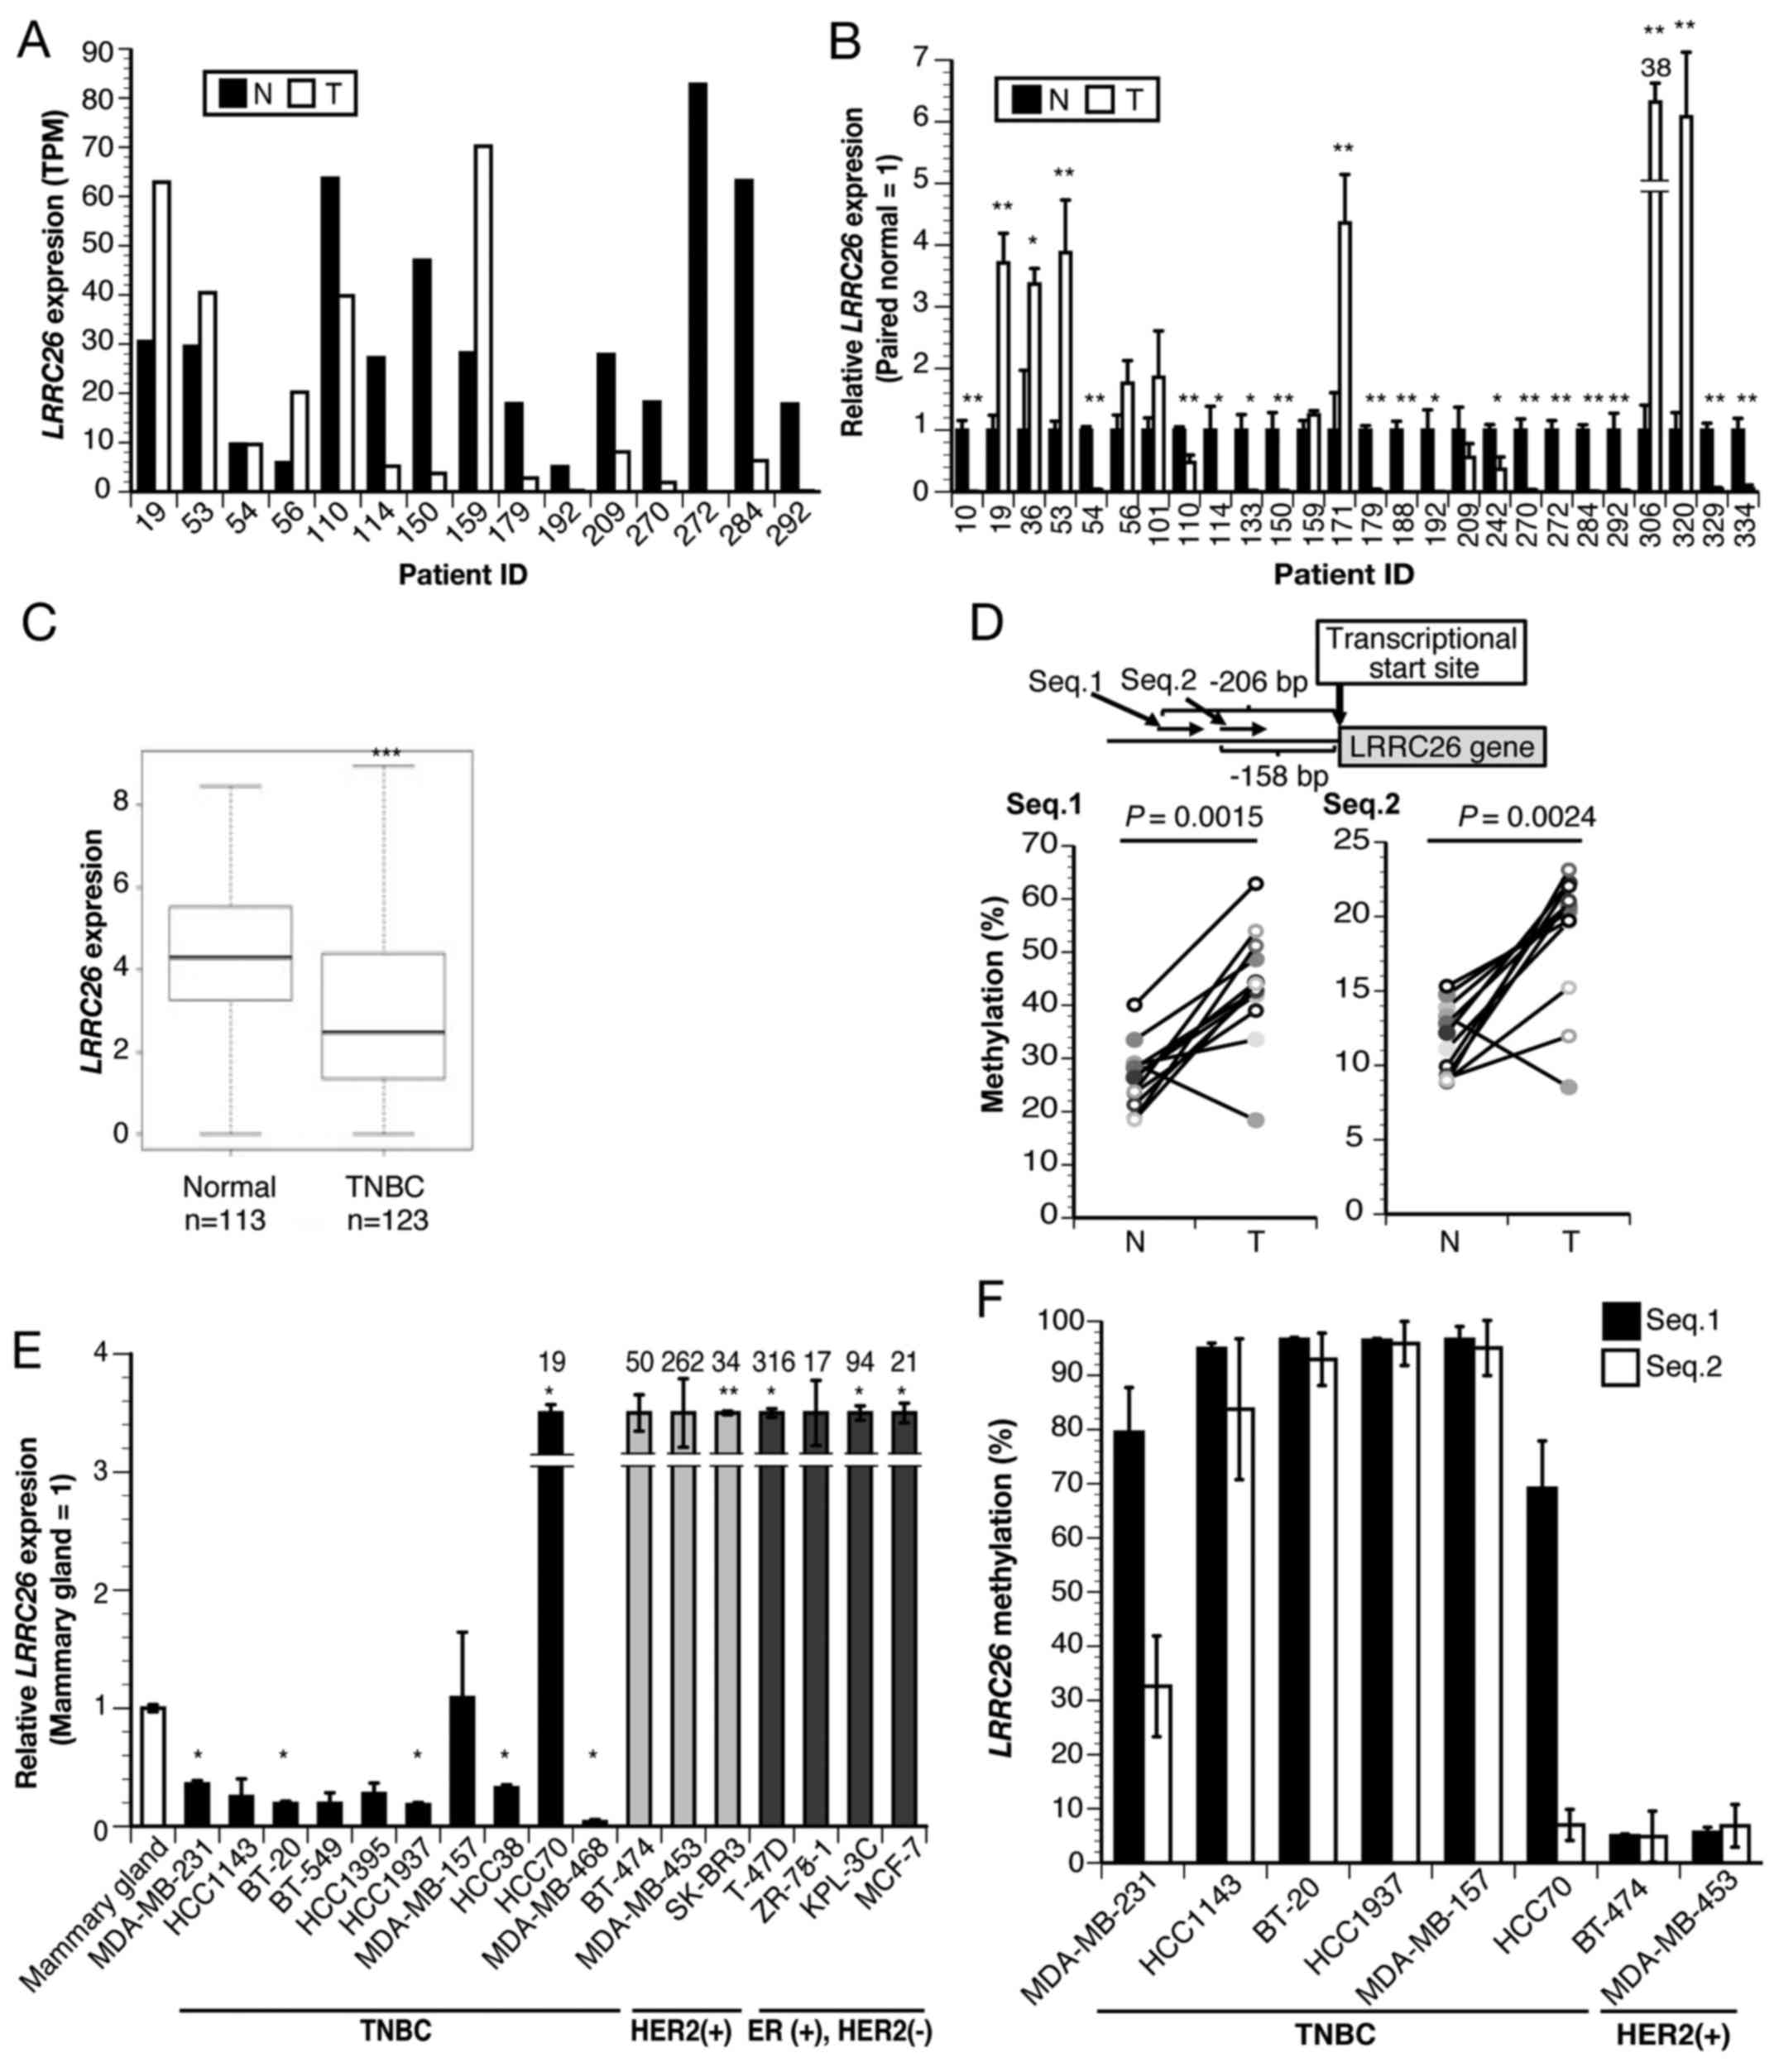 | Figure 1LRRC26 expression and
methylation in TNBC. (A) LRRC26 expression determined by
RNA-seq analysis of 15 TNBC cases. (B) Relative LRRC26 gene
expression in 26 TNBC clinical specimens and paired normal tissues
by qPCR. The data represent the mean ± standard deviation of each
condition (*P<0.05 and **P<0.01;
two-sided Student's t-test). (C) Expression levels in 123 TNBC
patients and 113 normal tissues obtained from TCGA RNA-seq
datasets. The box plot shows the expression level between TNBC and
normal tissue. Two-sided Student's t-test revealed a significant
difference (***P<0.001 vs. normal tissues). (D)
Diagram of the CpG sites of the LRRC26 gene. The two regions
(Seq.1 and Seq.2) analyzed using bisulfite pyrosequencing are shown
(upper panel). Bisulfite pyrosequencing analysis of two
LRRC26 CpG sites (Seq.1 and Seq.2) in 12 TNBC clinical
specimens and paired normal breast tissues (lower panel) (Wilcoxon
signed-rank test). (E) Relative expression of LRRC26 gene in
17 breast cancer cell lines, including 10 TNBC, 3 HER2(+) and 4
ER(+) HER2(−) cell lines, compared with that in normal mammary
glands, as determined by qPCR. The data represent the mean ±
standard deviation of each condition (*P<0.05 and
**P<0.01; analysis of variance with Dunnett's post
hoc test). (F) Bisulfite pyrosequencing analysis of 2 LRRC26
CpG sites (Seq.1 and Seq.2) in indicated breast cancer cell lines.
The data represent the mean ± standard deviation of each condition.
TNBC, triple-negative breast cancer; TPM, transcript per million;
LRRC26, leucine-rich repeat-containing 26; RNA-seq, RNA
sequencing; T, clinical tumor specimens; N, normal tissue; ER,
estrogen receptor; HER2, human epidermal growth factor receptor 2;
qPCR, quantitative polymerase chain reaction. |
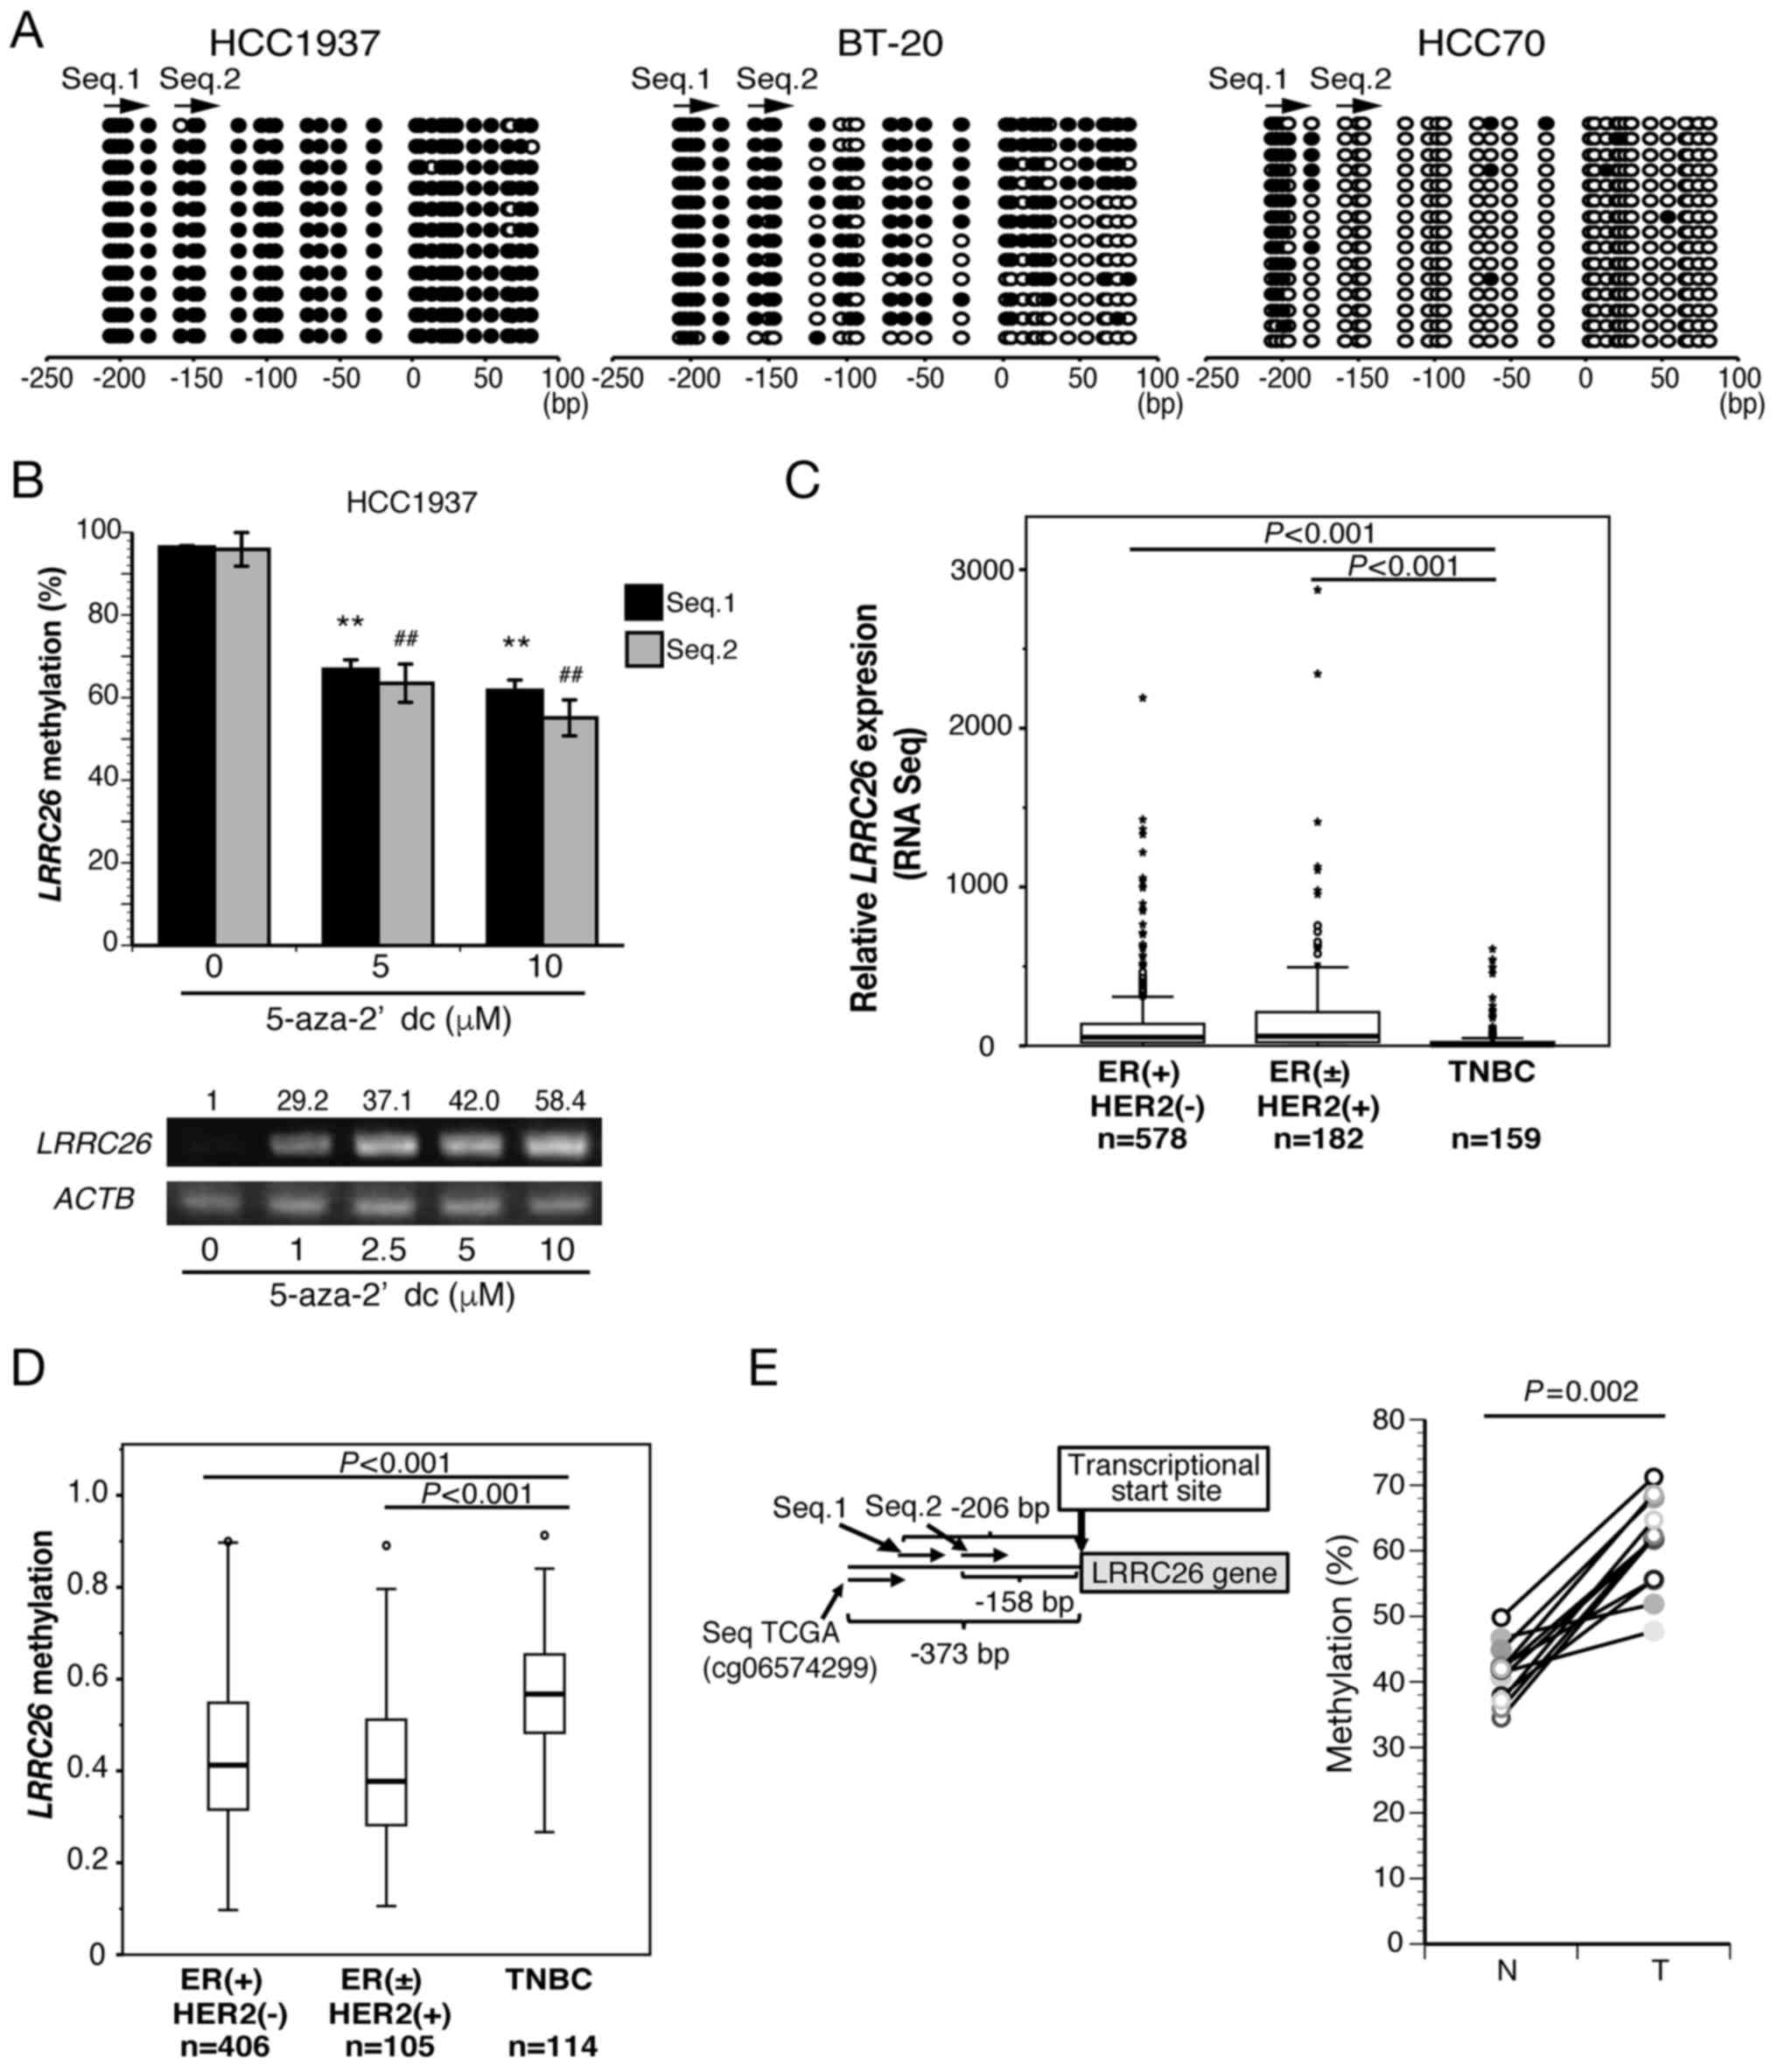 | Figure 2LRRC26 downregulation and
hypermethylation are exclusive to TNBC. (A) Bisulfite sequencing
analysis of two LRRC26 CpG sites in HCC1937, BT20 and HCC70
cells. Open and filled circles represent unmethylated and
methylated CpG sites, respectively. The arrow indicates the region
analyzed via bisulfite pyrosequencing. (B) Bisulfite pyrosequencing
(bar graph) and semi-quantitative PCR results (bottom panel) for
LRRC26 in HCC1937 cells treated with varying doses of
5′-aza-dC for 120 h. Mean methylation levels (%) of LRRC26
were measured as aforementioned. The data represent the mean ±
standard deviation of methylation levels of each CpG island.
(**P<0.01 vs. 5′-aza-dC (0 µM) in Seq.1;
##P<0.01 vs. 5′-aza-dC (0 µM) in Seq.2;
analysis of variance with Tukey's post hoc test). (C) LRRC26
gene expression in 3 subtypes [ER(+)HER2(−), ER(±)HER2(+) and TNBC)
for cases with TCGA RNA-seq datasets. The Kruskal-Wallis test
revealed a significant difference, followed by Dunnett's post hoc
test. (D) Methylation levels in 625 breast cancer patients obtained
from TCGA datasets. The box plot shows the percent methylation
between three breast cancer subtypes classified by ER status and
HER2 expression. The Kruskal-Wallis test revealed a significant
difference, followed by Dunnett's post hoc test. (E) Bisulfite
pyrosequencing analysis at CpG island SeqTCGA (the CpG island
located 373 bp upstream of the transcription start site) in 12 TNBC
clinical specimens and paired normal breast tissues (righ panel)
(Wilcoxon signed-rank test). The CpG island SeqTCGA site in the
LRRC26 gene is also shown (left panel) (Wilcoxon signed-rank
test). 5′-aza-dC, 5-aza-2′-deoxycytidine; TNBC, triple-negative
breast cancer; LRRC26, leucine-rich repeat-containing 26;
ACTB, β-actin; RNA-seq, RNA sequencing; ER, estrogen
receptor; HER2, human epidermal growth factor receptor 2; T,
clinical tumor specimens; N, normal tissue; qPCR, quantitative
polymerase chain reaction. |
Results
LRRC26 is specifically downregulated in
TNBC clinical specimens and cell lines due to methylation of CpG
islands
To characterize the molecular features of TNBC,
RNA-seq analysis was first performed and it was found that
LRRC26 expression was downregulated in 10 out of 15 patients
with TNBC, but upregulated in 4 (no regulation change in 1 patient)
(Fig. 1A). Subsequent qPCR
confirmed that LRRC26 was significantly downregulated in 16
out of the 26 patients with TNBC (6 of the 15 patients who also
underwent RNA-Seq) compared with that in paired normal breast
tissues (Fig. 1B), which was
consistent with the RNA-seq results. Subsequently, statistical
analysis of the association between LRRC26 expression level
and clinicopathological features, including the tumor stage or
grade of TNBC cases used for qPCR, was performed, and it was found
that LRRC26 downregulation was significantly associated with
increased histοlogical grade in patients with TNBC (P=0.017;
χ2 test) (Table IV).
Furthermore, the expression of the LRRC26 gene was examined
by the analysis of TCGA dataset, including a much larger number of
TNBC cases and normal controls, and it was found that the
LRRC26 gene was significantly downregulated in 123 TNBC
cases compared with that in 113 normal controls (Fig. 1C). These results suggested the
possibility that the downregulation of LRRC26 may be
associated with the carcinogenesis of TNBC. Accordingly, the
present study focused on understanding the mechanism of
LRRC26 downregulation in TNBC, although further analysis of
the mechanism of LRRC26 upregulation in breast cancer will
be necessary. Next, to determine whether LRRC26
downregulation is associated with CpG hypermethylation in its
promoter region, bisulfite pyrosequencing analysis was performed
using a set of 12 TNBC clinical tissues and adjacent normal breast
tissues. LRRC26 methylation levels were quantitatively
measured at two CpG islands containing 'Seq.1' and 'Seq.2′, located
206 and 158 bp upstream of the transcription start site,
respectively (Fig. 1D). The
average methylation levels of 'Seq.1' in the tumor and normal
tissues was 43.63% (range, 18.37–62.89%) and 26.55% (range,
18.47–40.09%), respectively, and that of 'Seq.2′ in the tumor and
normal tissues was 18.79% (range, 8.52–23.15%) and 11.63% (range,
8.86–15.32%), respectively (Fig.
1D). Accordingly, the methylation levels of the two CpG islands
were significantly higher in 11 out of 12 tumor tissues compared
with those in adjacent normal mammary gland tissues (Fig. 1D; Wilcoxon signed-rank test: Seq.1,
P=0.0015 and Seq.2, P=0.0024, respectively) (Fig. 1D). To further validate this result,
LRRC26 expression levels were analyzed in breast cancer cell
lines by qPCR. LRRC26 expression was significantly
downregulated in 8 out of 10 TNBC cell lines compared with that in
normal mammary glands (Fig. 1E),
whereas its expression level was extremely high in all
HER2-positive and ER-positive/HER2-negative cell lines (Fig. 1E). Furthermore, LRRC26
methylation status was analyzed in TNBC cell lines, and it was
observed that high levels of methylation at the two CpG island
sites in LRRC26 were in agreement with LRRC26
expression levels in 4 out of 6 TNBC cell lines (Fig. 1E and F). Low levels of methylation
at the two CpG island sites were in agreement with high levels of
LRRC26 expression in the two HER2-positive cell lines,
BT-474 and MDA-MB453. Of the remaining TNBC cell lines,
LRRC26 was expressed in HCC70, whereas high DNA methylation
levels (>60%) were detected at Seq.1 and low levels at Seq.2.
Conversely, LRRC26 was downregulated in MDA-MB-231, which
displayed high DNA methylation levels at Seq.1 and moderate levels
at Seq.2 (Fig. 1E and F). These
results indicated that a different mechanism, such as histone
modification or the existence of other critical CpG sites in the
LRRC26 promoter region, may underlie LRRC26 silencing
in these cells.
| Table IVAssociation between leucine-rich
repeat-containing 26 downregulation in triple-negative breast
cancer cases and patient characteristics. |
Table IV
Association between leucine-rich
repeat-containing 26 downregulation in triple-negative breast
cancer cases and patient characteristics.
| Characteristic | Total | Expression of
LRRC26 for tumor/normal tissue <1.0 | Expression of
LRRC26 for tumor/normal tissue ≥1.0 | P-value
(χ2 test) |
|---|
| Total, n | 26 | 17 (65.4) | 9 (34.6) | |
| Age in years, n
(%) | | | | 0.482 |
| ≥50 | 22 (84.6) | 15 (57.7) | 7 (26.9) | |
| <50 | 4 (15.4) | 2 (7.7) | 2 (7.7) | |
| Menopause, n
(%) | | | | 0.743 |
| Post | 16 (61.5) | 10 (38.5) | 6 (23.0) | |
| Pre | 8 (30.8) | 6 (23.1) | 2 (7.7) | |
| N/A | 2 (7.7) | 1 (3.85) | 1 (3.85) | |
| Histological grade,
n (%) | | | | 0.017 |
| 1 | 7 (26.9) | 2 (7.7) | 5 (19.2) | |
| ≥2 | 19 (73.1) | 15 (57.7) | 4 (15.4) | |
| T, n (%) | | | | 0.216 |
| 1 | 13 (50.0) | 7 (27.0) | 6 (23.0) | |
| ≥2 | 13 (50.0) | 10 (38.5) | 3 (11.5) | |
| N, n (%) | | | | 0.340 |
| − | 14 (53.9) | 8 (30.8) | 6 (23.1) | |
| + | 12 (46.1) | 9 (34.6) | 3 (11.5) | |
| M, n (%) | | | | N/A |
| 0 | 26 (100.0) | 17 (65.4) | 9 (34.6) | |
| 1 | 0.0 | 0.0 | 0.0 | |
LRRC26 downregulation and
hypermethylation occur exclusively in TNBC
To clarify the detailed methylation status,
bisulfite sequencing was performed using TNBC cell lines HCC1937,
BT20 and HCC70. It was found that the 200 bp upstream of the
transcription initiation site, including Seq.1 and Seq.2 CpG
islands, in LRRC26 were densely methylated in HCC1937, but
not in HCC70, although the Seq.1 CpG island was methylated
(Fig. 2A). Moreover, the same
regions in LRRC26 were partially methylated in BT20,
indicating that the methylation levels at the LRRC26
promoter region were in agreement with the level of LRRC26
expression in all three cell lines. Notably, LRRC26
expression was restored in a dose-dependent manner following
treatment with 5′-aza-dC in HCC1937 (Fig. 2B). Moreover, the methylation level
of LRRC26 was also significantly reduced in HCC1937 cells
following treatment with 5′-aza-dC (Fig. 2B).
Subsequently, RNA-seq analysis of 919 breast cancer
cases from TCGA dataset revealed that LRRC26 gene expression
in TNBC cases was significantly lower than that in other subtypes,
such as ER(+)/HER2(−), ER(±)/HER2(+) (Fig. 2C), whereas LRRC26 gene
methylation analysis of 625 cases on the same dataset was
significantly higher in TNBC cases than in other subtypes (Fig. 2D). Furthermore, bisulfite
pyrosequencing analysis was performed using a set of 12 TNBC
clinical tissues and adjacent normal breast tissues to analyze the
methylation level of LRRC26 at seqTCGA located 373 bp
upstream of the transcriptional start site (Fig. 2E). The results showed that the
methylation level of the seqTCGA CpG island was significantly
higher in all tumor tissues than that in the adjacent normal
mammary gland tissues (Wilcoxon signed-rank test: P=0.002)
(Fig. 2E). These data strongly
suggested that low LRRC26 expression due to hypermethylation
in its promoter region is exclusive to TNBC cases.
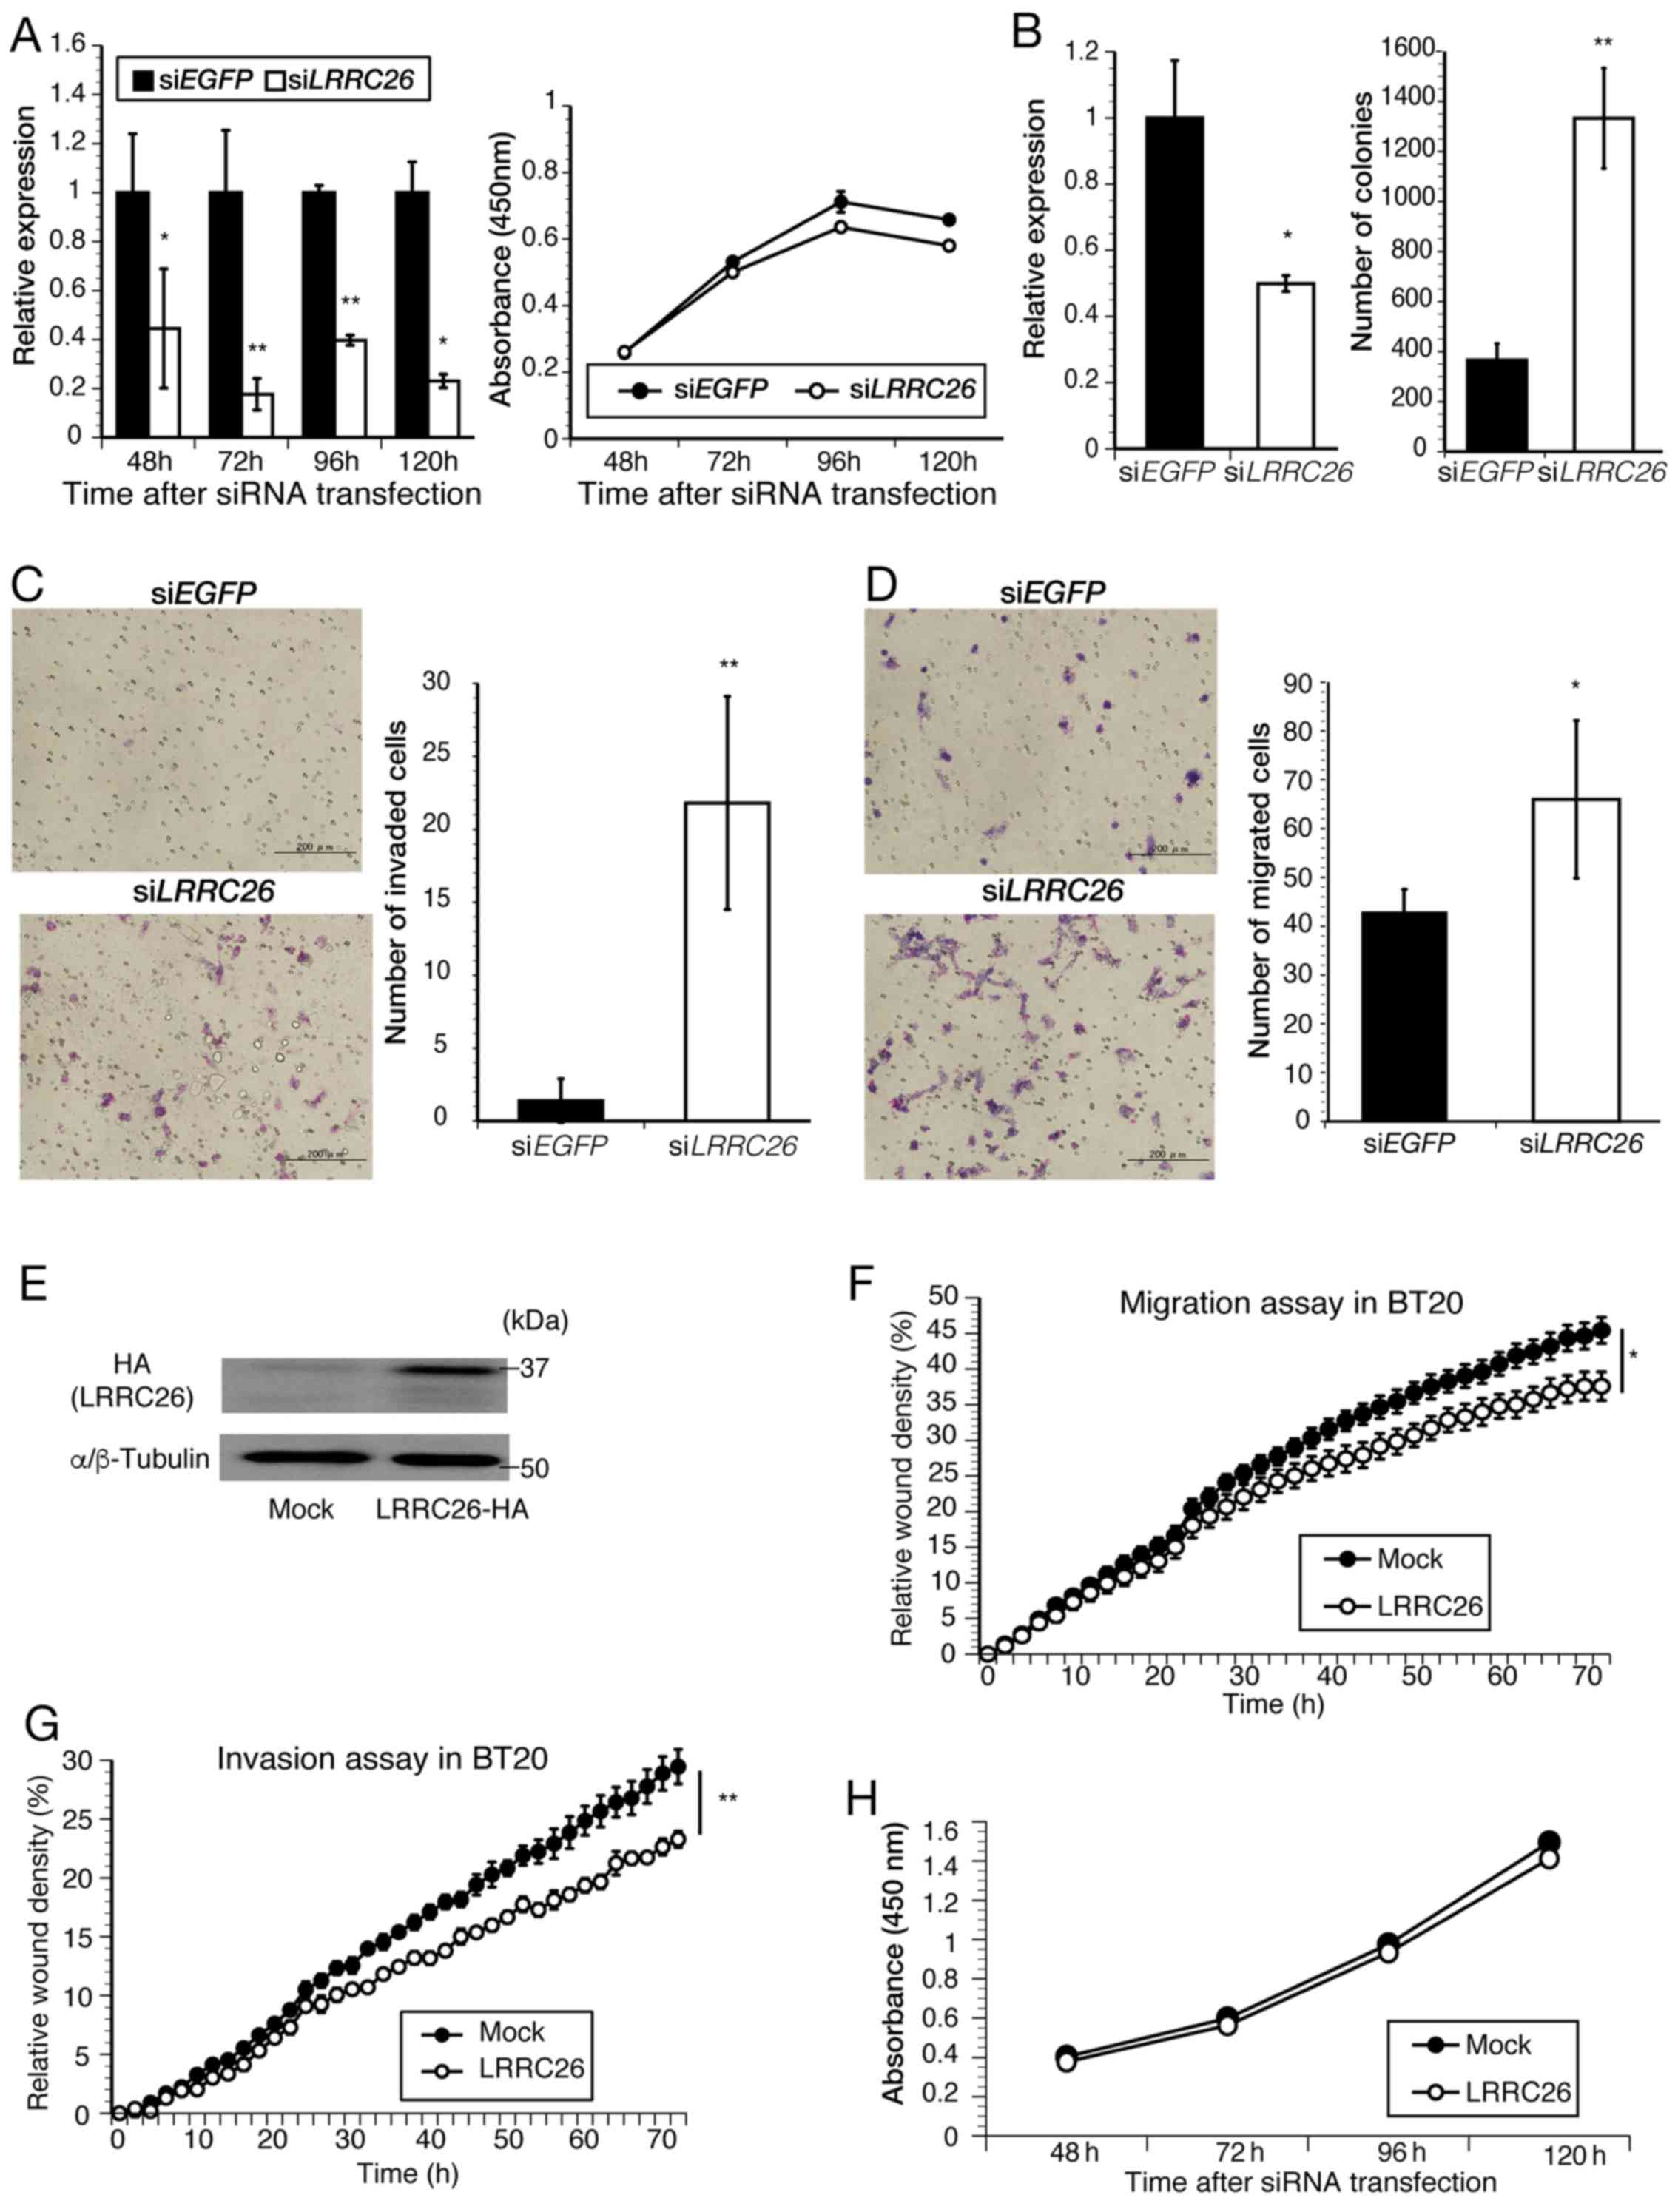
LRRC26 as a tumor suppressor in TNBC
cells
To investigate the impact of LRRC26 on cell
growth in HCC70 TNBC cells, standard cell proliferation assays were
performed. First, the knockdown of LRRC26 expression was
confirmed in HCC70 cells, in which LRRC26 was highly
expressed, as determined by qPCR (Fig.
3A), and it was found that LRRC26 silencing did not
affect cell proliferation (Fig.
3A), consistent with the findings of a previous study using
LNCaP prostate cancer cells (18).
Next, to further assess the tumor suppressive function of
LRRC26 on the development and progression of TNBC cells,
soft agar colony formation, invasion and migration assays were
performed to evaluate metastatic properties. Knocking down
LRRC26 expression significantly increased the number of
colonies in the soft agar (Fig.
3B), suggesting a critical role for LRRC26 in
anchorage-independent growth. Subsequent Matrigel invasion and
migration assays also revealed that siRNA-mediated depletion of
LRRC26 expression led to significant facilitation of HCC70
cell invasion and migration compared with that in
siEGFP-transfected cells (Fig. 3C and
D). Furthermore, the effects of LRRC26 overexpression on
migration, invasion and cell proliferation in BT-20 cells, which
express LRRC26 at a low level, were examined. The results
showed that LRRC26 overexpression led to a reduction in the
migration and invasion and abilities (Fig. 3F and G) of the cells, but did not
effect cell viability (Fig. 3H).
Taken together, these findings strongly suggest that LRRC26
suppresses the aggressive behavior of TNBC cells.
LRRC26 expression negatively regulates
the TNF-α-induced NF-κB pathway
LRRC26 has been reported to negatively
regulate NF-κB signaling in prostate cancer LNCaP cells (18). Therefore, the effect of
LRRC26 on NF-κB activity was examined in the present study
using a luciferase reporter assay and qPCR analysis. A significant
time-dependent decrease in luciferase activity was observed in the
presence of TNF-α stimulation with ectopic LRRC26 expression
compared with that in the mock control vector in 293T cells
(Fig. 4A). qPCR analysis showed
that siRNA-mediated LRRC26-knockdown significantly increased
the TNF-α-induced expression of the NF-κB target genes IL-6,
IL-8 and CXCL1 in HCC70 cells (Fig. 4B). These results suggested that
LRRC26 negatively regulates TNF-α-induced NF-κB
activity.
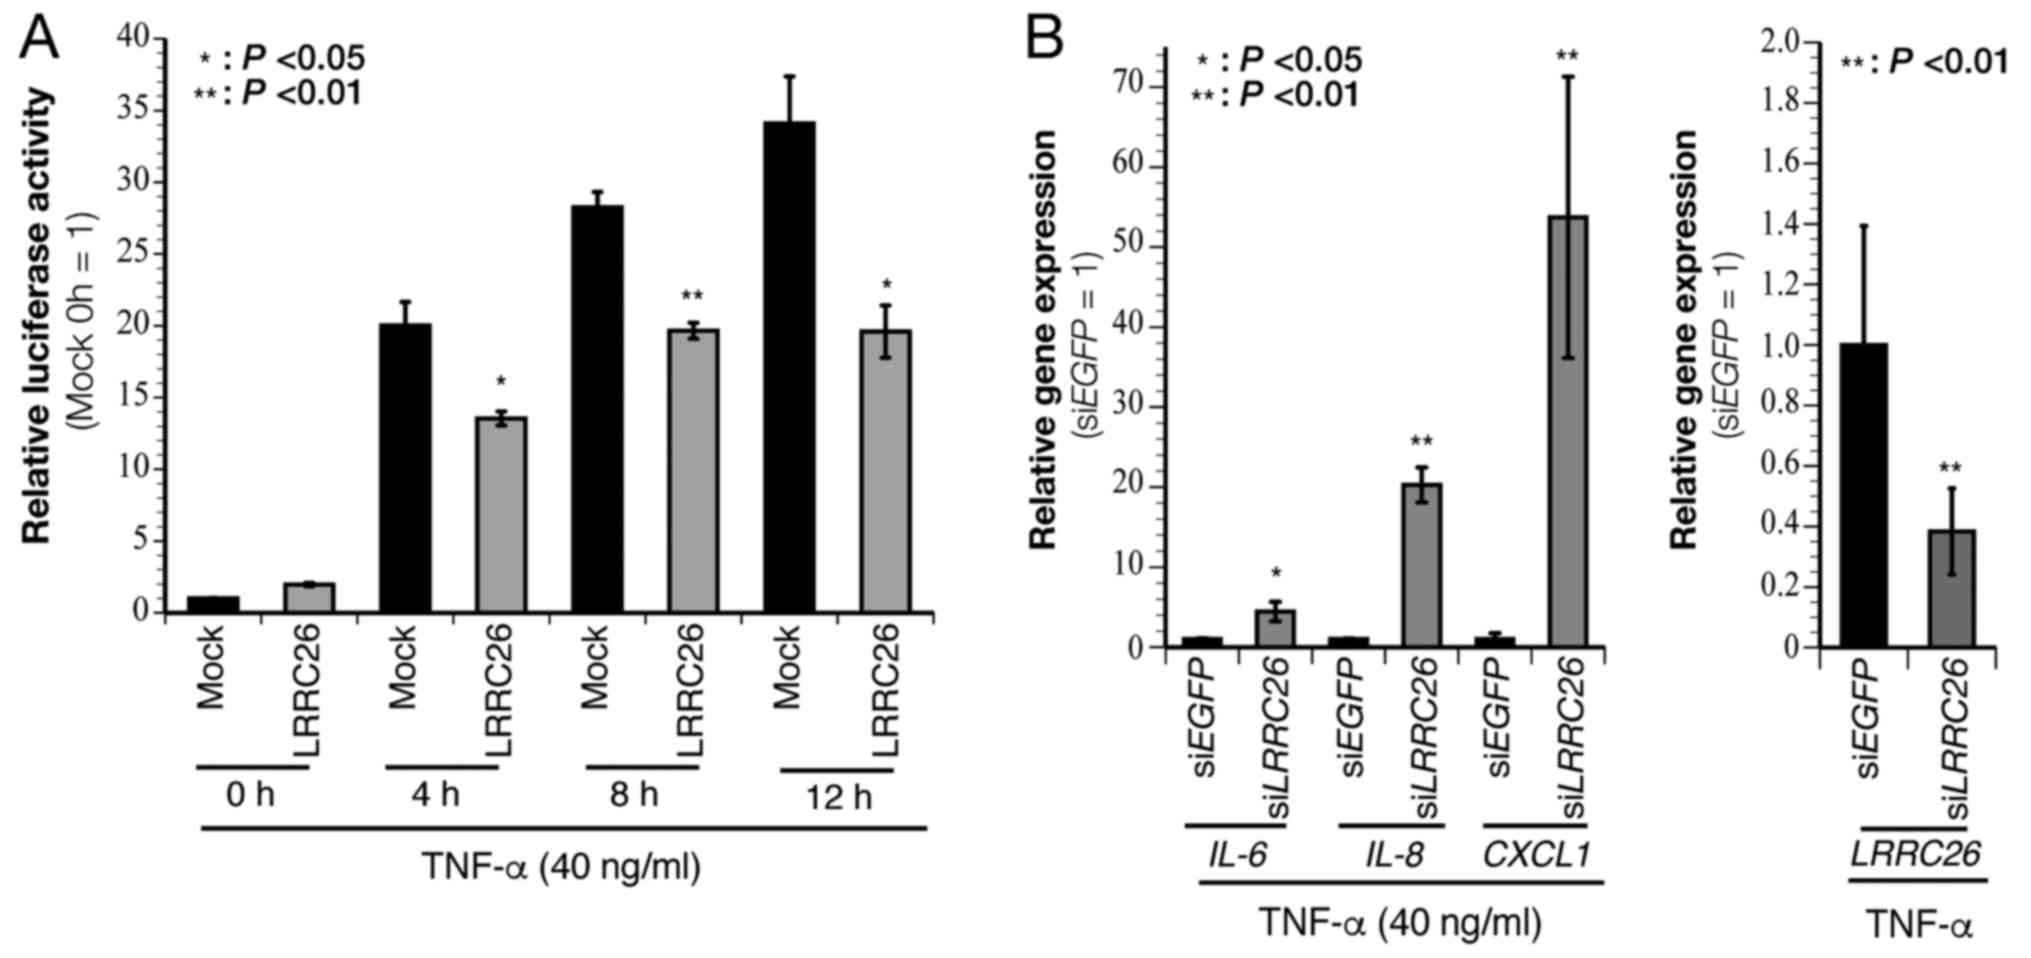 | Figure 4LRRC26 negatively regulates
the NF-κB pathway. (A) Luciferase assay using lysates of 293T cells
co-transfected with a luciferase reporter plasmid for NF-κB and a
LRRC26 gene plasmid following stimulation with TNF-α (40 ng/ml) for
0, 4, 8 and 12 h, respectively. (B) Quantitative polymerase chain
reaction analysis to evaluate the expression of NF-κB-target genes,
including IL-6, IL-8 and CXCL1, following
TNF-α (40 ng/ml) stimulation in siLRRC26-transfected HCC70 cells.
The data represent the mean ± standard deviation of each condition
(n=3, *P<0.05 and **P<0.01; two-sided
Student's t-test). LRRC26, leucine-rich repeat-containing
26; EGFP, enhanced green fluorescent protein; NF-κB, nuclear
factor-κB; si, small interfering; IL, interleukin; CXCL1, C-X-C
motif chemokine ligand-1; TNF-α, tumor necrosis factor-α. |
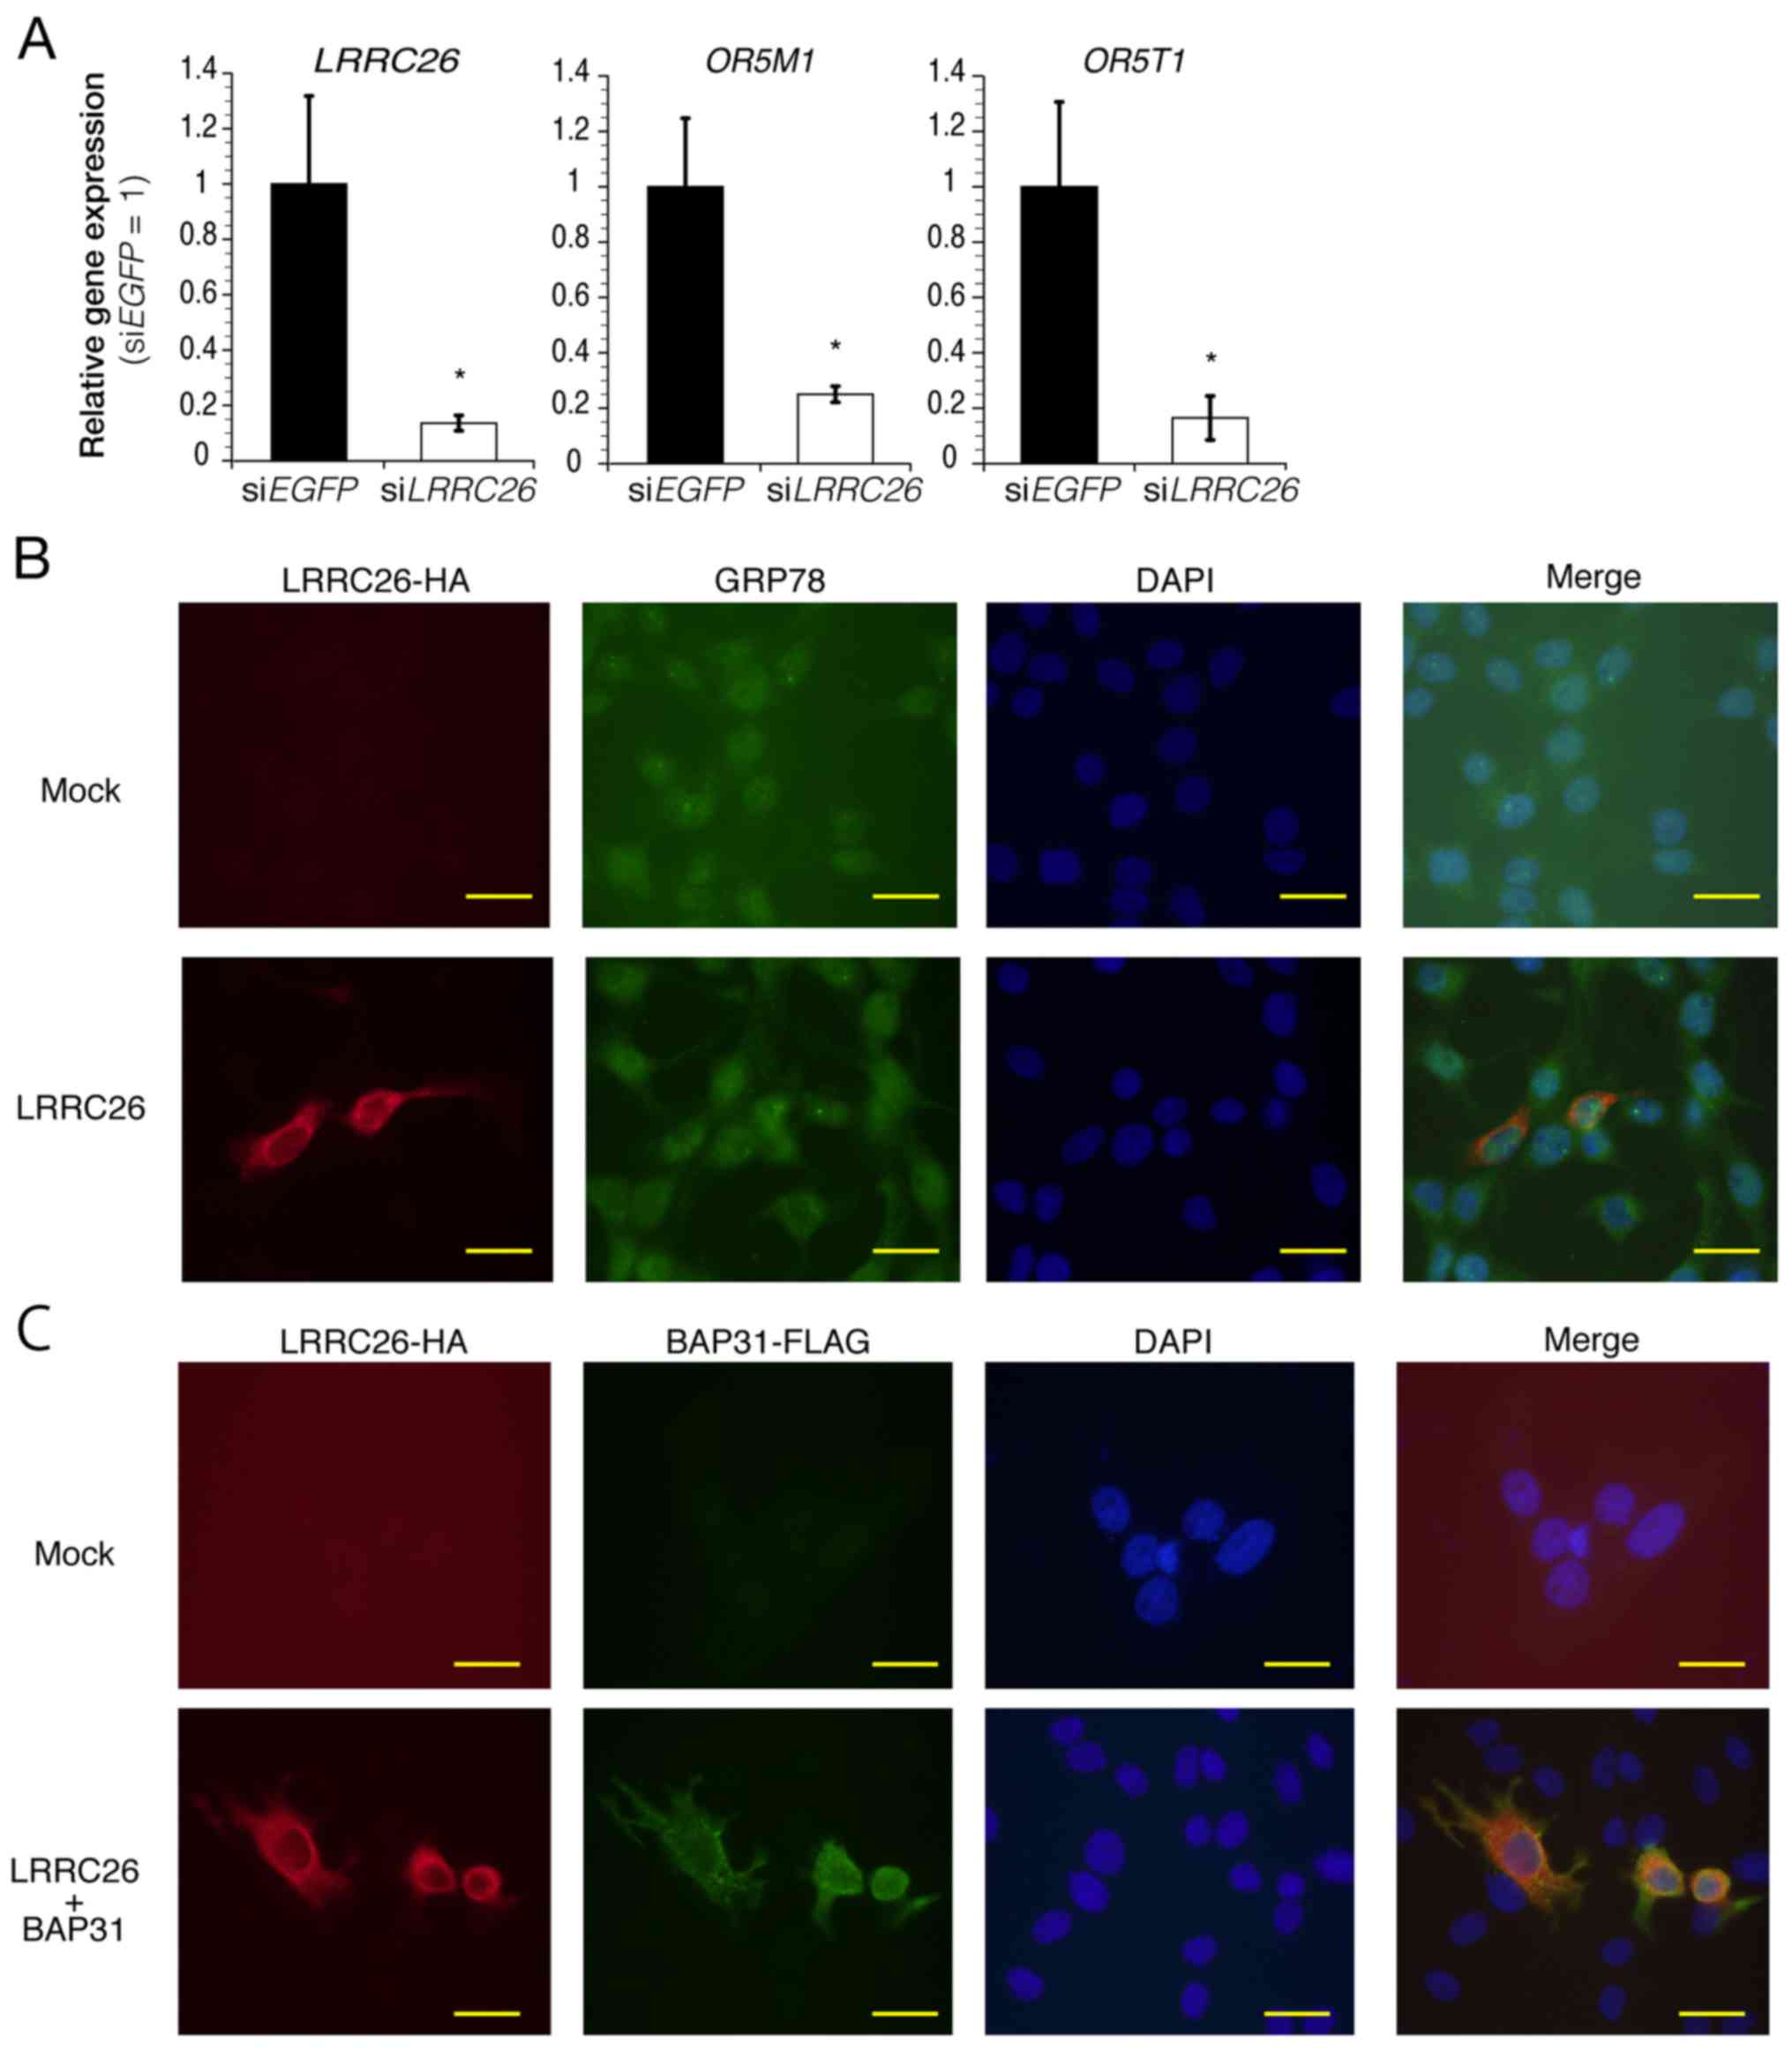
Functional gene annotation clustering
analysis
To further clarify the biological role of
LRRC26 in the progression or development of TNBC cells, the
present study attempted to identify the processes or pathways
associated with LRRC26 in TNBC cells. siLRRC26, or siEGFP as
a control, was transfected into HCC70 cells, which highly express
LRRC26, and alterations in gene expression were measured
using DNA microarray analysis. To identify genes associated with
LRRC26, genes were selected using the following criterion:
Expression level was decreased or increased by >3-fold in
siLRRC26-transfected cells compared with that in siEGFP-transfected
cells. This approach identified 230 genes that were altered upon
LRRC26-knockdown (Table V).
Among them, the downregulation of olfactory receptor family 5
subfamily M member 1 (OR5M1) and OR5T1 genes, which
encode members of olfactory GPCR protein, was verified in
LRRC26-depleted cells, as determined by qPCR (Fig. 5A). Notably, OR5T1 protein is
predicted to be N-glycosylated at Asn17, suggesting the possibility
that LRRC26 downregulation may be important for ORT51
glycosylation. To further identify significantly overrepresented
Gene Ontology terms affected by LRRC26 expression in HCC70
cells, these upregulated or downregulated genes were analyzed using
the DAVID algorithm (27,31). The most prominent cluster
(annotation cluster 1; gene enrichment score, 3.12) was identified,
which contained features related to 'glycoprotein', 'signal
peptide', 'secreted' and 'N-linked glycoprotein (GlcNAc)' (Table VI). Furthermore, the
immunocytochemical staining experiments showed that exogenous
HA-LRRC26 was found to be partially co-localized with endogenous
GRP78, a molecular chaperone localized in the endoplasmic reticulum
(Fig. 5B), and exogenous
FLAG-tagged BAP31, an integral membrane protein of the endoplasmic
reticulum, in BT20 cells (Fig.
5C), indicating the possibility that LRRC26 may function in the
endoplasmic reticulum of TNBC cells. These findings suggested the
possibility that LRRC26 downregulation may affect the
secretory pathway from the Golgi apparatus to the cell surface or
vesicle transport from the endoplasmic reticulum to the Golgi
apparatus in TNBC cells.
| Table VGenes that were altered upon
leucine-rich repeat-containing 26-knockdown according to DNA
microarray analysis (n=230). |
Table V
Genes that were altered upon
leucine-rich repeat-containing 26-knockdown according to DNA
microarray analysis (n=230).
| Gene symbol | Gene name | Fold-change |
|---|
| Upregulation | | |
|
ANKRD30A | Ankyrin repeat
domain 30A | 30.29 |
| MEPE | Matrix
extracellular phosphoglycoprotein | 26.45 |
| DACT1 | Dishevelled-binding
antagonist of β-catenin 1 | 24.11 |
| MGAT5B | Mannosyl
(α-1,6-)-glycoprotein β-1,6-N-acetyl-glucosaminyltransferase,
isozyme B | 17.55 |
| PLCB4 | Phospholipase C,
β4 | 17.10 |
| NME8 | NME/NM23 family
member 8 | 14.79 |
| HMCN2 | Hemicentin 2 | 13.61 |
| SLC2A7 | Solute carrier
family 2 (facilitated glucose transporter), member 7 | 13.57 |
|
TSPAN11 | Tetraspanin 11 | 11.90 |
| ACTG2 | Actin, gamma 2,
smooth muscle, enteric | 11.76 |
| CCL11 | Chemokine (C-C
motif) ligand 11 | 11.26 |
| GCNT3 | Glucosaminyl
(N-acetyl) transferase 3, mucin type | 10.82 |
|
CCDC162P | Coiled-coil domain
containing 162, pseudogene | 9.65 |
| EWSAT1 | Ewing sarcoma
associated transcript 1 | 9.18 |
| DPEP1 | Dipeptidase 1
(renal) | 9.01 |
| CAMP | Cathelicidin
antimicrobial peptide | 8.96 |
|
PPP1R42 | Protein phosphatase
1, regulatory subunit 42 | 8.01 |
|
COL24A1 | Collagen, type
XXIV, α1 | 7.82 |
| SCN5A | Sodium channel,
voltage gated, type Vα subunit | 7.50 |
|
TMEM236 | Transmembrane
protein 236 | 7.46 |
| ELF5 | E74-like factor 5
(ets domain transcription factor) | 7.23 |
| ITIH5 | Inter-α-trypsin
inhibitor heavy chain family, member 5 | 6.97 |
| NAT2 | N-acetyltransferase
2 (arylamine N-acetyltransferase) | 6.73 |
| DOCK2 | Dedicator of
cytokinesis 2 | 6.45 |
| CFAP61 | Cilia and
flagella-associated protein 61 | 6.10 |
| TRPA1 | Transient receptor
potential cation channel, subfamily A, member 1 | 6.07 |
| AZU1 | Azurocidin 1 | 5.84 |
| CLNK | Cytokine-dependent
hematopoietic cell linker | 5.83 |
| MORN3 | MORN repeat
containing 3 | 5.58 |
| ARSE | Arylsulfatase E
(chondrodysplasia punctata 1) | 5.46 |
| FENDRR | FOXF1 adjacent
non-coding developmental regulatory RNA | 5.27 |
| IZUMO4 | IZUMO family member
4 | 5.09 |
| PHOX2B | Paired-like
homeobox 2b | 4.99 |
|
DKFZP434L187 | Uncharacterized
LOC26082 | 4.90 |
|
WHAMMP3 | WAS protein homolog
associated with actin, golgi membranes and microtubules pseudogene
3 | 4.84 |
| PHYHIP | Phytanoyl-CoA
2-hydroxylase interacting protein | 4.81 |
| GRIK2 | Glutamate receptor,
ionotropic, kainate 2 | 4.68 |
| CNOT2 | CCR4-NOT
transcription complex, subunit 2 | 4.59 |
|
CCDC162P | Coiled-coil domain
containing 162, pseudogene | 4.53 |
|
TMEM236 | Transmembrane
protein 236 | 4.50 |
| MEGF11 | Multiple
EGF-like-domains 11 | 4.44 |
| TMEM35 | Transmembrane
protein 35 | 4.39 |
|
LDLRAD1 | Low density
lipoprotein receptor class A domain-containing 1 | 4.38 |
| FRMD3 | FERM domain
containing 3 | 4.34 |
| FGG | Fibrinogen γ
chain | 4.29 |
| GP6 | Glycoprotein VI
(platelet) | 4.28 |
|
C7orf69 | Chromosome 7 open
reading frame 69 | 4.21 |
| RNF17 | Ring finger protein
17 | 4.20 |
| PECAM1 |
Platelet/endothelial cell adhesion
molecule 1 | 4.19 |
| GRIK2 | Glutamate receptor,
ionotropic, kainate 2 | 4.16 |
| OR10V1 | Olfactory receptor,
family 10, subfamily V, member 1 | 4.11 |
| ASPDH | Aspartate
dehydrogenase domain containing | 4.02 |
| BCAS1 | Breast carcinoma
amplified sequence 1 | 3.99 |
|
ANKRD22 | Ankyrin repeat
domain 22 | 3.97 |
|
ALKBH3-AS1 | ALKBH3 antisense
RNA 1 | 3.96 |
|
TMEM215 | Transmembrane
protein 215 | 3.92 |
| CDSN | Corneodesmosin | 3.82 |
| PRR30 | Proline rich
30 | 3.75 |
| CCDC8 | Coiled-coil
domain-containing 8 | 3.75 |
|
GRAMD1B | GRAM
domain-containing 1B | 3.70 |
|
ANKRD20A12P | Ankyrin repeat
domain 20 family, member A12, pseudogene | 3.68 |
| OR5D18 | Olfactory receptor,
family 5, subfamily D, member 18 | 3.59 |
|
FAM209B | Family with
sequence similarity 209, member B | 3.57 |
| CLEC1B | C-type lectin
domain family 1, member B | 3.55 |
|
USP17L8 | Ubiquitin specific
peptidase 17-like family member 8 | 3.54 |
| BMF | Bcl-2 modifying
factor | 3.52 |
| ZFHX2 | Zinc finger
homeobox 2 | 3.52 |
| RBPMS | RNA binding protein
with multiple splicing | 3.51 |
| TTC29 | Tetratricopeptide
repeat domain 29 | 3.49 |
|
PCDH11Y | Protocadherin 11
Y-linked | 3.48 |
| EFHB | EF-hand domain
family, member B | 3.44 |
| NBAT1 |
Neuroblastoma-associated transcript 1 | 3.41 |
| HEMGN | Hemogen | 3.41 |
| WNT3A | Wingless-type MMTV
integration site family, member 3A | 3.32 |
| PARD6G | Par-6 family cell
polarity regulator γ | 3.31 |
| KCTD8 | Potassium channel
tetramerization domain-containing 8 | 3.30 |
|
MGC27382 | Uncharacterized
MGC27382 | 3.28 |
| P4HA3 | Prolyl
4-hydroxylase, α polypeptide III | 3.21 |
| SMIM9 | Small integral
membrane protein 9 | 3.19 |
| PTPRC | Protein tyrosine
phosphatase, receptor type, C | 3.16 |
| KLB | Klotho β | 3.13 |
| CLDN19 | Claudin 19 | 3.13 |
|
MGC27382 | Uncharacterized
MGC27382 | 3.13 |
| ZP1 | Zona pellucida
glycoprotein 1 (sperm receptor) | 3.13 |
| PTPRC | Protein tyrosine
phosphatase, receptor type, C | 3.12 |
|
C15orf32 | Chromosome 15 open
reading frame 32 | 3.11 |
| NLRP12 | NLR family, pyrin
domain containing 12 | 3.11 |
| POLH | Polymerase (DNA
directed), η | 3.08 |
|
KIAA1731NL | KIAA1731 N-terminal
like | 3.06 |
| PRPS1 | Phosphoribosyl
pyrophosphate synthetase 1 | 3.05 |
| Downregulation | | |
|
DCAF12L1 | DDB1 and CUL4
associated factor 12-like 1 | −31.73 |
| REG3A | Regenerating
islet-derived 3 α | −29.34 |
|
CXorf21 | Chromosome X open
reading frame 21 | −23.23 |
| TAT | Tyrosine
aminotransferase | −22.82 |
| MS4A12 | Membrane-spanning
4-domains, subfamily A, member 12 | −22.56 |
| OR5M1 | Olfactory receptor,
family 5, subfamily M, member 1 | −20.76 |
|
C10orf90 | Chromosome 10 open
reading frame 90 | −19.70 |
| ADAM5 | ADAM
metallopeptidase domain 5 (pseudogene) | −18.73 |
|
HNRNPKP3 | Heterogeneous
nuclear ribonucleoprotein K pseudogene 3 | −17.57 |
| BMP7 | Bone morphogenetic
protein 7 | −17.32 |
| OR5T1 | Olfactory receptor,
family 5, subfamily T, member 1 | −16.91 |
| AQP10 | Aquaporin 10 | −16.63 |
| NBAT1 | Neuroblastoma
associated transcript 1 | −16.43 |
| OR1A1 | Olfactory receptor,
family 1, subfamily A, member 1 | −16.24 |
| CALY | Calcyon
neuron-specific vesicular protein | −15.47 |
|
MAP3K13 | Mitogen-activated
protein kinase kinase kinase 13 | −14.49 |
|
NCRNA00249 | Uncharacterized
LOC101926947 | −13.95 |
|
SLC22A11 | Solute carrier
family 22 (organic anion/urate transporter), member 11 | −13.81 |
|
SNORD116-11 | Small nucleolar
RNA, C/D box 116-11 | −13.67 |
| LILRB4 | Leukocyte
immunoglobulin-like receptor, subfamily B (with TM and ITIM
domains), member 4 | −13.62 |
| ERVV-2 | Endogenous
retrovirus group V, member 2 | −13.31 |
| TTC24 | Tetratricopeptide
repeat domain 24 | −12.83 |
|
PCDHB15 | Protocadherin
β15 | −11.64 |
|
ZNF705G | Zinc finger protein
705G | −10.80 |
| FAM20A | Family with
sequence similarity 20, member A | −10.79 |
| LILRA3 | Leukocyte
immunoglobulin-like receptor, subfamily A (without TM domain),
member 3 | −10.65 |
| PALM2 | Paralemmin 2 | −10.33 |
| RSPH6A | Radial spoke head 6
homolog A (Chlamydomonas) | −10.25 |
|
ANGPTL1 | Angiopoietin-like
1 | −10.14 |
| ATP8B2 | ATPase,
aminophospholipid transporter, class I, type 8B, member 2 | −10.07 |
| FMO9P | Flavin containing
monooxygenase 9 pseudogene | −9.60 |
|
MEIS1-AS2 | MEIS1 antisense RNA
2 | −9.47 |
| PKDCC | Protein kinase
domain containing, cytoplasmic | −9.20 |
| RBMY1B | RNA binding motif
protein, Y-linked, family 1, member B | −9.19 |
| CFAP46 | Cilia and
flagella-associated protein 46 | −9.06 |
| BIRC8 | Baculoviral IAP
repeat-containing 8 | −8.96 |
| PENK | Proenkephalin | −8.95 |
|
C9orf47 | Chromosome 9 open
reading frame 47 | −8.73 |
| PRDM16 | PR domain
containing 16 | −8.70 |
|
FAM104B | Family with
sequence similarity 104, member B | −8.54 |
| NLRP4 | NLR family, pyrin
domain containing 4 | −8.51 |
|
MOV10L1 | Mov10 RISC complex
RNA helicase like 1 | −8.30 |
| SLAMF8 | SLAM family member
8 | −8.28 |
|
C7orf71 | Chromosome 7 open
reading frame 71 | −8.18 |
| SOGA3 | SOGA family member
3 | −8.16 |
|
SLC2A1-AS1 | SLC2A1 antisense
RNA 1 | −8.15 |
| TXNDC8 | Thioredoxin
domain-containing 8 (spermatozoa) | −7.80 |
| PCLO | Piccolo presynaptic
cytomatrix protein | −7.75 |
| RNF17 | Ring finger protein
17 | −7.69 |
| ACADL | Acyl-CoA
dehydrogenase, long chain | −7.46 |
| GPR123 | G protein-coupled
receptor 123 | −7.41 |
|
RPS6KA2-AS1 | RPS6KA2 antisense
RNA 1 | −7.26 |
| LRRC34 | Leucine rich repeat
containing 34 | −7.21 |
| TMEM98 | Transmembrane
protein 98 | −7.18 |
| DACT2 | Dishevelled-binding
antagonist of β-catenin 2 | −6.94 |
|
C20orf173 | Chromosome 20 open
reading frame 173 | −6.85 |
| TBX18 | T-box 18 | −6.64 |
|
ANKRD62 | Ankyrin repeat
domain 62 | −6.43 |
| VAX1 | Ventral anterior
homeobox 1 | −6.15 |
|
PIP5K1B |
Phosphatidylinositol-4-phosphate 5-kinase,
type I, β | −6.07 |
| MZB1 | Marginal zone B and
B1 cell-specific protein | −6.04 |
|
MIR3663HG | miR3663 host gene
(non-protein coding) | −6.03 |
|
DEFB133 | Defensin, β133 | −5.99 |
| MMP13 | Matrix
metallopeptidase 13 (collagenase 3) | −5.94 |
|
ZFYVE28 | Zinc finger, FYVE
domain containing 28 | −5.82 |
| DUX3 | Double homeobox
3 | −5.81 |
| IFNL3 | Interferon λ3 | −5.80 |
| MT1DP | Metallothionein 1D,
pseudogene (functional) | −5.61 |
|
TP53AIP1 | Tumor protein p53
regulated apoptosis inducing protein 1 | −5.50 |
| KCNMA1 | Potassium channel,
calcium activated large conductance subfamily Mα, member 1 | −5.47 |
|
MRPL23-AS1 | MRPL23 antisense
RNA 1 | −5.41 |
| PCSK1 | Proprotein
convertase subtilisin/kexin type 1 | −5.37 |
| IPW | Imprinted in
Prader-Willi syndrome (non-protein coding) | −5.24 |
| UPK1A | Uroplakin 1A | −5.09 |
| NAIP | NLR family,
apoptosis inhibitory protein | −4.84 |
| ABI3BP | ABI family, member
3 (NESH) binding protein | −4.79 |
| ENDOV | Endonuclease V | −4.66 |
| MAP2 |
Microtubule-associated protein 2 | −4.66 |
| HMBOX1 | Homeobox containing
1 | −4.65 |
| CHIAP2 | Chitinase, acidic
pseudogene 2 | −4.60 |
|
BMS1P17 | BMS1 pseudogene
17 | −4.52 |
| SPOCK3 | Sparc/osteonectin,
cwcv and kazal-like domains proteoglycan (testican) 3 | −4.51 |
| RASSF3 | Ras association
(RalGDS/AF-6) domain family member 3 | −4.51 |
|
SLC24A1 | Solute carrier
family 24 (sodium/potassium/calcium exchanger), member 1 | −4.47 |
| NR1H2 | Nuclear receptor
subfamily 1, group H, member 2 | −4.46 |
| RBMY1B | RNA binding motif
protein, Y-linked, family 1, member B | −4.42 |
| BPIFB4 | BPI fold containing
family B, member 4 | −4.39 |
| RAG2 | Recombination
activating gene 2 | −4.34 |
| RBMXL2 | RNA binding motif
protein, X-linked-like 2 | −4.26 |
| MASP1 | Mannan-binding
lectin serine peptidase 1 (C4/C2 activating component of
Ra-reactive factor) | −4.25 |
| AIPL1 | Aryl hydrocarbon
receptor interacting protein-like 1 | −4.16 |
| SGPP2 |
Sphingosine-1-phosphate phosphatase 2 | −4.13 |
| PLGLB1 | Plasminogen-like
B1 | −4.12 |
| NPAS3 | Neuronal PAS domain
protein 3 | −4.09 |
|
FLJ16734 | Uncharacterized
LOC641928 | −4.06 |
| LRRTM4 | Leucine rich repeat
transmembrane neuronal 4 | −4.04 |
| TPTE2 | Transmembrane
phosphoinositide 3-phosphatase and tensin homolog 2 | −3.95 |
|
FLJ36777 | Uncharacterized
LOC730971 | −3.91 |
| DNAI1 | Dynein, axonemal,
intermediate chain 1 | −3.88 |
| ROBO4 | Roundabout, axon
guidance receptor, homolog 4 (Drosophila) | −3.84 |
| ALOX15 | Arachidonate
15-lipoxygenase | −3.79 |
| OLIG3 | Oligodendrocyte
transcription factor 3 | −3.78 |
| MON2 | MON2 homolog (S.
cerevisiae) | −3.76 |
| MON2 | MON2 homolog (S.
cerevisiae) | −3.75 |
| CASC11 | Cancer
susceptibility candidate 11 (non-protein coding) | −3.68 |
| CRISP2 | Cysteine-rich
secretory protein 2 | −3.68 |
| RAB41 | RAB41, member RAS
oncogene family | −3.61 |
|
ALS2CR12 | Amyotrophic lateral
sclerosis 2 (juvenile) chromosome region, candidate 12 | −3.56 |
| GLYCTK | Glycerate
kinase | −3.55 |
|
NCRNA00250 | Non-protein coding
RNA 250 | −3.51 |
| VCAM1 | Vascular cell
adhesion molecule 1 | −3.44 |
| OPALIN | Oligodendrocytic
myelin paranodal and inner loop protein | −3.41 |
| AKNAD1 | AKNA domain
containing 1 | −3.40 |
| ATP1A2 | ATPase,
Na+/K+ transporting, α2 polypeptide | −3.39 |
| OTOGL | Otogelin-like | −3.35 |
| MUC6 | Mucin 6, oligomeric
mucus/gel-forming | −3.33 |
|
FAM230A | Family with
sequence similarity 230, member A | −3.32 |
| KRT6A | Keratin 6A, type
II | −3.32 |
|
SLC25A21-AS1 | SLC25A21 antisense
RNA 1 | −3.31 |
| GLYCTK | Glycerate
kinase | −3.29 |
| DRD2 | Dopamine receptor
D2 | −3.29 |
| CECR6 | Cat eye syndrome
chromosome region, candidate 6 | −3.29 |
|
PRKCQ-AS1 | PRKCQ antisense RNA
1 | −3.28 |
|
ADAMTS6 | ADAM
metallopeptidase with thrombospondin type 1 motif, 6 | −3.27 |
|
CCDC178 | Coiled-coil domain
containing 178 | −3.26 |
| LTN1 | Listerin E3
ubiquitin protein ligase 1 | −3.25 |
|
C10orf71-AS1 | C10orf71 antisense
RNA 1 | −3.23 |
| SPDYE5 | Speedy/RINGO cell
cycle regulator family member E5 | −3.21 |
| CD180 | CD180 molecule | −3.20 |
|
DPY19L2 | Dpy-19-like 2
(C. elegans) | −3.20 |
| SCEL | Sciellin | −3.13 |
| PTGIR | Prostaglandin I2
(prostacyclin) receptor (IP) | −3.10 |
| ABCB1 | ATP-binding
cassette, sub-family B (MDR/TAP), member 1 | −3.10 |
| ABCC2 | ATP-binding
cassette, sub-family C (CFTR/MRP), member 2 | −3.09 |
| MYL10 | Myosin, light chain
10, regulatory | −3.07 |
| OR5M9 | Olfactory receptor,
family 5, subfamily M, member 9 | −3.06 |
|
APCDD1L-AS1 | APCDD1L antisense
RNA 1 (head to head) | −3.06 |
|
SULT1B1 | Sulfotransferase
family, cytosolic, 1B, member 1 | −3.05 |
| CFAP58 | Cilia and
flagella-associated protein 58 | −3.03 |
| TERF1 | Telomeric repeat
binding factor (NIMA-interacting) 1 | −3.03 |
| Table VIFunctional gene annotation clustering
analysis of annotation cluster one (enrichment score: 3.12) based
on the Database for Annotation, Visualization and Integrated
Discovery algorithma. |
Table VI
Functional gene annotation clustering
analysis of annotation cluster one (enrichment score: 3.12) based
on the Database for Annotation, Visualization and Integrated
Discovery algorithma.
| Category | Term | No. of genes | P-value |
|---|
| UP_KEYWORDS | Glycoprotein | 66 |
8.32×10⁻⁵ |
| UP_SEQ_FEATURE | Signal peptide | 51 |
1.21×10⁻⁴ |
| UP_SEQ_FEATURE | Glycosylation
site:N-linked (GlcNAc…) | 58 |
5.77×10⁻⁴ |
| UP_KEYWORDS | Secreted | 33 |
1.09×10⁻³ |
| UP_KEYWORDS | Signal | 57 |
1.45×10⁻³ |
| UP_KEYWORDS | Disulfide bond | 49 |
1.64×10⁻³ |
Discussion
Genetic and epigenetic inactivation involving DNA
methylation and histone modifications of tumor suppressor genes
serve a crucial role in the progression and development of breast
cancer (20,32). Notably, aberrant promoter
hypermethylation of tumor suppressor genes is commonly observed in
breast cancer and is the predominant mechanism for loss of
function. In the present study, it was demonstrated that
LRRC26 downregulation contributes to the progression and
development of TNBC, although further analysis of understanding of
the mechanism of LRRC26 upregulation in breast cancer,
particularly ER- and HER2-positive breast cancer, will be
necessary. Although RNA-seq and public TCGA database analyses
identified no somatic mutations of the LRRC26 mRNA in the
TNBC tissues and cell lines, the frequent downregulation of
LRRC26 due to promoter hypermethylation at Seq.1 and Seq.2
in TNBC tissues and cell lines was observed (Fig. 1B–E). Notably, LRRC26 was
highly expressed in HCC70 cells, but not in MDA-MB-231 cells,
whereas LRRC26 methylation levels at the two CpG sites were
similar between HCC70 and MDA-MB-231 cells (Fig. 1D and E). This discrepancy implies
the existence of other critical CpG sites in the LRRC26
promoter region that may be responsible for gene silencing. In
fact, the methylation level of the seqTCGA CpG island, located 373
bp upstream of the transcriptional start site, was significantly
higher in all tumor tissues compared with that in adjacent normal
mammary gland tissues (Fig. 2E).
By contrast, LRRC26 was also not methylated in other CpG
islands within 200 bp of the transcription initiation site,
particularly around the transcription initiation site of the
LRRC26 gene in HCC70 cells. Notably, miRDB, an online
database for miRNA target prediction (33), predicted LRRC26 as a target
of hsa-miR-1275. hsa-miR-1275 is reported to be upregulated in
young women (<35 years old) with breast cancer compared with
that in older women (>65 and 45–65 years old) (34), as well as in MDA-MB-231 TNBC cells
(35), suggesting the possibility
that epigenetic and miRNA-mediated inactivation may contribute to
LRRC26 downregulation.
By analyzing TCGA RNA-seq public databases in the
present study, it was found that LRRC26 gene expression was
significantly lower in TNBC cases than in ER-positive/HER2-negative
and ER-negative/HER2-positive breast cancer cases (Fig. 2C and D), suggesting that
hypermethylation-mediated LRRC26 inactivation may be a
TNBC-specific event in the progression and development of cancer
cells. Further statistical analysis demonstrated that LRRC26
downregulation was significantly associated with increased
histological grade in patients with TNBC (P=0.017; χ2
test) (Table IV), whereas
Kaplan-Meier analysis revealed no significant association between
LRRC26 downregulation and the overall survival of patients
with TNBC (data not shown). These findings suggested that
LRRC26 downregulation may be involved in the aggressiveness
of TNBC, but that in addition to LRRC26 downregulation,
other factors may also be necessary to drive malignacy. Further
analysis of the association between LRRC26 downregulation
and prognosis using a large number of TNBC samples will also be
necessary. Furthermore, LRRC26 has been reported to suppress
tumor growth by negatively regulating NF-κB signaling in LNCaP and
MDA-MB-231 cells (18). However,
in the present study, the upregulation of NF-κB-target genes in the
absence of TNF-α stimulation was not observed in
LRRC26-depleted HCC70 cells (data not shown), although the
upregulation of NF-κB-target genes in the presence of TNF-α
stimulation was observed in these cells (Fig. 4B). These results suggest that
LRRC26 downregulation may be important for TNF-α-mediated
NF-κB activation in TNBC cells. Furthermore, LRRC26
expression has been reported to promote anchorage-independent
growth in MDA-MB231 cells (18).
The present study also found that knocking down LRRC26
increased not only anchorage-independent growth, but also invasion
and migration in HCC70 cells; however, it did not promote
proliferation in the absence of TNF-α stimulation, suggesting that
LRRC26 downregulation is critical for the TNF-α-mediated
NF-κB-independent progression of TNBC.
To investigate biological roles of LRRC26
distinct from the NF-κB pathway in TNBC cells, DNA microarray
analysis was performed using siLRRC26-transfected HCC70 cells.
Functional annotation clustering revealed that upregulated and
downregulated genes in LRRC26-depleted HCC70 cells are
functionally associated with protein secretion and N-linked
glycosylation. These findings suggest the possibility that
LRRC26 downregulation may affect the secretory pathway from
the Golgi apparatus to the cell surface or vesicle transport from
the endoplasmic reticulum to the Golgi apparatus.
LRRC26 protein, a member of the LRR
superfamily, has been reported to act as a big potassium (BK)
channel auxiliary subunit, whereas the regulation of NF-κB
activation by LRRC26 is independent of BK channels (36). Notably, LRRC26 is also predicted to
be present on the endoplasmic reticulum membrane via its N-terminal
LRR domain, as LRRC26 is N-glycosylated at an Asn147 site in the
endoplasmic reticulum (36).
LRRC26 has been reported to localize in the endoplasmic reticulum
(36). In fact, the present study
demonstrated that LRRC26 was observed to be co-localized with GRP78
and BAP31 in the endoplasmic reticulum of TNBC cells (Fig. 5B and C). Moreover, N-linked
glycoproteins are composed of a polypeptide glycosylated in the
endoplasmic reticulum with several carbonate chains via asparagine
residues, and have critical roles in cell-cell interaction and cell
adhesion for invasive and metastatic behaviors in breast cancer.
These results strongly suggest that LRRC26 may serve a role
in breast cancer progression (37–40).
However, further analyses are required to elucidate the effects of
LRRC26 downregulation on N-linked glycosylation in TNBC
cells.
In summary, the present study demonstrated that the
methylation-mediated inactivation of LRRC26 resulted in
enhancement of anchorage-independent growth-, invasion- and
migration-associated metastatic behavior. Notably, frequent
methylation-mediated inactivation of LRRC26 is a
TNBC-specific event that may be a potential diagnostic
biomarker.
Acknowledgments
The authors would like to thank Dr Junichi
Kurebayashi (Kawasaki Medical School, Kurashiki, Okayama, Japan)
for gifting the KPL-3C breast cancer cell line, and Ms. Hinako
Koseki and Ms. Hitomi Kawakami (Division of Genome Medicine,
Institute for Genome Research, Tokushima University, Tokushima,
Japan) for providing excellent technical support.
Notes
[1]
Funding
This research was supported by the Tailor-Made
Medical Treatment with the BBJ Project (grant no. 13418656) and
Practical Research for Innovative Cancer Control (grant no.
12103129) from the Japan Agency for Medical Research and
Development.
[2] Availability
of data and materials
The assessed TCGA data set was from the TCGA portal
(http://cancergenome.nih.gov/). The
RNA-Seq data (accession no. JGAS00000000116) used in Fig. 1A were deposit in the DNA DataBank
of Japan (http://www.ddbj.nig.ac.jp/). The
microarray data (GSE90582) were submitted to the NCBI Gene
Expression Omnibus archive (https://www.ncbi.nlm.nih.gov/geo/).
[3] Authors'
contributions
YMiyagawa performed all experiments, interpreted
all data and prepared the draft of the manuscript. YMatsushita
performed the analyses for LRRC26 expression, invasion,
migration assay by Incucyte and immunocytochemical staining,
interpreted all data and prepared the draft and final version of
the manuscript. HS performed the methylation of LRRC26 and
analyses for TCGA data sets. MK and TY provided the interpretation
of LRRC26 expression and function. RK performed the analyses
for the luciferase assay. AY and AT provided the interpretation of
the clinical association data. JH and MS prepared the clinical
specimens and provided the interpretation of the clinical
association data. YMiyoshi discussed the interpretation of all
data. TK was involved in the conception and design of all studies,
the interpretation of the data, and the preparation of the draft
and final version of the manuscript. All authors read and approved
the final manuscript.
[4] Ethics
approval and consent to participate
The present study, as well as the use of all
clinical materials aforementioned, was approved by the Ethics
Committee of Tokushima University (permission no. H29-15 for
expression profile analysis and permission no. H29-14 for RNA-seq
analysis).
[5] Consent for
publication
Clinical specimens were obtained with informed
consent from patients who were treated at the Tokushima Breast Care
Clinic (Tokushima, Japan), as previously described (20), with permission to publish their
data.
[6] Competing
interests
The authors declare that they have no competing
interests.
References
|
1
|
Fisher B, Anderson S, Tan-Chiu E, Wolmark
N, Wickerham DL, Fisher ER, Dimitrov NV, Atkins JN, Abramson N,
Merajver S, et al: Tamoxifen and chemotherapy for axillary
node-negative, estrogen receptor-negative breast cancer: Findings
from National Surgical Adjuvant Breast and Bowel Project B-23. J
Clin Oncol. 19:931–942. 2001. View Article : Google Scholar : PubMed/NCBI
|
|
2
|
Colleoni M, Gelber S, Goldhirsch A, Aebi
S, Castiglione-Gertsch M, Price KN, Coates AS and Gelber RD;
International Breast Cancer Study Group: Tamoxifen after adjuvant
chemotherapy for premenopausal women with lymph node-positive
breast cancer: International Breast Cancer Study Group Trial 13-93.
J Clin Oncol. 24:1332–1341. 2006. View Article : Google Scholar : PubMed/NCBI
|
|
3
|
Merglen A, Verkooijen HM, Fioretta G,
Neyroud-Caspar I, Vinh-Hung V, Vlastos G, Chappuis PO, Castiglione
M, Rapiti E and Bouchardy C: Hormonal therapy for oestrogen
receptor-negative breast cancer is associated with higher
disease-specific mortality. Ann Oncol. 20:857–861. 2009. View Article : Google Scholar : PubMed/NCBI
|
|
4
|
Huszno J and Nowara E: Current therapeutic
strategies of anti-HER2 treatment in advanced breast cancer
patients. Contemp Oncol (Pozn). 20:1–7. 2016.
|
|
5
|
Foulkes WD, Smith IE and Reis-Filho JS:
Triple-negative breast cancer. N Engl J Med. 363:1938–1948. 2010.
View Article : Google Scholar : PubMed/NCBI
|
|
6
|
Liedtke C, Mazouni C, Hess KR, André F,
Tordai A, Mejia JA, Symmans WF, Gonzalez-Angulo AM, Hennessy B,
Green M, et al: Response to neoadjuvant therapy and long-term
survival in patients with triple-negative breast cancer. J Clin
Oncol. 26:1275–1281. 2008. View Article : Google Scholar : PubMed/NCBI
|
|
7
|
Gradishar WJ, Anderson BO, Balassanian R,
Blair SL, Burstein HJ, Cyr A, Elias AD, Farrar WB, Forero A,
Giordano SH, et al: Invasive Breast Cancer Version 1.2016, NCCN
Clinical Practice Guidelines in Oncology. J Natl Compr Canc Netw.
14:324–354. 2016. View Article : Google Scholar
|
|
8
|
Cortes J, O'Shaughnessy J, Loesch D, Blum
JL, Vahdat LT, Petrakova K, Chollet P, Manikas A, Diéras V,
Delozier T, et al EMBRACE (Eisai Metastatic Breast Cancer Study
Assessing Physician's Choice Versus E7389) investigators: Eribulin
mono-therapy versus treatment of physician's choice in patients
with metastatic breast cancer (EMBRACE): A phase 3 open-label
randomised study. Lancet. 377:914–923. 2011. View Article : Google Scholar : PubMed/NCBI
|
|
9
|
Denkert C, Liedtke C, Tutt A and von
Minckwitz G: Molecular alterations in triple-negative breast
cancer-the road to new treatment strategies. Lancet. 389:2430–2442.
2017. View Article : Google Scholar
|
|
10
|
Kim JE, Ahn HJ, Ahn JH, Yoon DH, Kim SB,
Jung KH, Gong GY, Kim MJ, Son BH and Ahn SH: Impact of
triple-negative breast cancer phenotype on prognosis in patients
with stage I breast cancer. J Breast Cancer. 15:197–202. 2012.
View Article : Google Scholar : PubMed/NCBI
|
|
11
|
Lehmann BD, Bauer JA, Chen X, Sanders ME,
Chakravarthy AB, Shyr Y and Pietenpol JA: Identification of human
triple-negative breast cancer subtypes and preclinical models for
selection of targeted therapies. J Clin Invest. 121:2750–2767.
2011. View Article : Google Scholar : PubMed/NCBI
|
|
12
|
Cancer Genome Atlas N; Cancer Genome Atlas
Network: Comprehensive molecular portraits of human breast tumours.
Nature. 490:61–70. 2012. View Article : Google Scholar : PubMed/NCBI
|
|
13
|
Pereira B, Chin SF, Rueda OM, Vollan HK,
Provenzano E, Bardwell HA, Pugh M, Jones L, Russell R, Sammut SJ,
et al: The somatic mutation profiles of 2,433 breast cancers
refines their genomic and transcriptomic landscapes. Nat Commun.
7:114792016. View Article : Google Scholar : PubMed/NCBI
|
|
14
|
Shah SP, Roth A, Goya R, Oloumi A, Ha G,
Zhao Y, Turashvili G, Ding J, Tse K, Haffari G, et al: The clonal
and mutational evolution spectrum of primary triple-negative breast
cancers. Nature. 486:395–399. 2012.PubMed/NCBI
|
|
15
|
O'Shaughnessy J, Osborne C, Pippen JE,
Yoffe M, Patt D, Rocha C, Koo IC, Sherman BM and Bradley C:
Iniparib plus chemotherapy in metastatic triple-negative breast
cancer. N Engl J Med. 364:205–214. 2011. View Article : Google Scholar : PubMed/NCBI
|
|
16
|
Tutt A, Robson M, Garber JE, Domchek SM,
Audeh MW, Weitzel JN, Friedlander M, Arun B, Loman N, Schmutzler
RK, et al: Oral poly(ADP-ribose) polymerase inhibitor olaparib in
patients with BRCA1 or BRCA2 mutations and advanced breast cancer:
A proof-of-concept trial. Lancet. 376:235–244. 2010. View Article : Google Scholar : PubMed/NCBI
|
|
17
|
Yamaguchi N, Ito T, Azuma S, Ito E, Honma
R, Yanagisawa Y, Nishikawa A, Kawamura M, Imai J, Watanabe S, et
al: Constitutive activation of nuclear factor-kappaB is
preferentially involved in the proliferation of basal-like subtype
breast cancer cell lines. Cancer Sci. 100:1668–1674. 2009.
View Article : Google Scholar : PubMed/NCBI
|
|
18
|
Liu XF, Xiang L, Zhang Y, Becker KG, Bera
TK and Pastan I: CAPC negatively regulates NF-κB activation and
suppresses tumor growth and metastasis. Oncogene. 31:1673–1682.
2012. View Article : Google Scholar
|
|
19
|
Kurebayashi J, Kurosumi M and Sonoo H: A
new human breast cancer cell line, KPL-3C, secretes parathyroid
hormone-related protein and produces tumours associated with
microcalcifications in nude mice. Br J Cancer. 74:200–207. 1996.
View Article : Google Scholar : PubMed/NCBI
|
|
20
|
Komatsu M, Yoshimaru T, Matsuo T, Kiyotani
K, Miyoshi Y, Tanahashi T, Rokutan K, Yamaguchi R, Saito A, Imoto
S, et al: Molecular features of triple negative breast cancer cells
by genome-wide gene expression profiling analysis. Int J Oncol.
42:478–506. 2013. View Article : Google Scholar
|
|
21
|
Livak KJ and Schmittgen TD: Analysis of
relative gene expression data using real-time quantitative PCR and
the 2(−Delta Delta C(T)) method. Methods. 25:402–408. 2001.
View Article : Google Scholar
|
|
22
|
Kim JW, Akiyama M, Park JH, Lin ML, Shimo
A, Ueki T, Daigo Y, Tsunoda T, Nishidate T, Nakamura Y, et al:
Activation of an estrogen/estrogen receptor signaling by BIG3
through its inhibitory effect on nuclear transport of PHB2/REA in
breast cancer. Cancer Sci. 100:1468–1478. 2009. View Article : Google Scholar : PubMed/NCBI
|
|
23
|
Park JH, Lin ML, Nishidate T, Nakamura Y
and Katagiri T: PDZ-binding kinase/T-LAK cell-originated protein
kinase, a putative cancer/testis antigen with an oncogenic activity
in breast cancer. Cancer Res. 66:9186–9195. 2006. View Article : Google Scholar : PubMed/NCBI
|
|
24
|
Kamimae S, Yamamoto E, Kai M, Niinuma T,
Yamano HO, Nojima M, Yoshikawa K, Kimura T, Takagi R, Harada E, et
al: Epigenetic silencing of NTSR1 is associated with lateral and
noninvasive growth of colorectal tumors. Oncotarget. 6:29975–29990.
2015. View Article : Google Scholar : PubMed/NCBI
|
|
25
|
Ng FW, Nguyen M, Kwan T, Branton PE,
Nicholson DW, Cromlish JA and Shore GC: p28 Bap31, a Bcl-2/Bcl-XL-
and procaspase-8-associated protein in the endoplasmic reticulum. J
Cell Biol. 139:327–338. 1997. View Article : Google Scholar : PubMed/NCBI
|
|
26
|
Annaert WG, Becker B, Kistner U, Reth M
and Jahn R: Export of cellubrevin from the endoplasmic reticulum is
controlled by BAP31. J Cell Biol. 139:1397–1410. 1997. View Article : Google Scholar
|
|
27
|
Huang W, Sherman BT and Lempicki RA:
Systematic and integrative analysis of large gene lists using DAVID
bioinformatics resources. Nat Protoc. 4:44–57. 2009. View Article : Google Scholar
|
|
28
|
Huang W, Sherman BT and Lempicki RA:
Bioinformatics enrichment tools: Paths toward the comprehensive
functional analysis of large gene lists. Nucleic Acids Res.
37:1–13. 2009. View Article : Google Scholar :
|
|
29
|
Hao JM, Chen JZ, Sui HM, Si-Ma XQ, Li GQ,
Liu C, Li JL, Ding YQ and Li JM: A five-gene signature as a
potential predictor of metastasis and survival in colorectal
cancer. J Pathol. 220:475–489. 2010.PubMed/NCBI
|
|
30
|
Yoshimaru T, Komatsu M, Matsuo T, Chen YA,
Murakami Y, Mizuguchi K, Mizohata E, Inoue T, Akiyama M, Yamaguchi
R, et al: Targeting BIG3-PHB2 interaction to overcome tamoxifen
resistance in breast cancer cells. Nat Commun. 4:24432013.
View Article : Google Scholar : PubMed/NCBI
|
|
31
|
Kajiura K, Masuda K, Naruto T, Kohmoto T,
Watabnabe M, Tsuboi M, Takizawa H, Kondo K, Tangoku A and Imoto I:
Frequent silencing of the candidate tumor suppressor TRIM58 by
promoter methylation in early-stage lung adenocarcinoma.
Oncotarget. 8:2890–2905. 2017. View Article : Google Scholar :
|
|
32
|
Locke WJ and Clark SJ: Epigenome
remodelling in breast cancer: Insights from an early in vitro model
of carcinogenesis. Breast Cancer Res. 14:2152012. View Article : Google Scholar : PubMed/NCBI
|
|
33
|
Wang X: miRDB: A microRNA target
prediction and functional annotation database with a wiki
interface. RNA. 14:1012–1017. 2008. View Article : Google Scholar : PubMed/NCBI
|
|
34
|
Peña-Chilet M, Martínez MT, Pérez-Fidalgo
JA, Peiró-Chova L, Oltra SS, Tormo E, Alonso-Yuste E,
Martinez-Delgado B, Eroles P, Climent J, et al: MicroRNA profile in
very young women with breast cancer. BMC Cancer. 14:5292014.
View Article : Google Scholar : PubMed/NCBI
|
|
35
|
Nguyen HT, Li C, Lin Z, Zhuang Y,
Flemington EK, Burow ME, Lin YI and Shan B: The microRNA expression
associated with morphogenesis of breast cancer cells in
three-dimensional organotypic culture. Oncol Rep. 28:117–126.
2012.PubMed/NCBI
|
|
36
|
Yan J and Aldrich RW: BK potassium channel
modulation by leucine-rich repeat-containing proteins. Proc Natl
Acad Sci USA. 109:7917–7922. 2012. View Article : Google Scholar : PubMed/NCBI
|
|
37
|
Carvalho S, Oliveira T, Bartels MF,
Miyoshi E, Pierce M, Taniguchi N, Carneiro F, Seruca R, Reis CA,
Strahl S, et al: O-mannosylation and N-glycosylation: Two
coordinated mechanisms regulating the tumour suppressor functions
of E-cadherin in cancer. Oncotarget. 7:65231–65246. 2016.
View Article : Google Scholar : PubMed/NCBI
|
|
38
|
Couldrey C and Green JE: Metastases: The
glycan connection. Breast Cancer Res. 2:321–323. 2000. View Article : Google Scholar
|
|
39
|
Dall'Olio F, Malagolini N, Trinchera M and
Chiricolo M: Mechanisms of cancer-associated glycosylation changes.
Front Biosci (Landmark Ed). 17:670–699. 2012. View Article : Google Scholar
|
|
40
|
Pinho SS and Reis CA: Glycosylation in
cancer: Mechanisms and clinical implications. Nat Rev Cancer.
15:540–555. 2015. View Article : Google Scholar : PubMed/NCBI
|
|
41
|
Wolff AC, Hammond ME, Hicks DG, Dowsett M,
McShane LM, Allison KH, Allred DC, Bartlett JM, Bilous M,
Fitzgibbons P, et al American Society of Clinical Oncology; College
of American Pathologists: Recommendations for human epidermal
growth factor receptor 2 testing in breast cancer: American Society
of Clinical Oncology/College of American Pathologists clinical
practice guideline update. J Clin Oncol. 31:3997–4013. 2013.
View Article : Google Scholar : PubMed/NCBI
|
|
42
|
Sobin L, Gospodarowicz M and Wittekind C:
TNM Classification of Malignant Tumors. John Wiley & Sons, Inc;
Hoboken, NJ: 2010
|