Introduction
Hepatocellular carcinoma (HCC) is one of the most
common causes of cancer-associated mortalities worldwide (1). The principal treatment for HCC is
surgical resection or liver transplantation (2). However, in the period between 2001
and 2008, the cumulative recurrence rate following complete
resection of the tumor remained high (40-60% after 3 years)
(3-5). Surgical treatment is often
unavailable for patients with HCC who were diagnosed at an advanced
stage. Multikinase inhibitors (sorafenib, regorafenib and
lenvatinib) are approved for the systemic treatment of inoperable
HCC. However, such drugs prolong the survival of patients with
inoperable HCC for only a few months (6,7).
Therefore, it is necessary to investigate novel therapeutic targets
for this disease.
The signal transducer and activator of transcription
3 (STAT3) pathway is one of the major signaling pathways that
promote tumor progression in HCC (8). This pathway is stimulated by
inflammatory cytokines and growth factors (9-11).
Activation of STAT3 through phosphorylation of tyrosine 705 leads
to the formation of dimers that subsequently move from the cytosol
to the nucleus to bind DNA, and thereby regulate gene expression
and promote cell proliferation and survival (9-11).
In the case of the liver, the STAT3 signaling pathway is activated
by chronic hepatitis (hepatitis B or C infections, alcoholic
hepatitis and non-alcoholic steatohepatitis) (11). It has been demonstrated that
activated STAT3 is associated with tumor invasiveness, metastasis
and poor prognosis in HCC (12-14).
Protein disulfide-isomerase A3 (PDIA3), also known
as endoplasmic reticulum (ER) resident protein 57 or 58 kDa
glucose-regulated protein, is a thiol oxidoreductase with protein
disulfide isomerase activity. PDIA3 modulates the folding of newly
synthesized glycoproteins and misfolded proteins in the ER
(15). This protein also protects
cells from ER stress-induced apoptosis (15). Furthermore, it has a variety of
functions in the cytosol and nucleus (15). In several types of cancer, PDIA3
forms a complex with STAT3 in the nucleus (16-18).
A high frequency of PDIA3-STAT3 complex formation is a marker of
poor prognosis and increases resistance to radiotherapy in
laryngeal cancer through modulation of STAT3 activity (19). We have previously reported that the
PDIA3 expression levels in HCC tissues are higher than those in
adjacent non-cancerous tissues, and that they are associated with
overall survival time (20).
However, the biological role of PDIA3 in HCC remains unclear.
The aim of the present study was to understand the
role of PDIA3 in HCC. PDIA3 expression levels, the effects of PDIA3
knockdown and the association between PDIA3 and STAT3 in HCC were
examined. The expression of PDIA3 in HCC tissues was associated
with cell proliferation, survival and expression of phosphorylated
STAT3 (P-STAT3) in HCC. PDIA3 knockdown in HCC cell lines inhibited
cell proliferation and induced apoptosis by suppression of the
STAT3 signaling pathway. In the presence of the tyrosine-protein
kinase JAK/STAT3 signaling inhibitor AG490, PDIA3 knockdown
provided little additional inhibition of cell growth. These data
suggest that PDIA3 promotes tumor development in patients with HCC
through the STAT3 signaling pathway.
Materials and methods
Clinical samples
A total of 53 patients with HCC who underwent
hepatectomy without preoperative therapy at the Nippon Medical
School Hospital (Tokyo, Japan) between January 2016 and February
2018, were enrolled in this study. The tumor and adjacent normal
tissues from these patients were fixed with 10% formalin at room
temperature for 24 h within 2 h of resection and embedded in
paraffin. Among them, 35 HCC samples were formalin-fixed within 30
min of resection and were used for immunostaining of P-STAT3. The
baseline characteristics of the patients are summarized in Table I. This study was conducted
according to the Declaration of Helsinki and the Japanese Society
of Pathology, and was given official approval by the Ethics
Committee of the Nippon Medical School Hospital (approval no.
29-03-908). Written informed consent was obtained from all
patients.
 | Table IAssociations between
clinicopathological factors and PDIA3 or P-STAT3 levels in
hepatocellular carcinoma. |
Table I
Associations between
clinicopathological factors and PDIA3 or P-STAT3 levels in
hepatocellular carcinoma.
|
Characteristics | PDIA3 expression
| P-STAT3 status
|
|---|
| n | High (n=29) | Low (n=24) | P-value | n | Positive
(n=15) | Negative
(n=20) | P-value |
|---|
| Sex | | | | 0.127 | | | | 0.372 |
| Male | 44 | 22 | 22 | | 26 | 10 | 16 | |
| Female | 9 | 7 | 2 | | 9 | 5 | 4 | |
| Age, years | | | | 0.226 | | | | 0.599 |
| <65 | 13 | 9 | 4 | | 11 | 4 | 7 | |
| ≥65 | 40 | 20 | 20 | | 24 | 11 | 13 | |
| HBsAg | | | | 0.805 | | | | 0.605 |
| Positive | 6 | 3 | 3 | | 6 | 2 | 4 | |
| Negative | 47 | 26 | 21 | | 29 | 13 | 16 | |
| HCV infection | | | | 0.707 | | | | 0.767 |
| Positive | 25 | 13 | 12 | | 15 | 6 | 9 | |
| Negative | 28 | 16 | 12 | | 20 | 9 | 11 | |
| Cirrhosis | | | | 0.68 | | | | 0.599 |
| Yes | 17 | 10 | 7 | | 11 | 4 | 7 | |
| No | 36 | 19 | 17 | | 24 | 11 | 13 | |
| AFP, ng/ml | | | | 0.315 | | | | 0.486 |
| <20 | 36 | 18 | 18 | | 21 | 10 | 11 | |
| ≥20 | 17 | 11 | 6 | | 14 | 5 | 9 | |
| DCP, mAU/ml | | | | 0.15 | | | | 0.762 |
| <40 | 23 | 10 | 13 | | 13 | 6 | 7 | |
| ≥40 | 30 | 19 | 11 | | 22 | 9 | 13 | |
| Tumor sizea, cm | | | | 0.99 | | | | 0.503 |
| <5 | 42 | 23 | 19 | | 26 | 12 | 14 | |
| ≥5 | 11 | 6 | 5 | | 9 | 3 | 6 | |
| Tumor number | | | | 0.19 | | | | 0.834 |
| 1 | 51 | 27 | 24 | | 33 | 14 | 19 | |
| ≥2 | 2 | 2 | 0 | | 2 | 1 | 1 | |
| Vascular
invasion | | | | 0.442 | | | | 0.419 |
| Positive | 17 | 8 | 9 | | 8 | 2 | 6 | |
| Negative | 36 | 21 | 15 | | 27 | 13 | 14 | |
| UICC stageb | | | | 0.624 | | | | 0.245 |
| I | 35 | 20 | 15 | | 26 | 13 | 13 | |
| II | 18 | 9 | 9 | | 9 | 2 | 7 | |
| III | 0 | 0 | 0 | | 0 | 0 | 0 | |
| IV | 0 | 0 | 0 | | 0 | 0 | 0 | |
|
Differentiation | | | | 0.697 | | | | 0.827 |
| Good | 19 | 10 | 9 | | 10 | 5 | 5 | |
| Moderate | 30 | 16 | 14 | | 23 | 9 | 14 | |
| Poor | 4 | 3 | 1 | | 2 | 1 | 1 | |
Cell culture
Human hepatoma cell lines (Huh-7 and HuH-1) were
obtained from the Japanese Collection of Research Bioresources cell
bank (Osaka, Japan). A normal human hepatocyte cell line (THLE-2)
was obtained from the American Type Culture Collection (Manassas,
VA, USA). Huh-7 and HuH-1 cells were cultured in RPMI-1640 medium
(Gibco; Thermo Fisher Scientific, Inc., Waltham, MA, USA)
supplemented with 10% heat-inactivated fetal bovine serum (FBS;
Nichirei Biosciences, Inc., Tokyo, Japan) at 37°C in a humidified
5% CO2 atmosphere.
The THLE-2 cell line was maintained in Bronchial
Epithelial Cell Growth Medium (BEGM; Lonza Group Ltd., Basel,
Switzerland) without gentamycin/amphotericin and epinephrine but
with added 5 ng/ml epidermal growth factor (Corning, Inc., Corning,
NY, USA), 70 ng/ml phosphoethanolamine (Sigma-Aldrich; Merck KGaA,
Darmstadt, Germany) and 10% FBS. The THLE-2 cells were cultured in
RPMI-1640 medium with 10% FBS for 7 days at 37°C in a humidified 5%
CO2 atmosphere prior to protein extraction. A JAK/STAT3
signaling inhibitor, AG490 (Merck KGaA), dissolved in
dimethylsulfoxide (DMSO; Wako Pure Chemical Industries, Ltd.,
Osaka, Japan), was used for the suppression of STAT3 signaling at
25 or 100 µM in cell growth or western blotting,
respectively.
PDIA3 knockdown
Short-interfering RNAs (siRNAs) were purchased from
Thermo Fisher Scientific, Inc. The two PDIA3 siRNAs used were
designated PDIA3 si-1 and PDIA3 si-2 and known as
Silencer® Select Pre-designed siRNA cat. no. 4392420, ID
s6227 (5′-GGAAUAGUCCCAUUAGCAAtt-3′) and ID s6229
(5′-GCAACUUGAGGGAUAACUAtt-3′), respectively. Silencer®
negative control #1 siRNA (cat. no. 4390844) was used as a negative
control (Ctrl si). The transfection of the siRNA was performed
using Lipofectamine® RNAiMAX Reagent (Invitrogen; Thermo
Fisher Scientific, Inc.), according to the manufacturer's protocol.
The optimal concentration of siRNA for use in transfections was 5
nM. The medium was refreshed 24 h after cell seeding and the cells
were cultured for a further 48 and 72 h for the apoptosis and cell
cycle assay and western blotting, respectively. The cell
transfection efficiency was measured by reverse
transcription-quantitative polymerase chain reaction (RT-qPCR) and
western blotting, as described below.
RT-qPCR assay
A total of 2.5×10⁵ cells were seeded in
60-mm dishes and cultured for 48 h. Total RNA was extracted using
the NucleoSpin RNA kit (Takara Bio Inc., Otsu, Japan), and 1
µg of total RNA was used for reverse transcription using the
SuperScript VILO cDNA Synthesis kit (Thermo Fisher Scientific,
Inc.) following the manufacturer's protocol. The reaction
conditions were as follows: 25°C for 10 min, 42°C for 60 min and
85°C for 5 min. The qPCR was performed for PDIA3 and 18S rRNA (as
an internal standard) using the StepOnePlus Real-Time PCR system
with TaqMan probes and primers (18S, cat. no. Hs 03928990_g1;
PDIA3, cat. no. Hs 04194196_g1) (all Thermo Fisher Scientific,
Inc.). The cycling conditions were as follows: 20 sec at 95°C,
followed by 40 cycles of 1 sec at 95°C and 20 sec at 60°C. The
RT-qPCR results are expressed as the ratio of target mRNA to 18S
rRNA and calculated using the 2-ΔΔCq method (21). The gene expression levels were
measured in triplicate.
Protein extraction and western
blotting
Total protein was extracted using urea/thiourea
buffer containing 7 M urea (Wako Pure Chemical Industries, Ltd.), 2
M thiourea (Nacalai Tesque, Inc., Kyoto, Japan), 3%
3-(3-[cholamidopropyl]-di methylammonio)-1-propanesulfonate
(Dojindo Molecular Technologies, Inc., Kumamoto, Japan) and 1%
Triton X-100 (Sigma-Aldrich; Merck KGaA) from the cells after 96 h
of siRNA transfection, as described previously (22). The protein concentration was
determined using Pierce® 660 nm Protein Assay Reagent
(Thermo Fisher Scientific, Inc.). A total of 10 µg protein
from each cell extract was loaded onto and separated by 5-20%
SDS-PAGE (e-PAGEL®; ATTO Corporation, Tokyo, Japan) and
then transferred to a polyvinylidene difluoride membrane in a
Trans-Blot® Turbo™ Transfer Pack using a Trans-Blot
Turbo transfer system (both Bio-Rad Laboratories, Inc., Hercules,
CA, USA). The membranes were blocked for 1 h with 5% skimmed milk
in TBS containing 0.2 M Tris-HCl, 150 mM NaCl and 0.01% Tween-20,
and then incubated with specific primary antibodies overnight at
4°C. The antibodies to the following proteins were used: PDIA3
(cat. no. ab13506; 1:2,000), induced myeloid leukemia cell
differentiation protein Mcl-1 (cat. no. ab32087; 1:2,000), 78 kDa
glucose-regulated protein (GRP78; cat no. ab21685; 1:2,000) (all
Abcam, Cambridge, UK), STAT3 (cat. no. 9139; 1:2,000), P-STAT3
(Tyr705; cat. no. 9145; 1:2,000), survivin (cat. no. 2808;
1:2,000), X-linked inhibitor of apoptosis protein (XIAP; cat. no.
14334; 1:2,000), Bcl-2-like protein 1 (Bcl-XL; cat. no. 2764;
1:2,000), cyclin D1 (cat. no. 2978; 1:1,000) (all Cell Signaling
Technology, Inc., Danvers, MA, USA), B-cell lymphoma 2 (Bcl-2; cat.
no. sc-492; 1:500; Santa Cruz Biotechnology, Inc., Dallas, TX,
USA), cellular tumor antigen p53 (cat. no. M7001; 1:1,000; Dako;
Agilent Technologies, Inc., Santa Clara, CA, USA) and β-actin (cat.
no. A5316; 1:10,000; Sigma-Aldrich; Merck KGaA). Following washing
in TBS with 0.01% Triton X-100 for 30 min, the membranes were
incubated with a horseradish peroxidase-conjugated secondary
antibody (cat. no. A106PU; 1:10,000; American Qualex Scientific
Products, San Clemente, CA, USA) for 1 h at room temperature. The
immunoreactive products were visualized using SuperSignal West Dura
Extended Duration Substrate for each protein, and SuperSignal West
Pico Chemiluminescence substrate (both Thermo Fisher Scientific,
Inc.) for β-actin. The data were quantified by Quantity One 1-D
analysis software version 4.6.2 (Bio-Rad Laboratories, Inc.). The
experiments were performed ≥3 times.
Immunoprecipitation
The total protein was extracted from cells 96 h
after seeding. The cells were lysed in Pierce™ IP Lysis Buffer
(Thermo Fisher Scientific, Inc.) and protease inhibitor (P8340;
Sigma-Aldrich; Merck KGaA) for 10 min on ice after washing in PBS.
The cell lysates were centrifuged at 20,000 × g for 10 min at 4°C.
The resulting supernatant was collected as a cell extract. Cell
lysate (2 mg), antibody (3 µg), and protein A/G PLUS-Agarose
(30 µl) were combined and incubated overnight at 4°C. The
mixture was purified using Sigma Prep Spin Columns with Break-Away
Tips (Sigma-Aldrich; Merck KGaA) and the proteins collected were
used for immunoblotting with antibodies against PDIA3 and STAT3.
Normal mouse IgG (3 µg; cat. no. SC-2025; Santa Cruz
Biotechnology, Inc.) was used as a negative control for the
immunoprecipitation experiments.
Cell proliferation assay
Cells were seeded in 96-well plates, at a density of
5,000 cells per well, and cultured at 37°C in a humidified 5%
CO2 atmosphere following siRNA transfection with PDIA3
si-1, PDIA3 si-2 or Ctrl si, as described above. After 0, 24, 48,
72 and 96 h of proliferation, cells were incubated with the WST-8
cell-counting reagent (Dojindo Molecular Technologies, Inc.) for 2
h at 37°C. The optical density of the culture solution in each well
was determined at 450 nm using a microplate absorbance reader
(iMark™; Bio-Rad Laboratories, Inc.). The experiments were
performed ≥3 times.
Apoptosis analysis
Cells (5×10⁵) were seeded in a 75-ml
flask and cultured in 10 ml RPMI-1640 medium. The medium was
changed 24 h after PDIA3 siRNA treatment. Floating and attached
cells were collected 72 h after seeding. Double staining with
Annexin V and ethidium homodimer III was performed using the
Apoptotic, Necrotic, and Healthy Cells Quantification kit (Biotium,
Inc., Freemont, CA, USA), following the manufacturer's protocol.
The apoptotic cells were counted by flow cytometry on a BD
FACSCanto™ II flow cytometer and analyzed using BD FACSDiva™
software version 6.1.3 (both Becton, Dickinson and Company,
Franklin Lakes, NJ, USA). The experiments were performed ≥3
times.
Cell cycle analysis
Cell harvesting was performed in the same manner as
for the apoptosis analysis. The collected cells were washed in PBS
and fixed in 100% methanol for 10 min. The cells were incubated
with RNase (0.25 mg/ml) for 30 min at 37°C. Propidium iodide (50
µg/ml) was then added and incubated for 30 min at 4°C in the
dark. The stained cells were analyzed by flow cytometry on a BD
FACSCanto II flow cytometer and analyzed using BD FACSDiva software
version 6.1.3. The experiments were performed ≥3 times.
Hematoxylin and eosin staining
Tissue sections (4 µm thickness) were used
for hematoxylin eosin staining. Following deparaffinization, the
sections were stained hematoxylin (Merck KGaA) for 30 min at room
temperature, and eosin (Wako Pure Chemical Industries, Ltd.) for 20
min at room temperature, following washing in water. The sections
were then washed and dehydrated. These sections were evaluated
manually under a light microscope (×100 magnification; Olympus
Corporation, Tokyo, Japan).
Immunostaining and scoring
Tissue sections (4 µm thickness) were used
for immunostaining. Following deparaffinization, sections were
pretreated at 121°C for 15 min in 10 mM citrate buffer (pH 6.0) for
PDIA3 and proliferation marker protein Ki-67 staining, and
Histofine® Antigen Activation Liquid (pH 9.0; Nichirei
Biosciences, Inc.) for P-STAT3 staining. Endogenous peroxidase was
blocked in 100% methanol (Wako Pure Chemical Industries, Ltd.)
containing 0.3% hydrogen peroxide (Wako Pure Chemical Industries,
Ltd.) for 30 min at room temperature. The sections were then
incubated with antibodies for PDIA3 (1:500), P-STAT3 (1:400) and
Ki-67 (MIB-1; cat. no. M7240; 1:100; Dako; Agilent Technologies,
Inc.) in PBS containing 1% bovine serum albumin (Sigma-Aldrich;
Merck KGaA) for 16 h at 4°C. The sections were further incubated
with Histofine Simple Stain™ MAX PO (rabbit or mouse; Nichirei
Biosciences, Inc.) for 30 min at room temperature, and peroxidase
activity was visualized by 3,3′ diaminobenzidine. The sections were
then counterstained with hematoxylin at room temperature for 1
min.
For PDIA3, the intensity and proportion of stained
tumor cells were semi-quantitated. If the tumor cell staining was
not apparent, the intensity and proportion were scored as 0. If it
was apparent, the intensity of tumor cell staining was categorized
into three grades: 1, weak; 2, moderate; and 3, strong. The
proportional score of stained cells was also divided into three
grades: 1, <10%; 2, 10-50%; and 3, >50%. A total score was
calculated as the sum of the intensity and proportional scores. Two
investigators evaluated the scores in a blind manner and the mean
score was used. HCC tissue with a total score ≥4 was classified as
having high expression and that with <4 was classified as having
low expression. For P-STAT3, nuclear staining was considered to be
a positive reaction. The P-STAT3 staining was classified as
positive or negative (≥10% or <10% cells with nuclear staining,
respectively). These expressions were evaluated manually under a
light microscope (×100 magnification; Olympus Corporation). The
Ki-67 index was calculated as the percentage of cells with positive
nuclear Ki-67 immunostaining using e-Count cell counting software
version 4.7 (e-Path Co, Ltd., Kanagawa, Japan) in those areas
showing the highest nuclear labeling (so-called ‘hot spots’), which
were determined using a light microscope (×400 magnification). The
median number of tumor cells counted was 322 (range, 165-583 cells)
per sample.
Immunofluorescence staining
Cells were fixed in 4% paraformaldehyde for 20 min
at room temperature. Following washing in PBS, the fixed cells were
incubated in 50 mM glycine for 20 min at room temperature, and
washed again. The cells were then permeabilized in 0.1% Triton
X-100 for 30 min at room temperature. The cells were washed in PBS
and blocking was performed using 10% goat serum (Wako Pure Chemical
Industries, Ltd.) for 60 min at room temperature. The fixed cells
were consecutively incubated with anti-PDIA3 mouse antibody (1:50)
and anti-STAT3 rabbit antibody (cat. no. 12640S; 1:50; Cell
Signaling Technology, Inc.), followed by Alexa 488-labeled
anti-rabbit IgG antibody (cat. no. A11031) and Alexa 568-labeled
anti-mouse IgG antibody (cat. no. A11034) (both 1:1,000; Thermo
Fisher Scientific, Inc.). The slides were mounted in medium
containing DAPI, and the images were captured using a Digital
Eclipse C1 TE2000-E confocal microscope (×1,000 magnification;
Nikon Corporation, Tokyo, Japan)
Terminal
deoxynucleotidyl-transferase-mediated dUTP nick end labeling
(TUNEL) assay
HCC tissues fixed as described above (4 µm
thickness) were used for the TUNEL assay. The apoptotic cell death
of HCC cells was determined by a TUNEL assay using an
Apoptag® Peroxidase In Situ Apoptosis Detection kit
(Merck KGaA). The peroxidase activity was visualized by 3,3′
diaminobenzidine. The sections were then counterstained with
hematoxylin at room temperature for 1 min and dehydrated. 99%
xylene with Malinol (Muto Pure Chemicals Co., Ltd.) was used as a
water-insoluble mounting medium. Nuclear staining was considered a
positive reaction. The images were captured under a light
microscope (×400 magnification; Olympus). The TUNEL index was
calculated by the same method as that used for the Ki-67 index. The
median number of counted tumor cells was 337 (range, 179-649 cells)
per sample.
Statistical analysis
The data are expressed as the mean ± standard error
of the mean or standard deviation (SD). Statistical comparisons
between and among the groups were conducted using one-way analysis
of variance (ANOVA) with Dunnett's post-hoc test, two-way ANOVA
with Tukey's post-hoc test or a Mann-Whitney U-test. The
clinicopathological parameters were analyzed using the
χ2 and Fisher's exact tests. P<0.05 was considered to
indicate a statistically significant difference. All statistical
analyses were performed using GraphPad Prism version 7.0 (GraphPad
Software, Inc., La Jolla, CA, USA).
Results
PDIA3 expression is associated with cell
proliferation and apoptosis in HCC tissues
To evaluate the effects of PDIA3 expression in HCC,
cell proliferation, apoptosis and clinicopathological features were
investigated in 53 HCC samples. The cell proliferation was
evaluated using Ki-67 immunostaining, and apoptosis was measured by
a TUNEL assay. The HCC tissues with high PDIA3 expression exhibited
a significantly higher Ki-67 index than those with low expression
(25.8 vs. 10.1%, respectively; P<0.001; Fig. 1A and B). By contrast, HCC tissues
in which PDIA3 was highly expressed revealed significantly fewer
apoptotic cells than those with low expression (2.4 vs. 8.9%,
respectively; P<0.001; Fig. 1A
and C). However, no associations were observed between the PDIA3
expression level and any clinicopathological features (Table I). These results indicate that HCC
tissues with high PDIA3 expression are associated with increased
cell proliferation and decreased apoptosis.
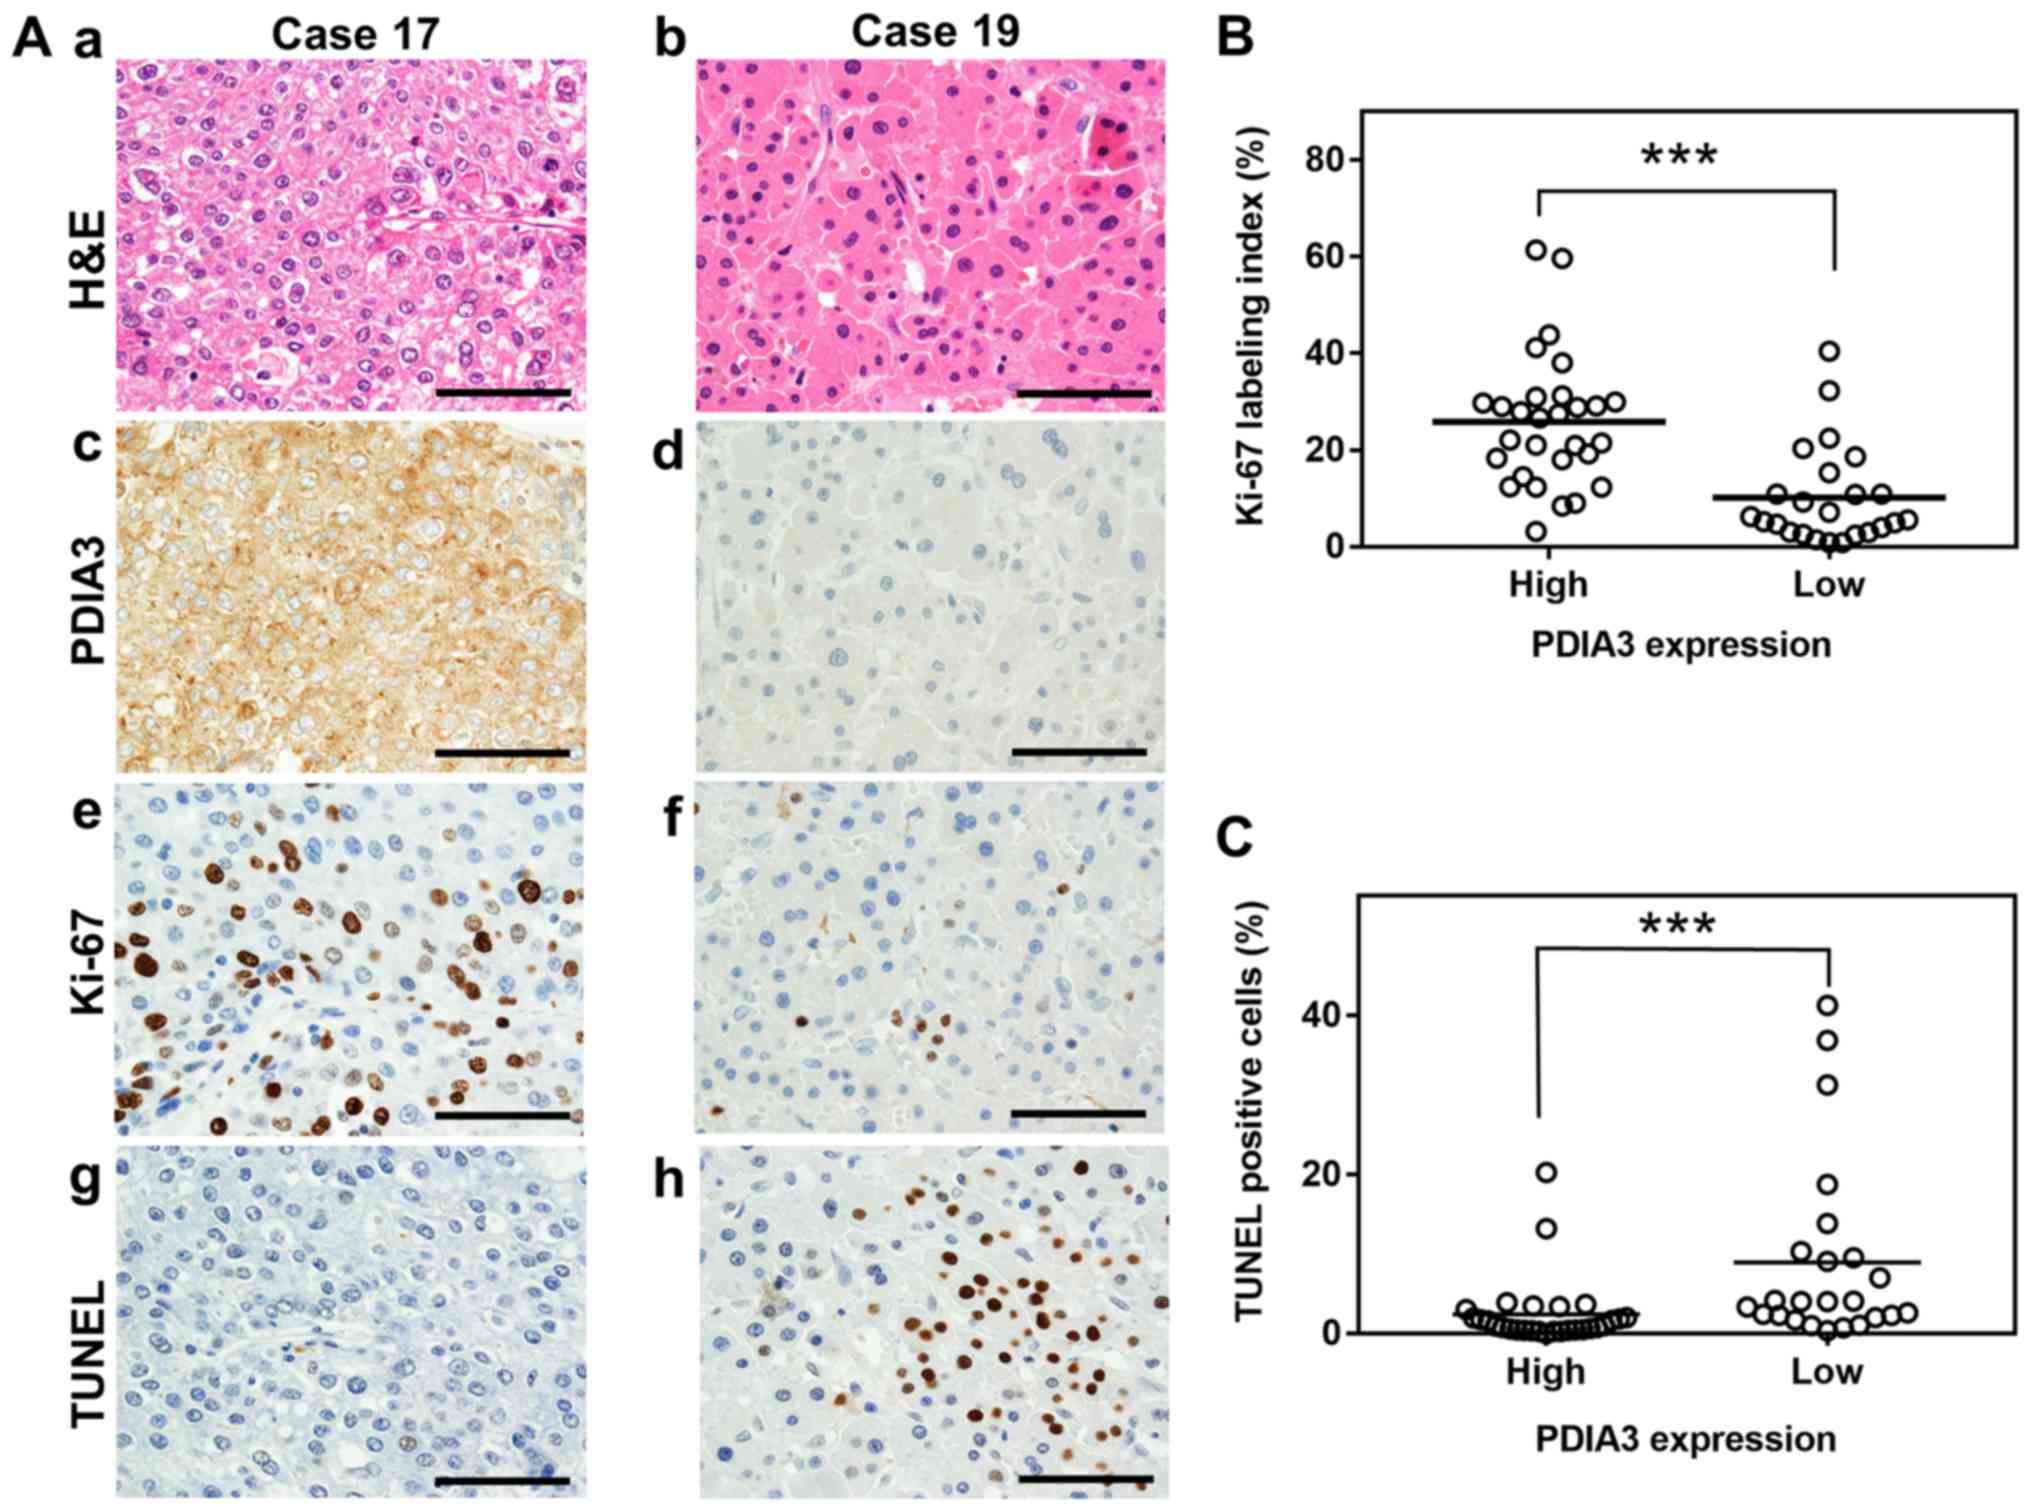 | Figure 1Association between PDIA3 expression
and cell proliferation and apoptosis in HCC tissues. (A)
Representative histological and immunohistochemistry staining of
two HCC tissues (×600 magnification). The tissues were examined by
(a and b) H&E staining, immunohistochemistry staining with
antibodies against (c and d) PDIA3 and (e and f) Ki-67, and (g and
h) the TUNEL assay. The HCC tissue of case 17 exhibits high
expression of PDIA3 and that of case 19 shows low expression. Scale
bar, 50 µm. Scatter plots of (B) Ki-67 index values and (C)
the percentage of TUNEL positive cells in HCC tissues with high
(score, 4≤) and low (score, 4>) PDIA3 expression.
***P<0.001 (Mann-Whitney U-test). PDIA3, protein
disulfide-isomerase A3; Ki-67, proliferation marker protein Ki-67;
TUNEL, terminal deoxynucleotidyl-transferase-mediated dUTP nick end
labeling; H&E, hematoxylin and eosin; HCC, hepatocellular
carcinoma. |
PDIA3 expression in HCC cells is higher
than that in normal hepatocyte cells
The PDIA3 protein expression in HCC Huh-7 and HuH-1
cells was tested, and was demonstrated to be 1.7 and 2.0 times
higher, respectively, than that in normal hepatocyte THLE-2 cells
(P<0.001; Fig. 2A and B). This
result indicates that Huh-7 and HuH-1 are appropriate cell lines
for a model of HCC with increased PDIA3 levels.
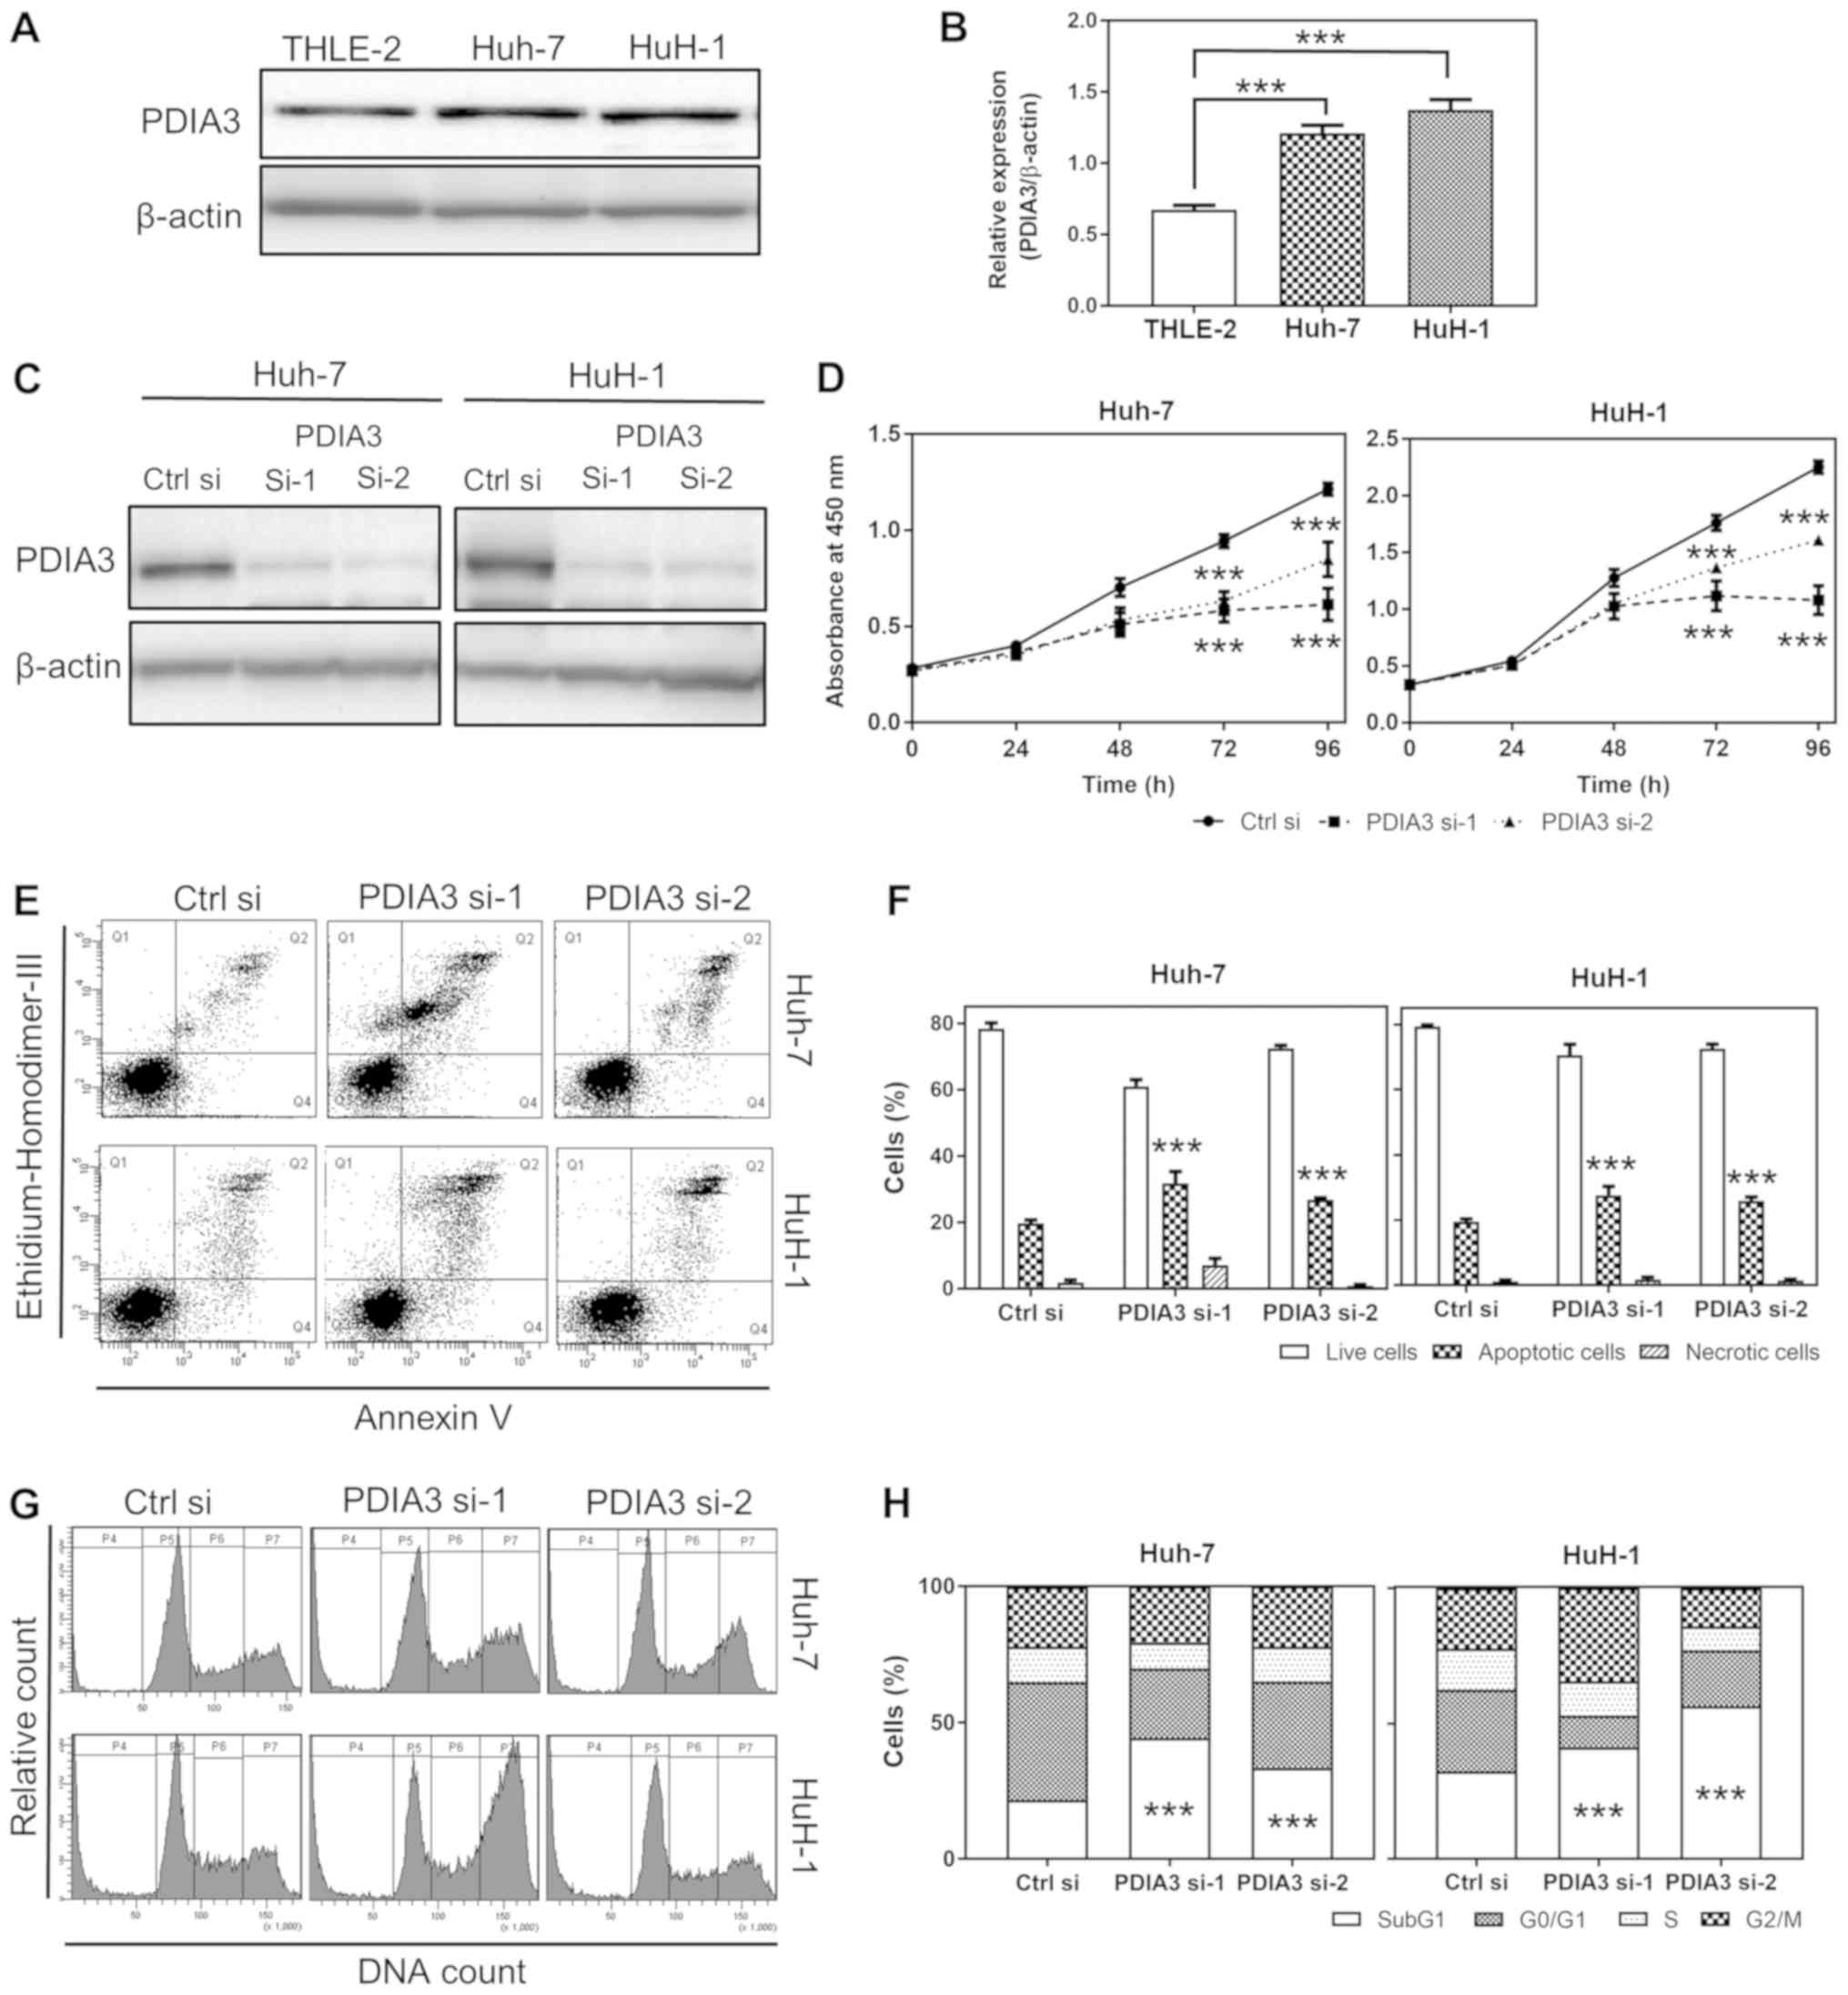 | Figure 2Effects of PDIA3 knockdown on cell
proliferation, apoptosis and cell cycle in HCC cell lines. (A)
Representative western blots of PDIA3 protein expression in normal
hepatocyte THLE-2 and HCC Huh-7 and HuH-1 cells. (B) Relative
quantification of the PDIA3 protein expression. The data are
expressed as the mean ± SEM. ***P<0.001 vs. THLE-2
(one-way ANOVA). (C) Representative western blots of the expression
of PDIA3 in Huh-7 and HuH-1 cells lines transfected Ctrl si, PDIA3
si-1 and PDIA3 si-2. (D) Cell proliferation of the HCC cells
transfected with Ctrl si, PDIA3 si-1 and PDIA3 si-2 was evaluated
using the WST-8 cell counting reagent. At the indicated time
points, the number of cells per well was estimated by measuring the
absorbance (450 nm). The data are expressed as the mean ± SEM.
***P<0.001 vs. Ctrl si at each time point (two-way
ANOVA). (E) Representative plots of the flow cytometry analysis of
apoptosis. The apoptotic cells were counted by flow cytometry
following double staining with annexin V and ethidium homodimer
III. Q1 represents the necrotic cells; Q2 the late apoptotic cells;
Q3 the live cells; and Q4 the early apoptotic cells. (F) The
percentage of live, apoptotic and necrotic cells in the groups
transfected with siRNAs. The data are expressed as the mean ± SEM.
***P<0.001 vs. Ctrl si (two-way ANOVA). (G)
Representative histograms of flow cytometry analysis of the cell
cycle, following propidium iodide staining. P4 represents the SubG1
(fragmented DNA); P5 the G0/G1 phase; P6 the
S phase; and P7 the G2/M phase. (H) The percentage of
cells in each cell cycle phase following siRNA treatment.
***P<0.001 vs. Ctrl si (two-way ANOVA). These results
were from ≥3 independent experiments. PDIA3, protein
disulfide-isomerase A3; HCC, hepatocellular carcinoma; PDIA
si-1/PDIA si-2, PDIA3 siRNA; Ctrl si, control siRNA; ANOVA,
analysis of variance; SEM, standard error of the mean. |
PDIA3 knockdown inhibits cell
proliferation of HCC cells
To investigate the role of PDIA3 in the progression
of HCC, the proliferation of HCC cells was tested following PDIA3
knockdown. First, it was ascertained that PDIA3 si-1 and si-2
successfully suppressed PDIA3 expression in Huh-7 and HuH-1 cells
(Fig. 2C). The proliferative
ability of Huh-7 cells treated with PDIA3 si-1 and si-2 was 50.6
and 70.0% compared with those treated with Ctrl si at 96 h,
respectively. The proliferation of HuH-1 cells treated with PDIA3
si-1 and si-2 was 48.0 and 71.4% compared with the control group at
96 h, respectively (P<0.001 at 72 and 96 h; Fig. 2D). Overall, the PDIA3 knockdown
significantly inhibited cell proliferation in the two HCC cell
lines.
PDIA3 knockdown induces apoptosis in HCC
cells
To investigate the effect of PDIA3 silencing on HCC
cell proliferation, the apoptosis and cell cycle progression of HCC
cells were investigated following PDIA3 knockdown. The silencing of
PDIA3 induced apoptosis in the HCC cells (P<0.001 compared with
Ctrl si; Fig. 2E and F).
Furthermore, the cell cycle analysis demonstrated that knockdown of
PDIA3 significantly increased the SubG1 population and decreased
the G0/G1 phase cells in the two HCC cell
types (P<0.001 compared with Ctrl si in the SubG1 population;
Fig. 2G and H). The increased
SubG1 population signified the induction of apoptosis. These
findings suggest that PDIA3 knockdown inhibits cell proliferation
in HCC cell lines, likely through an apoptosis-dependent
mechanism.
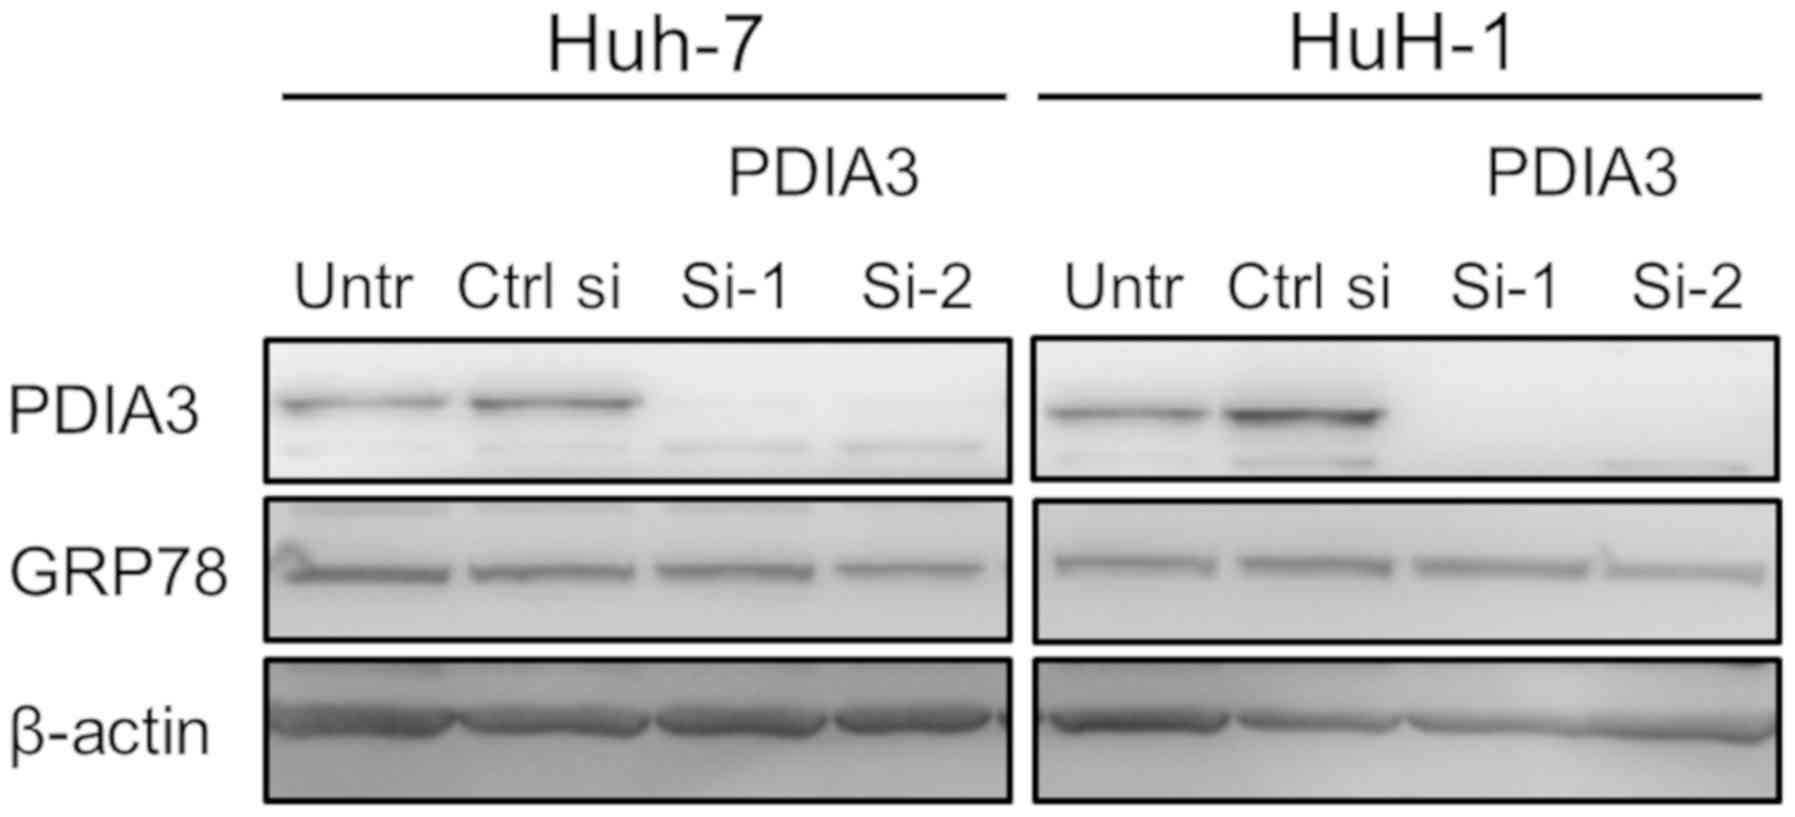
PDIA3 knockdown does not induce ER stress
in HCC cells
As excessive ER stress causes apoptosis, the effect
of the downregulation of PDIA3 expression on ER stress was
investigated in the HCC cells. To evaluate the level of ER stress,
the expression of ER stress marker GRP78 was tested following PDIA3
knockdown. No changes in GRP78 levels were observed, indicating
that silencing of PDIA3 does not induce ER stress (Fig. 3).
PDIA3 interacts with STAT3 and regulates
its phosphorylation in HCC cells
The interaction of PDIA3 with STAT3 in HCC cells was
investigated. Double immunofluorescence staining revealed the
colocalization (merge; yellow) of PDIA3 (red) and STAT3 (green)
(Fig. 4A). PDIA3, an ER protein,
was mainly observed in the cytoplasm where it colocalized with
STAT3 (Fig. 4A; top panel;
merged). Notably, PDIA3 also localized to the nucleus in ~5% of
Huh-7 cells (Fig. 4A; bottom
panel). In these cells, nuclear PDIA3 tended to colocalize with
STAT3 (Fig. 4A; bottom panel;
merged). Additionally, the co-immunoprecipitation experiments
demonstrated that PDIA3 was bound to STAT3 in the HCC cells
(Fig. 4B). These results suggest a
physiological interaction between PDIA3 and STAT3 in HCC cells.
Furthermore, the western blotting revealed that inhibition of PDIA3
expression reduced P-STAT3 levels (Fig. 4C). This result indicates that PDIA3
is associated with STAT3 activation via a certain interaction in
HCC cells.
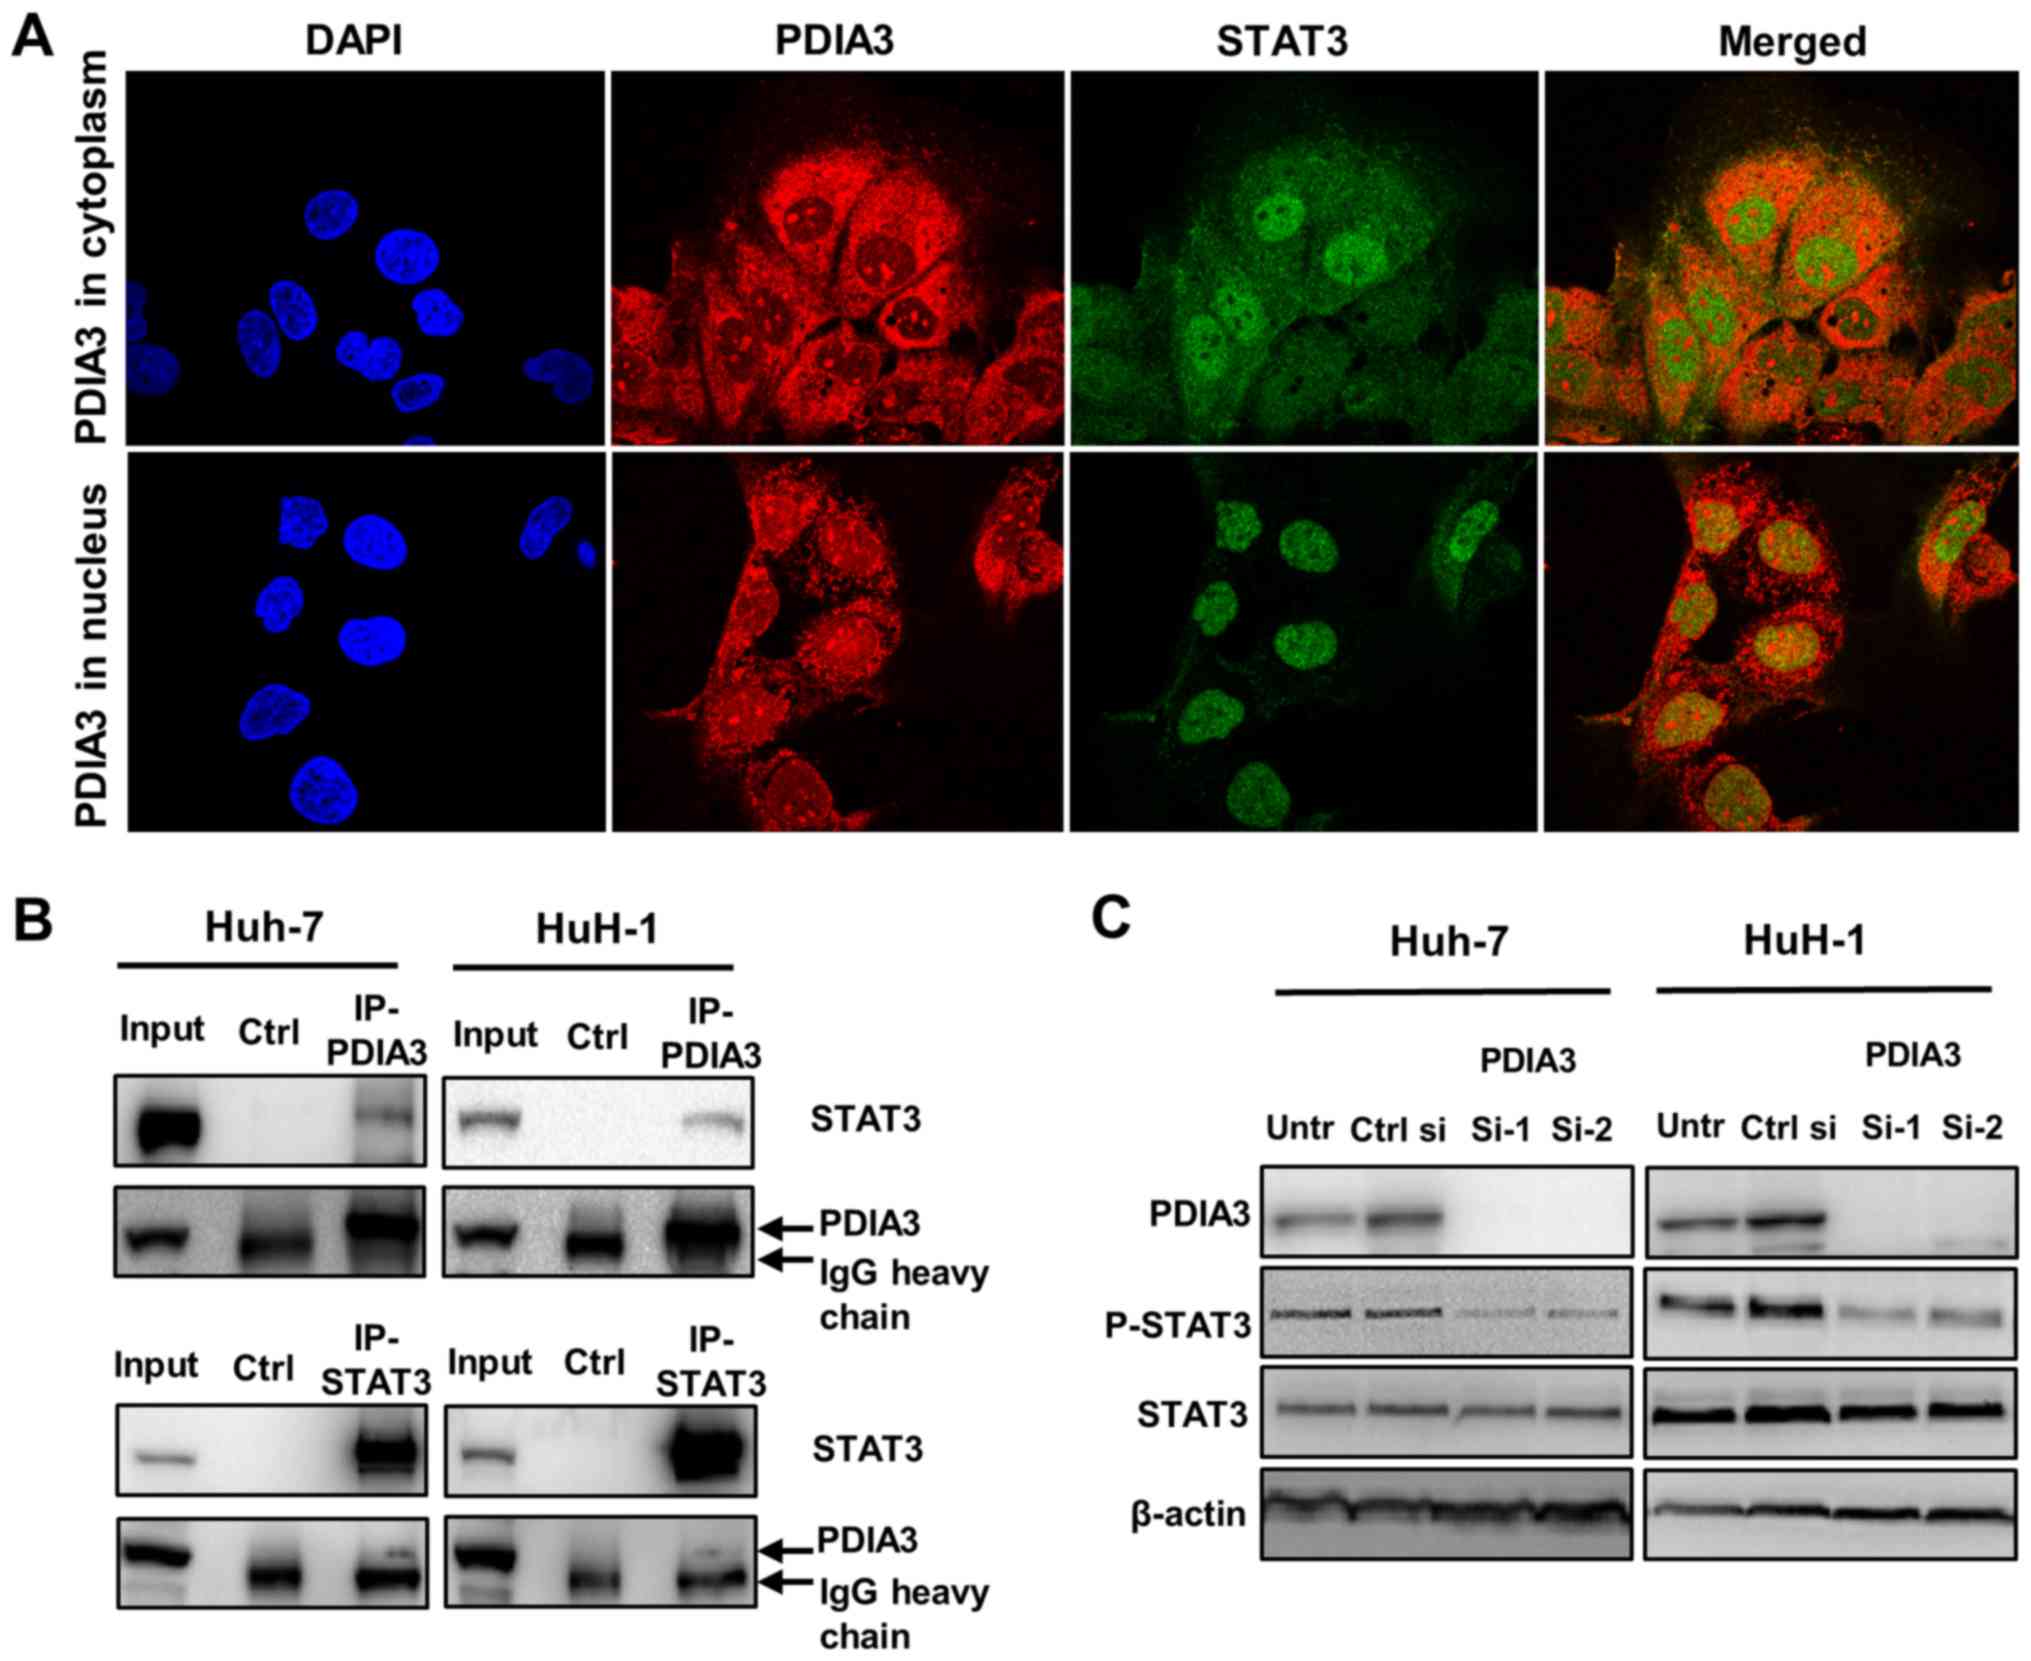 | Figure 4Association of PDIA3 and STAT3 in
hepatocellular carcinoma cells. (A) Immunofluorescence staining for
PDIA3 (red), STAT3 (green) and the nucleus (DAPI; blue) in Huh-7
cells (×1,000 magnification). The yellow color in the merged image
indicates the colocalization of PDIA3 and STAT3. (B) A
co-immunoprecipitation assay was performed using anti-PDIA3 or
anti-STAT3 antibodies, and immunoblotting with anti-STAT3 or
anti-PDIA3 antibodies, respectively. Normal mouse IgG was used for
the Ctrl. (C) Huh-7 and HuH-1 cells were transfected with Ctrl si,
PDIA3 si-1 and PDIA3 si-2 for 96 h. Total proteins were extracted
and subjected to immunoblotting with antibodies against PDIA3,
STAT3, P-STAT3 (Tyr705) and β-actin. Input represents the total
cell lysate. PDIA3, protein disulfide-isomerase A3; STAT3, signal
transducer and activator of transcription 3; P-STAT3,
phosphorylated STAT3; Untr, untreated control; PDIA si-1/PDIA si-2,
PDIA3 siRNA; Ctrl si, control siRNA; Ctrl, control. |
Downstream targets of STAT3 are
suppressed by PDIA3 knockdown in HCC cells
The expression of downstream targets of STAT3 was
investigated by immunoblotting in HCC cells following treatment
with PDIA3 siRNAs (Fig. 5A and B).
The knockdown of PDIA3 led to a decrease in the expression of XIAP
and Bcl-XL in Huh-7 cells, and that of survivin, Mcl-1, XIAP and
cyclin D1 in HuH-1 cells. The difference between the expression of
Mcl-1 and cyclin D1 in the Huh-7 cells for si-1 and si-2 is
possibly due to off-target effects of the siRNAs. These results
indicate that PDIA3 knockdown affects apoptotic pathways by
decreasing the levels of the downstream anti-apoptotic proteins of
the STAT3 pathway in HCC cells.
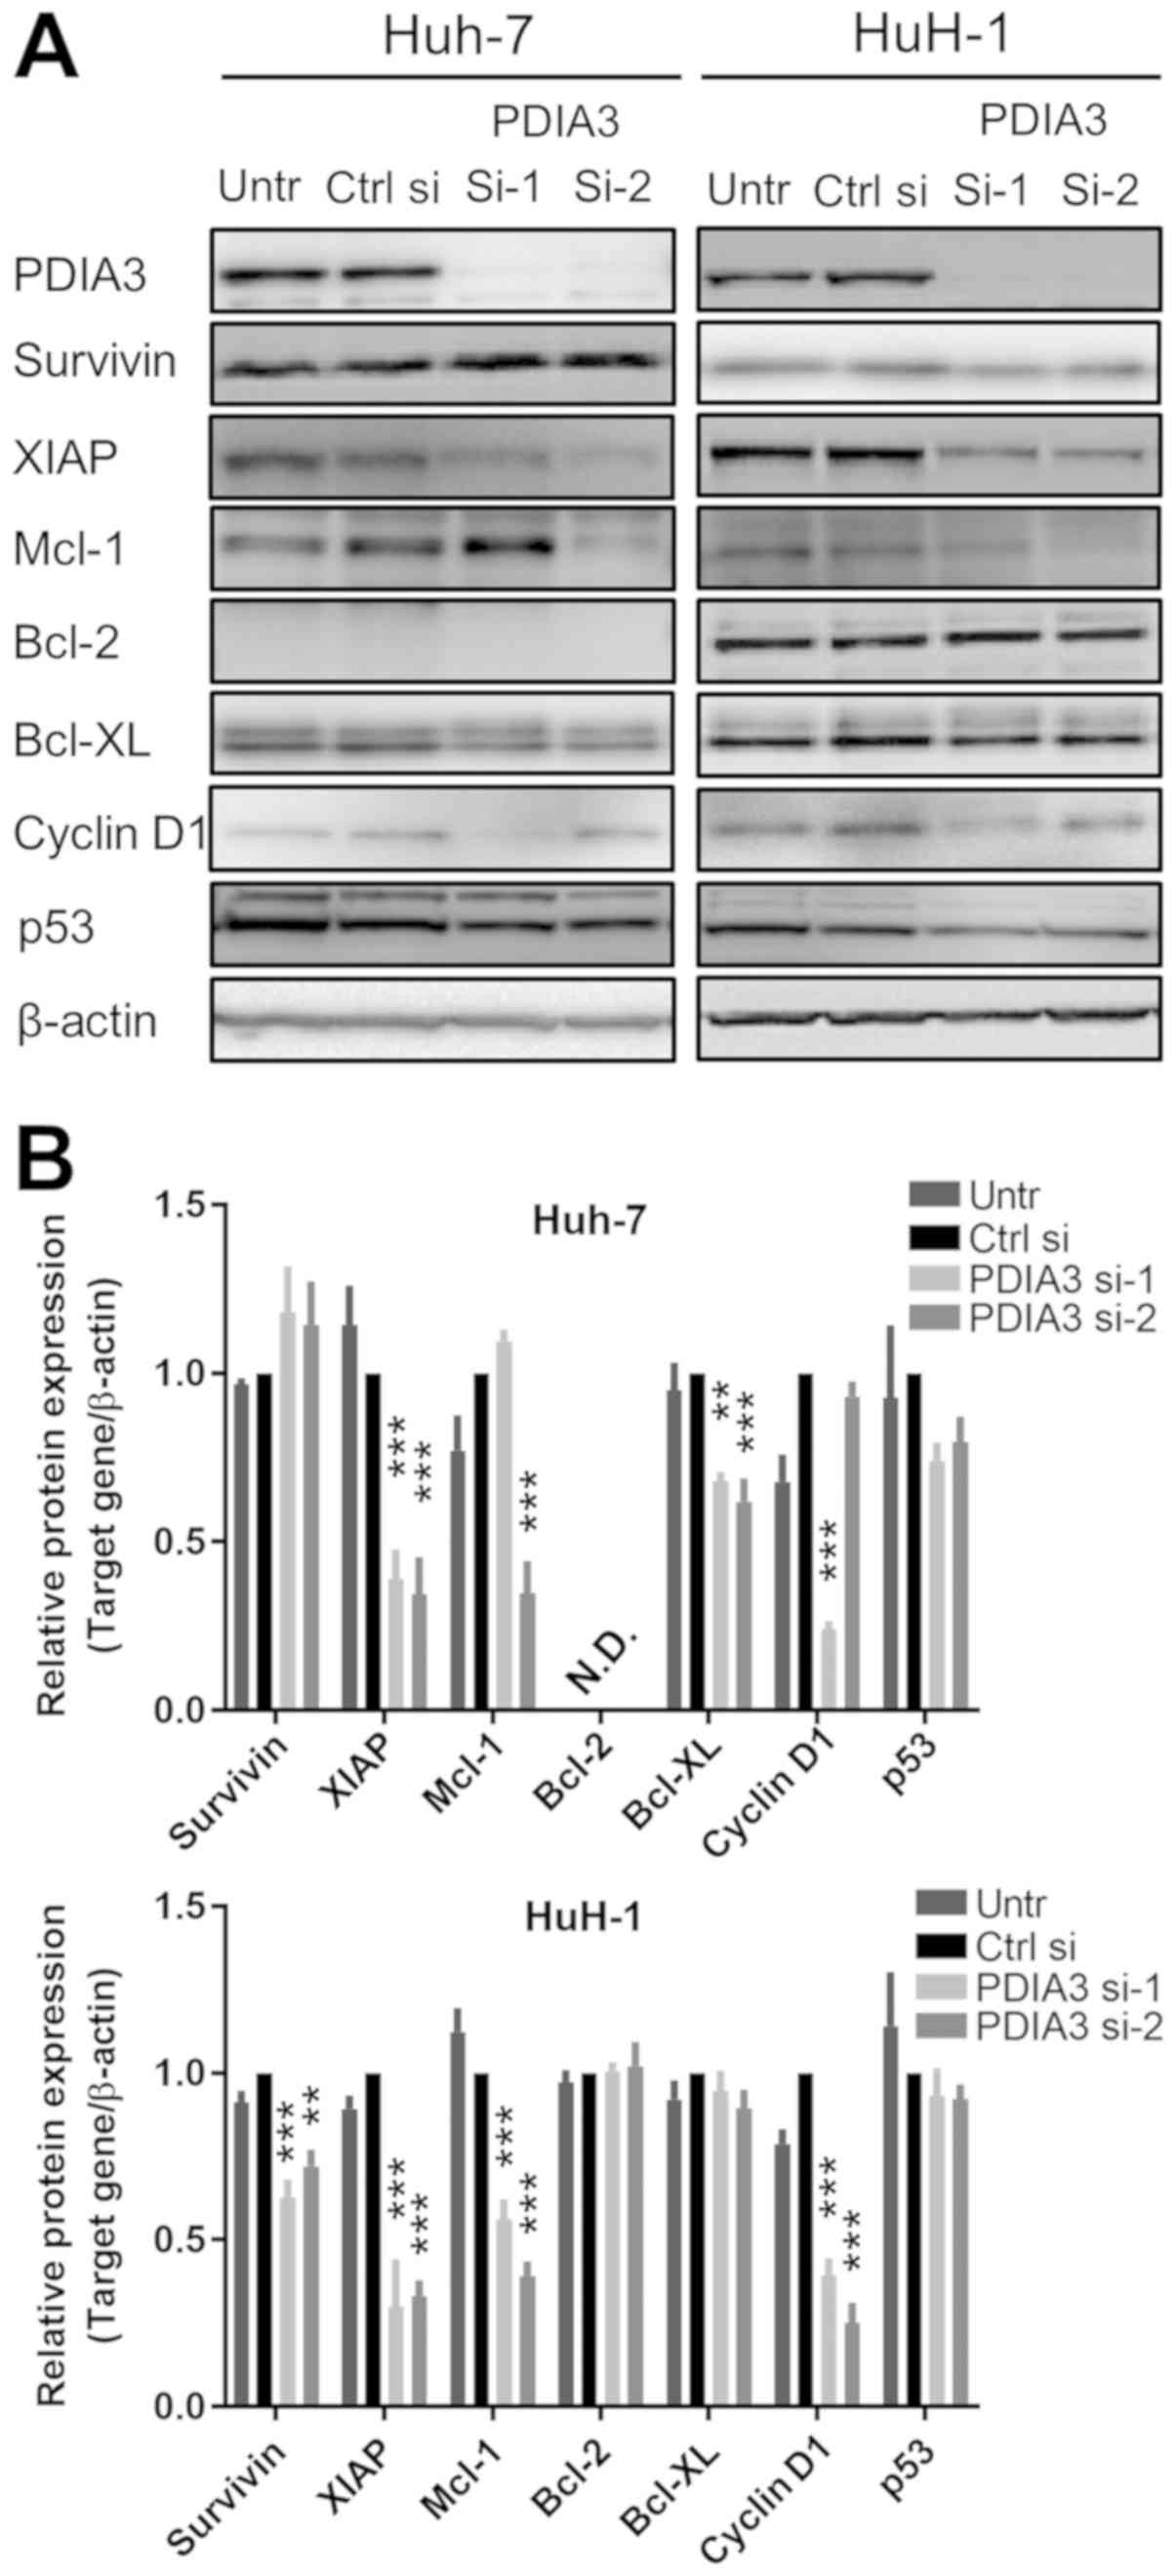 | Figure 5Downstream targets of signal
transducer and activator of transcription 3 in hepatocellular
carcinoma cells with silenced PDIA3. Huh-7 and HuH-1 cells were
transfected with Ctrl si, PDIA3 si-1 and PDIA3 si-2 for 96 h. (A)
Total protein was extracted for immunoblotting with antibodies
against PDIA3, survivin, XIAP, Mcl-1, Bcl-2, Bcl-XL, cyclin D1, p53
and β-actin. (B) Relative quantification of the protein expression.
The data are expressed as the mean ± standard error of the mean.
**P<0.01, ***P<0.001, vs. Ctrl si
(two-way analysis of variance). PDIA3, protein disulfide-isomerase
A3; XIAP, X-linked inhibitor of apoptosis protein; Mcl-1, induced
myeloid leu-kemia cell differentiation protein Mcl-1; Bcl-2, B-cell
lymphoma 2; Bcl-XL, Bcl-2-like protein 1; p53, cellular tumor
antigen p53; Untr, untreated control; PDIA si-1/PDIA si-2, PDIA3
siRNA; Ctrl si, control siRNA, N.D., not detected. |
PDIA3 knockdown with si-1 leads to a
significant, but small, additional inhibitory effect on cell
proliferation in HCC cells treated with AG490
The JAK/STAT3 signaling inhibitor AG490 suppressed
the levels of P-STAT3 (Fig. 6A).
Subsequently, to confirm that PDIA3 knockdown led to a decrease in
cell proliferation mainly through STAT3 signaling, the cell
proliferation of HCC cells treated with PDIA3 siRNAs was examined
in the presence of AG490. AG490 markedly decreased cell
proliferation in the two HCC cells (P<0.001 at 72 and 96 h; Ctrl
si vs. Ctrl si + AG490; Fig. 6B).
In the Huh-7 cells, PDIA3 si-1 or si-2 + AG490 decreased the cell
proliferation only by a further 7.2 or 5.2%, respectively, compared
with the effect of AG490 alone at 96 h, and only the additional
effect of si-1 was statistically significant (PDIA3 si-1 + AG490
vs. Ctrl si + AG490, P<0.05; PDIA3 si-2 + AG490 vs. Ctrl si +
AG490, P=0.22; Fig. 6B). In the
HuH-1 cells, PDIA3 si-1 or si-2 + AG490 decreased the cell
proliferation by 8.3 and 4.3% more than AG490 alone at 96 h,
respectively, and only the effect of si-1 was statistically
significant (P<0.001 PDIA3 si-1 + AG490 vs. Ctrl si + AG490,
P<0.001; PDIA3 si-2 + AG490 vs. Ctrl si + AG490, P=0.086;
Fig. 6B). Notably, these
additional inhibitory effects of PDIA3 knockdown under AG490
treatment conditions were small compared with the inhibitory effect
of AG490 alone (56.5 and 48.4% decrease in Huh-7 and HuH-1,
respectively, compared with Ctrl si at 96 h). These results
demonstrated that the inhibitory effect of PDIA3 knockdown on the
proliferation of HCC cells with deactivated STAT3 was weak,
suggesting that PDIA3 knockdown inhibits cell proliferation
predominantly through STAT3 signaling.
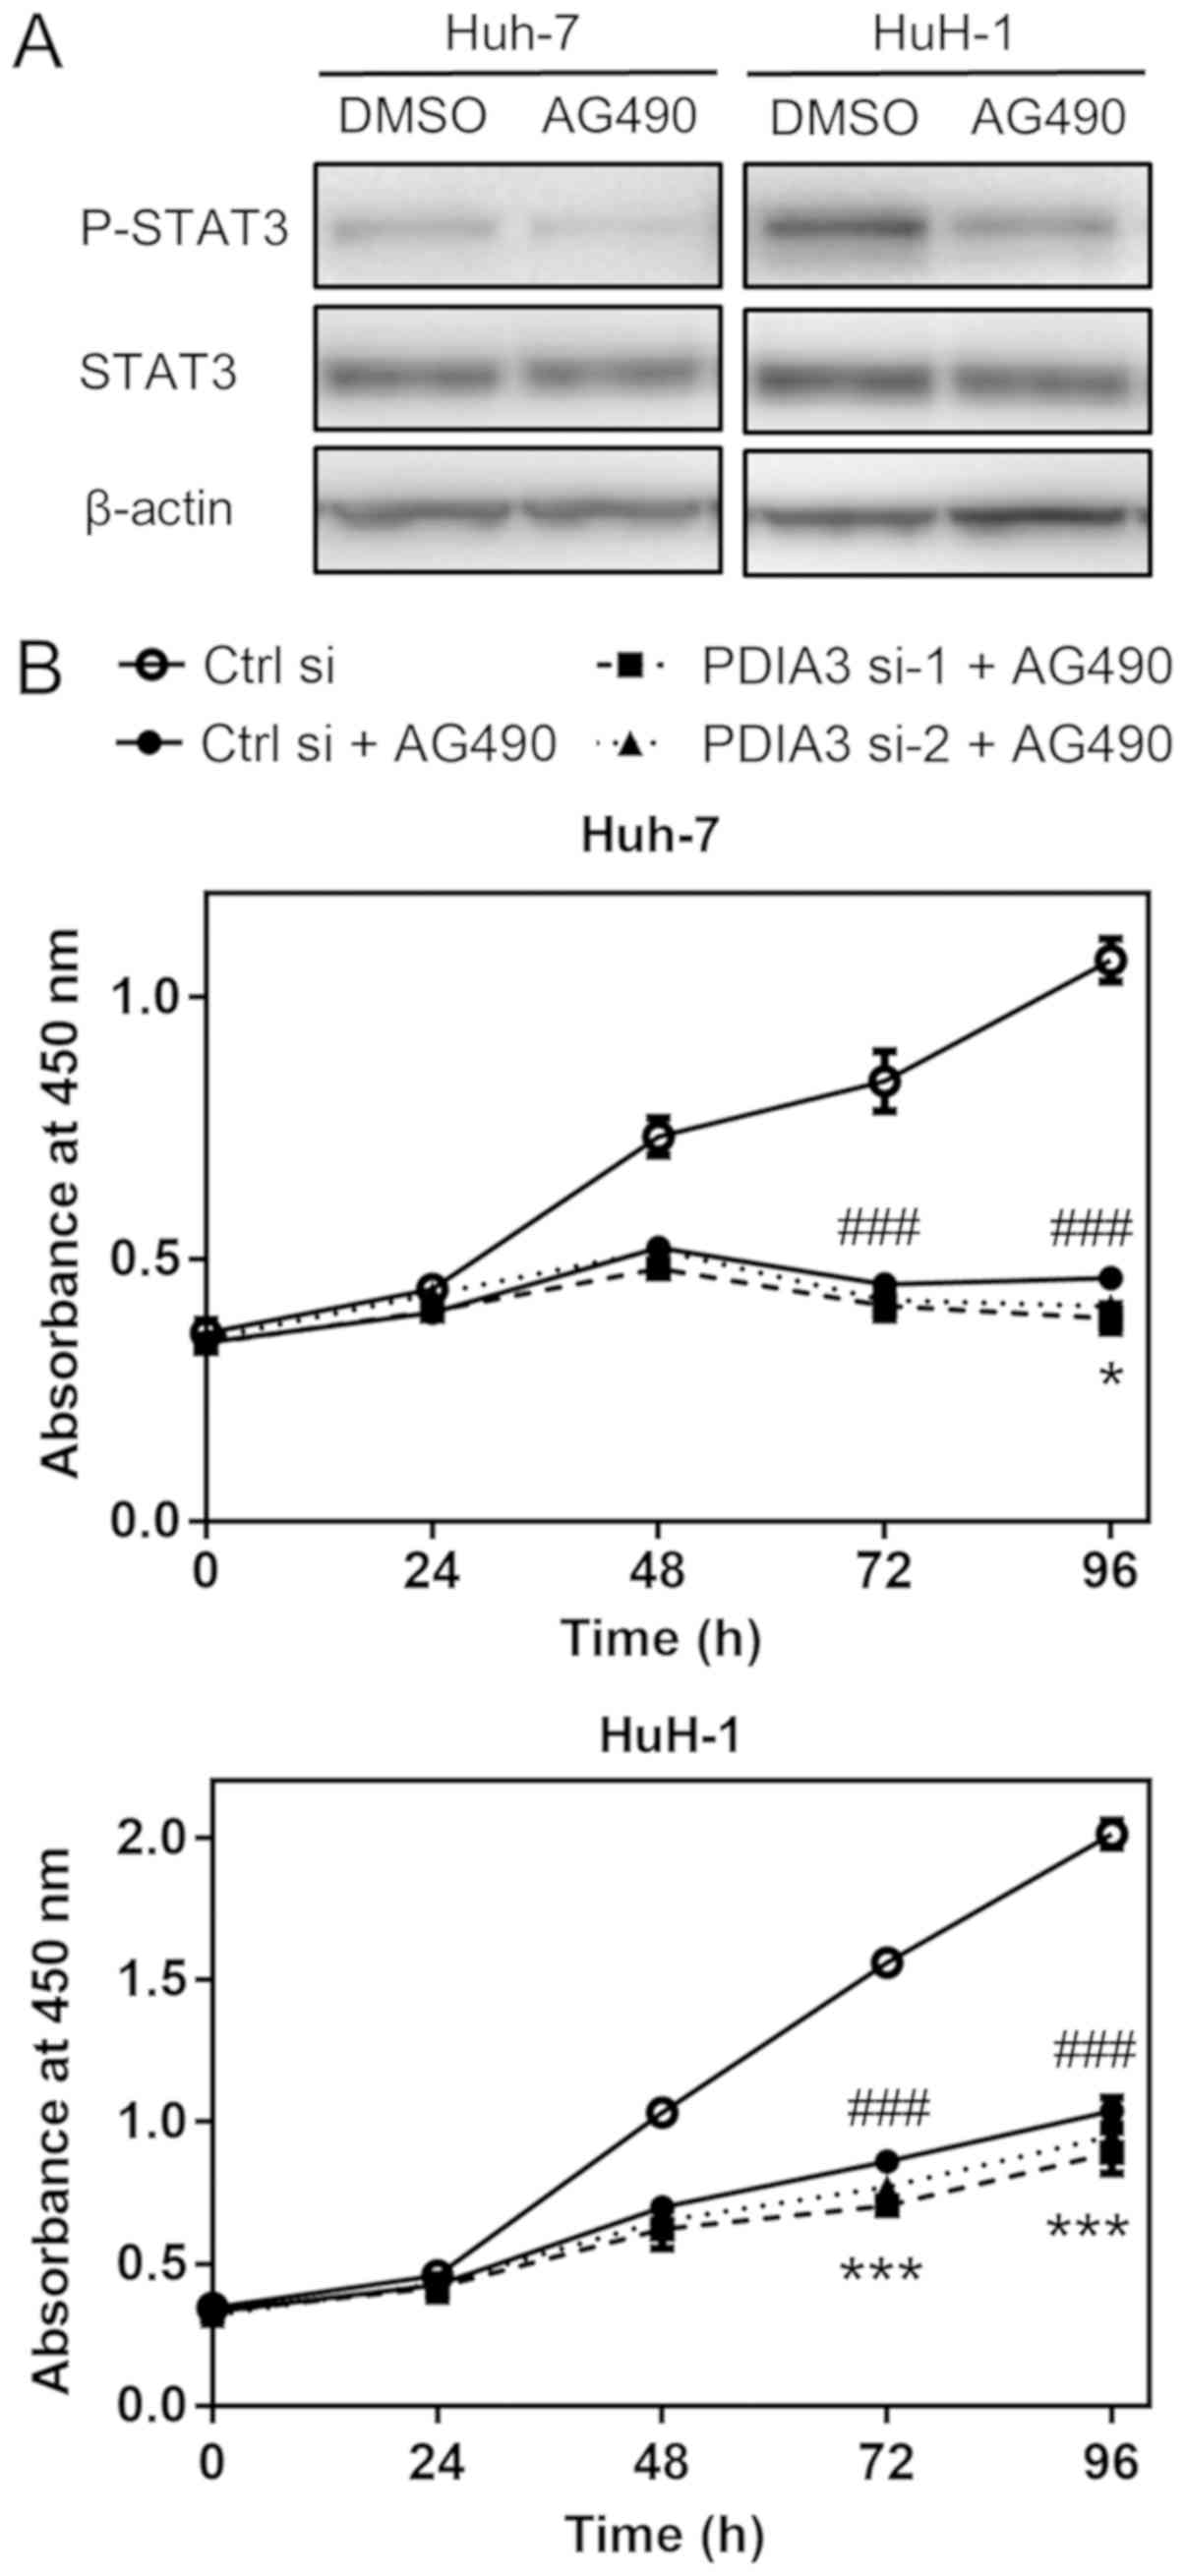 | Figure 6Effects of PDIA3 knockdown on HCC
cell proliferation in the presence of AG490. (A) Representative
western blots of P-STAT3 (Tyr705) levels following treatment with
100 µM AG490 (a tyrosine-protein kinase JAK/STAT3 signaling
inhibitor) or control (0.1% DMSO) for 3 h in HCC Huh-7 and HuH-1
cells. Total protein was extracted and subjected to immu-noblotting
with antibodies against P-STAT3, STAT3 and β-actin. (B) Cell
proliferation was evaluated using the WST-8 cell counting reagent.
Huh-7 and HuH-1 cells were transfected with Ctrl si, PDIA3 si-1 and
PDIA3 si-2, and treated with 25 µM AG490. At the indicated
time points, the number of cells per well was estimated by
measuring the absorbance at 450 nm. The data are expressed as the
mean ± standard error of the mean. ###P<0.001 vs.
Ctrl si; *P<0.05, PDIA3 si-1 + AG490 vs. Ctrl si +
AG490; ***P<0.001, PDIA3 si-1 + AG490 vs. Ctrl si +
AG490 (two-way analysis of variance). The results are from ≥3
independent experiments. PDIA3, protein disul-fide-isomerase A3;
STAT3, signal transducer and activator of transcription 3; P-STAT3,
phosphorylated STAT3; HCC, hepatocellular carcinoma; PDIA si-1/PDIA
si-2, PDIA3 siRNA; Ctrl si, control siRNA. |
PDIA3 expression is associated with
P-STAT3 levels in HCC tissues
Immunohistochemical staining of 35 HCC tissues
revealed an association between PDIA3 and P-STAT3 levels. The HCC
tissues that were positive for P-STAT3 exhibited significantly
higher PDIA3 expression than those that were negative for P-STAT3
(mean PDIA3 expression score ± SD, 4.8±0.8 and 2.9±1.5,
respectively; P<0.001; Fig. 7A
and B). The HCC tissues that were P-STAT3 positive also
demonstrated a tendency towards a higher Ki-67 index than those
that were negative, although this was not statistically significant
(mean Ki-67 index, 24.0 and 16.9%, respectively; P=0.069; Fig. 7C). By contrast, the
P-STAT3-positive tissues demonstrated significantly fewer apoptotic
cells than those that were negative (2.9 and 7.9% apoptotic cells,
respectively; P<0.001; Fig.
7D). However, no association was observed between the P-STAT3
status and the clinicopathological features (Table I). Overall, PDIA3 expression was
associated with a P-STAT3-positive status, which in turn was
associated with decreased apoptosis in HCC tissues.
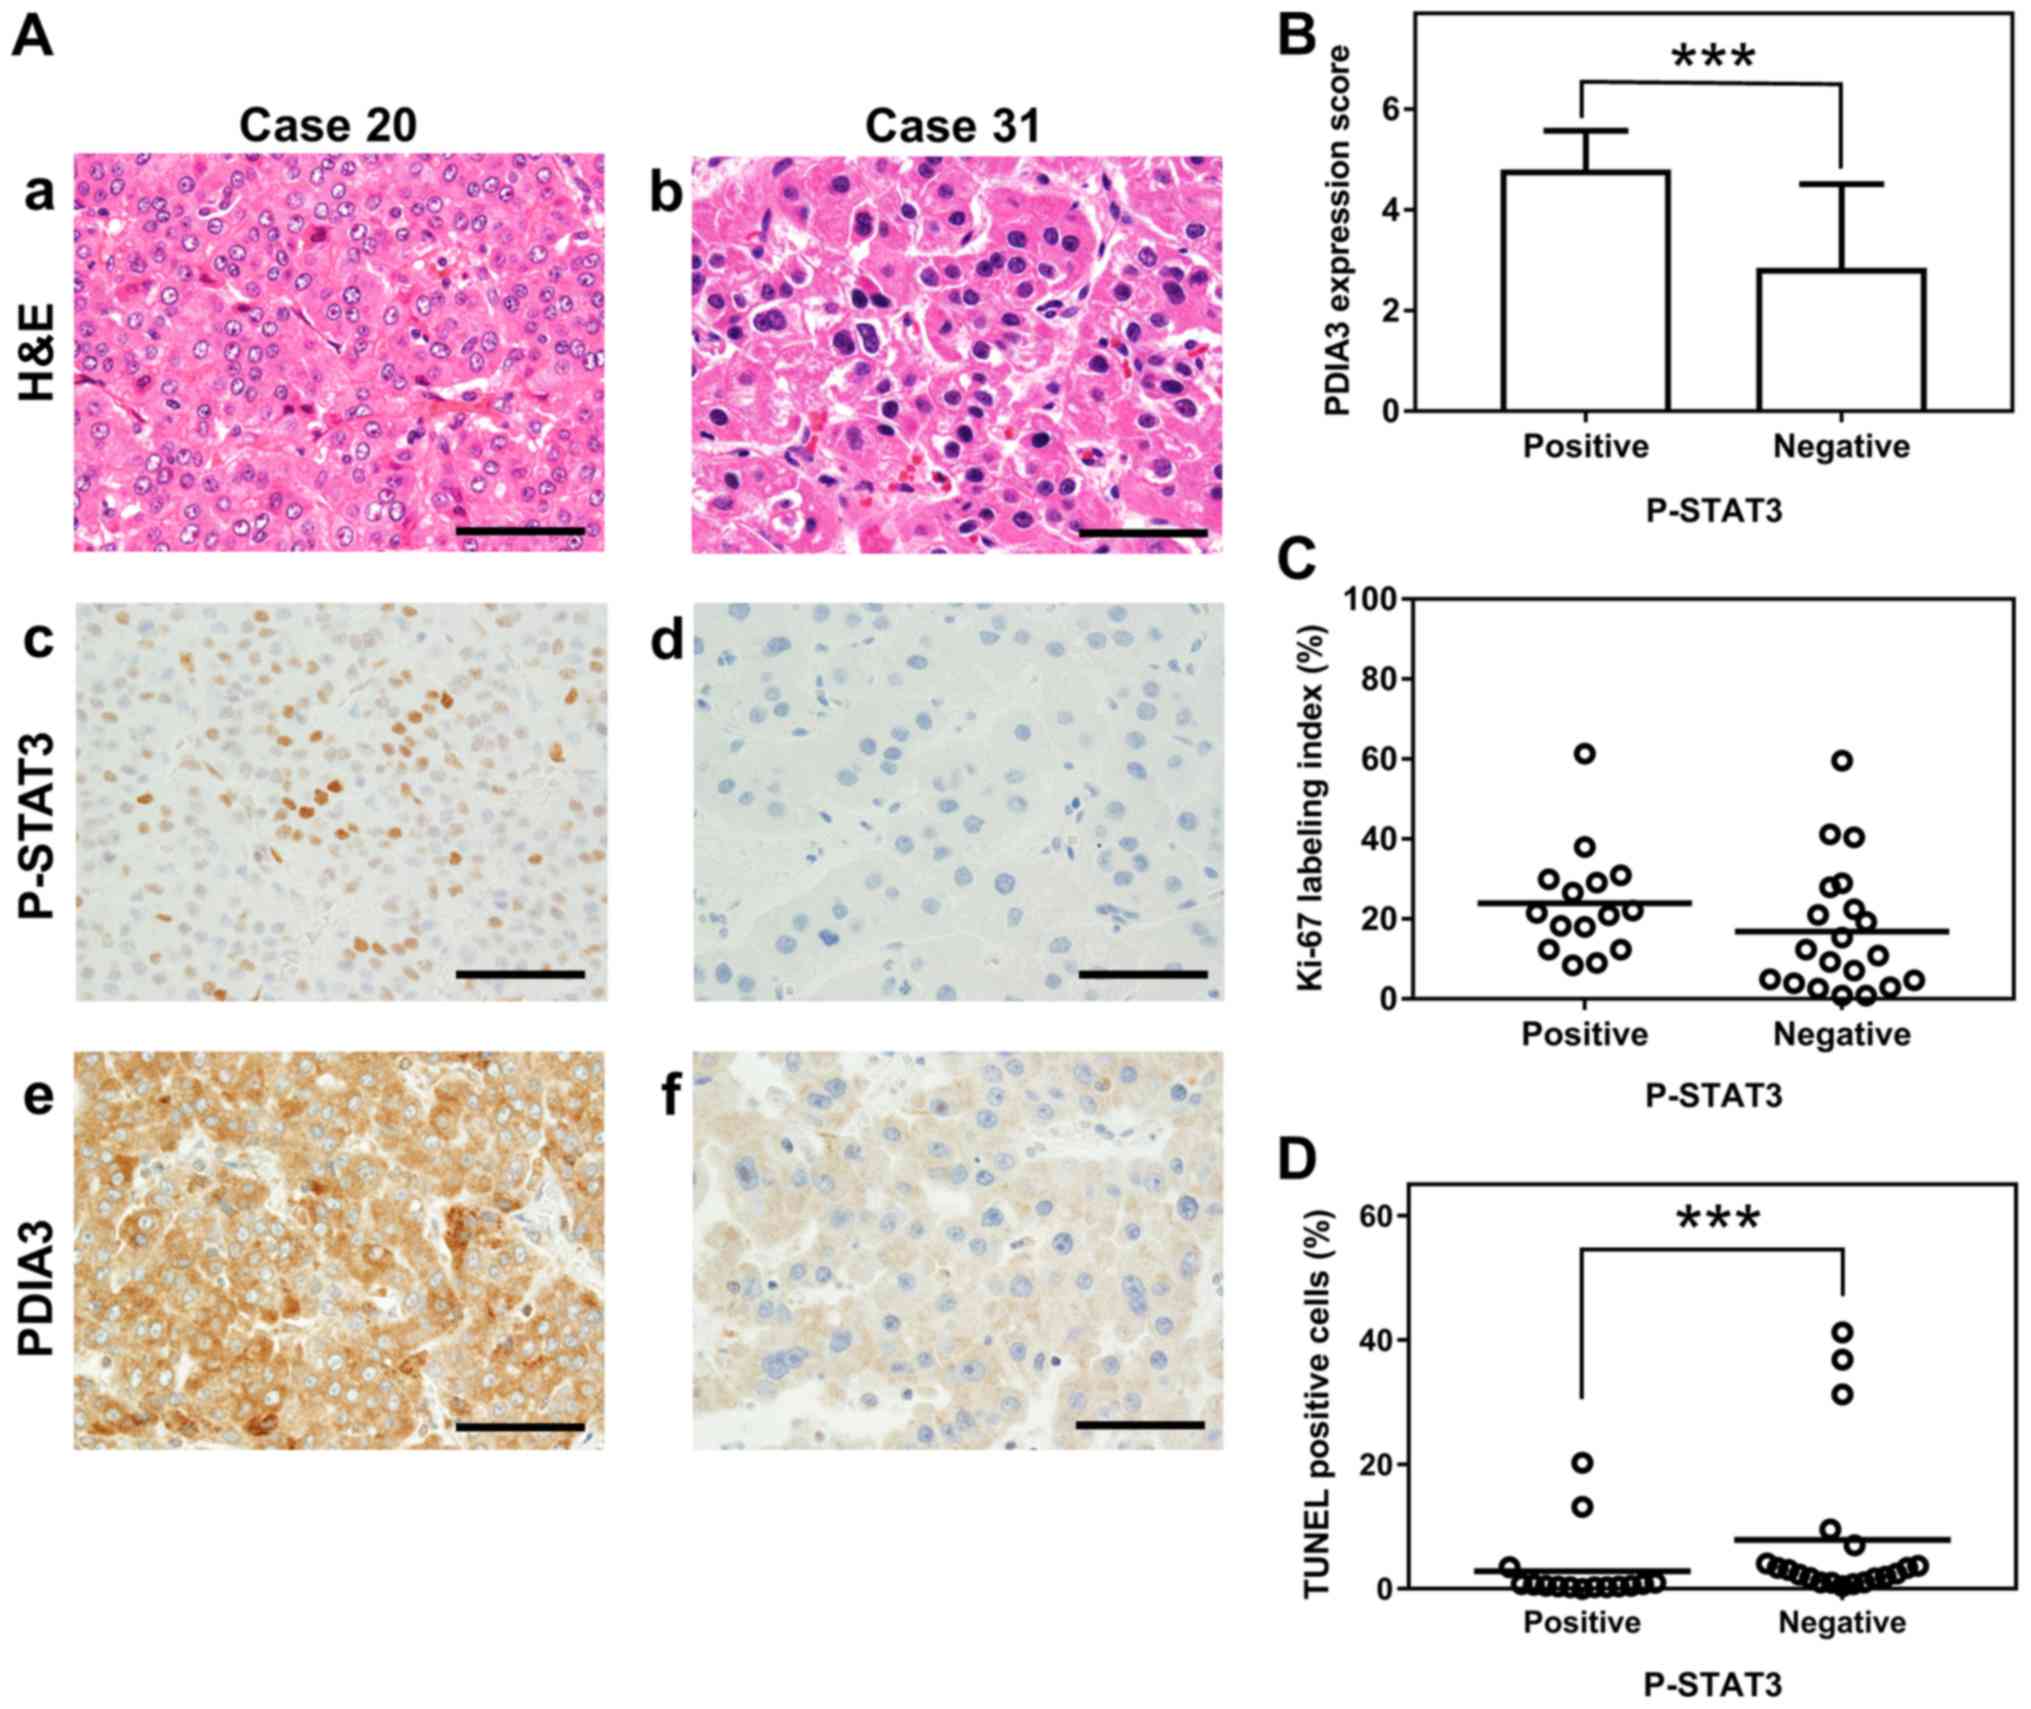 | Figure 7Association between P-STAT3 and PDIA3
expression, Ki-67 index and apoptotic cells in HCC tissues. (A)
Representative histological and immunohistochemical staining of two
HCC tissues (×600 magnification). The HCC tissues were examined by
(a and b) H&E staining, and immunohistochemistry staining with
(c and d) anti-P-STAT3 (Tyr705) antibody and (e and f) anti-PDIA3
antibody. The HCC tissue of case 20 is P-STAT3 positive (a, c and
e) and that of case 31 is P-STAT3 negative (b, d and f). Scale
bars, 50 µm. (B) The association between P-STAT3 status and
PDIA3 expression in tissues from 35 HCC cases. Values are expressed
as the mean ± standard deviation. ***P<0.001
(Mann-Whitney U-test). Scatter plots of percentages of (C) the
Ki-67 index and (D) TUNEL-positive cells in HCC tissues positive
(≥10% positive tumor cells) or negative (<10% positive tumor
cells) for P-STAT3. ***P<0.001 (Mann-Whitney U-test).
PDIA3, protein disulfide-isomerase A3; STAT3, signal transducer and
activator of transcription 3; P-STAT3, phosphorylated STAT3; Ki-67,
proliferation marker protein Ki-67; TUNEL, terminal
deoxynucleotidyl-transferase-mediated dUTP nick end labeling;
H&E, hematoxylin and eosin; HCC, hepatocellular carcinoma. |
Discussion
Mutations within several genes can lead to
alterations in the expression of various essential proteins and
change the biological behavior of cancer cells. Certain of these
proteins may be used as prognostic markers. In previous studies of
patients with HCC, the upregulation of PDIA3 expression was
associated with poor prognosis (20,23)
and with increased cell proliferation and survival (20). To test the reproducibility of a
previous study (20) on the
collected samples in the present study and the contribution of
PDIA3 to tumor progression, immunohistochemical staining of HCC
tissues for PDIA3 was performed. PDIA3 expression in HCC was not
associated with any clinicopathological features, including
vascular invasion. However, high PDIA3 levels were associated with
an increased Ki-67 labeling index, and a lower TUNEL index,
suggesting a contribution of PDIA3 to HCC cell proliferation and
survival. Therefore, an in vitro evaluation of cell
proliferation and apoptosis was conducted.
Notably, the knockdown of PDIA3 significantly
inhibited cell proliferation and induced apoptosis in HCC cells.
These findings are reported for the first time in HCC. However, the
question remains of how PDIA3 modulates cell proliferation and
apoptosis in this cancer type.
ER chaperones protect cells from apoptosis induced
by ER stress (24,25). As PDIA3 is an ER chaperone, the
possibility was considered that its knockdown may cause ER
stress-dependent apoptosis. Therefore, the expression of an ER
stress marker, GRP78 (26,27), was examined following suppression
of PDIA3. However, the GRP78 levels did not increase, indicating
that ER stress is not involved in the induction of apoptosis by
PDIA3 knockdown in HCC cells.
PDIA3 is associated with several proteins and
signaling pathways, including STAT3 (16-18),
mammalian target of rapamycin complex 1 (28,29),
apurinic endonuclease/redox factor-1 (30), 1,25-dihydroxyvitamin D3 (31) and H2A histone family member X
(32). Of these, STAT3 is
particularly well known as an important pathway associated with
cell proliferation and survival in HCC. In the present study, it
was revealed that PDIA3 and STAT3 colocalized in the cytoplasm and
nucleus of HCC cells and formed complexes. Furthermore, PDIA3
knockdown led to a decrease in the levels of P-STAT3. However,
PDIA3 knockdown had little inhibitory effect on the cell
proliferation in the presence of the JAK/STAT3 signaling inhibitor
AG490. These findings may be the supportive evidence that PDIA3
functions mainly through the STAT3 signaling pathway. These results
are consistent with those from several cancer cell lines (18,19),
suggesting that PDIA3 is involved in the phosphorylation process
and the DNA-binding activity of STAT3. Furthermore, an association
was observed between PDIA3 and P-STAT3 expression in HCC tissues.
To the best of our knowledge, these data are the first to
demonstrate the association between PDIA3 and P-STAT3 in human HCC
specimens. To better understand the mechanism of STAT3
signaling-activation mediated by PDIA3, further assessments into
the transportation into the nucleus, binding to DNA fragments and
protection of STAT3 from dephosphorylation are required.
Furthermore, PDIA3 knockdown was revealed to lead to
a decrease in the levels of certain proteins associated with the
STAT3 signaling pathway. First, the cell cycle protein cyclin D1
decreased in HuH-1 but not in Huh-7 cells following PDIA3-si2
treatment. Additionally, the cell cycle analysis demonstrated no
G0/G1 arrest. Within the cell cycle, the
effect of PDIA3 silencing remains unclear. Next, PDIA3 knockdown
was previously revealed to increase the expression of p53 and
induce apoptosis in tumor cells in a p53-dependent manner (19,29).
However, in the present study, the expression of p53 was not
increased following PDIA3 siRNA treatment in Huh-7 and HuH-1 cells,
possibly because these cells have a homozygous loss-of-function
mutation in p53 (33). Therefore,
apoptosis was induced in Huh-7 and HuH-1 cells in a p53-independent
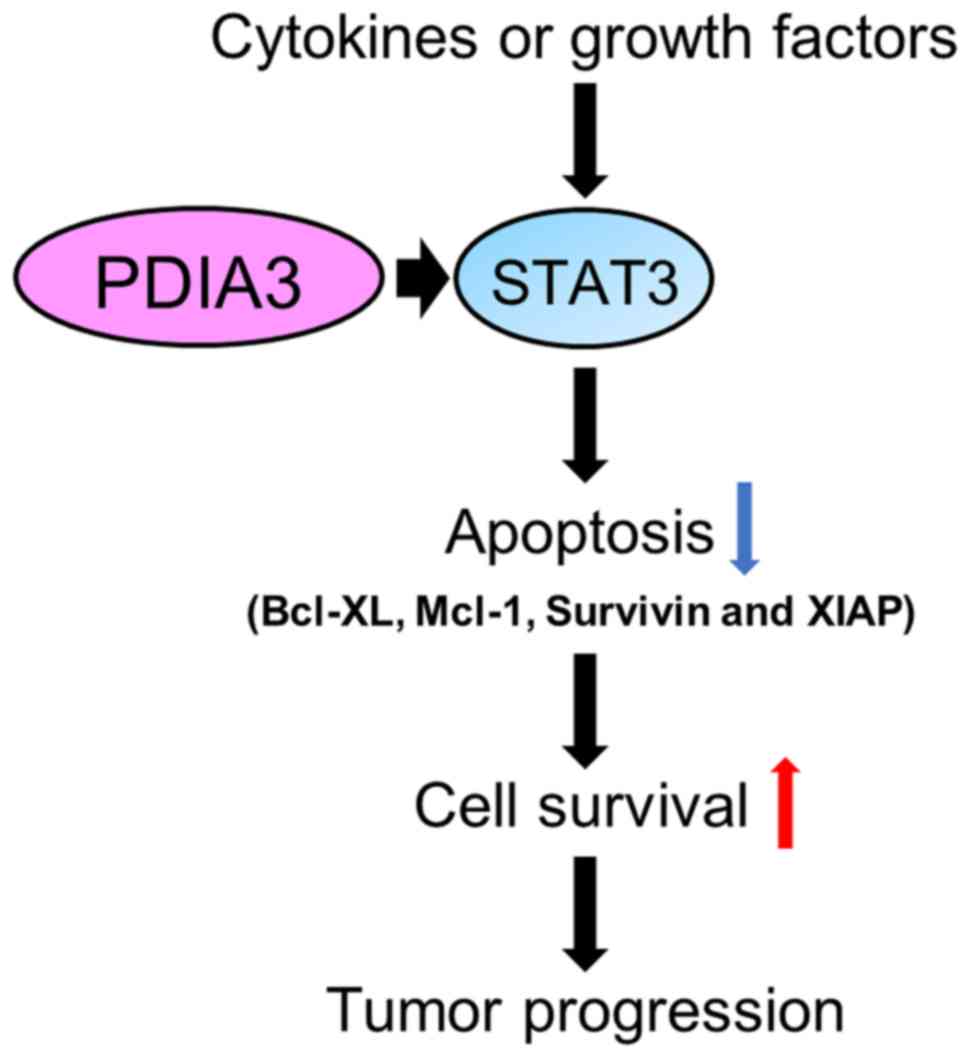
manner. Finally, PDIA3 knockdown was revealed to decrease the
levels of certain anti-apoptotic proteins, including survivin,
XIAP, Mcl-1 and Bcl-XL. Therefore, it is hypothesized that PDIA3
expression in HCC promotes cell survival by modulating
anti-apoptotic proteins (Fig. 8).
Regarding the undetectable Bcl-2 expression in the Huh-7 cells,
Wang et al (34) reported a
similar result; however certain studies have detected it, but
reported that it was lower in Huh-7 cells compared with other
hepatoma cell lines (35,36). There is a possibility that the
expression of Bcl-2 was not detected in the present study due to
different experimental conditions. Differences in the
anti-apoptotic protein levels following PDIA3 knockdown were
observed between the Huh-7 and HuH-1 cells. This may be due to
crosstalk between STAT3 signaling and other transcriptional
mechanisms (37).
The association between PDIA3 and STAT3 signaling in
HCC was demonstrated in the present study. However, it remained
unclear whether PDIA3 specifically associates with P-STAT3 as well
as non-phosphorylated STAT3. PDIA3 colocalized with STAT3 in the
cytoplasm and nucleus of the HCC cells. In addition, it was
observed in the nucleus of HCC cells in which the majority of STAT3
detection occurred. Therefore, PDIA3 and P-STAT3 may interact in
nucleus. The present findings indicated that PDIA3 mainly
associates with P-STAT3, however, the immunofluorescence staining
was not sufficient to support that. To the best of our knowledge,
this issue remains unclear and further assessments are required to
improve our understanding.
In HCC therapy, sorafenib inhibits not only the
downstream signaling of the receptor for the vascular endothelial
growth factor, but also the phosphorylation level of STAT3
(38-40). However, previous studies have
documented that P-STAT3 is upregulated in sorafenib-resistant
patients with HCC and sorafenib-resistant HCC cell lines that were
established following long-term exposure to sorafenib (41,42).
In addition, dovitinib, a multi-targeted receptor tyrosine kinase
inhibitor, is effective in sorafenib-resistant HCC cell lines due
to inhibiting the STAT3 signaling pathway by a different mechanism
(42). STAT3 serves an important
role in sorafenib resistance and would therefore be an important
therapeutic target. In addition, PDIA3 is known to contribute to
chemoresistance (43) and
radio-resistance (19) and, since
it modulates the P-STAT3 levels, it is a potential therapeutic
target in sorafenib-resistant HCC. The association of PDIA3 with
chemoresistance in HCC requires further elucidation.
In conclusion, PDIA3 is upregulated in HCC tissues
and cell lines, and is associated with cell survival factors. In
the present study, it was revealed that the poor prognosis in HCC
associated with a high expression of PDIA3 may be induced by a
complex formation between PDIA3 and STAT3 in HCC cells, regulating
the transcriptional potential of STAT3. These findings suggest that
PDIA3 participates in the aggressive phenotype of HCC through its
association with STAT3 signaling, hence PDIA3 is considered a
potential therapeutic target for the treatment of HCC.
Funding
This study was supported by Grants-in-aid for the
Clinical Rebiopsy Bank Project for Comprehensive Cancer Therapy
Development from the Ministry of Education, Culture, Sports,
Science and Technology, Japan (grant no. S1311022).
Availability of data and materials
The datasets used and/or analyzed during the current
study are available from the corresponding author on reasonable
request.
Authors' contributions
RK, ZN and KI were involved in the conception and
design of the study; RK, KI, YK, SK, WXP, MK, HT and NT performed
the experiments; RK, KI, RW and HY analyzed the data; RK drafted
the manuscript; HY and ZN reviewed and edited the manuscript. All
authors have read and approved the final manuscript.
Ethics approval and consent to
participate
This study was conducted according to the
Declaration of Helsinki and the Japanese Society of Pathology, and
was given official approval by the Ethics Committee of Nippon
Medical School Hospital, Tokyo, Japan (approval no. 29-03-908).
Written informed consent was obtained from all patients.
Patient consent for publication
Written informed consent was obtained from the
patients.
Competing interests
The authors declare that they have no competing
interests.
Acknowledgments
The authors thank Dr Eiji Uchida, Dr Hidemi
Takahashi, Ms. Masumi Shimizu, Ms. Kiyoko Kawahara, Mr. Takenori
Fuji, Mr. Kiyoshi Teduka, Ms. Yoko Kawamoto and Ms. Taeko Kitamura,
Nippon Medical School, Tokyo, Japan, for their assistance.
References
|
1
|
Torre LA, Bray F, Siegel RL, Ferlay J,
Lortet-Tieulent J and Jemal A: Global cancer statistics, 2012. CA
Cancer J Clin. 65:87–108. 2015. View Article : Google Scholar : PubMed/NCBI
|
|
2
|
Fitzmorris P, Shoreibah M, Anand BS and
Singal AK: Management of hepatocellular carcinoma. J Cancer Res
Clin Oncol. 141:861–876. 2015. View Article : Google Scholar
|
|
3
|
Imamura H, Matsuyama Y, Tanaka E, Ohkubo
T, Hasegawa K, Miyagawa S, Sugawara Y, Minagawa M, Takayama T,
Kawasaki S, et al: Risk factors contributing to early and late
phase intrahepatic recurrence of hepatocellular carcinoma after
hepatectomy. J Hepatol. 38:200–207. 2003. View Article : Google Scholar : PubMed/NCBI
|
|
4
|
Bellavance EC, Lumpkins KM, Mentha G,
Marques HP, Capussotti L, Pulitano C, Majno P, Mira P,
Rubbia-Brandt L, Ferrero A, et al: Surgical management of
early-stage hepato-cellular carcinoma: Resection or
transplantation? J Gastrointest Surg. 12:1699–1708. 2008.
View Article : Google Scholar : PubMed/NCBI
|
|
5
|
Nakajima Y, Ko S, Kanamura T, Nagao M,
Kanehiro H, Hisanaga M, Aomatsu Y, Ikeda N and Nakano H: Repeat
liver resection for hepatocellular carcinoma. J Am Coll Surg.
192:339–344. 2001. View Article : Google Scholar : PubMed/NCBI
|
|
6
|
Ge S and Huang D: Systemic therapies for
hepatocellular carcinoma. Drug Discov Ther. 9:352–362. 2015.
View Article : Google Scholar : PubMed/NCBI
|
|
7
|
Daher S, Massarwa M, Benson AA and Khoury
T: Current and Future Treatment of Hepatocellular Carcinoma: An
Updated Comprehensive Review. J Clin Transl Hepatol. 6:69–78. 2018.
View Article : Google Scholar : PubMed/NCBI
|
|
8
|
Swamy SG, Kameshwar VH, Shubha PB, Looi
CY, Shanmugam MK, Arfuso F, Dharmarajan A, Sethi G, Shivananju NS
and Bishayee A: Targeting multiple oncogenic pathways for the
treatment of hepatocellular carcinoma. Target Oncol. 12:1–10. 2017.
View Article : Google Scholar
|
|
9
|
Yu H, Pardoll D and Jove R: STATs in
cancer inflammation and immunity: A leading role for STAT3. Nat Rev
Cancer. 9:798–809. 2009. View
Article : Google Scholar : PubMed/NCBI
|
|
10
|
Nikolaou K, Sarris M and Talianidis I:
Molecular pathways: The complex roles of inflammation pathways in
the development and treatment of liver cancer. Clin Cancer Res.
19:2810–2816. 2013. View Article : Google Scholar : PubMed/NCBI
|
|
11
|
Subramaniam A, Shanmugam MK, Perumal E, Li
F, Nachiyappan A, Dai X, Swamy SN, Ahn KS, Kumar, Tan BK, et al:
Potential role of signal transducer and activator of transcription
(STAT)3 signaling pathway in inflammation, survival, proliferation
and invasion of hepatocellular carcinoma. Biochim Biophys Acta.
1835:46–60. 2013.
|
|
12
|
Wu WY, Li J, Wu ZS, Zhang CL, Meng XL and
Lobie PE: Prognostic significance of phosphorylated signal
transducer and activator of transcription 3 and suppressor of
cytokine signaling 3 expression in hepatocellular carcinoma. Exp
Ther Med. 2:647–653. 2011. View Article : Google Scholar : PubMed/NCBI
|
|
13
|
Zhang CH, Xu GL, Jia WD, Li JS, Ma JL, Ren
WH, Ge YS, Yu JH, Liu WB and Wang W: Activation of STAT3 signal
pathway correlates with twist and E-cadherin expression in
hepatocellular carcinoma and their clinical significance. J Surg
Res. 174:120–129. 2012. View Article : Google Scholar
|
|
14
|
Mano Y, Aishima S, Fujita N, Tanaka Y,
Kubo Y, Motomura T, Taketomi A, Shirabe K, Maehara Y and Oda Y:
Tumor-associated macrophage promotes tumor progression via STAT3
signaling in hepatocellular carcinoma. Pathobiology. 80:146–154.
2013. View Article : Google Scholar : PubMed/NCBI
|
|
15
|
Hettinghouse A, Liu R and Liu CJ:
Multifunctional molecule ERp57: From cancer to neurodegenerative
diseases. Pharmacol Ther. 181:34–48. 2018. View Article : Google Scholar
|
|
16
|
Ndubuisi MI, Guo GG, Fried VA, Etlinger JD
and Sehgal PB: Cellular physiology of STAT3: Where's the
cytoplasmic monomer? J Biol Chem. 274:25499–25509. 1999. View Article : Google Scholar : PubMed/NCBI
|
|
17
|
Eufemi M, Coppari S, Altieri F, Grillo C,
Ferraro A and Turano C: ERp57 is present in STAT3-DNA complexes.
Biochem Biophys Res Commun. 323:1306–1312. 2004. View Article : Google Scholar : PubMed/NCBI
|
|
18
|
Chichiarelli S, Gaucci E, Ferraro A,
Grillo C, Altieri F, Cocchiola R, Arcangeli V, Turano C and Eufemi
M: Role of ERp57 in the signaling and transcriptional activity of
STAT3 in a melanoma cell line. Arch Biochem Biophys. 494:178–183.
2010. View Article : Google Scholar
|
|
19
|
Choe MH, Min JW, Jeon HB, Cho DH, Oh JS,
Lee HG, Hwang SG, An S, Han YH and Kim JS: ERp57 modulates STAT3
activity in radioresistant laryngeal cancer cells and serves as a
prognostic marker for laryngeal cancer. Oncotarget. 6:2654–2666.
2015. View Article : Google Scholar : PubMed/NCBI
|
|
20
|
Takata H, Kudo M, Yamamoto T, Ueda J,
Ishino K, Peng WX, Wada R, Taniai N, Yoshida H, Uchida E, et al:
Increased expression of PDIA3 and its association with cancer cell
proliferation and poor prognosis in hepatocellular carcinoma. Oncol
Lett. 12:4896–4904. 2016. View Article : Google Scholar
|
|
21
|
Livak KJ and Schmittgen TD: Analysis of
relative gene expression data using real-time quantitative PCR and
the 2(−Δ Δ C(T)) method. Methods. 25:402–408. 2001. View Article : Google Scholar
|
|
22
|
Ishino K, Kudo M, Peng WX, Kure S,
Kawahara K, Teduka K, Kawamoto Y, Kitamura T, Fujii T, Yamamoto T,
et al: 2-Deoxy-d-glucose increases GFAT1 phosphorylation resulting
in endoplasmic reticulum-related apoptosis via disruption of
protein N-glycosylation in pancreatic cancer cells. Biochem Biophys
Res Commun. 501:668–673. 2018. View Article : Google Scholar : PubMed/NCBI
|
|
23
|
Liu M, Du L, He Z, Yan L, Shi Y, Shang J
and Tang H: Increased ERp57 Expression in HBV-Related
Hepatocellular Carcinoma: Possible Correlation and Prognosis.
Biomed Res Int. 2017:12526472017.PubMed/NCBI
|
|
24
|
Ni M and Lee AS: ER chaperones in
mammalian development and human diseases. FEBS Lett. 581:3641–3651.
2007. View Article : Google Scholar : PubMed/NCBI
|
|
25
|
Corazzari M, Gagliardi M, Fimia GM and
Piacentini M: Endoplasmic reticulum stress, unfolded protein
response, and cancer cell fate. Front Oncol. 7:782017. View Article : Google Scholar : PubMed/NCBI
|
|
26
|
Bánhegyi G, Baumeister P, Benedetti A,
Dong D, Fu Y, Lee AS, Li J, Mao C, Margittai E, Ni M, et al:
Endoplasmic reticulum stress. Ann N Y Acad Sci. 1113:58–71. 2007.
View Article : Google Scholar : PubMed/NCBI
|
|
27
|
Luo B and Lee AS: The critical roles of
endoplasmic reticulum chaperones and unfolded protein response in
tumorigenesis and anticancer therapies. Oncogene. 32:805–818. 2013.
View Article : Google Scholar
|
|
28
|
Ramírez-Rangel I, Bracho-Valdés I,
Vázquez-Macías A, Carretero-Ortega J, Reyes-Cruz G and
Vázquez-Prado J: Regulation of mTORC1 complex assembly and
signaling by GRp58/ERp57. Mol Cell Biol. 31:1657–1671. 2011.
View Article : Google Scholar : PubMed/NCBI
|
|
29
|
Hussmann M, Janke K, Kranz P, Neumann F,
Mersch E, Baumann M, Goepelt K, Brockmeier U and Metzen E:
Depletion of the thiol oxidoreductase ERp57 in tumor cells inhibits
proliferation and increases sensitivity to ionizing radiation and
chemotherapeutics. Oncotarget. 6:39247–39261. 2015. View Article : Google Scholar : PubMed/NCBI
|
|
30
|
Grillo C, D'Ambrosio C, Scaloni A,
Maceroni M, Merluzzi S, Turano C and Altieri F: Cooperative
activity of Ref-1/APE and ERp57 in reductive activation of
transcription factors. Free Radic Biol Med. 41:1113–1123. 2006.
View Article : Google Scholar : PubMed/NCBI
|
|
31
|
Sequeira VB, Rybchyn MS, Tongkao-On W,
Gordon-Thomson C, Malloy PJ, Nemere I, Norman AW, Reeve VE,
Halliday GM, Feldman D, et al: The role of the vitamin D receptor
and ERp57 in photoprotection by 1α,25-dihydroxyvitamin D3. Mol
Endocrinol. 26:574–582. 2012. View Article : Google Scholar : PubMed/NCBI
|
|
32
|
Krynetskaia NF, Phadke MS, Jadhav SH and
Krynetskiy EY: Chromatin-associated proteins HMGB1/2 and PDIA3
trigger cellular response to chemotherapy-induced DNA damage. Mol
Cancer Ther. 8:864–872. 2009. View Article : Google Scholar : PubMed/NCBI
|
|
33
|
Forbes SA, Beare D, Boutselakis H, Bamford
S, Bindal N, Tate J, Cole CG, Ward S, Dawson E, Ponting L, et al:
COSMIC: Somatic cancer genetics at high-resolution. Nucleic Acids
Res. 45(D1): D777–D783. 2017. View Article : Google Scholar :
|
|
34
|
Wang B, Ni Z, Dai X, Qin L, Li X, Xu L,
Lian J and He F: The Bcl-2/xL inhibitor ABT-263 increases the
stability of Mcl-1 mRNA and protein in hepatocellular carcinoma
cells. Mol Cancer. 13:982014. View Article : Google Scholar : PubMed/NCBI
|
|
35
|
Chen P, Hu T, Liang Y, Jiang Y, Pan Y, Li
C, Zhang P, Wei D, Li P, Jeong LS, et al: Synergistic inhibition of
autophagy and neddylation pathways as a novel therapeutic approach
for targeting liver cancer. Oncotarget. 6:9002–9017.
2015.PubMed/NCBI
|
|
36
|
Zhou M, Zhang Q, Zhao J, Liao M, Wen S and
Yang M: Phosphorylation of Bcl-2 plays an important role in
glycoche-nodeoxycholate-induced survival and chemoresistance in
HCC. Oncol Rep. 38:1742–1750. 2017. View Article : Google Scholar : PubMed/NCBI
|
|
37
|
Zheng HC: The molecular mechanisms of
chemoresistance in cancers. Oncotarget. 8:59950–59964.
2017.PubMed/NCBI
|
|
38
|
Tai WT, Cheng AL, Shiau CW, Huang HP,
Huang JW, Chen PJ and Chen KF: Signal transducer and activator of
transcription 3 is a major kinase-independent target of sorafenib
in hepatocellular carcinoma. J Hepatol. 55:1041–1048. 2011.
View Article : Google Scholar : PubMed/NCBI
|
|
39
|
Gu F-M, Li QL, Gao Q, Jiang JH, Huang XY,
Pan JF, Fan J and Zhou J: Sorafenib inhibits growth and metastasis
of hepato-cellular carcinoma by blocking STAT3. World J
Gastroenterol. 17:3922–3932. 2011. View Article : Google Scholar : PubMed/NCBI
|
|
40
|
Huang CY, Lin CS, Tai WT, Hsieh CY, Shiau
CW, Cheng AL and Chen KF: Sorafenib enhances radiation-induced
apoptosis in hepatocellular carcinoma by inhibiting STAT3. Int J
Radiat Oncol Biol Phys. 86:456–462. 2013. View Article : Google Scholar : PubMed/NCBI
|
|
41
|
van Malenstein H, Dekervel J, Verslype C,
Van Cutsem E, Windmolders P, Nevens F and van Pelt J: Long-term
exposure to sorafenib of liver cancer cells induces resistance with
epithelial-to-mesenchymal transition, increased invasion and risk
of rebound growth. Cancer Lett. 329:74–83. 2013. View Article : Google Scholar
|
|
42
|
Tai WT, Cheng AL, Shiau CW, Liu CY, Ko CH,
Lin MW, Chen PJ and Chen KF: Dovitinib induces apoptosis and
overcomes sorafenib resistance in hepatocellular carcinoma through
SHP-1-mediated inhibition of STAT3. Mol Cancer Ther. 11:452–463.
2012. View Article : Google Scholar
|
|
43
|
Cicchillitti L, Della Corte A, Di Michele
M, Donati MB, Rotilio D and Scambia G: Characterisation of a
multimeric protein complex associated with ERp57 within the nucleus
in paclitaxel-sensitive and -resistant epithelial ovarian cancer
cells: The involvement of specific conformational states of
β-actin. Int J Oncol. 37:445–454. 2010. View Article : Google Scholar : PubMed/NCBI
|
|
44
|
Brierley JD, Gospodarowicz MK and
Wittekind C: TNM Classification of Malignant Tumours. 8th edition.
Wiley-Blackwell; New York, NY: 2016
|