Introduction
The TP53 tumor suppressor gene encodes the
p53 protein, a transcription factor that, in a homotetrameric form,
binds its specific target sites and regulates a plethora of genes.
The function of p53 is crucial for proper control of cell cycle
progression, apoptosis, senescence, DNA repair and genome
maintenance, to name a few of its major functions (1). The importance of p53 in preventing
tumor development is underlined by the fact that it is altered in
>50% of human tumors, more frequently than any other gene. The
majority of the alterations found in the TP53 gene are
missense mutations and are more frequently found at particular
codon positions: R175, R248, R249, R273 and R282 (2). Notably, the same codons are most
frequently mutated in patients with Li-Fraumeni syndrome bearing
germline TP53 mutations and in patients with cancer with
somatic mutations. These positions are termed ‘hot spots’ and the
majority of them are located in the DNA binding domain of the p53
protein. Consequently, a number of the ‘hot spot’ mutations lead to
the loss of the DNA-binding capability and, therefore,
transcriptional activator (TA) function (3). Furthermore, given the tetrameric
structure of the bioactive form of p53, a mutation in one allele
may lead to the functional inactivation of the remaining wild-type
(WT) allele via the formation of heterotetrameric,
transcriptionally inactive complexes (4-6).
This mode of action is referred to as dominant negative. The notion
that a mutated p53 may exhibit oncogenic activity was formulated in
1993, based on in vitro and in vivo evidence
(7); mutations causing such
activity are referred to as gain-of-function (GOF).
A number of studies involving p53 GOF mutations have
been conducted in an in vitro setting, utilizing primary
cells from transgenic animals as well as immortalized cell lines.
This approach allows for the separation of the functional
components of what is observed as ‘tumor progression’ in an animal
model, ‘hallmarks of cancer’ (8,9), and
the investigation of the molecular mechanisms underlying the
observed GOF phenotypes. The range of these phenotypes is broad,
depending on the cell type, the position and type of mutation, and
other co-occurring changes. The most consistently reported
phenotypes entail accelerated growth due to sustained proliferative
signaling, genomic instability, increased survival of cancer cells
that may manifest as resistance to chemotherapy, and increased
mobility/invasiveness that may translate to increased rate of
invasion and metastasis in vivo. Since the focus of the
present study is on migration and invasiveness, other p53 GOF
mutation-induced phenotypes will not be elaborated upon; several
excellent recent reviews on these topics have been published
(10-13).
Progress in molecular biology techniques has enabled
the creation of transgenic mice with NULL-p53 and mutant (mut)-p53
genotypes (14-16). Initially, the mutations most
commonly observed in human patients were introduced into the murine
genome. In the p53 R172H model (equivalent to human R175H) no
decrease in overall survival was revealed, compared with the NULL
genotype, but a marked increase in the frequency of metastasis was
observed in the p53+/R172H heterozygotes compared with
the p53+/− animals (14). Notably, no such increase was
observed in otherwise genetically identical mice with the
p53+/R172P genotype, which reflects a less common
mutation observed in humans (17).
In the independently created set of mice featuring the R172H and
R270H (equivalent to human R273H) heterozygotic alleles in WT and
NULL backgrounds, no significant difference in survival time was
noted, but the spectrum of tumors differed depending on the
mutation. Also, an increased incidence of metastases was observed
in the p53+/R172H heterozygotes compared with the
p53+/− animals (16).
In other studies, transgenic mice were created using humanized p53
knock-in (HUPKI) alleles (18,19).
These animals bore homozygous R175H, R248W and R273H alleles. The
mice expressing all mutated p53 variants exhibited serious
impairment of DNA repair mechanisms, resulting in numerous
interchromosomal translocations, compared with p53−/−
mice. Whereas the p53 R175H and p53 R248W mice presented with a
more complex tumor spectrum than their p53−/−
counterparts, their overall survival time was not impacted. Using
the same HUPKI technology, another study reported on the
construction of p53 R248Q and G245S mice. The p53 G245S/- mice
revealed no significant phenotype changes, yet the p53 R248Q mice
(R248Q/- and R248Q/R248Q) suffered from accelerated tumor onset and
decreased survival times in comparison with the p53−/−
animals (20). In summary, whereas
the majority of in vivo studies utilizing transgenic mice
have reported changes in the tumor spectrum and onset time,
evidence for decreased survival time and increased metastasis is
limited. A number of studies conducted with cell lines, including
xenotransplantations into experimental animals, addressed changes
in the migratory and metastatic behavior of cells resulting from
the expression of mutated p53 with the range of proposed
explanatory mechanisms being very broad. Certain studies identified
the sequestration of tumor proteins p63 and/or p73 by mut-p53
(21-23), resulting in the derepression of
molecular pathways that support metastasis. The target molecules
and cellular processes include Rab coupling receptor-dependent
recycling of integrins and growth factor receptors (24), SMAD-mediated interference with the
transforming growth factor β pathway (25), nuclear transcription factor Y
(NF-Y)-mediated regulation of platelet-derived growth factor
receptor β (26) and tumor
suppressor microRNA (miRNA) let-7i (27). Other reported mechanisms involve
direct interactions between mut-p53 and a variety of transcription
factors, to include the co-recruitment of NF-Y and histone
acetyltransferase p300 with mut-p53 to the Ephrin-B2 promoter,
resulting in the enhancement of the epithelial-to-mesenchymal
transition (EMT) (28),
transcription factor ETS2-mediated upregulation of nucleotide
biosynthesis required for increased invasiveness (29), or early growth response 1-mediated
upregulation of myosin X, resulting in an increased invasiveness in
breast cancer (30). In addition
to the studies identifying molecular mediators of mut-p53
GOF-induced phenotypes, a number of studies exist that describe
broad changes in transcription profiles, constituting a base for
further research into the putative roles of differentially
expressed genes in evoking the GOF-induced phenotypes (31-33);
notably, even for a particular GOF mut-p53 (D281G) certain
mut-p53-induced changes in expression profiles are dependent on the
intactness of the p53 transactivation domain (31), whereas other are not (34). In addition, given the important
role that chemokines and their receptors serve in the dissemination
of tumor cells (35-37), it is not surprising that a number
of studies have reported changes in the bioactivity of chemokines
and/or their receptors in cells expressing mut-p53 (38-40)
[reviewed in (41)].
Whereas the majority of the published studies
demonstrate an increase in invasiveness following mut-p53
expression, certain studies have demonstrated a lack of change
(42) or even a decrease (43) in this characteristic in
mut-p53-expressing cells. Therefore, the present study tested
whether the expression of two tumor-derived mut-p53 variants in
breast cancer MDA-MB-231 and lung cancer H1299 cells leads to
changes in their migratory behavior and whether these changes are
dependent on p53 transactivation activity.
Materials and methods
Cell culture and genetic
modification
H1299 (cat. no. CRL-5803), H358 (cat. no CRL-5807)
and MDA-MB-231 (cat. no. HTB-26) cells were purchased from the
American Type Culture Collection (Manassas, VA, USA). All cell
culture media components were from Merck KGaA (Sigma-Aldrich; Merck
KGaA, Darmstadt, Germany). The H1299 and H358 cells were cultured
in RPMI base medium and the MDA-MB-231 cells were cultured in
Dulbecco’s modified Eagle’s medium. Both base media were
supplemented with 10% heat-inactivated fetal bovine serum (FBS),
100 U/ml penicillin and 0.1 mg/ml streptomycin. When the cells were
90% confluent, they were harvested by trypsinization and seeded at
10% confluence. Cells were incubated in 5% CO2
atmosphere at 37°C. For the stable expression of constructs in the
cells, the following plasmids (44) were a gift from Eric Campeau and
Paul Kaufman (Program in Gene Function and Expression, University
of Massachusetts Medical School, Worcester, MA, USA):
pENTR1A-no-ccDB, pENTR/pTER+, pLenti CMV TetR Blast,
pLenti CMV/TO Puro DEST, pLenti CMV/TO Hygro DEST, pLenti X2 Hygro
DEST and pLenti CMV Neo DEST. pMD2.G and psPAX2 were a gift from
Didier Trono (School of Life Sciences, Lausanne Federal Institute
of Technology, Lausanne, Switzerland). All the plasmids were
deposited by their respective researchers to Addgene, Inc.
(Cambridge, MA, USA) and obtained from there. The
tetracycline-responsive regulatory element (TetR) utilized in this
system is a repressor that, in the absence of tetracycline,
occupies the CMV/TO promoter, blocking transcription. Upon addition
of tetracycline or doxycycline (DOX), it dissociates from the
promoter, allowing gene expression. This results in a Tet-ON system
that includes a repressor rather than activator. A dsDNA fragment
encoding a short hairpin RNA (shRNA) directed against p53
(CCCCGACTCCAGTGGTAATCTACTTCAAGAGAGTA GATTACCACTGGAGTCTTTTT;
hairpin sequences in bold) was created by annealing complementary
oligonucleotides according to the protocol of the BLOCK-iT™ U6 RNAi
Entry Vector kit (Thermo Fisher Scientific, Inc., Waltham, MA,
USA). The resulting dsDNA fragment was amplified by PCR using
oligonucleotides (5′-GCAGATCTCCCCGACTCCAG TGG-3′ and
5′-CGAAGCTTAAAAAGACTCCAGTG-3′; restriction sites for PCR
digestion marked in bold) and Phusion high-fidelity DNA polymerase
(Thermo Fisher Scientific, Inc.). The resulting product was
column-purified (Clean-up kit; A&A Biotechnology, Gdynia,
Poland). Subsequently, the PCR product and pENTR/pTER+
plasmid were digested with BglII and HindIII
restriction enzymes, gel-purified (Gel-Out kit; A&A
Biotechnology), and ligated with T4 ligase. This resulted in the
creation of pENTR/pTER-shp53 cloning vector, which was then
recombined with pLenti X2 Hygro DEST using Gateway LR Clonase II
(Thermo Fisher Scientific, Inc.), as per the manufacturer’s
protocols, resulting in the pLenti X2 Hygro pTER-shp53 lentiviral
vector.
The open reading frames (ORFs) of FLAG-p53, enhanced
green fluorescent protein (EGFP) and tdTomato were PCR-cloned into
pENTR1A-no-ccDB and then moved to pLenti CMV/TO Puro, pLenti CMV/TO
Hygro DEST and pLenti CMV Neo DEST, respectively, using Gateway
cloning, as described above. Silent mutations were introduced into
the ORF of p53, making it resistant to silencing by the designed
shRNA. Point mutations causing resistance to shRNA directed against
endogenous p53 as well as amino acid changes L22S, W23Q, R248Q and
D281G were introduced by PCR amplification of the pENTR-1A-FLAG-p53
plasmid using Phusion high-fidelity DNA polymerase (Thermo Fisher
Scientific, Inc.) and mutagenic oligonucleotides, followed by
digestion of the non-mutated template DNA with DpnI
restriction endonuclease. The sequence targeted by the shRNA within
the endogenous p53 ORF was 775-GACTCCAGTGGTAATCTACT-794 (numbers
denote nucleotide positions in the p53 ORF without FLAG) with the
following silent mutations introduced into all p53 ORFs used for
regulated expression (bold and underlined):
775-GA(CTCGAG)CGGCAATCTACT-794. The amino
acid residue changes L22S-W23Q, R248Q and D281G were obtained by
introducing the following point mutations: 61-GACCTATGG-69 to
61-GATCAATCG-69 (L22S-W23Q),
742-CGG-744 to 742-CAG-744 (R248Q), and
832-CCTGGGAGAGAC-843 to 832-(CCCGGG)AGAGGC-843 (D281G).
Introduction of additional silent mutations in the shRNA and D281G
mutageneses allowed for restriction-based identification of mutated
p53 ORFs by XhoI and SmaI digestion, respectively.
The location of these newly created diagnostic restriction sites is
marked by the parentheses. The full sequences of the
oligonucleotides used for shRNA, L22S-W23Q, R248Q and D281G
mutageneses were 5′-ACAC TGGAAGACTCGA GCGGCAATCTACTGGGACG-3′,
5′-GGAAACATTTTCA GATCAATCGAAACTACTTCCT-3′, 5′-GCATGGGCGGCA
TGAACCAGAGGCCCATCCTCAC-3′ and
5′-GCCTGTCCCGGGAGAGGCCGGCGCACAGAGG-3′, respectively. The reaction
mix included 50 ng template (WT) plasmid, 0.2 mM dNTP mix, 0.2
µM each of the forward and reverse oligonucleotides and 2
units Phusion polymerase in 25 µl. Following an initial
denaturation at 98°C for 30 sec, 20 cycles of 98°C for 10 sec, 54°C
for 45 sec and 72°C for 75 sec, were completed, followed by a final
extension at 72°C for 10 min. The entire reaction was digested
overnight with DpnI to remove template DNA and 2 µl
were transformed into competent TOP10F’ bacteria (Thermo Fisher
Scientific, Inc.).
DNA minipreps of all the constructs were prepared
(Plasmid Mini AX kit; A&A Biotechnology) and commercially
sequenced (Genomed S.A., Warsaw, Poland) to verify the integrity of
the reading frames. The lentiviral particle preparation and target
cell transduction were performed according to a protocol developed
by Campeau et al (44).
Western blotting
Cells were harvested by scraping or trypsinization,
rinsed in PBS and lysed in radioimmunoprecipitation assay buffer
(Thermo Fisher Scientific, Inc.). The protein concentration was
measured by micro BCA (Thermo Fisher Scientific, Inc.) and 10-40
µg total protein per lane was separated in 8-12% SDS-PAGE.
The procedures for SDS-PAGE and blotting were performed according
to established protocols (45),
with nitrocellulose membranes (Pall Life Sciences, Port Washington,
NY, USA), and 3% skim milk (Bio-Rad Laboratories, Inc., Hercules,
CA, USA) in TBS-0.1% Tween as blocking and primary antibody
incubation solutions. The blots were incubated with the primary
antibodies at 4°C overnight and with the secondary antibodies at
room temperature for 1 h. The antibodies were used at dilutions of
1:500-1,000 unless otherwise indicated. Primary antibodies against
the following proteins were used: p53 (cat. no. sc-6243; 1:200
dilution), focal adhesion kinase (FAK; cat. no. sc-558; 1:200
dilution) (both from Santa Cruz Biotechnology, Inc., Dallas, TX,
USA), GAPDH (cat. no. 2118), phosphoinositide 3-kinase (PI3K; cat.
no. 4292), myosin light chain 2 (MLC2; cat. no. 8505),
phosphorylated (p-)MLC2 (S19; cat. no. 3671), Ras homolog family
member A (RhoA; cat. no. 2117), zinc finger protein SNAI1 (cat. no.
3879), zinc finger protein SNAI2 (SLUG; cat. no. 9585), Vimentin
(cat. no. 5741), p-protein kinase B (AKT; S473; cat. no. 4060),
β-catenin (cat. no. 8480), E-cadherin (cat. no. 3195), N-cadherin
(cat. no. 13116), Rho-associated protein kinase 1 (ROCK1; cat. no.
4035), zinc finger E-box-binding homeobox 1 (TCF8/ZEB1; cat. no.
3396), p-mitogen-activated protein kinases 3/1 (ERK1/2; T202/Y204;
cat. no. 4370) (all from Cell Signaling Technology, Inc., Danvers,
MA, USA), AKT (cat. no. ADI-KAP-PK004), ERK1/2 (cat. no.
ADI-KAP-MA001) (both Enzo Life Sciences, Inc., Farmingdale, NY,
USA) and C-X-C chemokine receptor type 4 (cat. no. SAB3500383;
Sigma-Aldrich; Merck KGaA). The secondary antibodies used were
IRDye 680LT donkey anti-mouse IgG, IRDye 800CW donkey anti-mouse
IgG, IRDye 680LT donkey anti-rabbit IgG and IRDye 800CW donkey
anti-rabbit IgG (cat. nos. 926-68072, 926-32212, 926-68023 and
926-32213, respectively; LI-COR Biosciences, Lincoln, NE, USA);
antibodies were diluted at 1:10,000 in 3% skimmed milk in TBS-0.1%
Tween. The blots were scanned in an Odyssey infrared scanner
(LI-COR Biosciences).
Flow cytometry
The EGFP expression in cells was assayed by
analyzing cell suspensions in a BD FACSCalibur flow cytometer (BD
Biosciences, San Jose, CA, USA). The data analysis was performed
using FCS Express 4 Flow Cytometry software version 4.07.0005 (De
Novo Software, Glendale, CA, USA).
Migration and invasion assays
For the 2-dimension (2D) migration assay (wound
healing) an ORIS kit (Platypus Technologies, LLC, Madison, WI, USA)
was used. The cells were seeded into 96-well plates with ORIS
silicone stoppers inserted. The stoppers adhere tightly to the
bottom of the well, creating a 2-mm diameter circular cell-free
zone. The H1299 and MDA-MB-231 cells were seeded at
1×10⁵ and 1.5×10⁵ cells/cm2,
respectively. At the time of seeding the cells were treated with 30
ng/ml DOX or vehicle (control). At 24 h (H1299) or 48 h
(MDA-MB-231) after seeding, when the cells reached confluence, the
pre-migration images were captured. The stoppers were then removed,
free-floating cells were washed away, and the cells were allowed to
migrate into the free space in the center of the well. After 24 h
the cells were fixed and the post-migration images were captured.
Based on the difference in diameter between the pre- and
post-migration opening, the migration speed was calculated and for
each cell line the relative difference in speed attributable to DOX
treatment was calculated. For the extracellular matrix (ECM)-free
migration, the xCELLigence Real-Time Cell Analyzer (Acea
Biosciences, Inc., San Diego, CA, USA) was used with cell
invasion/migration plates (46).
The device measures the number of migrated cells based on changes
in electric resistance, thus obviating the need for microscopic
analysis and enabling live monitoring of migration. H1299 and
MDA-MB-231 cells were seeded at 60,000 and 90,000 per well,
respectively. Alternatively, for the Matrigel invasion assay, the
ice-cold chambers were assembled with 10% FBS in culture medium as
a chemoattractant in the lower chamber and 35 µl Matrigel
diluted to 0.33 mg/ml in ice-cold culture medium with 0.2% FBS was
added. The chambers were incubated for ≥4 h at 37°C to allow for
Matrigel solidification and then the H1299 or MDA-MB-231 cells,
pretreated with 30 ng/ml DOX for 48 h, were added on top of the
gel. The chambers were placed in the xCELLigence Real-Time Cell
Analyzer and scanned every 15 min for ≤96 h. The invasiveness was
defined as the ratio of the number of cells migrating through the
Matrigel to those migrating without Matrigel.
Microsphere matrix invasion assay
For the microsphere collagen I invasion assay,
U-bottom 96-well plates were coated with poly-hydroxyethyl
methacrylate (HEMA; Sigma-Aldrich; Merck KGaA). Briefly, 50
µl poly-HEMA (5 mg/ml) in 96% ethanol was added to each
U-bottom well and the plates were left to dry in a 37°C incubator.
When dry, the plates were sterilized under ultraviolet light and
the H1299 or MDA-MB-231 cells (5,000 cells per well), with or
without 30 ng/ml DOX, were seeded. The plates were immediately
centrifuged for 3 min at 1,000 × g at room temperature to
concentrate the cells in the center of each well. After 48 h the
cells formed compact spheres. The plates were then placed on ice,
50 µl culture medium was removed, and 50 µl ice-cold
neutralized 1 mg/ml rat tail collagen I (Corning Inc., Corning, NY,
USA) in regular culture medium was added, at a final concentration
of 0.5 mg/ml. The plate was gently vortexed to mix the collagen
with medium, and centrifuged for 15 min at 200 × g at room
temperature in order to re-center the spheres and prevent sphere
flotation. Following the centrifugation the collagen had formed a
gel. The plates were placed in the 37°C incubator for 1 h to
complete the gel formation and 100 µl culture medium was
added on top of the gel. At this point the plates were imaged in an
automated wide-field fluorescence Olympus ScanR microscope (Olympus
Corporation, Tokyo, Japan) using 5× objective and intrinsic cell
tdTomato fluorescence. Subsequently, the spheres were imaged every
24 h for the following 3 days. The image set was manually curated
to remove out-of-focus and otherwise unsuitable images and then
processed using ImageJ software version 1.51U (National Institutes
of Health, Bethesda, MD, USA). All the images were auto-thresholded
and the objects were counted and measured. For the 1 day
post-embedding (dpe) circularity assay the circularity parameter
was calculated for the largest object. The relative circularity was
obtained by dividing the circularity of the DOX-treated cells by
that of the non-treated cells and normalizing to the reference cell
line level (H1299-TR or MDA-MB-231-SH). Therefore, a relative
circularity <1 indicates less round microspheres (and a more
invasive phenotype) than in the reference cell line. Similarly, the
relative number of cells (NOC) separated from the microsphere was
obtaining from dividing the number of the small objects (cells)
that separated from the sphere at 2 dpe in the DOX-treated group by
the same parameter in non-treated cells and relating all the ratios
to the reference cell line ratio. Therefore, a relative NOC >1
indicates a more invasive phenotype than in the reference cell
line.
Adhesion assay
A culture plate-based assay was performed by
aliquoting 50 µl culture medium containing 20,000 H1299 or
30,000 MDA-MB-231 cells with variants of p53, with or without
pretreatment with 30 ng/ml DOX, into the wells of a 96-well plate.
All the media and plastics were pre-warmed to 37°C. Following
incubation in the cell culture incubator for 15, 30, 60 min or 20
h, the wells were gently rinsed 3 times with pre-warmed PBS, and
the remaining adhered cells were fixed with ice-cold 3.7%
formaldehyde in PBS. After 15 min the formaldehyde was replaced by
PBS and the plates were stored in the fridge. When all time-points
had been completed, the cells were stained with 1:10,000 GelGreen
(Biotium, Inc., Freemont, CA, USA) in PBS with 0.05% Triton X-100
for 1 h at room temperature (Sigma-Aldrich; Merck KGaA), and imaged
using an automated Olympus ScanR microscope with a 5× objective.
The nuclei were counted and the number of nuclei for each cell
line/DOX treatment combination for each time-point was normalized
to the equivalent 20 h time-point that reflected 100% adhesion.
This normalization accounted for the variability of input cell
suspensions. For each cell line and time-point, the fraction of
adhered cells in the DOX-treated population was then divided by
that in the non-treated population and the fold-change resulting
from DOX treatment was calculated.
Zebrafish (Danio rerio)
xenotransplantation
MDA-MB-231-SH, -R248Q and -R248Q-TA cells were
treated with 30 ng/ml DOX for 48 h, harvested by trypsinization,
washed twice with PBS and resuspended in PBS with 2%
polyvinylpyrrolidone 40 (Sigma-Aldrich; Merck KGaA) to prevent
clumping. The cell suspension was then loaded into a home-pulled
glass needle and microinjected into the common cardinal vein of a
2-days post fertilization (dpf) dechorionated Casper Tg(fli1:EGFP)
embryo according to a published protocol (47), using a PicoPump PV820 microinjector
(World Precision Instruments, Sarasota, FL, USA) at ca. 20 PSI and
a 100-200 msec injection time. Following the injection, the fish
larvae were kept at 32°C for the remainder of the experiment. Since
the fish have green fluorescent vasculature and the cells express
the red fluorescent tdTomato protein, they could be imaged directly
under a fluorescence stereoscope for ≤3 days post-injection,
following which the embryos were euthanized.
Statistical analysis
The data regarding the age of tumor onset in
relation to p53 mutations were analyzed with a Mann-Whitney test
due to non-normal distribution. The data regarding metastasis and
primary tumor site characteristics were analyzed by pairwise
χ2 analysis. The P-values obtained from these analyses
were corrected for a false discovery ratio of 0.1 with the
Benjamini-Hochberg method. In the comparison of patient groups with
statistically significant differences in metastasis frequency with
the NULL group (MIS and R248Q), the odds ratios and 95% confidence
intervals were calculated using pairwise χ2 analysis.
The tumor-free survival rate analysis was performed with a log-rank
test. The cell migration, invasion and circularity results were
analyzed with one-way analysis of variance (ANOVA) followed by a
Sidak post-hoc test. The results of the adhesion assay were
analyzed by two-way ANOVA with Dunnett’s post-hoc test for
comparisons against the reference cell line and with a Sidak
post-hoc test for the remaining comparisons. The
xenotransplantation data were analyzed by pairwise χ2
analysis. The P-values obtained from this analysis were corrected
for a false discovery ratio of 0.1 with the Benjamini-Hochberg
method. The Benjamini-Hochberg corrections were performed in R
statistical software (version 3.5.0; www.R-project.org) with the use of the p.adjust
function. All other analyses were performed using GraphPad Prism
(version 6.07; GraphPad Software, Inc., La Jolla, CA, USA).
P<0.05 and Q<0.1 (Benjamini-Hochberg method) were considered
to indicate statistical significance.
Results
Missense mutations in TP53 change tumor
onset, spectrum and metastatic behavior
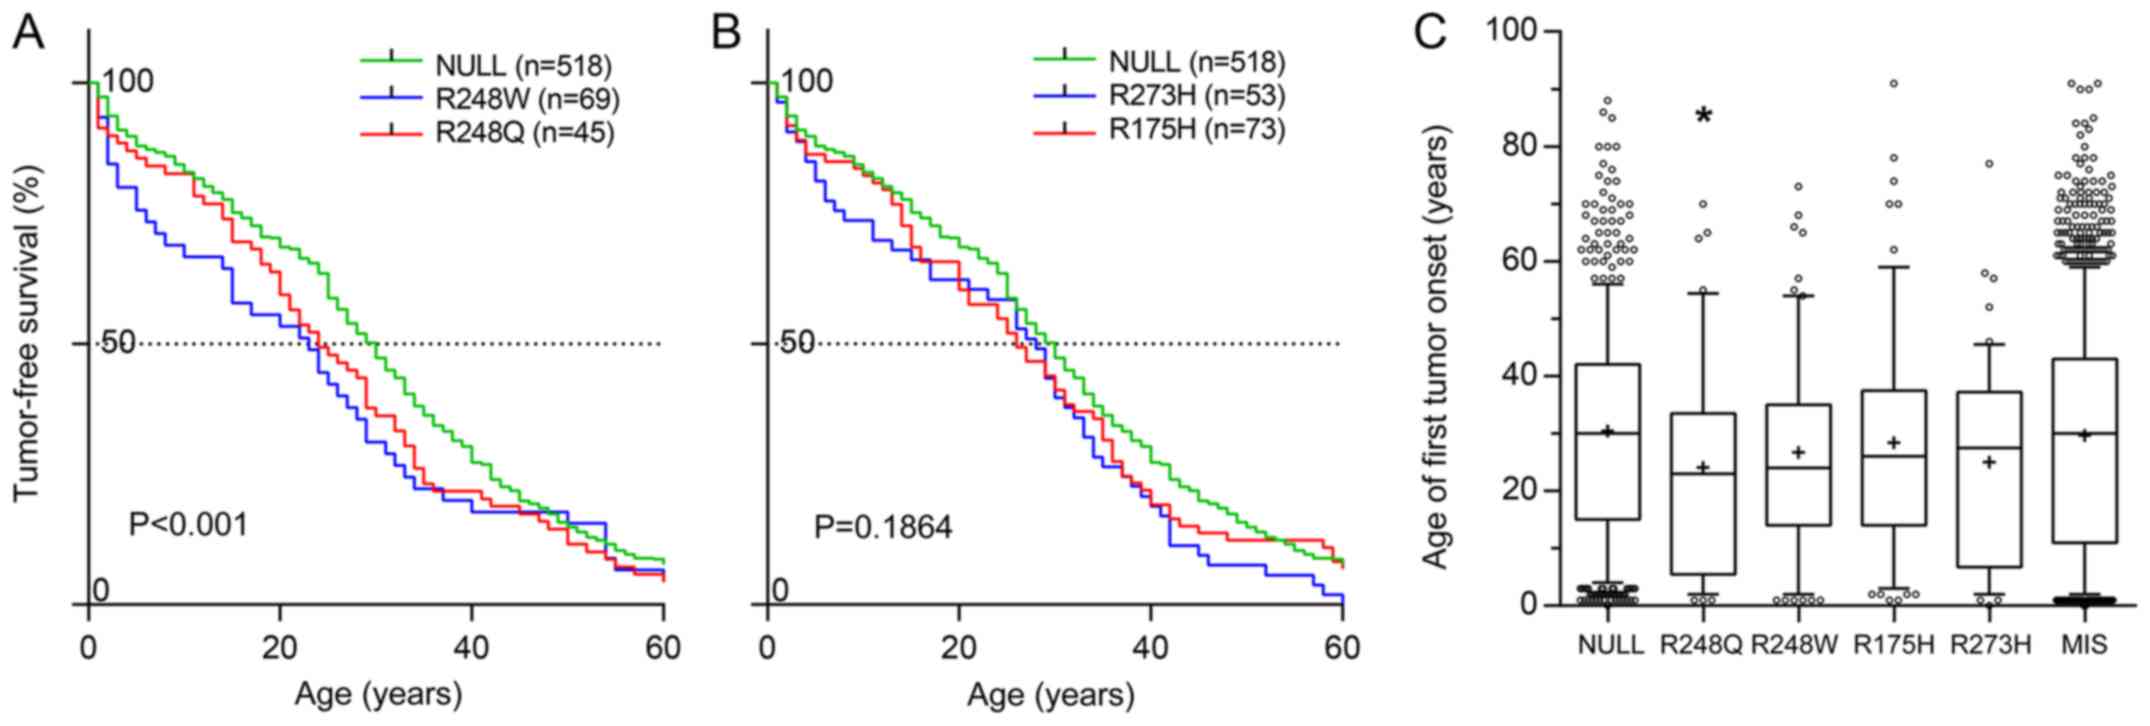
An analysis of clinical phenotypes concerning tumor
onset, primary location and metastasis frequency and tropism, based
on the latest release of the International Agency for Research on
Cancer (IARC) p53 database (Release 18; http://p53.iarc.fr/), containing data on >30,000
patients with tumors with somatic or germline mutations in their
TP53 genes (48), revealed
that patients bearing the R248Q, but no other ‘hot-spot’ mutation,
experienced significantly earlier onset of their first tumors than
those bearing a NULL allele (Fig.
1A-C; Table I). The
distribution of the primary tumor sites between patients with
various somatic mutations and certain germline mutations also
differed significantly from that in patients with the NULL allele
(Tables IITable III-IV). Notably, in patients with somatic
missense TP53 mutations, metastasis was observed less
frequently than in patients with NULL alleles (Table V), with an even more pronounced
decrease in patients with R248Q. Amongst the patients with
metastases from two large datasets, IARC and the Memorial Sloan
Kettering Cancer Centre (MSKCC) (49), differences were observed in the
distribution of metastatic sites in patients with certain GOF
mutations (Tables VI and VII). When patients bearing the
mutations R175H, R248Q, R248W and R273H were pooled, the difference
between them and the NULL group were marked (IARC dataset,
P=0.0016; MSKCC dataset, P=0.0071).
 | Table IMedian patient age at first tumor
onset. |
Table I
Median patient age at first tumor
onset.
| p53 mutation | No. patients | Median age,
years | P-value | Q |
|---|
| NULL | 519 | 30.0 | - | - |
| MIS | 1276 | 30.0 | 0.3801 | 0.3801 |
| R248Q | 45 | 23.0a | 0.0171 | 0.0855 |
| R248W | 69 | 24.0 | 0.0915 | 0.1525 |
| R175H | 73 | 26.0 | 0.2468 | 0.3085 |
| R273H | 54 | 27.5 | 0.0717 | 0.1525 |
| Table IIDistribution of primary tumor sites
in patients with somatic TP53 mutations. |
Table II
Distribution of primary tumor sites
in patients with somatic TP53 mutations.
| p53 mutation | Colon, n | Lung, n | Breast, n | Ovary, n | Brain, n | Esophagus, n | Bladder, n | Other, n | P-valuea | Q |
|---|
| NULL | 548 | 686 | 749 | 596 | 221 | 464 | 242 | 2333 | - | - |
| MIS | 2326 | 2307 | 2304 | 1632 | 1542 | 1423 | 1159 | 9114 | < 0.0001 | 0.0001 |
| R248Q | 159 | 37 | 113 | 54 | 75 | 49 | 53 | 415 | < 0.0001 | 0.0001 |
| R248W | 147 | 47 | 84 | 58 | 57 | 60 | 25 | 292 | < 0.0001 | 0.0001 |
| R175H | 290 | 37 | 131 | 107 | 107 | 99 | 38 | 412 | < 0.0001 | 0.0001 |
| R273H | 165 | 54 | 98 | 94 | 80 | 47 | 21 | 304 | < 0.0001 | 0.0001 |
| Table IIIDistribution of primary tumor sites
in patients with germline TP53 mutations. |
Table III
Distribution of primary tumor sites
in patients with germline TP53 mutations.
| p53 mutation | Breast, n | Brain, n | Soft tissues,
n | Adrenal gland,
n | Bone, n | Other, n | P-value | Q |
|---|
| NULL | 225 | 70 | 115 | 31 | 70 | 255 | - | - |
| MISa | 492 | 290 | 187 | 185 | 137 | 719 | <0.0001 | 0.0003 |
| R248Qa | 18 | 18 | 10 | 2 | 8 | 27 | 0.0161 | 0.0268 |
| R248Wa | 33 | 29 | 7 | 7 | 6 | 30 | <0.0001 | 0.0003 |
| R175H | 29 | 22 | 15 | 5 | 9 | 38 | 0.0654 | 0.0818 |
| R273H | 22 | 10 | 17 | 5 | 9 | 24 | 0.6412 | 0.6412 |
| Table IVDistribution of primary tumor types
in patients with germline TP53 mutations. |
Table IV
Distribution of primary tumor types
in patients with germline TP53 mutations.
| p53 mutation | Sarcoma, n | Carcinoma, n | Other, n | P-value | Q |
|---|
| NULL | 190 | 97 | 479 | - | - |
| MISa | 364 | 380 | 1266 | <0.0001 | 0.0005 |
| R248Q | 21 | 7 | 55 | 0.5308 | 0.6635 |
| R248Wa | 16 | 19 | 77 | 0.0374 | 0.0623 |
| R175H | 27 | 14 | 77 | 0.8494 | 0.8494 |
| R273Ha | 29 | 17 | 41 | 0.0181 | 0.0453 |
| Table VFrequency of metastasis in patients
with somatic TP53 mutations. |
Table V
Frequency of metastasis in patients
with somatic TP53 mutations.
| p53 mutation | M1 | M0 | P-value | Q | OR (95% CI) | % M1 |
|---|
| NULL | 200 | 3649 | - | - | - | 5.2 |
| MISa | 499 | 13242 | <0.0001 | 0.0005 | 0.6875
(0.5811-0.8134) | 3.6 |
| R248Qa | 18 | 561 | 0.0393 | 0.0983 | 0.5854
(0.3584-0.9561) | 3.1 |
| R248W | 23 | 484 | 0.5987 | 0.9267 | - | 4.5 |
| R175H | 41 | 772 | 0.9267 | 0.9267 | - | 5.0 |
| R273H | 29 | 487 | 0.7638 | 0.9267 | - | 5.6 |
| Table VIDistribution of metastasis location
sites in patients with somatic TP53 mutations from the
International Agency for Research on Cancer database. |
Table VI
Distribution of metastasis location
sites in patients with somatic TP53 mutations from the
International Agency for Research on Cancer database.
| p53 mutation | Liver, n | Lymph node, n | Other, n | P-value | Q |
|---|
| NULL | 82 | 36 | 82 | - | - |
| MISa | 226 | 114 | 159 | 0.0603 | 0.0905 |
| R248Q | 9 | 3 | 6 | 0.7493 | 0.7493 |
| R248W | 11 | 6 | 6 | 0.3483 | 0.4180 |
| R175Ha | 27 | 3 | 11 | 0.0122 | 0.0244 |
| R273Ha | 22 | 2 | 5 | 0.002 | 0.0060 |
| 3-GENEa | 69 | 14 | 28 | 0.0016 | 0.0060 |
| Table VIIDistribution of metastasis location
sites in patients with somatic TP53 mutations from the
Memorial Sloan Kettering Cancer Center database. |
Table VII
Distribution of metastasis location
sites in patients with somatic TP53 mutations from the
Memorial Sloan Kettering Cancer Center database.
| p53 mutation | Liver, n | Lymph node, n | Lung, n | Bone, n | Brain, n | Other, n | Versus NULL group
| Versus WT group
|
|---|
| P-value | Q | P-value | Q |
|---|
| WTa | 482 | 506 | 350 | 213 | 76 | 975 | <0.0001 | 0.0007 | - | - |
| MISSb | 389 | 264 | 141 | 75 | 57 | 465 | 0.7006 | 0.7006 | <0.0001 | 0.0001 |
| NULLb | 231 | 158 | 97 | 41 | 43 | 266 | - | - | <0.0001 | 0.0001 |
| R248Qb | 18 | 11 | 2 | 4 | 3 | 31 | 0.1411 | 0.1768 | 0.0728 | 0.0849 |
| R248Wb | 22 | 5 | 3 | 1 | 3 | 13 | 0.0899 | 0.1573 | <0.0001 | 0.0001 |
| R175Hb | 36 | 10 | 5 | 3 | 4 | 28 | 0.0633 | 0.1477 | <0.0001 | 0.0001 |
| R273H | 13 | 11 | 5 | 0 | 1 | 26 | 0.1515 | 0.1768 | 0.1871 | 0.1871 |
| 3-GENEa,b | 89 | 37 | 15 | 8 | 11 | 98 | 0.0071 | 0.0249 | <0.0001 | 0.0001 |
Breast cancer is one of the most prevalent types of
cancer, and the presence of metastasis either at the initial
presentation of the patient or following the initial round of
therapy is a poor prognostic marker. The present findings suggest
that certain classes of mutations in the TP53 gene are
associated with lower metastasis rates in patients. Therefore, the
influence of the expression of certain mutated p53 variants was
investigated in MDA-MB-231, a cell line commonly used as a model in
breast cancer metastasis studies, and in lung adenocarcinoma H1299
cells, which do not express p53 and are an established model in
studies on p53.
Construction and validation of cell lines
with inducible p53 expression
In order to test the effects of short-term
expression of mutant p53 on cellular migration and invasion, cell
lines with inducible expression of the transgenes were constructed.
H1299 and MDA-MB-231 cells were transduced with lentivirus encoding
the tetracycline repressor (TR) and selected with blasticidin. To
facilitate observation in downstream applications, the cells were
also transduced with lentivirus encoding the tdTomato protein and
selected by G418 until the population exhibited uniform red
fluorescence. These cell lines were called TR and used as the
common parent for all subsequently created cell lines. The TR cell
lines were subsequently transduced with lentivirus encoding
tetracycline-inducible GFP and selected with hygromycin. At this
stage only single GFP-expressing cells could be observed in the
absence of DOX. In order to test the inducibility and dynamic range
of the Tet-ON system, the cells were seeded into a 96-well plate
and, after 24 h of culture, induced with a range of DOX
concentrations. After 24 h, the total cellular GFP fluorescence was
measured using a multiwell spectrofluorimeter (Fig. 2A). The half maximal effective
concentration (EC50) for 24-h DOX induction of GFP
expression was estimated at 11.4 and 17.8 ng/ml in H1299 and
MDA-MB-231 cells, respectively, with negligible p53 expression in
the absence of DOX. In order to characterize the populations in
more detail, the cells were seeded into a 12-well plate for 24 h
and induced with a range of DOX concentrations. After 24 and 48 h,
the green fluorescence was measured in arbitrary fluorescence units
(AFU) using a flow cytometer. The parameters measured were the
percentage of cell population that was GFP-positive and the median
fluorescence intensity of the GFP-positive cells (Fig. 2B and C). At a moderately low DOX
concentration of 25-35 ng/ml nearly 100% of cells were GFP-positive
after 24 h with almost no further increase after 48 h (Fig. 2B). Meanwhile, the median intensity
of fluorescence of GFP-positive cells continued to grow and during
the following 24 h increased almost 2-fold in the MDA-MB-231 cells
(348-633 AFU), and >2-fold in the H1299 cells (492-1,219 AFU)
(Fig. 2C). The DOX EC50
for all the FACS-measured parameters was in the range of 5.5-9.5
ng/ml.
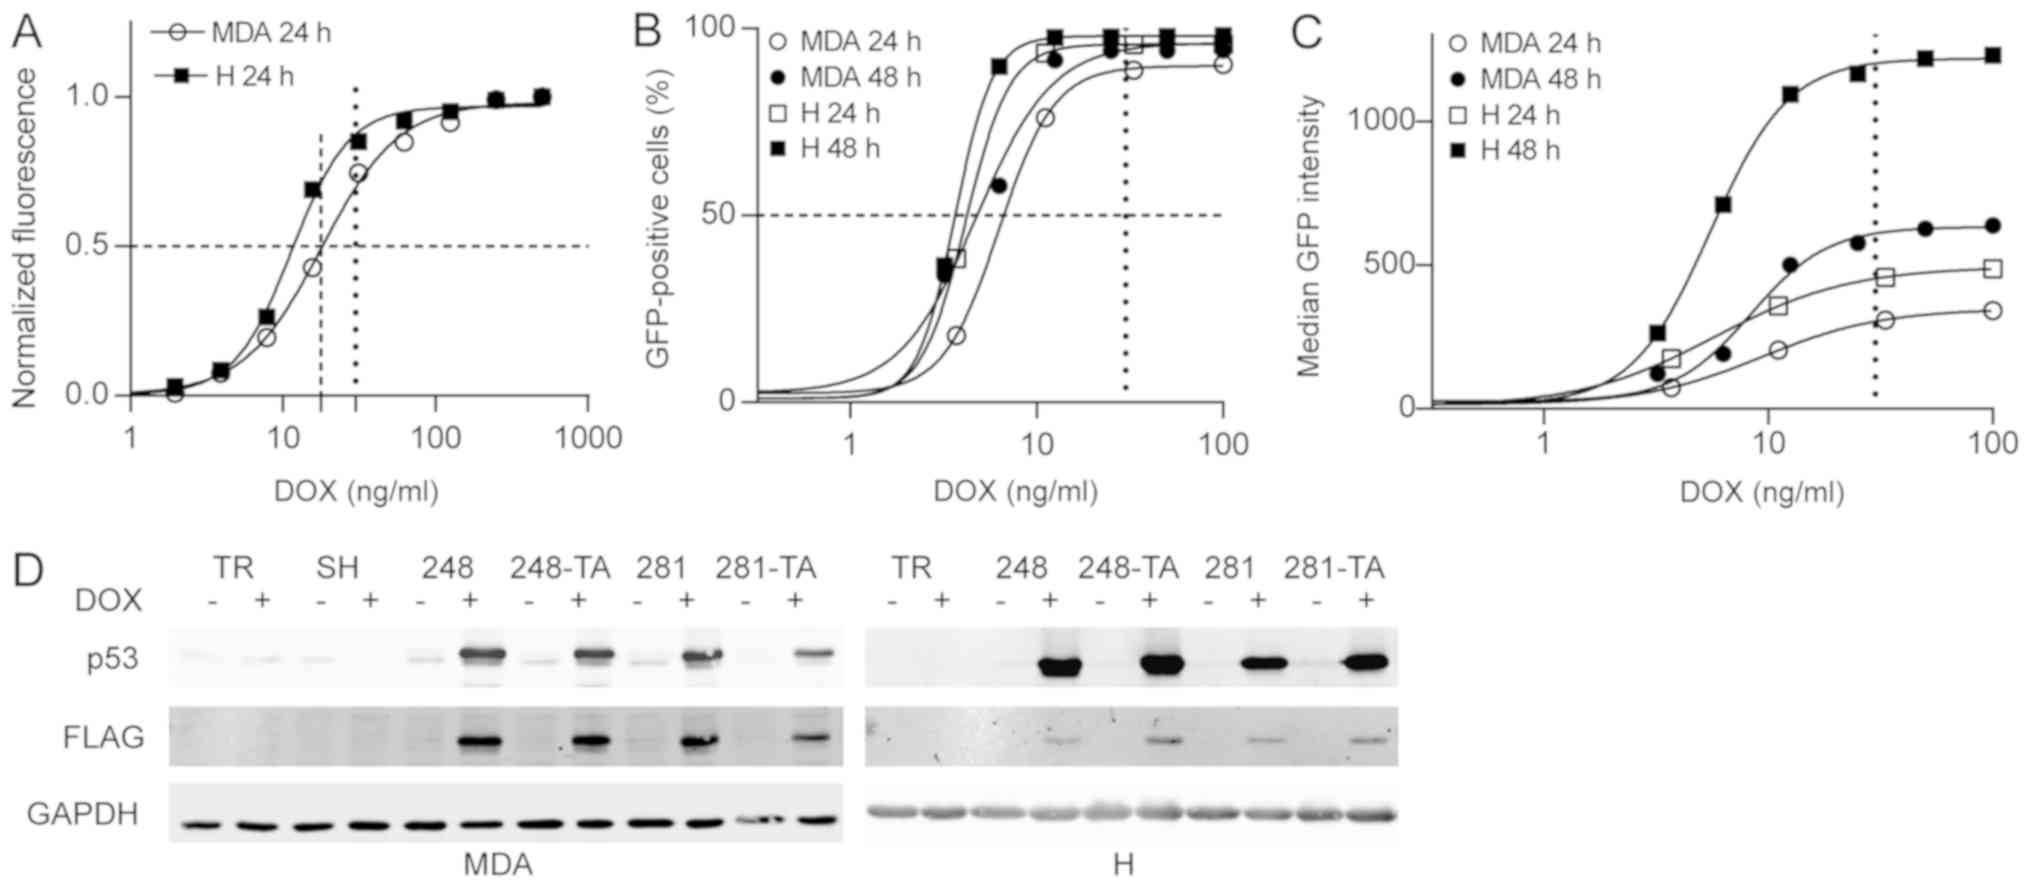 | Figure 2DOX-induced EGFP and p53 expression
in MDA-MB-231 and H1299 cells. (A) The EGFP expression in MDA-TR
and H-TR cells induced with 30 ng/ml DOX for 24 h was measured by
multiwell spectrofluorimetry. Total fluorescence from 96-well plate
wells was measured, obtained data were fitted to a sigmoidal
four-parameter curve and the calculated half maximal effective
concentrations for DOX were 17.8 ng/ml for MDA and 11.4 ng/ml for H
cells. (B and C) The EGFP expression in MDA-TR and H-TR cells
induced with 30 ng/ml DOX for 24 and 48 h was also measured by flow
cytometry and (B) the percentage of cells that were EGFP-positive
and (C) the median EGFP intensity were plotted. The vertical dotted
line indicates the 30 ng/ml DOX concentration used in subsequent
experiments. The dashed lines indicate 50% of the normalized
phenotype intensity. (D) Western blot analysis of the p53
expression in indicated MDA and H cells treated with 30 ng/ml DOX
for 48 and 24 h, respectively. The protein expression visualized
using anti-p53 and anti-FLAG antibodies in parallel, which were
detected in separate fluorescence channels. Faint bands in the
MDA-TR lanes and other non-DOX-induced lanes represent endogenous
p53 R280K variants. DOX, doxycycline; EGFP, enhanced green
fluorescent protein; p53, tumor suppressor p53; MDA, MDA-MB-231; H,
H1299; TR, cells with Tet repressor only; SH, cells with silenced
endogenous p53; TA, transactivatory domain disruption (L22S/W23Q)
in addition to indicated mutation (R248Q or D281G). |
As the tightness and inducibility of the TR system
were evaluated, further genetic modifications were performed on the
cells. The H1299-TR cells were transduced with a range of
lentiviral vectors encoding for the following variants of
N-terminally FLAG-tagged p53: WT, R248Q, L22S-W23Q-R248Q, D281G and
L22S-W23Q-D281G. The cells were selected with puromycin. The
MDA-MB-231 cells that endogenously expressed R280K were first
transduced with a lentivirus that expressed p53-directed shRNA
under a Tet-inducible promoter. Following selection with
hygromycin, this cell line was called SH and was used as a parent
cell line for the construction of all subsequent p53-expressing
MDA-MB-231-based cell lines. The MDA-MB-231-SH cells were
transduced with a range of lentiviral vectors encoding the
following variants of N-terminally FLAG-tagged p53: WT, R248Q,
L22S-W23Q-R248Q, D281G and L22S-W23Q-D281G. The mutations L22S and
W23Q are located within the transactivation domain of p53 and are
known to abolish its function as a TA (50,51).
Therefore, cell lines expressing p53 with disruption in this domain
are referenced to as TA (i.e. L22S-W23Q-R248Q as R248Q-TA, and
L22S-W23Q-D281G as D281G-TA). In addition, a number of silent
mutations were introduced into the p53 ORF in order to make the
transgene resistant to the shRNA silencing of the endogenous
TP53 gene in the MDA-MB-231 cells. The cells were selected
with puromycin. The tightness and inducibility of the system with
regard to exogenous p53 were tested by western blotting following
treatment with 30 ng/ml DOX. The results confirmed that there was
no p53 expression in the absence of induction, and that the
endogenous p53 in the MDA-MB-231 cells was effectively silenced
(Fig. 2D).
Cell lines expressing WT p53 were constructed in
order to test the functionality of downstream response pathways,
but were not intended for use in the migration studies. Indeed, the
induction of WT p53 expression led to significant toxicity in the
cells, exerting cytostatic and cytotoxic effects after 24 and 48 h
of expression, respectively (data not shown). Based on the p53
mutation prevalence in breast and lung cancer, as well as on the
phenotypes reported in the literature (33,44),
a set of cell lines was selected for use in further migration
studies. These included cells with R248Q, R248Q-TA, D281G and
D281G-TA. In the MDA-MB-231 cells, the SH-only cell line was used
as a NULL variant, enabling the identification of GOF p53
phenotypes.
Expression of mutated p53 influences the
migration, invasion and adhesion properties of cancer cells
In order to test whether the selected p53 mutations
exhibit a GOF phenotype with regard to cellular migration in H1299
and MDA-MB-231 cells, the migration speed was calculated and the
data are presented in Fig. 3A. In
the H1299 cells, the expression of the R248Q mutant significantly
decreased the migration speed, in a transactivation-dependent
manner (R248Q-TA). The expression of the p53 D281G variant
significantly increased the migration speed. This increase was
significantly, but not completely, countered by a mutation in the
transactivation domain (D281G-TA). Since GOF p53 phenotypes were
investigated, the MDA-MB-231-SH cell line (with silenced endogenous
p53 R280K) was used as a reference (Fig. 2D). The expression of the R248Q
variant significantly decreased the migration speed, in a
transactivation-dependent manner. The expression of the D281G or
D281G-TA variants resulted in no significant changes in the
migration speed compared with SH cells. These results demonstrated
that in the tested cell lines the expression of the p53 R248Q
mutant led to decreased migration speed, and that this decrease
depended on the functionality of the transactivation domain.
Furthermore, the expression of the D281G variant increased the
migration speed, but only in the H1299 cells, and this increase was
partly dependent on the functionality of the p53 transactivation
domain.
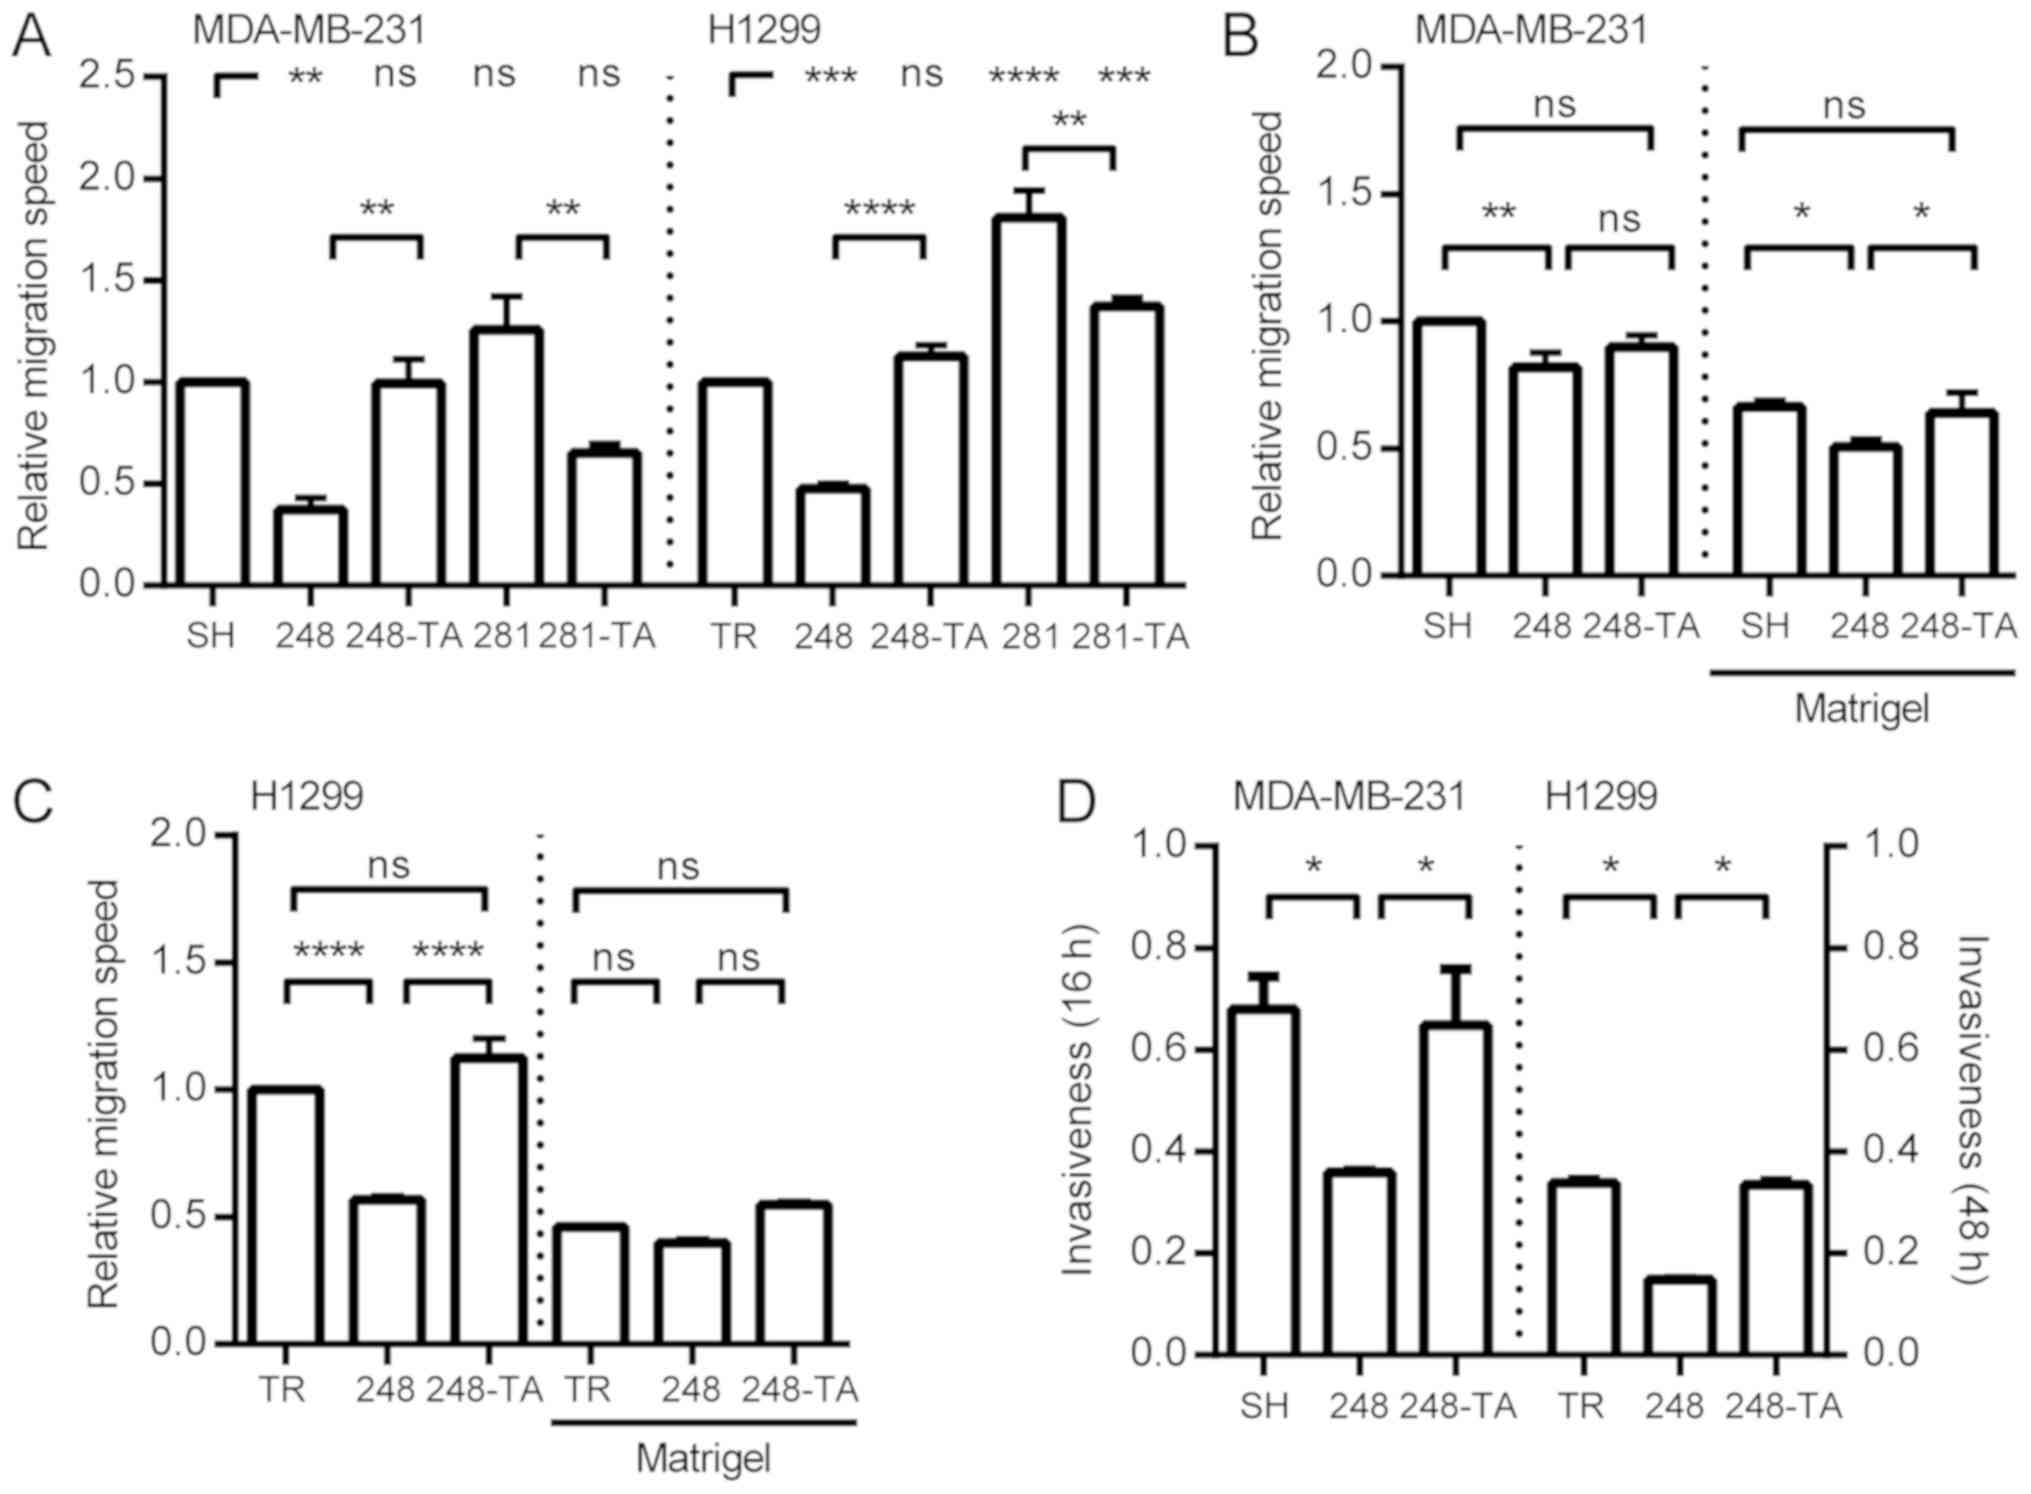 | Figure 3Expression of mutated p53 influences
the migration and invasiveness of cancer cells. (A) MDA-MB-231 and
H1299 cells with indicated p53 variants were seeded into wells with
ORIS stoppers and, where applicable, induced with 30 ng/ml DOX.
After 48 h (MDA-MB-231) or 24 h (H1299) the stoppers were removed
(t=0). The relative migration speed for each cell type was
calculated by dividing the speed of the DOX-induced cells by the
speed of non-induced cells and normalizing to the value obtained
for the SH or TR cells, respectively. The migration speed with and
without Matrigel was measured by xCELLigence for (B) MDA-MB-231 and
(C) H1299 cells expressing the indicated p53 mutants. The migration
speed values are normalized to the speed of MDA-MB-231-SH or
H1299-TR cells without Matrigel. (D) The invasiveness (relative
migration with vs. without Matrigel) was measured for MDA-MB-231 or
H1299 cells expressing various p53 mutants at 16 or 48 h,
respectively. The data are presented as the mean ± standard error
of the mean. *P<0.05, **P<0.01,
***P<0.001 and ****P<0.0001. p53, tumor suppressor
p53; DOX, doxycycline; ns, not significant; TR, cells with Tet
repressor only; SH, cells with silenced endogenous p53; TA,
transactivatory domain disruption (L22S/W23Q) in addition to
indicated mutation (R248Q or D281G). |
Since the migration speed of the MDA-MB-231 and
H1299 cells was only significantly affected by the expression of
p53-R248Q and p53-R248Q-TA, these cell lines were selected for
further analysis concerning ECM invasiveness. Based on the
migration curves, migration half-times were calculated and their
reciprocals are presented in Fig. 3B
and C. Regardless of the presence of Matrigel, the expression
of p53-R248Q in MDA-MB-231 cells significantly decreased the
migration speed. In the p53-R248Q-TA-expressing MDA-MB-231 cells,
the migration speed in the absence of Matrigel did not
significantly differ from either SH cells or cells with R248Q. When
the R248Q-TA cells were migrating through Matrigel their ability to
do so was significantly higher than that of cells with R248Q, and
no significant difference was observed compared with that of the SH
cells (Fig. 3B). For the H1299
cells (Fig. 3C) in the absence of
Matrigel, the expression of R248Q decreased the migration speed
significantly in a transactivation-dependent manner. When the cells
were migrating through the Matrigel no significant difference was
observed between the H1299-TR and H1299-R248Q cells. In order to
present the data in a manner compatible with the traditional
Transwell assay, the‘invasiveness’ parameter was calculated; it was
defined as the ratio of the NOC that migrated through the Matrigel
to that migrated without Matrigel. The read-out time-points (48 h
for H1299 and 16 h for MDA-MB-231 cells) were selected at the time
when the cells without Matrigel were completing their migration.
The data are presented in Fig. 3D.
The MDA-MB-231 and H1299 cells were less invasive upon expression
of the R248Q mutant and this decrease was
transactivation-dependent.
In order to analyze the ECM invasion ability in a
qualitative and quantitative manner, a model was used whereby
cellular microspheres were formed and embedded in collagen I. The
microsphere formation was conducted concurrently with the induction
of p53 for 48 h. Subsequently, the cells were embedded in 0.5 mg/ml
collagen I, imaged immediately and every 24 h. The parameters
measured include the microsphere circularity and NOC that separated
from the main microsphere. The circularity decreases when cells
make local infiltrations of the matrix without separating from the
microsphere; the NOC is a reflection of a metastatic phenotype. For
each cell line, any change in these parameters resulting from the
addition of DOX was calculated and normalized to the change in the
reference line: SH and TR for MDA-MB-231 and H1299, respectively
(Fig. 4A). Notably, the expression
of the R248Q variant led to a significant decrease in NOC, which
was dependent on p53 transactivation activity. Even though no
difference in microsphere circularity was observed between the
reference and R248Q cells, a visible, yet difficult to quantify,
change in cellular phenotype was observed in MDA-MB-231-R248Q (but
not in MDA-MB-231-R248Q-TA) cells following treatment with DOX
(Fig. 4B and C; SH vs. 248 at 2
dpe). These cells acquired an elongated, spindle-like phenotype,
and infiltrated the matrix locally, but did not separate from the
microsphere as readily as the MDA-MB-231-SH cells. In summary,
following the expression of p53-R248Q in H1299 and MDA-MB-231
cells, a recurring phenotype of decreased transactivation-dependent
motility and invasiveness was observed. In addition, a visible
morphological difference was observed in MDA-MB-231 cells
expressing p53-R248Q.
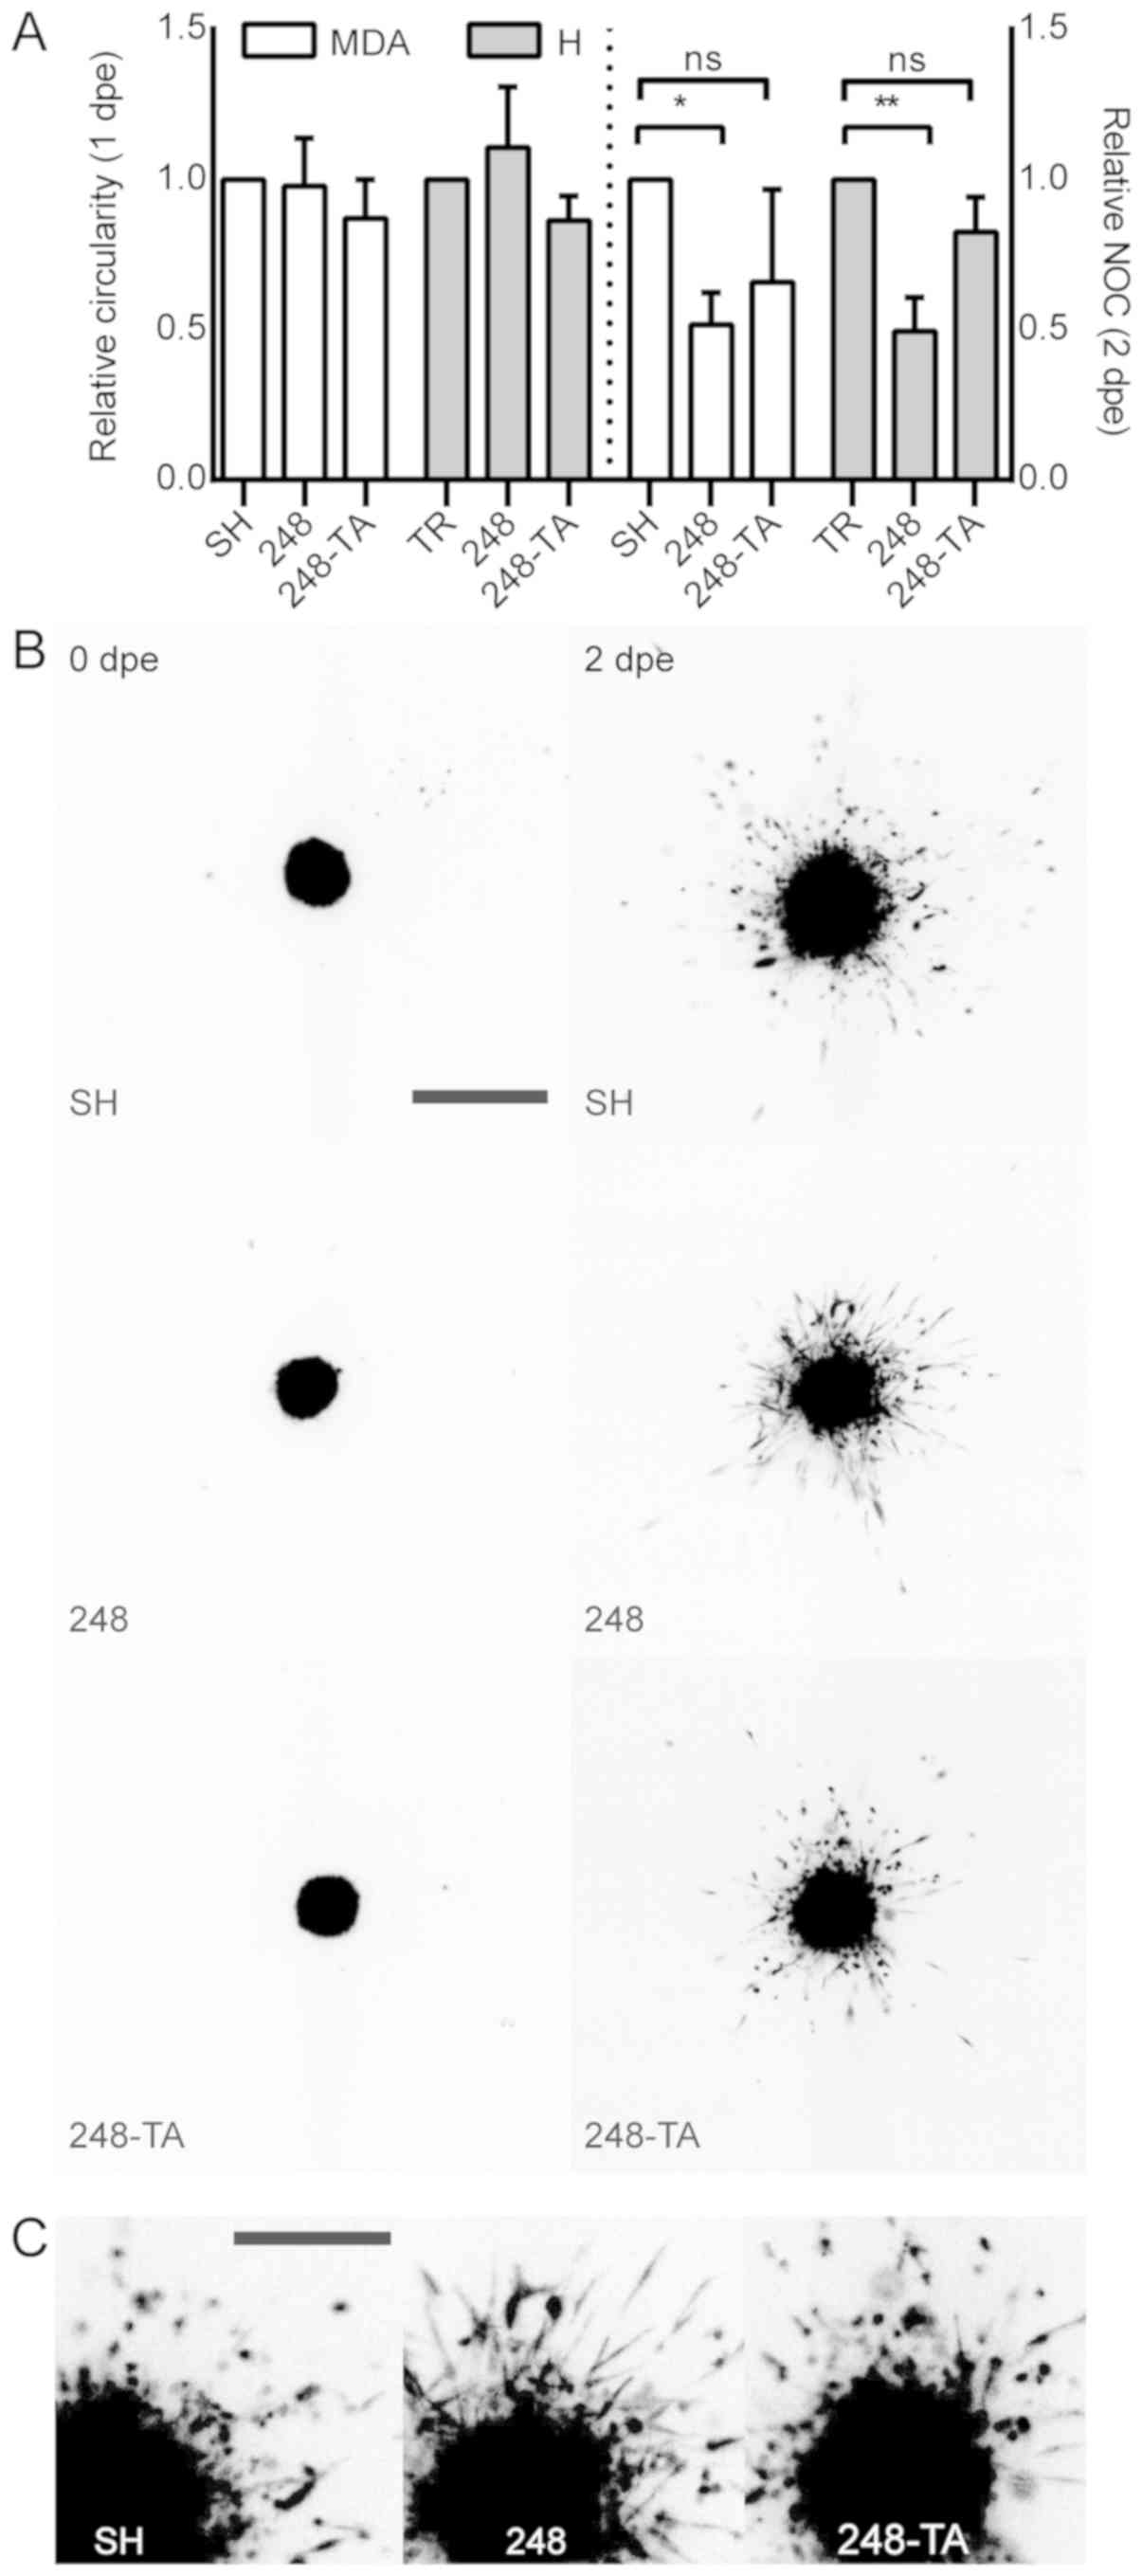 | Figure 4Collagen I local infiltration and
invasiveness are altered by the expression of mutated p53. (A)
Microspheres were prepared from MDA or H cells conditionally
expressing the indicated p53 variants and induced or not induced
with 30 ng/ml DOX. The spheres were embedded in 0.5 mg/ml collagen
I matrix and imaged at 0, 1 and 2 dpe. Changes in the main
micro-sphere circularity and the NOC separated from the main
microsphere were calculated in relation to the microspheres
composed of cells not induced with DOX. A decrease in circularity
reflects an irregular microsphere shape resulting from increased
local invasiveness. (B) A representative set of microsphere images.
Depicted are microspheres composed of MDA-MB-231 cells expressing
the indicated p53 variants. The cells were DOX-induced 48 h prior
to embedding. The images were captured directly post-embedding and
at 48 h. Scale bar, 1 mm. (C) Magnification of the 2 dpe images.
Scale bar, 0.5 mm. The data are presented as the mean ± standard
error of the mean. *P<0.05 and
**P<0.01, respectively. p53, tumor suppressor p53;
MDA, MDA-MB-231; H, H1299; DOX, doxycycline; dpe, days
post-embedding; NOC, number of cells; ns, not significant; TR,
cells with Tet repressor only; SH, cells with silenced endogenous
p53; TA, transactivatory domain disruption (L22S/W23Q) in addition
to R248Q mutation. |
Cellular migration in 2D or 3D is influenced by
numerous factors, including microenvironment sensing, cytoskeletal
remodeling and matrix degradation. One such factor is the ability
to efficiently assemble and disassemble the matrix adhesion points.
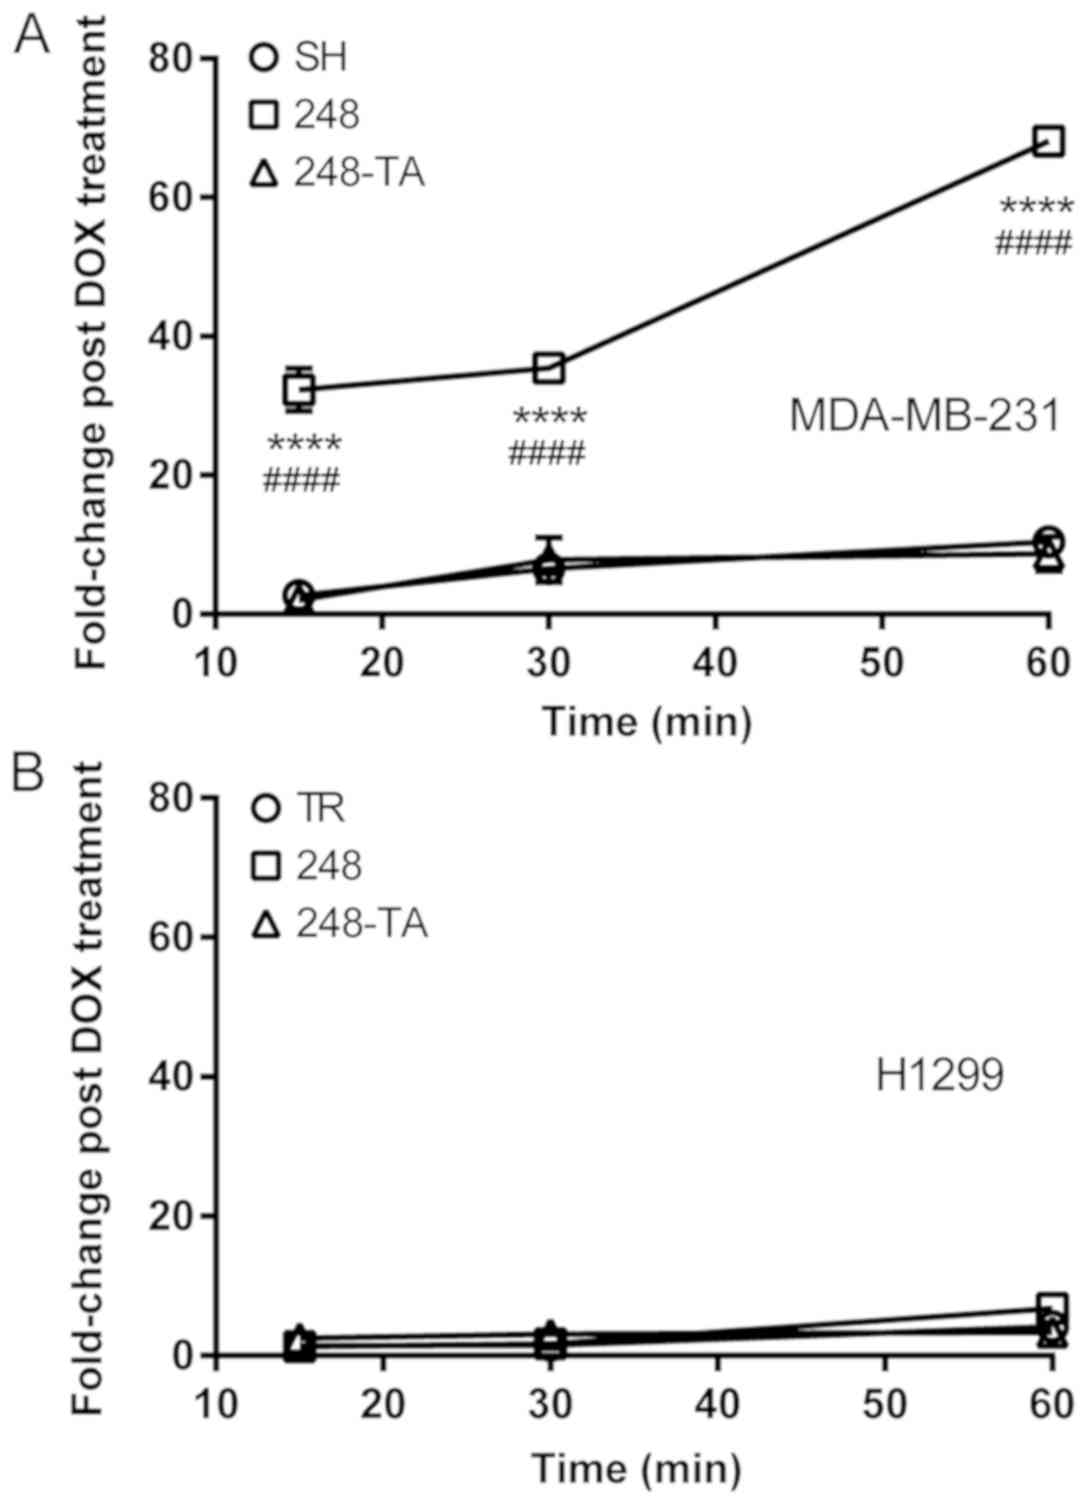
Therefore, the adhesion capability of MDA-MB-231 and H1299 cells
expressing mutated p53 variants was assayed. The results of these
analyses are presented in Fig. 5.
The findings revealed that MDA-MB-231 cells expressing p53-R248Q,
but not p53-R248Q-TA, adhered to the culture vessel faster than the
MDA-MB-231-SH cells (Fig. 5A). In
contrast, the adhesive properties of the H1299 cells did not change
following the expression of either p53-R248Q or p53-R248Q-TA
(Fig. 5B).
In summary, following the expression of the p53
R248Q variant in MDA-MB-231 cells, they displayed a phenotype of
decreasing invasiveness and increased adhesiveness, which was
transactivation-dependent. In addition, a visible morphological
change was observed in the MDA-MB-231 cells expressing p53-R248Q.
In the H1299 cells, the motility and invasiveness, but not the
adhesive properties, changed following the expression of
p53-R248Q.
Expression of the p53 R248Q mutant alters
the distribution of xenotransplanted cancer cells in zebrafish
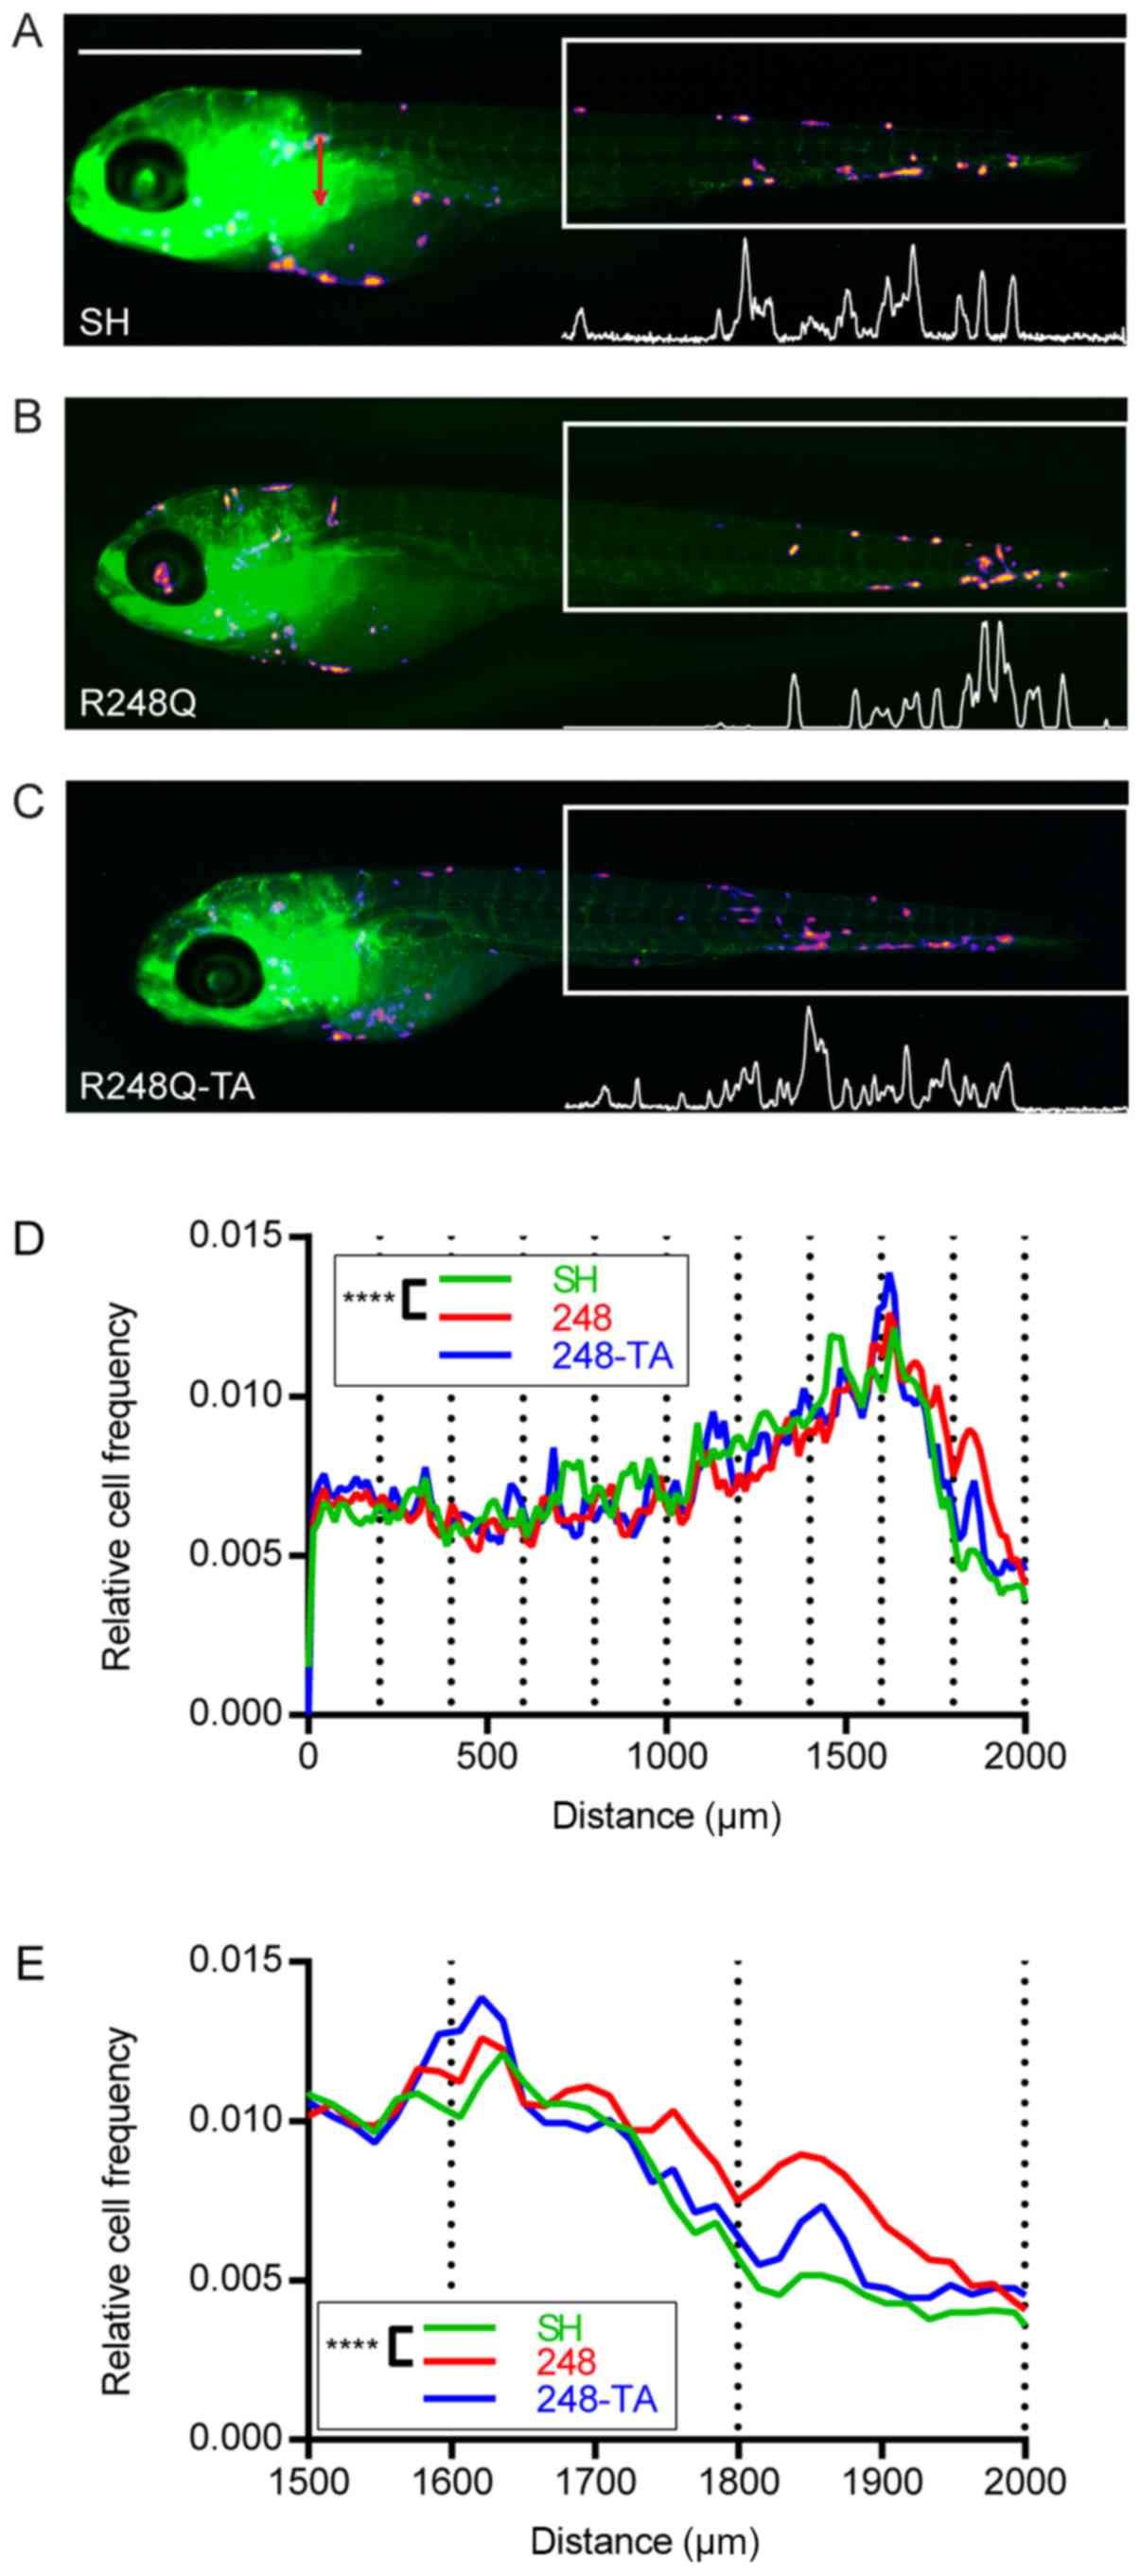
In order to verify whether the differences observed
in the in vitro assays in cancer cells expressing various
p53 mutants would result in a changed phenotype in vivo, the
MDA-MB-231-SH, -R248Q and -R248Q-TA cells were microinjected into
the common cardinal vein of zebrafish embryos. The approximate
injection site is indicated in Fig.
6A (red arrow). At 5 dpf images of the zebrafish were captured
under a fluorescent stereoscope (Fig.
6A-C; the cell types used for injection are indicated). The
area corresponding to the posterior 2 mm of the embryo was
analyzed. The intensity profiles were analyzed to determine the
locations of the transplanted cells along the fish trunk and tail.
For analysis, this 2 mm section of the fish was divided into 10
sections of 200 µm and each cell was ascribed to its
corresponding subsection. The relative cancer cell frequencies in
the most posterior 2- and 0.5-mm sections of the embryo are plotted
in Fig. 6D and E, respectively.
Subsequently, pairwise contingency analysis was performed, and the
difference between the distributions of the SH and R248Q cells was
revealed to be significant (P<0.0001), whereas no significant
difference was observed between the SH and R248Q-TA cells.
Expression of mutated p53 alters the
expression of proteins involved in the EMT as well as the
expression and phosphorylation of MLC2
In order to investigate the molecular mechanism
responsible for the phenotypic changes observed in H1299 and
MDA-MB-231 cells expressing mutated p53, lysates from cells treated
with 30 ng/ml DOX for 2 or 3 days, respectively, were analyzed by
western blotting (Fig. 7). The
lysate from epithelial lung cancer H358 cells, which are p53-NULL,
exhibit compact, islet-like growth and are essentially
non-migratory, was used for comparison. As observed in Figs. 2D and 7A, the H1299 and MDA-MB-231 cells
expressed p53 protein variants upon stimulation with 30 ng/ml DOX.
In addition, efficient silencing of endogenous p53 was achieved in
the MDA-MB-231-SH cells. In order to establish whether any major
mitogen-response pathways are affected by the expression of the p53
variants, the expression and phosphorylation levels of PI3K, AKT
and ERK1/2 were investigated (Fig.
7B); however, no apparent differences were observed. Since the
p53 mutations are linked to the EMT (35,48,49)
and this process is often accompanied by changes in migratory
behavior, the levels of several EMT-associated proteins were
analyzed (Fig. 7C). The cell lines
used in the present study are of mesenchymal characteristic,
therefore a partial shift of the molecular phenotype from
mesenchymal towards epithelial was expected in the case of cells
with decreased migration and invasiveness (i.e. cells with
p53-R248Q). In the H1299-R248Q cells, a decrease was observed in
TCF8/ZEB1 and N-cadherin, resulting in expression levels similar to
those of the H358 cells (Fig. 7C).
The other EMT markers, including Vimentin, E-cadherin and
β-catenin, however, remained unchanged, suggesting only a partial
phenotypic change. This is in agreement with the observation that,
whereas H1299-R248Q cells migrate slower than H1299-TR cells, they
are more mobile than the H358 cells (data not shown). Whereas no
increase in the epithelial marker E-cadherin expression was
observed (reference band clearly visible in the H358 lane), the
expression of mesenchymal markers N-cadherin and β-catenin appeared
lower in MDA-MB-231-R248Q cells than in MDA-MB-SH cells, suggesting
a partial loss of mesenchymal characteristic following p53-R248Q
expression. The multiple bands detected by the N-cadherin antibody
represent the maturation stages of the protein. A small decrease in
the expression of SLUG, an EMT regulator, was observed in the
MDA-MB-231 cells expressing p53-R248Q, but not p53-R248Q-TA. Given
that the difference in migration speed was the most consistently
observed phenotype, and that p53 serves an important role in the
functional regulation of cytoskeletal proteins (52), the expression and phosphorylation
level of several proteins involved in the cytoskeletal regulation
of migration were analyzed (Fig.
7D). No differences were observed in the expression levels of
FAK and ROCK-1 following the induction of the mutated p53. However,
in the MDA-MB-231-R248Q cells, but not the H1299-R248Q cells, a
decrease in the expression of RhoA, a myosin regulator, was noted.
Additionally, in the cells expressing p53-R248Q (but not
p53-R248Q-TA) there was a decrease in total and S19-phosphorylated
MLC2, which is involved in cellular migration. Notably, in the
non-mobile H358 cells MLC2 was detected, but was phosphorylated at
a relatively low level.
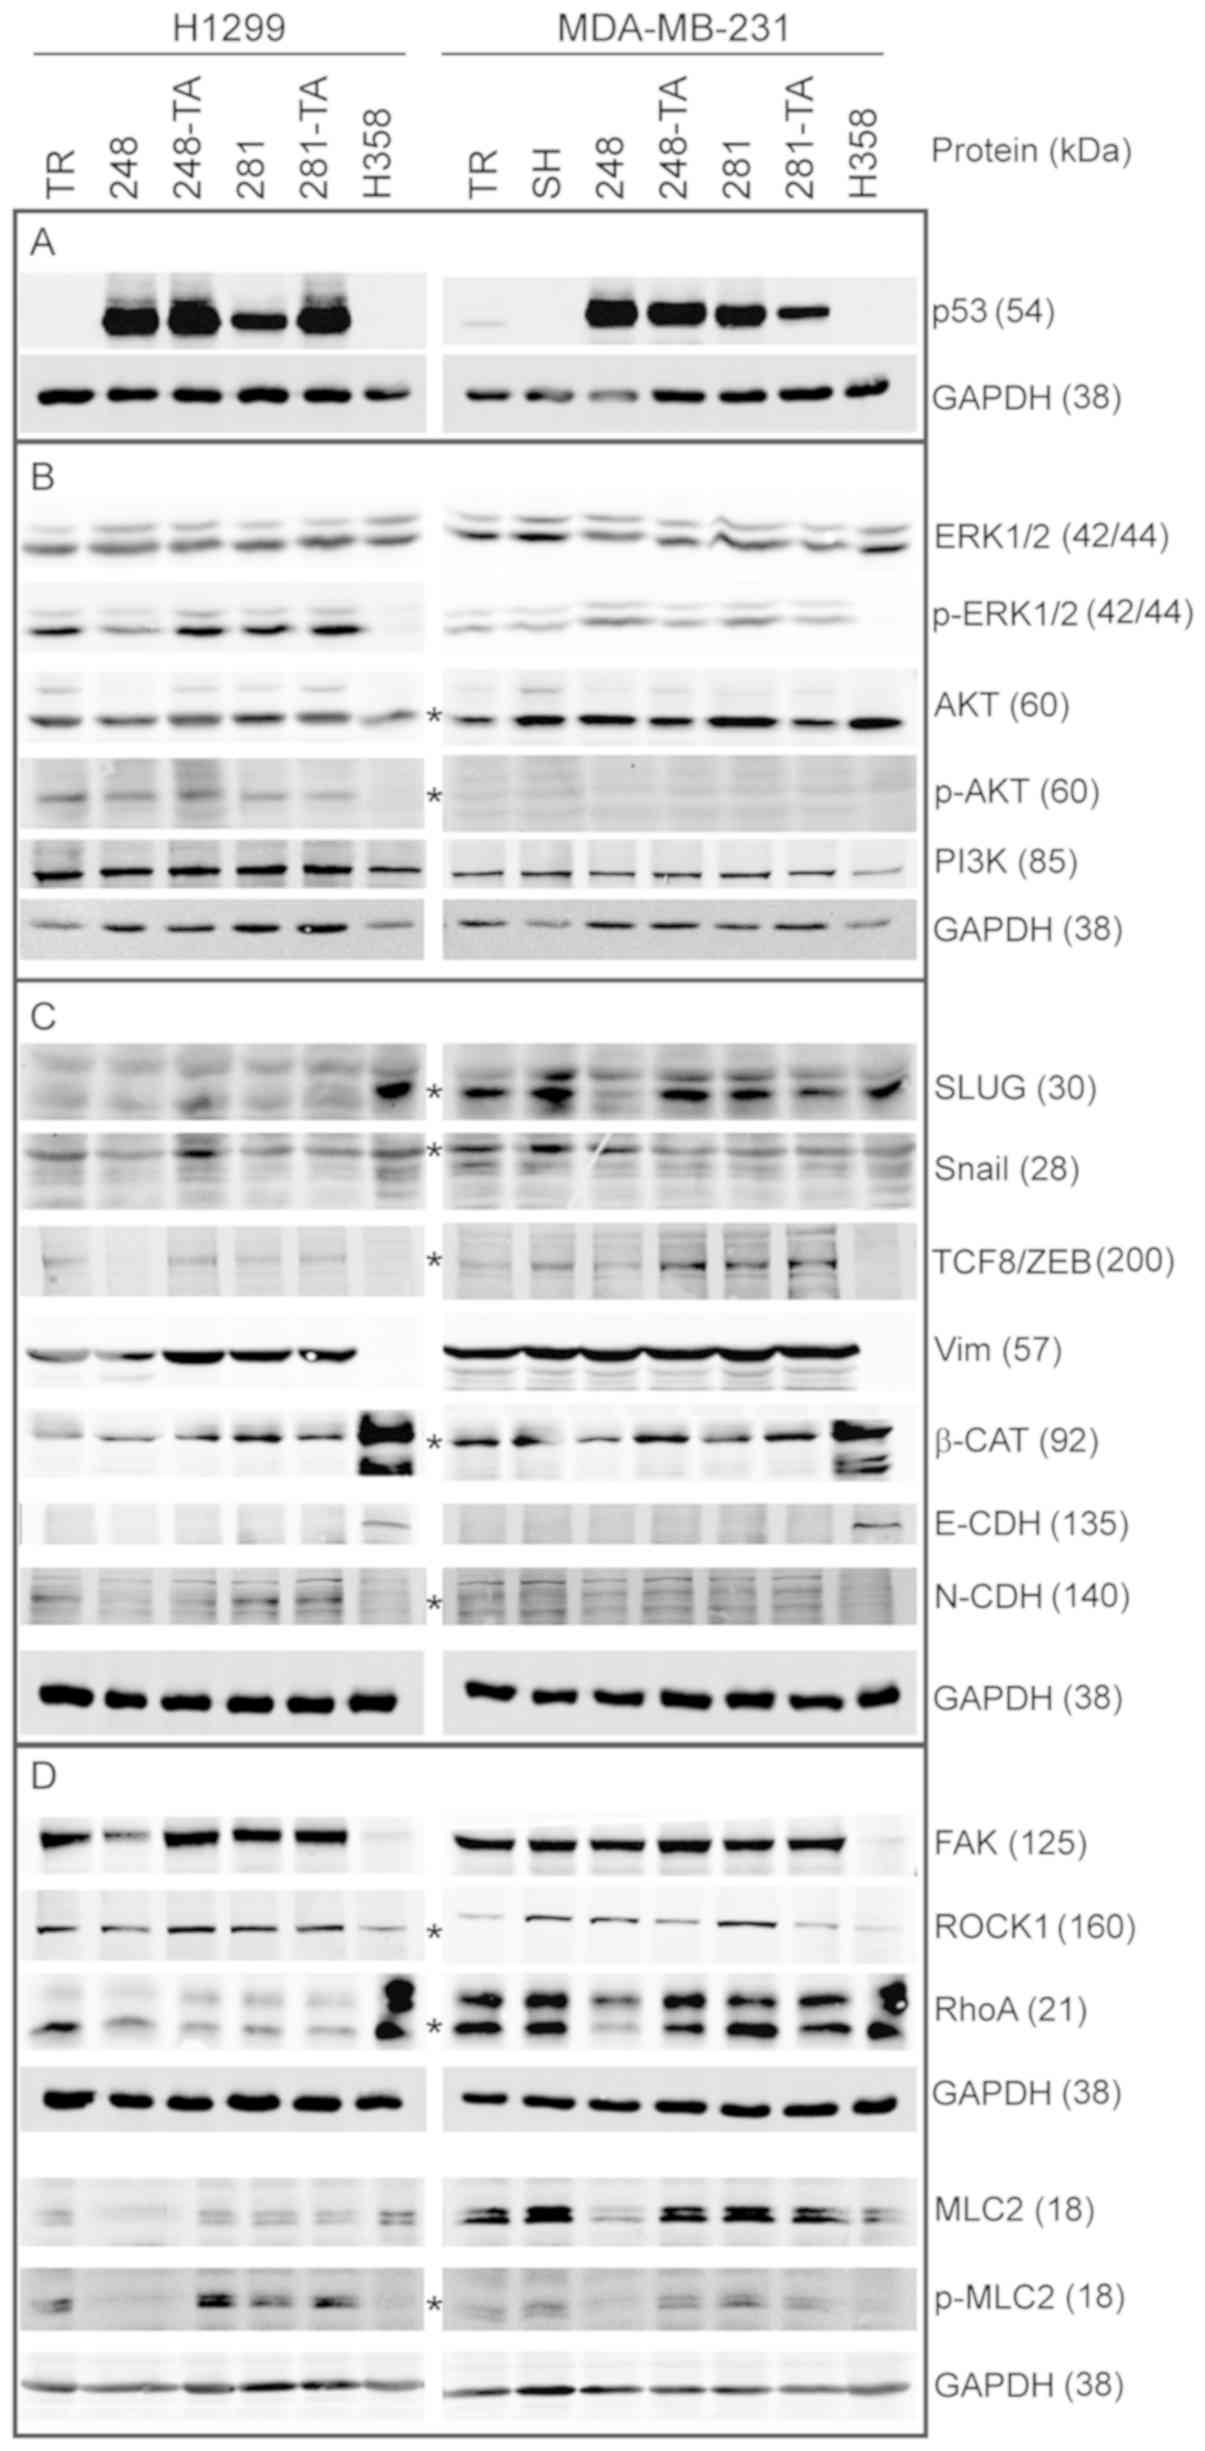 | Figure 7Western blot analysis of protein
expression in MDA-MB-231 cells expressing mutant p53. Cells were
induced with 30 ng/ml doxycycline for 48 h, lysed and analyzed by
western blotting with 20-40 µg total protein per lane, using
fluorescent secondary antibodies and an Odyssey scanner for the
detection of bands. (A) Protein expression of induced transgenes in
H1299 and MDA-MB-231 cells, and the silencing of endogenous p53 in
MDA-MB-231-SH cells. (B) Expression and phosphorylation levels of
selected proteins associated with mitogenic signaling. (C)
Expression levels of proteins associated with the
epithelial-mesenchymal status. (D) Expression levels of proteins
associated with the regulation of adhesion and actin-based
migration. Wherever the identity of the band representing the
marked protein was in doubt, it is marked with an asterisk
(*). Apparent molecular weights, as assessed from the
western blot markers, are indicated in the parentheses next to the
protein identifiers. p53, tumor suppressor p53; p-, phosphorylated;
ERK, mitogen-activated protein kinase; AKT, protein kinase B; PI3K,
phosphoinositide 3-kinase; SLUG, zinc finger protein SNAI2; Snail,
zinc finger protein SNAI1; TCF8/ZEB, zinc finger E-box-binding
homeobox 1; Vim, Vimentin; β-CAT, β-catenin; CDH, cadherin; FAK,
focal adhesion kinase 1; ROCK1, Rho-associated protein kinase 1;
RhoA, Ras homolog family member A; MLC2, myosin light chain 2; TR,
cells with Tet repressor only; SH, cells with silenced endogenous
p53; TA, transactivatory domain disruption (L22S/W23Q) in addition
to indicated mutation (R248Q or D281G). |
Discussion
The key role of the p53 protein in tumor suppression
has been recognized for many years. A vast body of evidence exists
on its physiological role as tumor suppressor; for a number of
years it has also been known that mutated p53 may serve an
oncogenic role. Ever since the creation of the first transgenic
mice bearing the ‘hot spot’ mutations in TP53 gene (15,16),
it has been accepted that these mutations lead to an increase in
the prevalence of tumors, change the tumor spectrum, and increase
their invasiveness and metastatic potential.
The results of the analyses in the present study,
performed using the largest publicly available database of p53
mutations in human patients (IARC, Release 18) (48), confirmed the changes in primary
tumor onset and spectrum in patients bearing the ‘hot spot’ p53
mutations, for germline and somatic mutations. In addition, the
locations of metastases were different in patients bearing the ‘hot
spot’ p53 mutations within the IARC and MSKCC datasets. However,
the analysis of the metastasis frequency revealed that, in patients
with missense mutations in their TP53 gene, metastasis was
less frequent than in patients with the NULL genotype; this was
particularly accentuated in patients bearing R248Q mutation. These
results seem contradictory to the reported phenotypes observed in
mice (14-16), but one has to keep in mind that the
variance in human phenotypes may result from the versatility of the
genetic background in human cohorts, as opposed to isogenic murine
strains.
Therefore, the present study reports on data
describing changes in the migratory behavior and invasiveness of
breast and lung cancer-derived cell lines upon the short-term
expression of mutated forms of p53. The selected mutations are the
one that, according to a previous study, leads to the largest
increase in the migration speed of cancer H1299 cells (D281G)
(38), and the one that, according
to the present analyses, decreases the metastasis frequency most
efficiently (R248Q).
The results of the present study demonstrated that
the expression of the p53 D281G variant increased the wound-healing
assay migration speed in a transactivation-dependent manner, but
this effect was cancer type-specific and was only observed in lung
cancer H1299 cells, as previously reported (38), but not in breast cancer MDA-MB-231
cells. To the best of our knowledge, this is the first attempt at
testing the migration-associated GOF phenotype of p53-D281G in this
popular breast cancer model. Notably, the expression of the R248Q
mutant caused a significant decrease in the migration speed in the
cell lines tested, in an exclusively transactivation-dependent
manner. In experiments involving 3D culture in the presence of ECM,
the expression of p53-R248Q significantly decreased the invasive
phenotype in the tested cell types in a transactivation-dependent
manner. The cells expressing the R248Q variant exhibited poorer
invasiveness in experiments involving ECM, including the NOC that
separated from microspheres. This could result from the overall
lower mobility of the cells, alteration of interactions with the
ECM mediated by adhesion molecules, or a differential regulation of
the actin cytoskeleton. These mechanisms have been identified as
relevant in tumor suppression by p53 (52-55).
Indeed, MDA-MB-231-R248Q cells exhibited markedly accelerated
adhesion in a transactivation-dependent manner. Notably, this
phenotype was not observed in the lung cancer H1299 cells,
suggesting that the underlying molecular mechanism is cancer
type-specific. In conjunction with the 2D mobility assay results,
this could be interpreted as accelerated assembly of focal
adhesions in MDA-MB-231-R248Q cells. On the other hand, the
inhibition of focal adhesions disassembly, possibly by interference
with the function of FAK, may contribute to the decrease in
migration of MDA-MB-231 and H1299 cancer cells expressing
p53-R248Q. The role of FAK in cancer invasiveness, and the
regulatory activity of p53 towards FAK have been demonstrated
(56,57).
The zebrafish embryo has been successfully employed
as a model for human cancer cell xenotransplantations (58), and it has been demonstrated that,
not only do human cancer cells utilize their adhesion molecules for
host endothelial attachment (59-61),
but the distribution of the transplanted cells is non-random and
may reflect the migratory properties and presumably a certain
tropism exhibited by the cells (47). Accordingly, the alteration of the
distribution of MDA-MB-231 cells that were injected intravenously
into the zebrafish embryo upon expression of p53-R248Q, but not
p53-R248Q-TA, was observed. This difference in distribution may
reflect an altered tropism of the cancer cells, possibly resulting
from the p53-induced changes in adhesive properties. In human
patients this may translate to the differential distribution of
metastatic sites (Tables VI and
VII).
In H1299-R248Q cells, a decrease in TCF8/ZEB1 and
N-cadherin protein levels was observed, compatible with the partial
loss of the mesenchymal characteristic manifested by the decreased
mobility and increased cell-cell coherence. TCF8/ZEB1 is a
pleiotropic suppressor of epithelial features and inducer of EMT,
whose importance in cancer metastasis is well recognized (62-64).
Dong et al (65) reported a
ZEB1 increase accompanied by an increase in cellular mobility upon
mutant p53 expression, but different model cell lines were used
than the ones employed in the present study, which might explain
the difference in phenotype. In the MDA-MB-231-R248Q cells, a
decrease in SLUG and RhoA expression was observed. SLUG is an EMT
regulator and its decrease would be consistent with partial loss of
the mesenchymal characteristic. RhoA is an important regulator of
actomyosin contractile complexes and is involved in the regulation
of cancer invasiveness (66,67).
Furthermore, in H1299 and MDA-MB-231 cells expressing p53-R248Q, a
decrease in the expression and phosphorylation of MLC2 was
observed. The MLC2 protein is involved in the calcium-dependent
regulation of actomyosin contractility and has recently been
reported to have a positive impact on membrane mechanics and ECM
remodeling (68); therefore, a
decrease in its expression may result in a decrease in cellular
mobility, particularly in the ECM environment. Notably, the
immobile H358 cells express MLC2, but it is not phosphorylated, and
thus inactive.
The molecular mechanisms of regulation of SLUG, RhoA
or MLC2 expression by the p53 GOF mutant protein in a
transactivation-dependent manner are not known. It could be
hypothesized that a slightly misfolded p53 acquires affinity for a
different set of promoters and activates the expression of negative
regulators of the impacted proteins. Alternatively, it might
activate the expression of miRNAs that limit the translation of the
proteins in question. Chromatin immunoprecipitation/mRNA/miRNA
sequencing would be good experimental approaches to address these
questions.
In summary, the current study has presented data
demonstrating that the mutated p53 GOF characteristics, including
changes in adhesive properties, may be cancer type-specific. It may
also translate to a cellular phenotype that seemingly decreases
traits of malignancy. This should be a reminder that
generalizations, even when they concern key regulators, including
p53, should be made with caution. Further research into the
molecular mechanisms of the decrease in invasiveness resulting from
p53-R248Q expression is required. Furthermore, it would be
interesting to see whether a larger meta-analysis of available
clinical and molecular data confirms the lower occurrence of
metastasis in patients bearing the p53-R248Q mutation.
Funding
MO, MP, AZ and MZ were supported by the National
Science Centre, Krakow, Poland, under MAESTRO grant no.
2012/06/A/NZ1/00089. The funding body had no influence over the
design of the study, collection, analysis and interpretation of
data.
Availability of data and materials
All data generated or analyzed during this study are
included in this published article.
Authors’ contributions
MBO designed and performed experiments, analyzed the
data and wrote the draft manuscript. MP performed the experiments
and analyzed the data. ESJ contributed to the design and execution
of the experiments involving zebrafish embryos. AZ and MZ
contributed to the design of the experiments, data analysis and
manuscript editing and improvement.
Ethics approval and consent to
participate
Under Polish and EU guidelines, no specific ethics
approval was required for this study, as all zebrafish embryos used
were between 0 and 5 days old and therefore not considered animals.
Fish embryos were obtained in-house, as the International Institute
of Molecular and Cell Biology has an institutional license to house
and breed fish. No patient-derived data or tissues were used in
this study.
Patient consent for publication
Not applicable.
Competing interests
The authors declare that they have no competing
interests.
Acknowledgments
Not applicable.
References
|
1
|
Lane DP: Cancer. p53, guardian of the
genome. Nature. 358:15–16. 1992. View
Article : Google Scholar : PubMed/NCBI
|
|
2
|
Petitjean A, Achatz MI, Borresen-Dale AL,
Hainaut P and Olivier M: TP53 mutations in human cancers:
Functional selection and impact on cancer prognosis and outcomes.
Oncogene. 26:2157–2165. 2007. View Article : Google Scholar : PubMed/NCBI
|
|
3
|
Halevy O, Michalovitz D and Oren M:
Different tumor-derived p53 mutants exhibit distinct biological
activities. Science. 250:113–116. 1990. View Article : Google Scholar : PubMed/NCBI
|
|
4
|
Milner J and Medcalf EA: Cotranslation of
activated mutant p53 with wild-type drives the wild-type p53
protein into the mutant conformation. Cell. 65:765–774. 1991.
View Article : Google Scholar : PubMed/NCBI
|
|
5
|
Chan WM, Siu WY, Lau A and Poon RY: How
many mutant p53 molecules are needed to inactivate a tetramer? Mol
Cell Biol. 24:3536–3551. 2004. View Article : Google Scholar : PubMed/NCBI
|
|
6
|
Willis A, Jung EJ, Wakefield T and Chen X:
Mutant p53 exerts a dominant negative effect by preventing
wild-type p53 from binding to the promoter of its target genes.
Oncogene. 23:2330–2338. 2004. View Article : Google Scholar : PubMed/NCBI
|
|
7
|
Dittmer D, Pati S, Zambetti G, Chu S,
Teresky AK, Moore M, Finlay C and Levine AJ: Gain of function
mutations in p53. Nat Genet. 4:42–46. 1993. View Article : Google Scholar : PubMed/NCBI
|
|
8
|
Hanahan D and Weinberg RA: The hallmarks
of cancer. Cell. 100:57–70. 2000. View Article : Google Scholar : PubMed/NCBI
|
|
9
|
Hanahan D and Weinberg RA: Hallmarks of
cancer: The next generation. Cell. 144:646–674. 2011. View Article : Google Scholar : PubMed/NCBI
|
|
10
|
Aschauer L and Muller PA: Novel targets
and interaction partners of mutant p53 Gain-Of-Function. Biochem
Soc Trans. 44:460–466. 2016. View Article : Google Scholar : PubMed/NCBI
|
|
11
|
Shetzer Y, Molchadsky A and Rotter V:
Oncogenic mutant p53 gain of function nourishes the vicious cycle
of tumor development and cancer stem-cell formation. Cold Spring
Harb Perspect Med. 6:202016. View Article : Google Scholar
|
|
12
|
Shetzer Y, Solomon H, Koifman G,
Molchadsky A, Horesh S and Rotter V: The paradigm of mutant
p53-expressing cancer stem cells and drug resistance.
Carcinogenesis. 35:1196–1208. 2014. View Article : Google Scholar : PubMed/NCBI
|
|
13
|
Pfister NT and Prives C: Transcriptional
regulation by wild-type and cancer-related mutant forms of p53.
Cold Spring Harb Perspect Med. 7:262017. View Article : Google Scholar
|
|
14
|
Liu G, McDonnell TJ, Montes de Oca Luna R,
Kapoor M, Mims B, El-Naggar AK and Lozano G: High metastatic
potential in mice inheriting a targeted p53 missense mutation. Proc
Natl Acad Sci USA. 97:4174–4179. 2000. View Article : Google Scholar : PubMed/NCBI
|
|
15
|
Lang GA, Iwakuma T, Suh YA, Liu G, Rao VA,
Parant JM, Valentin-Vega YA, Terzian T, Caldwell LC, Strong LC, et
al: Gain of function of a p53 hot spot mutation in a mouse model of
Li-Fraumeni syndrome. Cell. 119:861–872. 2004. View Article : Google Scholar : PubMed/NCBI
|
|
16
|
Olive KP, Tuveson DA, Ruhe ZC, Yin B,
Willis NA, Bronson RT, Crowley D and Jacks T: Mutant p53 gain of
function in two mouse models of Li-Fraumeni syndrome. Cell.
119:847–860. 2004. View Article : Google Scholar : PubMed/NCBI
|
|
17
|
Liu G, Parant JM, Lang G, Chau P,
Chavez-Reyes A, El-Naggar AK, Multani A, Chang S and Lozano G:
Chromosome stability, in the absence of apoptosis, is critical for
suppression of tumorigenesis in Trp53 mutant mice. Nat Genet.
36:63–68. 2004. View
Article : Google Scholar : PubMed/NCBI
|
|
18
|
Song H, Hollstein M and Xu Y: p53
gain-of-function cancer mutants induce genetic instability by
inactivating ATM. Nat Cell Biol. 9:573–580. 2007. View Article : Google Scholar : PubMed/NCBI
|
|
19
|
Liu DP, Song H and Xu Y: A common gain of
function of p53 cancer mutants in inducing genetic instability.
Oncogene. 29:949–956. 2010. View Article : Google Scholar :
|
|
20
|
Hanel W, Marchenko N, Xu S, Yu SX, Weng W
and Moll U: Two hot spot mutant p53 mouse models display
differential gain of function in tumorigenesis. Cell Death Differ.
20:898–909. 2013. View Article : Google Scholar : PubMed/NCBI
|
|
21
|
Gaiddon C, Lokshin M, Ahn J, Zhang T and
Prives C: A subset of tumor-derived mutant forms of p53
down-regulate p63 and p73 through a direct interaction with the p53
core domain. Mol Cell Biol. 21:1874–1887. 2001. View Article : Google Scholar : PubMed/NCBI
|
|
22
|
Xu J, Reumers J, Couceiro JR, De Smet F,
Gallardo R, Rudyak S, Cornelis A, Rozenski J, Zwolinska A, Marine
JC, et al: Gain of function of mutant p53 by coaggregation with
multiple tumor suppressors. Nat Chem Biol. 7:285–295. 2011.
View Article : Google Scholar : PubMed/NCBI
|
|
23
|
Wiech M, Olszewski MB, Tracz-Gaszewska Z,
Wawrzynow B, Zylicz M and Zylicz A: Molecular mechanism of mutant
p53 stabilization: The role of HSP70 and MDM2. PLoS One.
7:e514262012. View Article : Google Scholar : PubMed/NCBI
|
|
24
|
Muller PA, Caswell PT, Doyle B, Iwanicki
MP, Tan EH, Karim S, Lukashchuk N, Gillespie DA, Ludwig RL,
Gosselin P, et al: Mutant p53 drives invasion by promoting integrin
recycling. Cell. 139:1327–1341. 2009. View Article : Google Scholar
|
|
25
|
Adorno M, Cordenonsi M, Montagner M,
Dupont S, Wong C, Hann B, Solari A, Bobisse S, Rondina MB, Guzzardo
V, et al: A Mutant-p53/Smad complex opposes p63 to empower
TGFbeta-induced metastasis. Cell. 137:87–98. 2009. View Article : Google Scholar : PubMed/NCBI
|
|
26
|
Weissmueller S, Manchado E, Saborowski M,
Morris JP IV, Wagenblast E, Davis CA, Moon SH, Pfister NT,
Tschaharganeh DF, Kitzing T, et al: Mutant p53 drives pancreatic
cancer metastasis through cell-autonomous PDGF receptor β
signaling. Cell. 157:382–394. 2014. View Article : Google Scholar : PubMed/NCBI
|
|
27
|
Subramanian M, Francis P, Bilke S, Li XL,
Hara T, Lu X, Jones MF, Walker RL, Zhu Y, Pineda M, et al: A mutant
p53/let-7i-axis-regulated gene network drives cell migration,
invasion and metastasis. Oncogene. 34:1094–1104. 2015. View Article : Google Scholar :
|
|
28
|
Alam SK, Yadav VK, Bajaj S, Datta A, Dutta
SK, Bhattacharyya M, Bhattacharya S, Debnath S, Roy S, Boardman LA,
et al: DNA damage-induced ephrin-B2 reverse signaling promotes
chemo-resistance and drives EMT in colorectal carcinoma harboring
mutant p53. Cell Death Differ. 23:707–722. 2016. View Article : Google Scholar
|
|
29
|
Kollareddy M, Dimitrova E, Vallabhaneni
KC, Chan A, Le T, Chauhan KM, Carrero ZI, Ramakrishnan G, Watabe K,
Haupt Y, et al: Regulation of nucleotide metabolism by mutant p53
contributes to its gain-of-function activities. Nat Commun.
6:73892015. View Article : Google Scholar : PubMed/NCBI
|
|
30
|
Arjonen A, Kaukonen R, Mattila E, Rouhi P,
Högnäs G, Sihto H, Miller BW, Morton JP, Bucher E, Taimen P, et al:
Mutant p53-associated myosin-X upregulation promotes breast cancer
invasion and metastasis. J Clin Invest. 124:1069–1082. 2014.
View Article : Google Scholar : PubMed/NCBI
|
|
31
|
Scian MJ, Stagliano KE, Ellis MA, Hassan
S, Bowman M, Miles MF, Deb SP and Deb S: Modulation of gene
expression by tumor-derived p53 mutants. Cancer Res. 64:7447–7454.
2004. View Article : Google Scholar : PubMed/NCBI
|
|
32
|
Vaughan CA, Singh S, Grossman SR, Windle
B, Deb SP and Deb S: Gain-of-function p53 activates multiple
signaling pathways to induce oncogenicity in lung cancer cells. Mol
Oncol. 11:696–711. 2017. View Article : Google Scholar : PubMed/NCBI
|
|
33
|
Kogan-Sakin I, Tabach Y, Buganim Y,
Molchadsky A, Solomon H, Madar S, Kamer I, Stambolsky P, Shelly A,
Goldfinger N, et al: Mutant p53(R175H) upregulates Twist1
expression and promotes epithelial-mesenchymal transition in
immortalized prostate cells. Cell Death Differ. 18:271–281. 2011.
View Article : Google Scholar
|
|
34
|
Vaughan CA, Singh S, Windle B, Yeudall WA,
Frum R, Grossman SR, Deb SP and Deb S: Gain-of-Function Activity of
Mutant p53 in Lung Cancer through Up-Regulation of Receptor Protein
Tyrosine Kinase Axl. Genes Cancer. 3:491–502. 2012. View Article : Google Scholar : PubMed/NCBI
|
|
35
|
Cavallaro S: CXCR4/CXCL12 in
non-small-cell lung cancer metastasis to the brain. Int J Mol Sci.
14:1713–1727. 2013. View Article : Google Scholar : PubMed/NCBI
|
|
36
|
Hinton CV, Avraham S and Avraham HK: Role
of the CXCR4/CXCL12 signaling axis in breast cancer metastasis to
the brain. Clin Exp Metastasis. 27:97–105. 2010. View Article : Google Scholar
|
|
37
|
Orimo A, Gupta PB, Sgroi DC,
Arenzana-Seisdedos F, Delaunay T, Naeem R, Carey VJ, Richardson AL
and Weinberg RA: Stromal fibroblasts present in invasive human
breast carcinomas promote tumor growth and angiogenesis through
elevated SDF-1/CXCL12 secretion. Cell. 121:335–348. 2005.
View Article : Google Scholar : PubMed/NCBI
|
|
38
|
Yeudall WA, Vaughan CA, Miyazaki H,
Ramamoorthy M, Choi MY, Chapman CG, Wang H, Black E, Bulysheva AA,
Deb SP, et al: Gain-of-function mutant p53 upregulates CXC
chemokines and enhances cell migration. Carcinogenesis. 33:442–451.
2012. View Article : Google Scholar
|
|
39
|
Moskovits N, Kalinkovich A, Bar J, Lapidot
T and Oren M: p53 Attenuates cancer cell migration and invasion
through repression of SDF-1/CXCL12 expression in stromal
fibroblasts. Cancer Res. 66:10671–10676. 2006. View Article : Google Scholar : PubMed/NCBI
|
|
40
|
Coradini D, Fornili M, Ambrogi F, Boracchi
P and Biganzoli E: TP53 mutation, epithelial-mesenchymal
transition, and stemlike features in breast cancer subtypes. J
Biomed Biotechnol. 2012.254085:2012.
|
|
41
|
Cordani M, Pacchiana R, Butera G, D’Orazi
G, Scarpa A and Donadelli M: Mutant p53 proteins alter cancer cell
secretome and tumour microenvironment: Involvement in cancer
invasion and metastasis. Cancer Lett. 376:303–309. 2016. View Article : Google Scholar : PubMed/NCBI
|
|
42
|
Dong P, Tada M, Hamada J, Nakamura A,
Moriuchi T and Sakuragi N: p53 dominant-negative mutant R273H
promotes invasion and migration of human endometrial cancer HHUA
cells. Clin Exp Metastasis. 24:471–483. 2007. View Article : Google Scholar : PubMed/NCBI
|
|
43
|
Kalo E, Buganim Y, Shapira KE, Besserglick
H, Goldfinger N, Weisz L, Stambolsky P, Henis YI and Rotter V:
Mutant p53 attenuates the SMAD-dependent transforming growth factor
beta1 (TGF-beta1) signaling pathway by repressing the expression of
TGF-beta receptor type II. Mol Cell Biol. 27:8228–8242. 2007.
View Article : Google Scholar : PubMed/NCBI
|
|
44
|
Campeau E, Ruhl VE, Rodier F, Smith CL,
Rahmberg BL, Fuss JO, Campisi J, Yaswen P, Cooper PK and Kaufman
PD: A versatile viral system for expression and depletion of
proteins in mammalian cells. PLoS One. 4:e65292009. View Article : Google Scholar : PubMed/NCBI
|
|
45
|
Sambrook J and Russell DW: Molecular
Cloning: A Laboratory Manual. Cold Spring Harbor Laboratory Press;
Cold Spring Harbor, NY: 2001
|
|
46
|
Limame R, Wouters A, Pauwels B, Fransen E,
Peeters M, Lardon F, De Wever O and Pauwels P: Comparative analysis
of dynamic cell viability, migration and invasion assessments by
novel real-time technology and classic endpoint assays. PLoS One.
7:e465362012. View Article : Google Scholar : PubMed/NCBI
|
|
47
|
He S, Lamers GE, Beenakker JW, Cui C,
Ghotra VP, Danen EH, Meijer AH, Spaink HP and Snaar-Jagalska BE:
Neutrophil-mediated experimental metastasis is enhanced by VEGFR
inhibition in a zebrafish xenograft model. J Pathol. 227:431–445.
2012. View Article : Google Scholar : PubMed/NCBI
|
|
48
|
Petitjean A, Mathe E, Kato S, Ishioka C,
Tavtigian SV, Hainaut P and Olivier M: Impact of mutant p53
functional properties on TP53 mutation patterns and tumor
phenotype: Lessons from recent developments in the IARC TP53
database. Hum Mutat. 28:622–629. 2007. View Article : Google Scholar : PubMed/NCBI
|
|
49
|
Zehir A, Benayed R, Shah RH, Syed A,
Middha S, Kim HR, Srinivasan P, Gao J, Chakravarty D, Devlin SM, et
al: Mutational landscape of metastatic cancer revealed from
prospective clinical sequencing of 10,000 p atients. Nat Med.
23:703–713. 2017. View Article : Google Scholar : PubMed/NCBI
|
|
50
|
Lin J, Teresky AK and Levine AJ: Two
critical hydrophobic amino acids in the N-terminal domain of the
p53 protein are required for the gain of function phenotypes of
human p53 mutants. Oncogene. 10:2387–2390. 1995.PubMed/NCBI
|
|
51
|
Lin J, Chen J, Elenbaas B and Levine AJ:
Several hydrophobic amino acids in the p53 amino-terminal domain
are required for transcriptional activation, binding to mdm-2 and
the adenovirus 5 E1B 55-kD protein. Genes Dev. 8:1235–1246. 1994.
View Article : Google Scholar : PubMed/NCBI
|
|
52
|
Araki K, Ebata T, Guo AK, Tobiume K, Wolf
SJ and Kawauchi K: p53 regulates cytoskeleton remodeling to
suppress tumor progression. Cell Mol Life Sci. 72:4077–4094. 2015.
View Article : Google Scholar : PubMed/NCBI
|
|
53
|
Bon G, Di Carlo SE, Folgiero V, Avetrani
P, Lazzari C, D’Orazi G, Brizzi MF, Sacchi A, Soddu S, Blandino G,
et al: Negative regulation of beta4 integrin transcription by
home-odomain-interacting protein kinase 2 and p53 impairs tumor
progression. Cancer Res. 69:5978–5986. 2009. View Article : Google Scholar : PubMed/NCBI
|
|
54
|
Janouskova H, Ray AM, Noulet F,
Lelong-Rebel I, Choulier L, Schaffner F, Lehmann M, Martin S,
Teisinger J and Dontenwill M: Activation of p53 pathway by
Nutlin-3a inhibits the expression of the therapeutic target α5
integrin in colon cancer cells. Cancer Lett. 336:307–318. 2013.
View Article : Google Scholar : PubMed/NCBI
|
|
55
|
Guo AK, Hou YY, Hirata H, Yamauchi S, Yip
AK, Chiam KH, Tanaka N, Sawada Y and Kawauchi K: Loss of p53
enhances NF-κB-dependent lamellipodia formation. J Cell Physiol.
229:696–704. 2014. View Article : Google Scholar : PubMed/NCBI
|
|
56
|
Sulzmaier FJ, Jean C and Schlaepfer DD:
FAK in cancer: Mechanistic findings and clinical applications. Nat
Rev Cancer. 14:598–610. 2014. View Article : Google Scholar : PubMed/NCBI
|
|
57
|
Golubovskaya V, Kaur A and Cance W:
Cloning and characterization of the promoter region of human focal
adhesion kinase gene: Nuclear factor kappa B and p53 binding sites.
Biochim Biophys Acta. 1678:111–125. 2004. View Article : Google Scholar : PubMed/NCBI
|
|
58
|
Tulotta C, Stefanescu C, Beletkaia E,
Bussmann J, Tarbashevich K, Schmidt T and Snaar-Jagalska BE:
Inhibition of signaling between human CXCR4 and zebrafish ligands
by the small molecule IT1t impairs the formation of triple-negative
breast cancer early metastases in a zebrafish xenograft model. Dis
Model Mech. 9:141–153. 2016. View Article : Google Scholar : PubMed/NCBI
|
|
59
|
Stoletov K, Kato H, Zardouzian E, Kelber
J, Yang J, Shattil S and Klemke R: Visualizing extravasation
dynamics of metastatic tumor cells. J Cell Sci. 123:2332–2341.
2010. View Article : Google Scholar : PubMed/NCBI
|
|
60
|
Li Y, Drabsch Y, Pujuguet P, Ren J, van
Laar T, Zhang L, van Dam H, Clément-Lacroix P and Ten Dijke P:
Genetic depletion and pharmacological targeting of αv integrin in
breast cancer cells impairs metastasis in zebrafish and mouse
xenograft models. Breast Cancer Res. 17:282015. View Article : Google Scholar
|
|
61
|
Truong HH, Xiong J, Ghotra VP, Nirmala E,
Haazen L, Le Dévédec SE, Balcioğlu HE, He S, Snaar-Jagalska BE,
Vreugdenhil E, et al: β1 integrin inhibition elicits a
prometastatic switch through the TGFβ-miR-200-ZEB network in
E-cadherin-positive triple-negative breast cancer. Sci Signal.
7:ra152014. View Article : Google Scholar
|
|
62
|
Spaderna S, Schmalhofer O, Wahlbuhl M,
Dimmler A, Bauer K, Sultan A, Hlubek F, Jung A, Strand D, Eger A,
et al: The transcriptional repressor ZEB1 promotes metastasis and
loss of cell polarity in cancer. Cancer Res. 68:537–544. 2008.
View Article : Google Scholar : PubMed/NCBI
|
|
63
|
Wellner U, Schubert J, Burk UC,
Schmalhofer O, Zhu F, Sonntag A, Waldvogel B, Vannier C, Darling D,
zur Hausen A, et al: The EMT-activator ZEB1 promotes tumorigenicity
by repressing stemness-inhibiting microRNAs. Nat Cell Biol.
11:1487–1495. 2009. View Article : Google Scholar : PubMed/NCBI
|
|
64
|
Zhang P, Sun Y and Ma L: ZEB1: At the
crossroads of epithelial-mesenchymal transition, metastasis and
therapy resistance. Cell Cycle. 14:481–487. 2015. View Article : Google Scholar : PubMed/NCBI
|
|
65
|
Dong P, Karaayvaz M, Jia N, Kaneuchi M,
Hamada J, Watari H, Sudo S, Ju J and Sakuragi N: Mutant p53
gain-of-function induces epithelial-mesenchymal transition through
modulation of the miR-130b-ZEB1 axis. Oncogene. 32:3286–3295. 2013.
View Article : Google Scholar
|
|
66
|
Jeong D, Park S, Kim H, Kim CJ, Ahn TS,
Bae SB, Kim HJ, Kim TH, Im J, Lee MS, et al: RhoA is associated
with invasion and poor prognosis in colorectal cancer. Int J Oncol.
48:714–722. 2016. View Article : Google Scholar
|
|
67
|
O’Connor K and Chen M: Dynamic functions
of RhoA in tumor cell migration and invasion. Small GTPases.
4:141–147. 2013. View Article : Google Scholar
|
|
68
|
Choi DS, Stark DJ, Raphael RM, Wen J, Su
J, Zhou X, Chang CC and Zu Y: SDF-1α stiffens myeloma bone marrow
mesenchymal stromal cells through the activation of
RhoA-ROCK-Myosin II. Int J Cancer. 136:E219–E229. 2015. View Article : Google Scholar
|