Introduction
In colorectal cancer (CRC), a subset is
characterized by the loss of DNA mismatch repair (MMR) function,
leading to high frameshift mutation rates, predominately at
repetitive DNA sequences (microsatellites). The resulting phenotype
manifests as microsatellite instability (MSI) (1). A large number of genes are affected
by microsatellite instability, however, only some of them are
considered to be drivers of MSI cancer. One of the most frequent
MSI tumor driver mutations occurs in a coding polyadenine (A10)
tract in exon 3 of the transforming growth factor β receptor 2
(TGFBR2) gene (2,3). It is reported that >90% of MSI
tumors are affected by frameshift mutations in the TGFBR2
gene, leading to impaired receptor expression and abrogated
downstream signaling (3). The
TGFBR2 protein is a transmembrane serine-threonine kinase and
serves as the primary receptor for non canonical and canonical
TGF-β signaling. In the canonical pathway, binding of the TGF-β1
ligand induces the dimerization of TGFBR2 and TGFBR1, leading to
Smad-dependent intracellular signal propagation. Receptor
associated Smad proteins, such as Smad2 and Smad3, are then
phosphorylated, allowing complex formation with Smad4. The
functional complex translocates into the nucleus, where it
interacts with different transcription factors to control
expression of several target genes and proteins that are crucial
for maintenance of the colonic epithelium (4). As downstream mediators of TGFBR2
signaling, Smad proteins can also affect the processing and
expression of non coding RNAs, including microRNAs (miRNAs)
(5). With an average size of 22
nucleotides, miRNAs provide fine-tuning of protein abundance by
silencing target gene expression at the post transcriptional level
(6,7). Approximately 60% of protein coding
genes are regulated by miRNAs, which therefore play a key role in
maintaining cellular homeostasis (8).
As important regulators of numerous normal and
patholog ical processes, including colorectal tumorigenesis,
functional miRNAs, among other molecules, have been identified in
the cargo of extracellular vesicles (EVs) (9-12).
Following transfer to cells in the microenvironment or at more
distant sites, the functional cargo of EVs can elicit biological
responses in recipient cells (13). As the EV cargo composition reflects
the type and molecular status of their cell of origin, EV miRNA
levels are altered under different biological and pathological
conditions. In our previous study, we showed that TGFBR2 deficiency
alters the proteome of MSI CRC-derived EVs (14). However, whether the expression
status of TGFBR2 can modulate the repertoire of miRNAs in MSI
tumor-derived EVs remains to be elucidated. To bridge this gap of
knowledge, the present study aimed to decipher the TGFBR2-dependent
miRNA profile of MSI tumor cells and their secreted EVs. An
established MSI cell line model (HCT116-TGFBR2) was used (15), which enables the analysis of
TGFBR2-dependent alterations in an isogenic background (Fig. 1). Small RNA sequencing (RNA-Seq)
identified shared and distinct miRNA signatures in EVs and their
parental MSI tumor cells that are regulated in a TGFBR2-dependent
manner.
Materials and methods
Cell culture
The human epithelial HCT116 MSI CRC cell line was
obtained from the European Collection of Cell Cultures (Salisbury,
UK). The generation of the HCT116-TGFBR2 and HCT116-Tet-On cell
lines has been described previously (15,16).
In both cell lines, the endogenous TGFBR2 gene is
inactivated (TGFBR2 deficient, dT) by homozygous frameshift
mutations in a polyadenine tract (A10) within exon 3. HCT116 Tet On
cells are the parental cells of HCT116 TGFBR2. Both cell lines
allow the constitutive expression of a doxycycline (dox) responsive
transactivator (16).
HCT116-TGFBR2 cells confer dox inducible expression of a
TGFBR2 transgene (+dox, TGFBR2 proficient, pT), which was
inserted as a single copy at a defined site in the HCT116-TGFBR2
genome (15). The HCT116-TGFBR2
and HCT116-Tet-On control cells were cultured in DMEM-F12 medium
(Thermo Fisher Scientific, Inc., Waltham, MA, USA) supplemented
with 10% FBS (Thermo Fisher Scientific, Inc.), 100 U/ml penicillin
and 100 µg/ml streptomycin (Thermo Fisher Scientific, Inc.)
in 5% CO2 atmosphere at 37°C. The Mycoplasma Detection
kit (Minerva Biolabs, Berlin, Germany) was used, according to the
manufacturer's protocol, to ensure that the cultured cells were
free of mycoplasma contamination.
Extracellular vesicle isolation
Each of the four biological replicates was obtained
from 5× T175 flasks containing 28×106 HCT116-TGFBR2 or
HCT116-Tet-On cells. The cells were washed twice with PBS (Thermo
Fisher Scientific, Inc.) and subsequently cultured in serum-free
DMEM-F12 medium (17 ml/T175 flask). The HCT116-TGFBR2 cells were
cultured in the presence of 0.5 µg/ml dox (+dox, pT;
Sigma-Aldrich; Merck KGaA, Darmstadt, Germany) in order to induce
the reconstituted expression of TGFBR2, or grown in the absence of
dox (-dox, dT), which reflects the loss of TGFBR2 in MSI tumors.
The ligand TGF β1 (10 ng/ml; Abcam, Cambridge, UK) was added to the
dT and pT cells. In order to exclude any dox-related effects, two
subsets of HCT116-Tet-On cells were also cultured in the presence
or absence of dox. After 16 h, the medium was collected from both
conditions, and the cells were harvested and stored at -80°C. The
medium was subjected to sequential centrifugation and precipitation
as reported previously (14).
Briefly, the supernatants were cleared by differential
centrifugation (480 × g, 5 min, 4°C; 2,000 × g, 10 min, 4°C),
filtered (0.22 µm), and concentrated (40 fold) using
Vivaspin-20 tubes (Sartorius, Göttingen, Germany). The EVs were
precipitated from this concentrate using Total Exosome Isolation
Reagent (Thermo Fisher Scientific, Inc.) and pelleted by
centrifugation (20,000 × g, 1 h, 4°C). The EV pellets were lysed in
QIAzol Lysis Reagent (Qiagen AB, Limburg, Netherlands) for RNA
extraction, in RIPA buffer (50 mM Tris HCl pH 7.4, 150 mM NaCl, 1%
Triton X-100, 1% Na deoxycholate, 0.1% SDS, 0.1 mM CaCl2
and 0.01 mM MgCl2) for protein extraction or resuspended
in PBS for EV characterization.
Transmission electron microscopy
(TEM)
The EV suspensions (5 µl) in PBS were left to
settle onto 100 mesh formvar coated copper grids (Plano, Wetzlar,
Germany), contrasted with 2% aqueous uranyl acetate (negative
stain), air-dried and visualized using the JEM-1400 transmission
microscope (JEOL, Ltd., Peabody, MA, USA) equipped with a Tietz 2k
digital camera (TVIPS, Gauting, Germany) at 80 KV.
Nanoparticle tracking analysis
The size profiles and particle concentrations were
assessed by nanoparticle tracking analysis (NTA) using the ZetaView
PMX110 system with software 8.04.02 SP2 (Particle Metrix, Inning,
Germany) according to the manufacturer's instructions. The EV
suspensions were diluted 1:2,500 (v/v) in particle free PBS and
analyzed at 11 positions. Data acquisition thresholds were set to a
shutter of 100, a sensitivity of 95% and a frame rate of 30
frames/sec.
Protein extraction and Western blot
analysis
The protein lysates of the EVs and cells were
prepared in RIPA buffer supplemented with cOmplete Mini protease
inhibitor cocktail inhibitor (Roche Diagnostics, Basel,
Switzerland). Protein concentration was measured using the Bradford
assay (Bio Rad Laboratories, Inc., Hercules, CA, USA). Per sample,
50 µg of protein was separated on 4-20% Bis-Tris gradient
gels (Expedeon, Cambridge, UK) and blotted onto a nitrocellulose
membrane (Thermo Fisher Scientific, Inc.). After blocking of the
membranes in 5% milk/TBST, the following primary antibodies were
used: mouse anti-CD63 (1:500, clone MX 49.129.5, cat. no. sc-5276,
Santa Cruz Biotechnology, Inc., Dallas, TX, USA), mouse anti-CD9
(1:200, clone C4, cat. no. sc-13118, Santa Cruz Biotechnology,
Inc.), mouse anti-β-actin (1:2,000, clone C4, cat. no. 0869100-CF,
MP Biomedicals, Santa Ana, CA, USA), rabbit anti-Alix (1:1,000,
clone EPR15314-33, cat. no. ab186429, Abcam), mouse anti-TSG101
(1:500, clone 4A10, cat. no. ab83, Abcam), rabbit anti-Syntenin
(1:5,000, clone EPR8102, cat. no. ab133267, Abcam), goat
anti-Calnexin (1:2,500, cat. no. WA AF1179a, Biomol, Hamburg,
Germany), mouse anti-TGFBR2 (1:300, clone D2, cat. no. sc-17799,
Santa Cruz Biotechnology, Inc.), rabbit anti-Smad2 (1:1,000, clone
86F7, cat. no. 3122S, Cell Signaling Technology, Inc., Danvers, MA,
USA), and rabbit anti phosphorylated (p)Smad2 (1:1,000, Ser465/467,
cat. no. 3101, Cell Signaling Technology, Inc.). The primary
antibodies were diluted in 5% milk/TBST and incubated with
membranes overnight at 4°C. The blots were then washed with TBST
and incubated with a sheep anti mouse IgG HRP (1:5,000, cat. no.
NXA931, GE Healthcare, Chicago, IL, USA), goat anti rabbit IgG HRP
(1:2,500, cat. no. 7074, Promega Corporation, Madison, WI, USA) or
donkey anti goat HRP (1:1,000, cat. no. sc 2020, Santa Cruz
Biotechnology, Inc.) secondary antibody for 1 h at room
temperature. The signals were detected using Western Lightning Plus
ECL (Perkin Elmer, Inc., Waltham, MA, USA) and a ChemiDoc MP system
(Bio Rad Laboratories, Inc.).
RNA extraction and quality control
Total RNA was extracted from the EVs and parental
cells using the miRNeasy Mini kit (Qiagen GmbH). The cells and EVs
were homogenized in 700 µl QIAzol Lysis Reagent (Qiagen
GmbH) and total RNA was isolated according to the manufacturer's
instructions. RNA was eluted in 30 µl RNase-free water. The
yield and size distribution of the isolated RNAs were assessed by
capillary electrophoresis using the RNA Nano and RNA 6000 Pico kit
on the 2100 Bioanalyzer (Agilent Technologies GmbH, Waldbronn,
Germany). Integrity values for cellular RNAs were calculated using
the Bioanalyzer's RNA integrity number (RIN) algorithm. The RIN
algorithm is designed to estimate RNA quality for eukaryotic cells
but cannot be used for quality assurance of EV RNA due to lack of
full-length 28S and 18S rRNA. For reverse
transcription-quantitative polymerase chain reaction (RT-qPCR)
analysis, the RNA concentrations were determined using a NanoDrop
instrument (Thermo Fisher Scientific, Inc.).
Library preparation and small RNA
sequencing
The total RNA eluates (30 µl) were
vacuum-evaporated and resuspended in 8 µl nuclease free
water. For small RNA library preparation, 6 µl of total RNA
and the NEBNextMultiplex Small RNA Library Prep Set for Illumina
(New England BioLabs, Ipswich, MA, USA) were utilized according to
the manufacturer's instructions, including recommended adjustments
for low RNA input. The PCR products were purified using the
MinElute PCR Purification kit (Qiagen GmbH) prior to library
evaluation using the DNA 1000 kit (Agilent Technologies GmbH) and
the Bioanalyzer 2100. To allow size selection of miRNA-containing
fragments at a length of 130-150 base pairs, the pooled library was
separated on a high-resolution 4% agarose gel (MetaPhor Agarose,
Lonza Rockland, Rockland, ME, USA) at 150 V at 4°C, and the
corresponding bands were cut from the gel. Following gel extraction
with the MinElute Gel Extraction kit (Qiagen GmbH), capillary gel
electrophoresis was performed using the Bioanalyzer DNA High
Sensitivity kit (Agilent Technologies GmbH) to control for the size
and purity of the final library. Small RNA sequencing was conducted
on a HiSeq 2500 using the HiSeq Rapid SBS Kit v2 (Illumina, Inc.,
San Diego, CA, USA) and 50 cycles of single-end
sequencing-by-synthesis.
Data analysis
Raw data was imported into FastQC software (Babraham
Bioinformatics, Cambridge, UK, version 0.11.7) to evaluate
technical sequencing parameters including the per base sequence
quality, indicated by the Phred quality score, and sequence length
distribution (17). Adaptor
sequences added to the 3'-end during library preparation were
trimmed using Btrim (18). Reads
with a length of <16 nucleotides ('Short') were excluded to
avoid false positive mappings. Reads corresponding to other RNA
classes [ribosomal ('rRNA'), small nuclear ('snRNA'), small
nucleolar (snoRNA)' and transfer ('tRNA')] were identified by
mapping to sequences obtained from RNAcentral, v9 (19), and omitted in subsequent analyses.
The filtered reads were then aligned to human miRNA precursor
sequences obtained from miRBase, release 22 (20), allowing for one mismatch using
Bowtie (21). The unmapped reads
were classified as 'Unmapped' and disregarded. The read count table
generated by the sum of the hits per miRNA sequence was loaded into
R (version 3.5.1; https://www.rproject.org/) and used as input for the
Bioconductor package DESeq2 (version 1.20.0; https://bioconductor.org/packages/release/bioc/html/DESeq2.html)
(22). Differential gene
expression (DGE) analysis was conducted to evaluate the regulation
of gene expression in a TGFBR2 dependent manner. Fold changes (dT
EVs/pT EVs and dT cells/pT cells) were log2-transformed for
statistical data analysis. The obtained P values were adjusted for
multiple comparisons according to Benjamini and Hochberg (23). The baseMean of each miRNA, which
reflects the mean expression across all samples, was set to ≥20
reads. An adjusted P-value (p-adj) of P≤0.05 and a log2 fold change
(FC)≥|0.585| were applied as cut off values. For further
calculation and visualization of the DESeq2 results, the following
packages were used: data.table, RColorBrewer, gplots, ggplot2,
genefilter, ggfortify, VennDiagram, dendextend, reshape2, and
scales. Outliers were detected using Cook's distance test (22). Exploratory data analysis was
performed by displaying the regularized logarithm transformed data
in principal component analysis (PCA), heatmap analysis, and
hierarchical clustering by Euclidean distances. Interaction network
analysis was performed using miRNet (https://www.mirnet.ca) (24) based on conventional hypergeometric
tests and the Reactome pathway database (https://reactome.org) (25).
RT-qPCR analysis
Total RNA (100 ng) was subjected to RT reactions
using the miRCURY LNA RT kit (Qiagen GmbH) according to the
manufacturer's protocol. UniSp6 was used as a spike-in control. For
real-time PCR analysis, the cDNA products were diluted 1:10 (v/v)
in nuclease-free water. qPCR was performed in a total volume of 10
µl using the miRCURY LNA SYBR Green PCR kit (Qiagen GmbH).
The following miRCURY LNA miRNA PCR Assay primers (Qiagen GmbH)
were used: hsa-miR-376a-3p (cat. no. YP00204508), hsa-miR-381-3p
(cat. no. YP00205887), hsa-miR-379-5p (cat. no. YP00205658),
hsa-miR-181a-2-3p (cat. no. YP00204142), hsa miR 30d 5p (cat. no.
YP00206047), hsa miR 362 3p (cat. no. YP00205612), hsa miR-92b-3p
(cat. no. YP00204384), hsa-miR-25-3p (cat. no. YP00204361) and hsa
miR-744-5p (cat. no. YP00204663). Nuclease free water was used as a
no template negative control. Each PCR was performed in triplicate
on a StepOnePlus Real-Time PCR system (Thermo Fisher Scientific,
Inc.) at 95°C for 2 min, followed by 40 cycles of 95°C for 10 sec
and 56°C for 1 min. The specificity of amplification was assessed
by melting curve analysis. Raw quantification cycle (Cq) values
were generated and data were analyzed using StepOnePlus software
(version 2.1; Thermo Fisher Scientific, Inc.). The baseline was set
automatically and the threshold values were adjusted manually.
Relative quantification was conducted using the 2−∆∆Cq
method (26,27). Reference candidates stably
expressed across all replicates of EVs and parental MSI cells were
identified from next generation sequencing data using NormFinder
(https://moma.dk/normfindersoftware)
(28) and GeNorm (https://genorm.cmgg.be) (29). miR-30d-5p, miR-362-3p, miR-744-5p,
and miR-92b-3p and miR-25-3p were used as endogenous controls for
normalizing target miRNA expression levels in EVs and MSI cells,
respectively. Five significantly regulated miRNAs were selected for
validation (cells: miR-381-3p, miR-379-5p and miR-181a-2-3p; EVs:
miR-381-3p and miR-376a-3p). Statistical significance (P≤0.05) was
assessed using Student's t-test.
Statistical analysis
Statistical calculations were performed in SigmaPlot
(version 11.0; Systat Software, San Jose, CA, USA), R software
(version 3.5.1) and Prism (version 7.00; GraphPad Software, Inc.,
La Jolla, CA, USA). The quantitative miRNA expression levels
identified by RNA-Seq were compared between the dT and pT samples
using the Bioconductor Package DESeq2 (version 1.20.0). Fold
changes (dT EVs/pT EVs and dT cells/pT cells) were log2 transformed
for statistical data analysis and the obtained P values were
adjusted for multiple comparisons according to Benjamini and
Hochberg (23). A p-adj of P≤0.05
and a log2FC≥|0.585| were applied as cut-off values. For the qPCR
data, statistical significance between the quantitative miRNA
expression levels was assessed using an unpaired, two-tailed
Student's t-test. P≤0.05 was considered to indicate a statistically
significant difference. Data in the text and in tables are
presented as the mean ± standard deviation.
Results
General extracellular vesicle
characteristics are not altered by the cellular expression of
TGFBR2
In order to investigate TGFBR2-dependent alterations
in MSI tumor cells and their secreted EVs, the well-characterized
HCT116-TGFBR2 cell line was used as a model system (15). In the absence of dox, HCT116-TGFBR2
cells are TGFBR2 deficient (-dox, dT), which reflects the condition
of most primary MSI tumors that have lost receptor expression
during tumor progression. By contrast, in the presence of dox,
these cells show reconstituted receptor expression (+dox, pT),
which allows the identification of TGFBR2-dependent alterations in
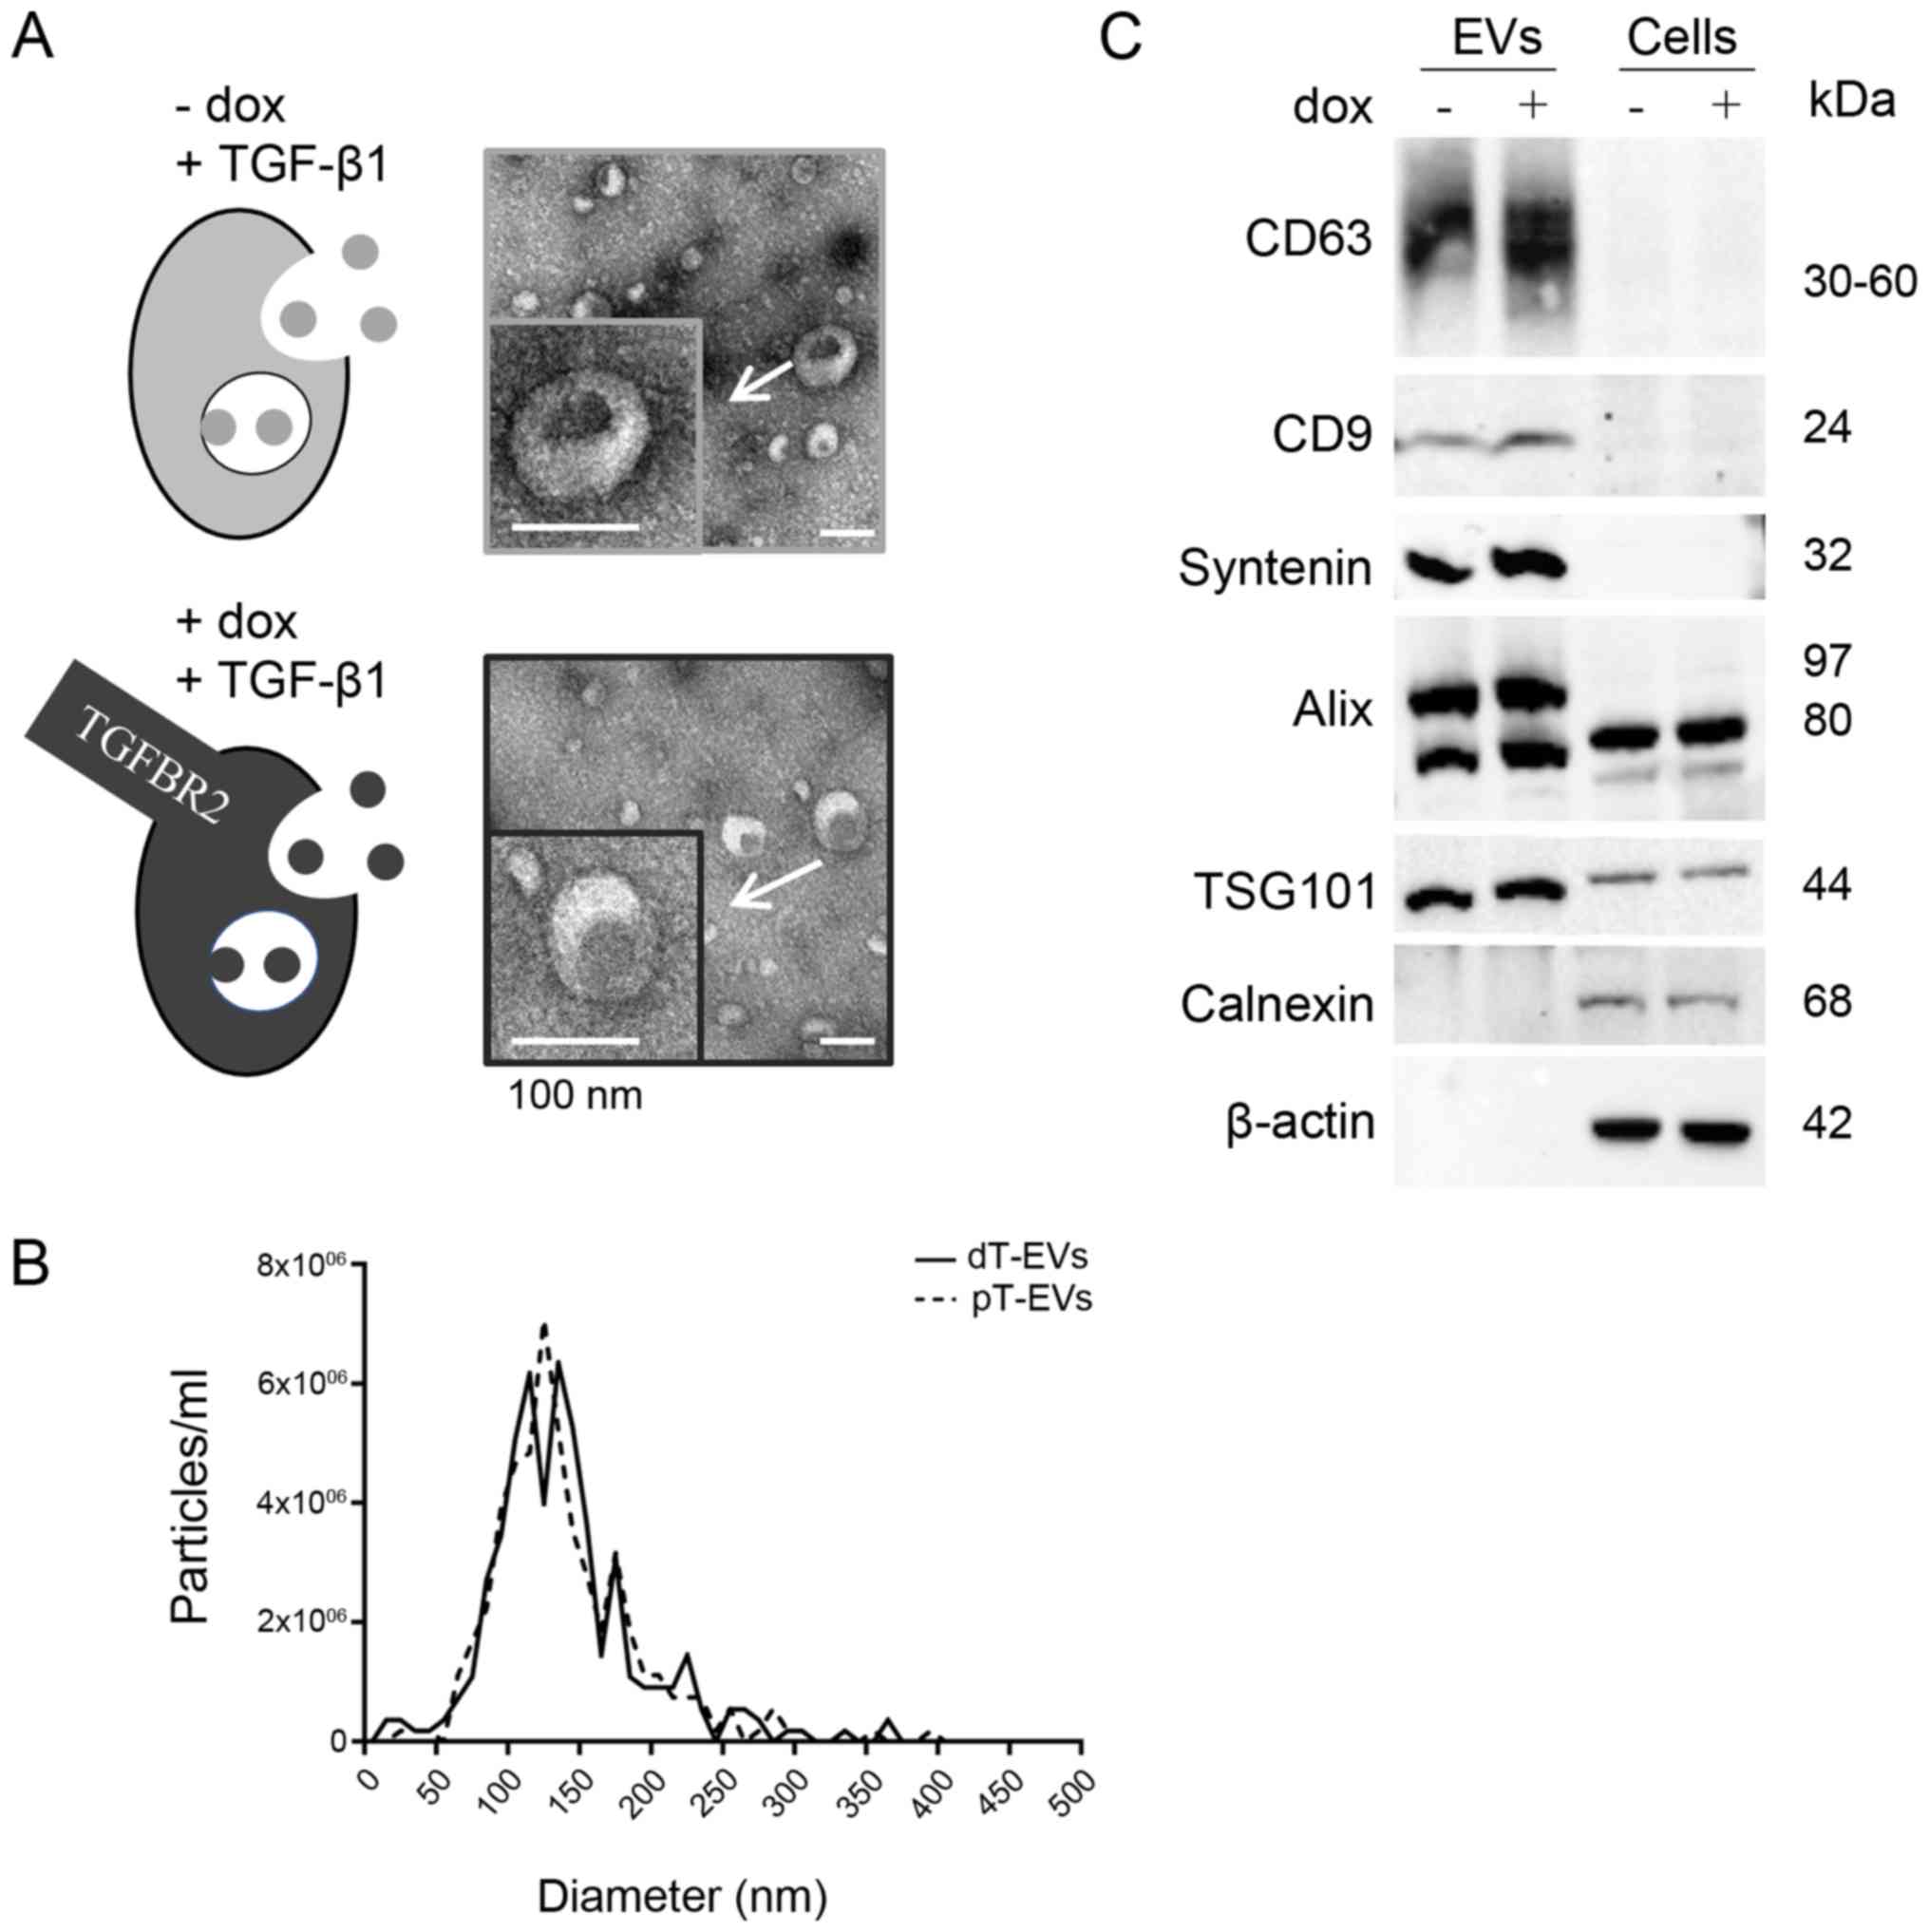
an isogenic background. Prior to EV preparation, reconstitution of
a functional TGF-β pathway was examined by Western blot analysis
(Fig. S1). In the absence of dox
and in the presence of the TGF-β1 ligand, the HCT116-TGFBR2 cells
lacked TGFBR2 expression and pSmad2 was almost undetectable.
However, in the presence of dox and the ligand, these cells showed
reconstituted expression of TGFBR2 and downstream signaling, as
demonstrated by the activation of pSmad2. Following establishment
of the induction control, the EVs were isolated from the pT cells
and dT cells, and their morphology, size, concentration and EV
marker protein expression were assessed by different methods
(Fig. 1) in compliance with the
MISEV2018 recommendations (30).
First, using TEM, single EVs appeared as round, cup shaped, lipid
bilayer-enclosed structures within a size range of 30-150 nm in all
preparations (Fig. 1A). Second,
NTA analysis independently confirmed the observed size distribution
of 127.6 nm (mean 139.5±52.3 nm) for dT EVs and 124.5 nm (mean
140.6±52.4 nm) for pT EVs (Fig.
1B). The initial particle concentrations were calculated,
resulting in 4.6x10⁴ (dT EVs) and 4.5×10⁴ (pT
EVs) particles per ml cell culture supernatant. Third, Western blot
analysis revealed the expression of EV specific and cell specific
marker proteins (Fig. 1C).
Tetraspanins CD63 and CD9 were expressed in lysates of the EVs but
not in lysates of the parental cells. The EV marker protein
Syntenin was also found to be exclusively detected in EV lysates.
TSG101 and Alix were enriched in the protein lysates of EVs
compared with those of their parental cells. The endoplasmic
reticulum protein Calnexin and cytoskeletal β actin served as
controls. Both were detected in the cell lysates but not in the EV
lysates, excluding any contamination of EV lysates with cellular
debris. These results demonstrate the successful enrichment of a
comprehensively characterized population of EVs from dT cells and
pT cells, and showed the reproducibility of EV isolation, thus
enabling subsequent analysis of miRNA profiles in a
TGFBR2-dependent manner.
Technical assessment reveals high RNA
quality and sequencing accuracy
Subsequently, total RNA was isolated from four
biological replicates of dT cells and pT cells and from the dT EVs
and pT EVs derived thereof. For comparative RNA-Seq analysis, high
quality RNA of sufficient quantity is of utmost importance. When
total cellular RNA was analyzed by capillary electrophoresis,
similar levels of RNA were detected in pT cells (1.9±1.0 µg)
and dT cells (2.3±1.2 µg). Subsequent examination of the EVs
shed by these cells revealed lower and marginally different yields
of RNA from pT EVs (344.8±129.6 ng) and dT EVs (254.4±107.2 ng)
(Table I). Further control of RNA
integrity resulted in a mean RINs of 9.98±0.05 (pT cells) and
9.85±0.13 (dT cells), indicating an RNA quality of high grade
(Table I). Small RNA was then
profiled by RNA-Seq. Based on this analysis, all samples had a
Phred score ≥38 (mean 39.04), reflecting a high sequencing accuracy
(31). The length distribution of
the sequencing data exposed a mono peak at 22 nucleotides in all
groups (Fig. S2). Libraries of
5.56×10⁶±6.40×10⁵ (pT cells),
5.47×10⁶±6.87×10⁵ (dT cells),
6.95×10⁶±1.28×10⁶ (pT EVs) and
6.10×10⁶±5.11×10⁵ (dT EVs) reads were
generated (Table I). Although
sequencing of RNA from EVs resulted in higher read counts compared
with that of cellular RNA, the TGFBR2 expression status did not
significantly alter the library size (Table I; Fig. S2).
 | Table ITechnical assessment of small RNA
sequencing. |
Table I
Technical assessment of small RNA
sequencing.
| Technical
parameter | Parental MSI cells
| EVs
|
|---|
| pT cells | dT cells | pT EVs | dT EVs |
|---|
| RNA (ng) ± SD |
1,914.4±1,000.6 | 2,304.8±
1,202.4 | 344.8±129.6 | 254.4±107.2 |
| RIN ± SD | 9.98 ±0.05 | 9.85±0.13 | NA | NA |
| Libraries (reads) ±
SD |
5.56×10⁶±6.40×10⁵ |
5.47×10⁶±6.87×10⁵ |
6.95×10⁶±1.28×10⁶ |
6.10×10⁶±5.11×10⁵ |
| miRNA reads
(%) | 63 | 64 | 61 | 63 |
| Total miRNAs
(reads) ± SD |
3.5×10⁶±3.6×10⁵ |
3.5×10⁶±4.8×10⁵ |
4.2×10⁶±8.4×10⁵ |
3.8×10⁶±4.8×10⁵ |
| Numbers of
miRNAs | 360 | 357 | 380 | 367 |
Subsequently, the reads were mapped to distinct
classes of small non coding RNAs (Fig.
2). Although the cells showed a higher amount of snoRNA, the
mapping distribution indicated an enrichment of tRNA and snRNA in
the EVs. Reads mapping to miRNAs accounted for the major proportion
(60.6 63.9%) of all reads in all four groups (Fig. 2, Table
I). In particular, 3.5×10⁶±3.6×10⁵ (pT
cells), 3.5×10⁶±4.8×10⁵ (dT cells),
4.2×10⁶±8.4×10⁵ (pT EVs) and
3.8×10⁶±4.8×10⁵ (dT EVs) reads mapped to
miRNAs (Table I). Following
application of an expression threshold of at least 20 reads per
replicate for each miRNA, similar numbers of individual miRNAs were
identified in all four groups (Table
I). Taken together, these analyses indicated a high RNA quality
and sequencing accuracy, allowing further investigation of
TGFBR2-dependent miRNA profiles in EVs and parental MSI tumor
cells.
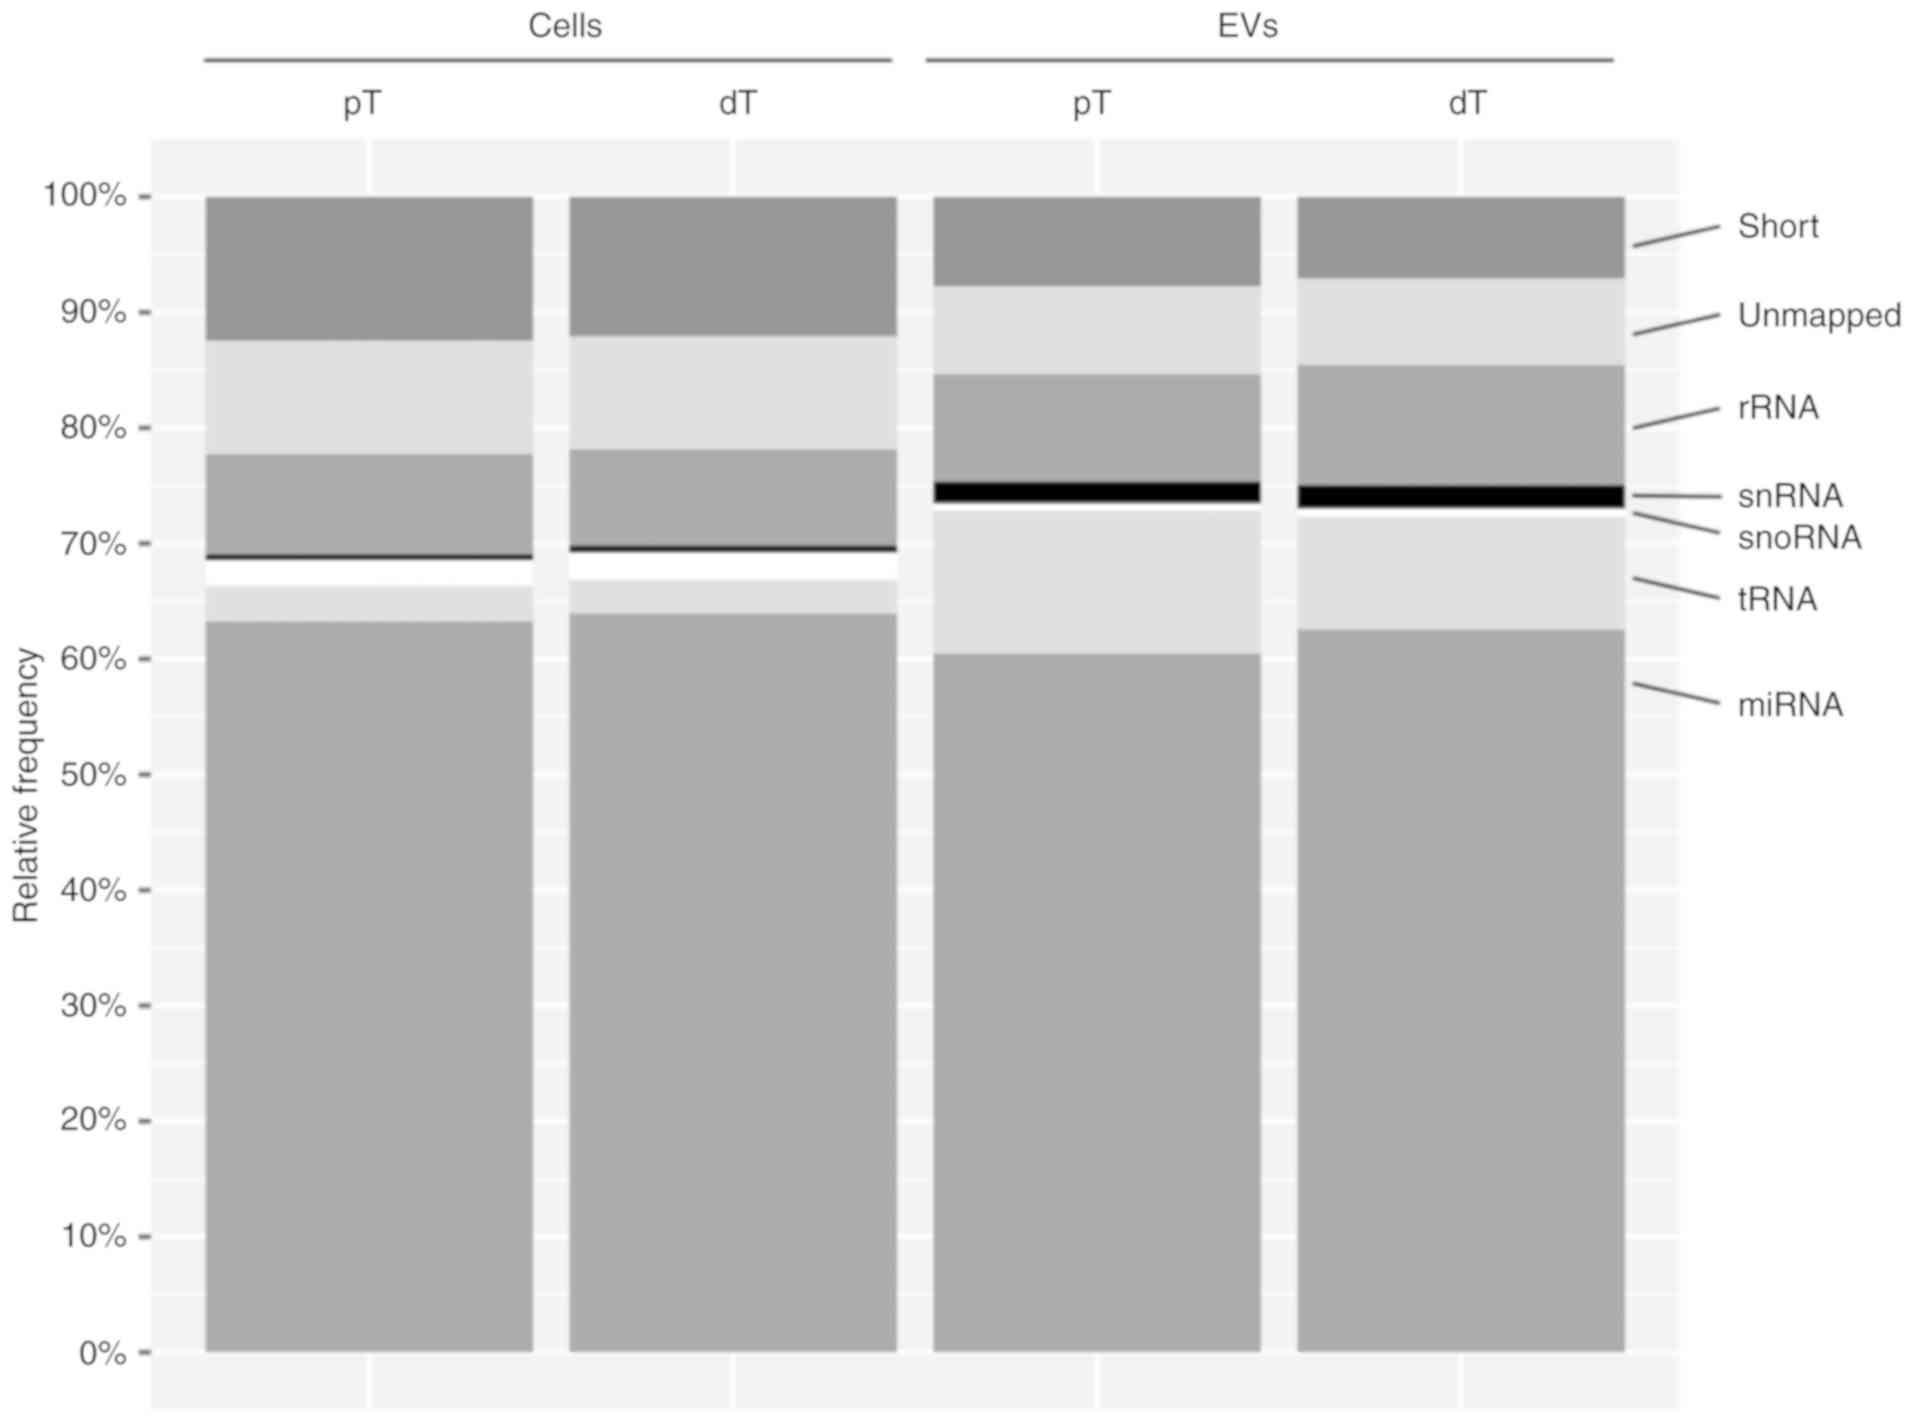 | Figure 2Mapping statistics for different
classes of small non-coding RNA. Data are expressed as the mean
mapping percentages (relative frequency) calcu lated from four
biological replicates of pT cells and EVs and dT cells and EVs.
Short, sequence <16 nt long; unmapped, sequence did not align to
human small RNA; rRNA, ribosomal RNA; snRNA, small nuclear RNA;
snoRNA, small nucleolar RNA; tRNA, transfer RNA; miRNA microRNA;
dT, TGFBR2 deficient; pT, TGFBR2 proficient; TGFBR2, transforming
growth factor-β receptor type 2; EVs, extracellular vesicles. |
Clustering of miRNA profiles is
determined by the expression of TGFBR2
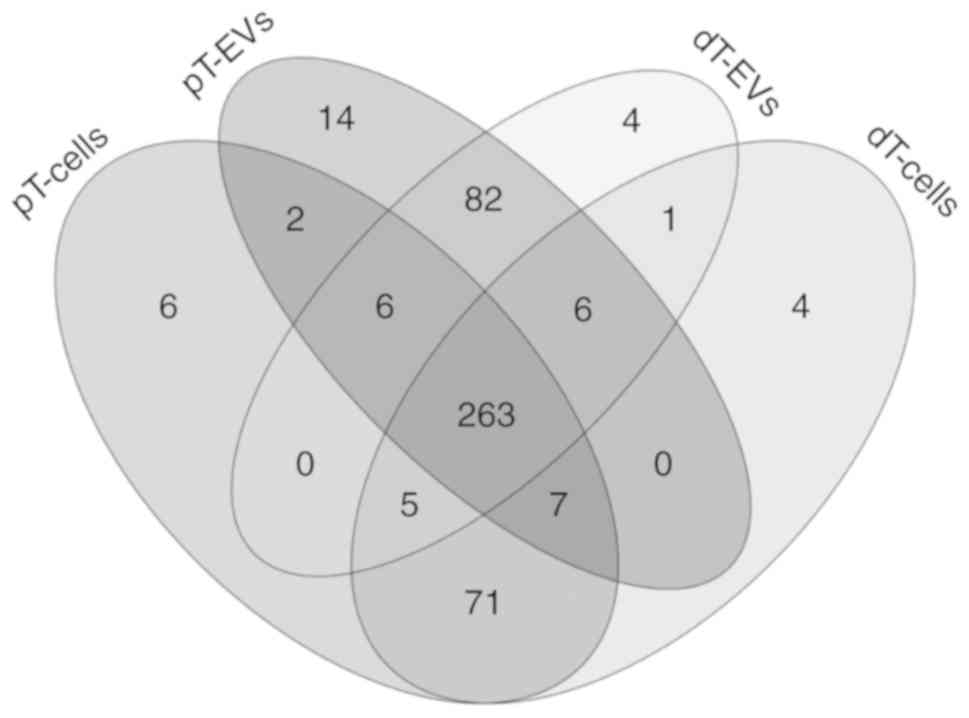
A total of 471 distinct miRNAs were identified among
all four groups at a qualitative expression level. Venn diagram
comparison showed the presence of individual and shared miRNA
subsets among these groups (Fig.
3). The majority (263/471; 56%) of the identified miRNAs were
shared between the EVs and parental MSI tumor cells.
In addition to this overlap, 100 miRNAs were
exclusively detected in the EVs, of which 82 candidates were
identified in both dT EVs and pT EVs. Several miRNAs were
exclusively expressed in the dT EVs (n=4; miR-122-5p, miR 92a 1 5p,
miR-1343-3p and miR 146b 3p) or pT EVs (n=14; miR-20b-5p,
miR-616-5p, miR-19b-1-5p, miR-561-3p, miR-539-3p, miR-382-3p,
miR-6516-3p, miR-3136-5p, miR-96-3p, miR-3140-3p, miR-1249-3p,
miR-106a-5p, miR-548ai/-570-5p and miR-3065-5p).
By contrast, 81 miRNAs were exclusively detected in
the MSI tumor cells, of which 71 miRNAs were detected in both dT
and pT cells. TGFBR2-dependent unique expression clusters were also
identified in the dT cells (n=4; miR-4429, miR-2355-3p, miR-320e
and miR-371a-5p) and pT cells (n=6; miR-505-5p, miR-411-5p,
miR-223-3p, miR-5001-5p, miR-184 and miR 495 3p).
One candidate, miR-200c-5p, was identified in both
the dT EVs and dT cells but was not detected in samples derived
from the TGFBR2-proficient condition. By contrast, two candidates
(miR-323a-3p and miR-382-5p) were only identified in the pT EVs and
parental pT cells.
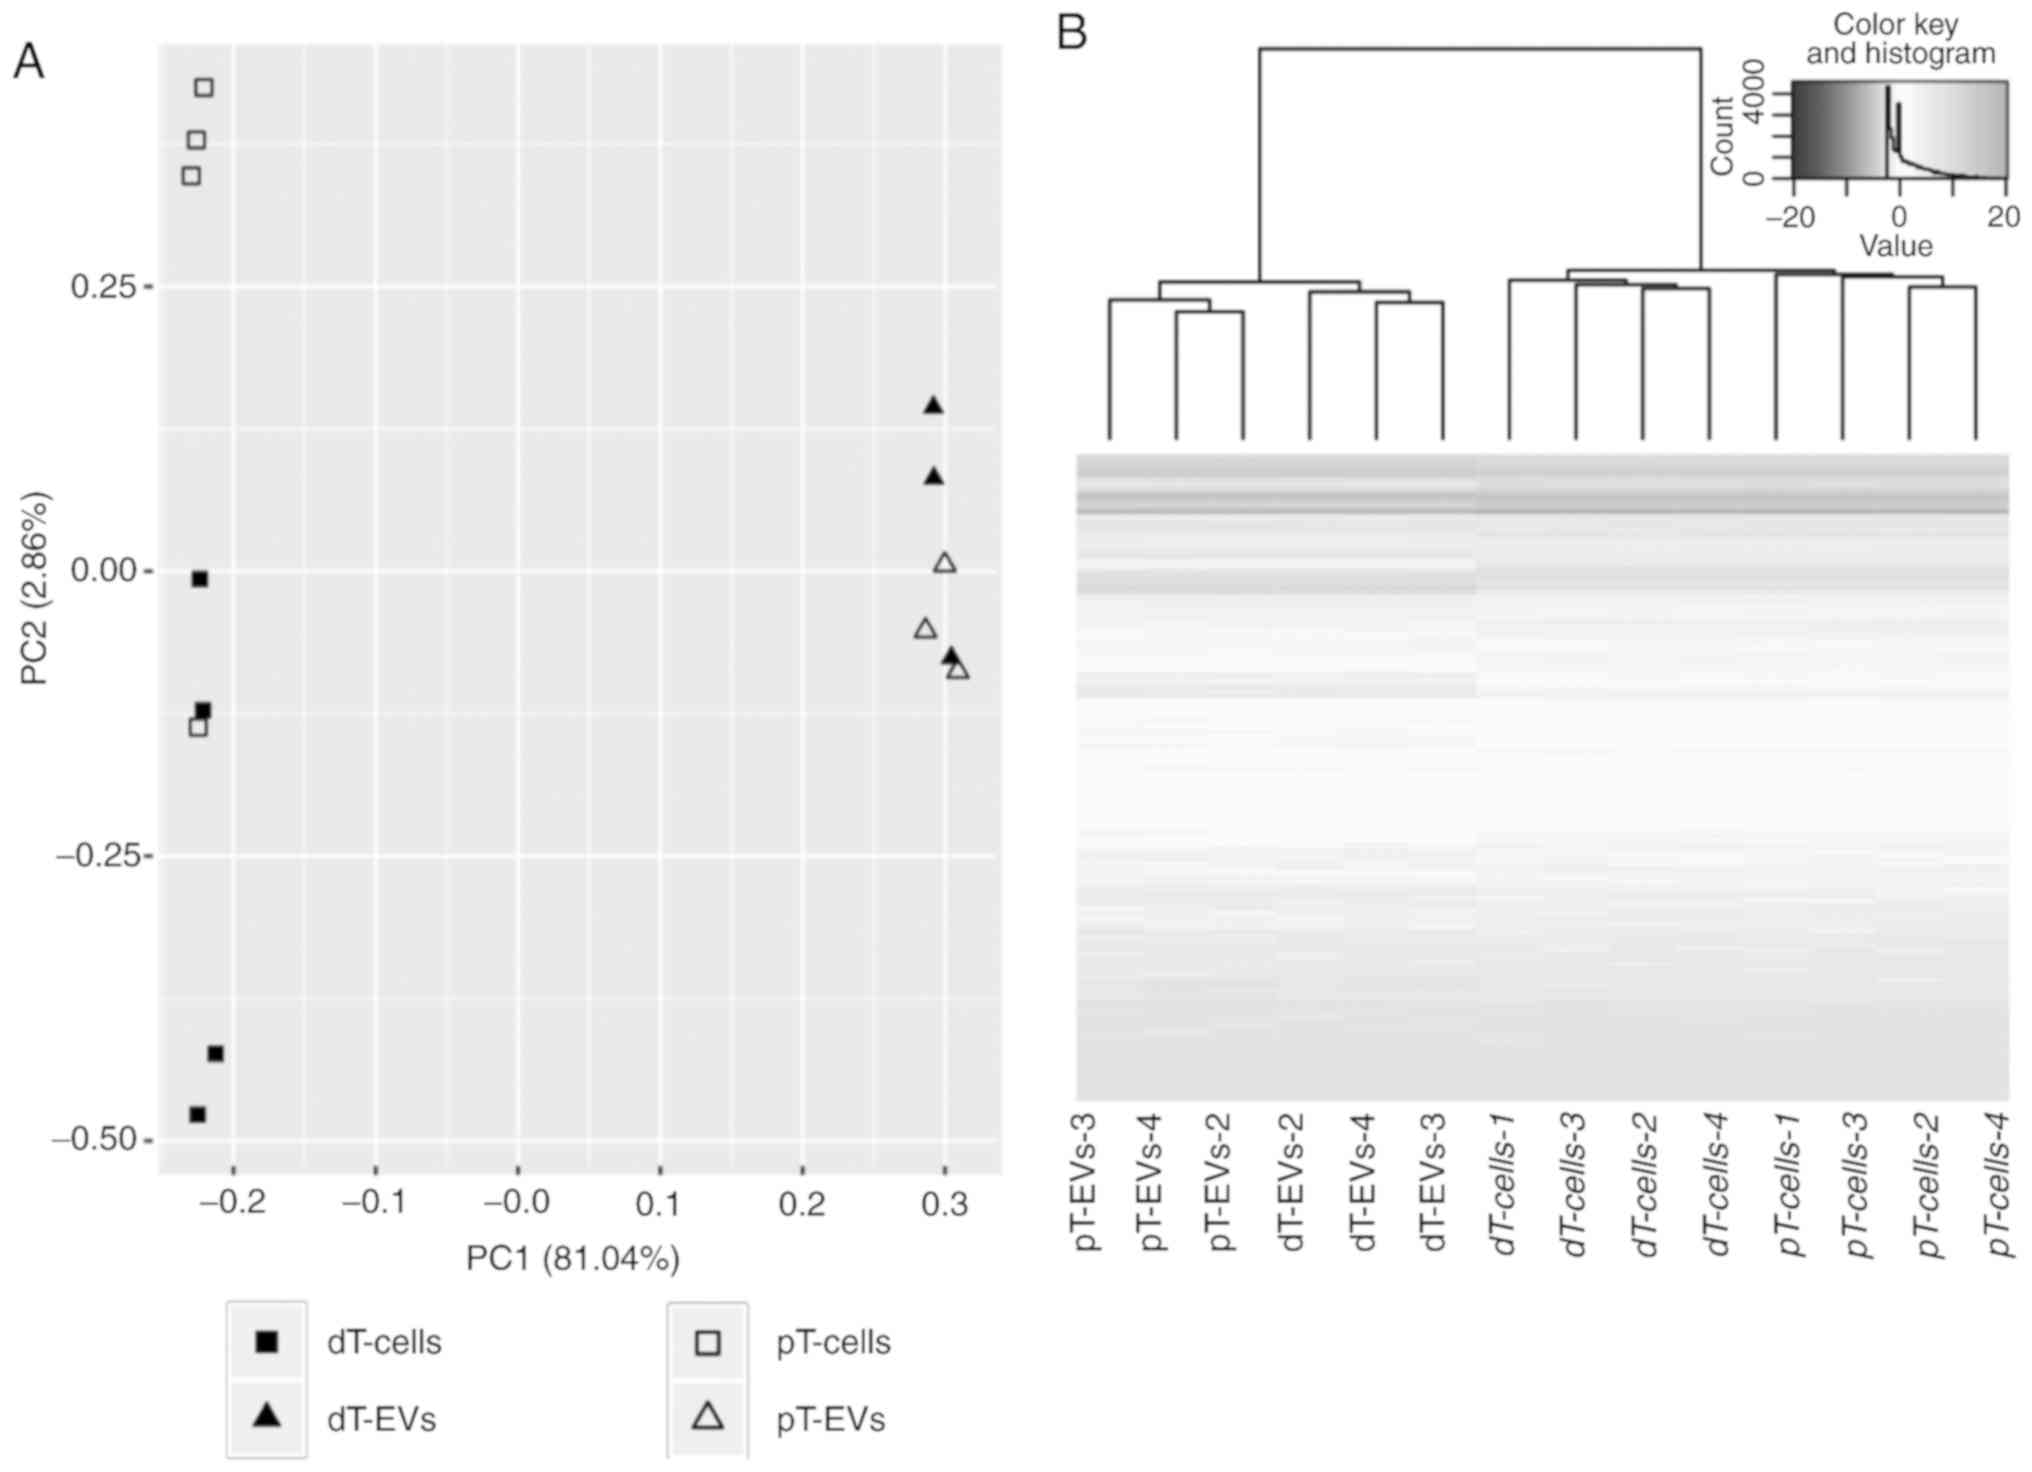
Based on these results, exploratory data analysis
was performed to assess the clustering of individual samples.
Hierarchical cluster analysis (HCA) and principal component
analysis (PCA) identified one of the four biological replicates in
the EV group as an outlier. The altered miRNA expression pattern of
this outlier (EV_V1) was also indicated by Cook's distance test
(22) and was thus excluded from
further analysis. As shown in Fig.
4A, PCA clearly separated all biological replicates of the EVs
from the parental MSI cells along the first principal component
(PC1) with a variance of 81.04%. This clustering indicated
substantial differences in the expression of miRNAs between the EVs
and parental cells. The second principle component (PC2) accounted
for 2.68% of the overall variance. The distances of miRNA
expression were higher between the EVs and parental cells than
between TGFBR2 conditions within one sample category. In addition
to PCA, miRNA expression was analyzed by HCA (Fig. 4B). The HCA dendrogram showed a
distinct fractionation of cells and EVs in addition to visible
cluster distinction depending on the TGFBR2 expression status. The
heatmap illustrated clear cluster changes in miRNAs between EVs and
their parental cells (Fig. 4B).
Considering the grouping performance of PCA and HCA, the miRNA
profiles of the EVs and the cells differed in a TGFBR2 dependent
manner.
TGFBR2 deficiency modulates miRNA
profiles in EVs and MSI tumor cells
In the subsequent step, differential gene expression
analyses were performed to quantify miRNA candidates with
significant TGFBR2 mediated expression differences. Sequencing data
were subjected to DESeq2 analysis in order to compare miRNA
expression between the dT and pT conditions in EVs and parental
cells separately. Fold changes (dT/pT) were calculated to quantify
the differential expression patterns. Applying stringent filtering
criteria (log2FC≥|0.585|, adj. P≤0.05, mean expression ≥20 reads),
DESeq2 analysis revealed TGFBR2-regulated miRNAs in HCT116 TGFBR2
cells and their EVs (Fig. 5).
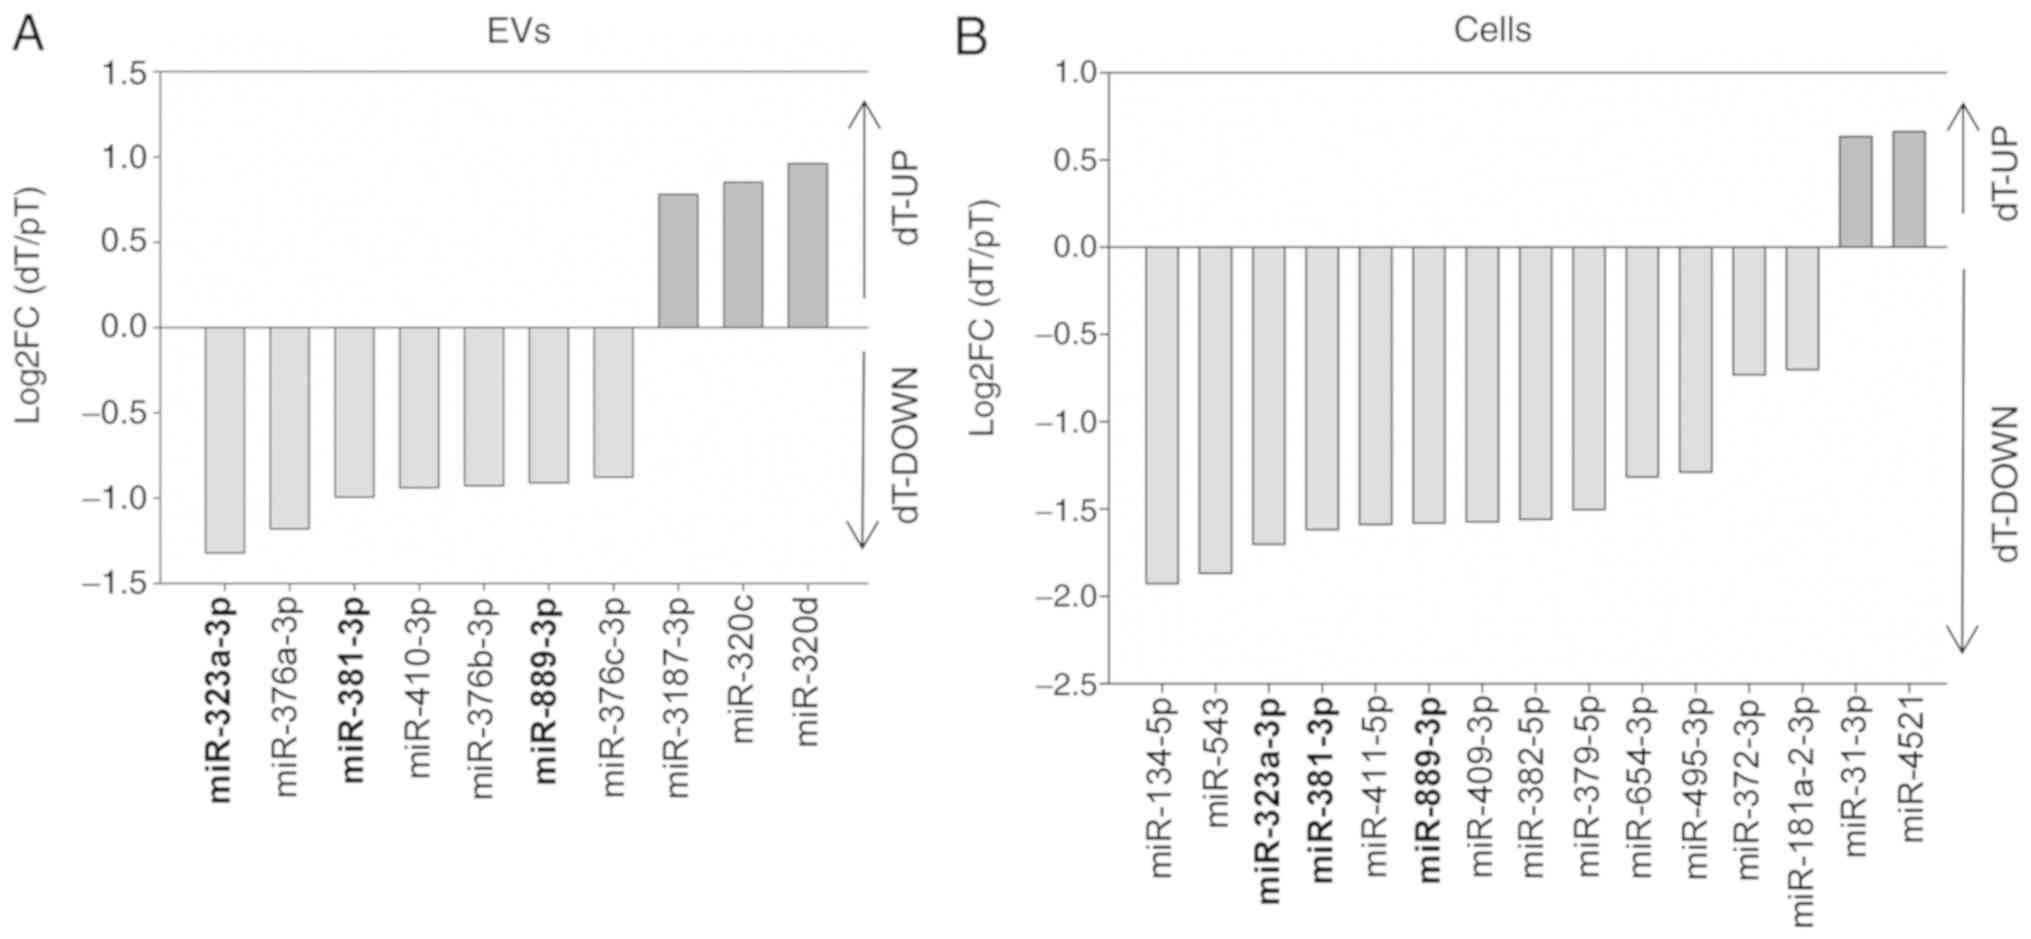
In the EVs, the expression of 10 miRNAs was regu
lated in a TGFBR2 dependent manner. Of the candidates, 7/10
(miR-376a-3p, miR-381-3p, miR-410-3p, miR-376c, miR-889-3p,
miR-323a-3p and miR-376b-3p) were downregu lated in the dT EVs, the
remaining 3/10 miRNAs (miR 320d, miR-320c and miR-3187-3p) were
upregulated in the dT EVs, as indicated by positive log2FC
(Fig. 5A, Table II). In silico network
analysis predicted interactions between these 10 TGFBR2 regulated
miRNAs and 1,022 target genes (Fig.
S3) (24). Subsequent
functional enrichment analysis revealed that signaling by the TGF β
receptor complex was the most affected (P=0.0002) pathway (Table SI). More specifically, among all
identified target genes, 18 candidates appeared to mediate signal
transduction downstream of TGFBR2.
| Table IITGFBR2 regulated candidates in EVs
and their parental MSI tumor cells. |
Table II
TGFBR2 regulated candidates in EVs
and their parental MSI tumor cells.
| miRNA | log2FC | p-adj | Mean
expression |
|---|
| EVs (n=10) | | | |
| miR-323a-3p | −1.32 | 0.0100 | 39.80 |
| miR-376a-3p | −1.18 |
2.46×10⁵ | 971.86 |
| miR-381-3p | −0.99 | 0.0004 | 810.97 |
| miR-410-3p | −0.94 | 0.0039 | 108.53 |
| miR-376b-3p | −0.93 | 0.0277 | 82.14 |
| miR-889-3p | −0.91 | 0.0071 | 115.66 |
| miR-376c-3p | −0.88 | 0.0065 | 145.53 |
| miR-3187-3p | 0.78 | 0.0253 | 142.28 |
| miR-320c | 0.85 | 0.0100 | 2,216.98 |
| miR 320d | 0.96 | 0.0059 | 3,474.59 |
| Parental MSI cells
(n=15) | | | |
| miR-134-5p | −1.93 |
5.81×10⁵ | 20.39 |
| miR-543 | −1.87 |
2.54×10¹⁷ | 75.29 |
| miR 323a 3p | −1.70 | 0.0005 | 20.47 |
| miR-381-3p | −1.62 |
1.23×1053 | 548.64 |
| miR-411-5p | −1.59 |
8.95×10⁶ | 33.38 |
| miR-889-3p | −1.58 | 0.0037 | 20.05 |
| miR 409 3p | −1.57 |
5.33×10²² | 237.54 |
| miR-382-5p | −1.56 |
3.55×10⁵ | 32.84 |
| miR 379 5p | −1.50 |
1.43×10⁻¹⁸ | 149.75 |
| miR 654 3p | −1.32 |
4.56×10⁵ | 37.48 |
| miR 495 3p | −1.29 | 0.0024 | 35.67 |
| miR 372 3p | −0.73 | 0.0299 | 52.31 |
| miR-181a-2-3p | −0.70 |
8.21×10¹² | 506.83 |
| miR 31 3p | 0.63 | 0.0019 | 140.31 |
| miR-4521 | 0.66 | 0.0192 | 109.83 |
When miRNA abundance in parental MSI cells was
examined, 15 miRNAs were regulated in a TGFBR2 dependent manner
(Fig. 5B). In particular, 2/15
miRNAs (miR 31 3p and miR-4521) were upregulated and 13/15 miRNAs
(miR-381-3p, miR-409-3p, miR-379-5p, miR-543, miR-181a-2-3p,
miR-411-5p, miR-382-5p, miR-654-3p, miR-134-5p, miR-323a-3p,
miR-495-3p, miR-889-3p and miR-372-3p) were downregulated in dT
cells (Table II). Apart from
these differences, three TGFBR2-dependent miRNAs (miR-381-3p,
miR-323a-3p and miR-889-3p) appeared to be downregulated in both dT
EVs (3/10) and dT cells (3/15) (Fig.
5).
Taken together, the tumor driver mutation affecting
TGFBR2 impacts the expression of 25 miRNAs (EV n=10; cells n=15).
From these 25 candidates, three candidates were downregulated in
both dT cells and their dT EVs, whereas the majority of TGFBR2
dependent miRNAs (19/25) were specifically regulated in MSI cells
and their secreted EVs.
Differential miRNA expression is mediated
by reconstituted expression of TGFBR2 rather than dox
treatment
To validate the TGFBR2-regulated miRNAs in the MSI
derived EVs, the expression levels of miR-381-3p and miR-376a-3p
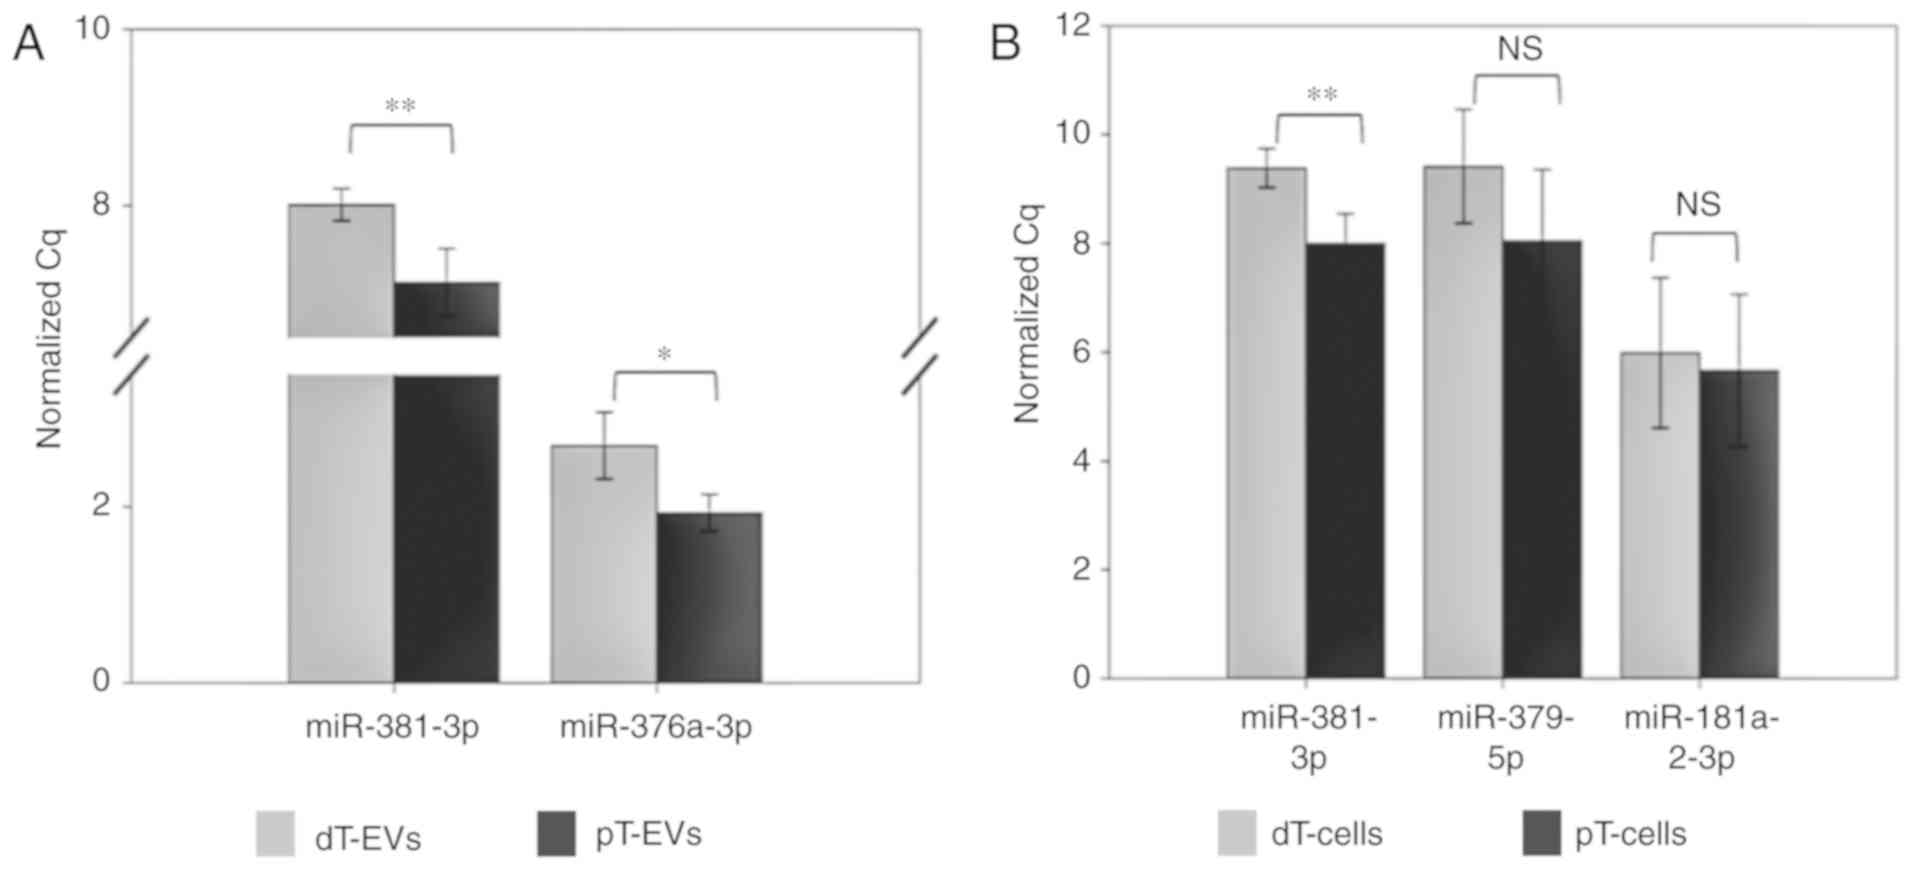
were examined by RT-qPCR analysis (Fig. 6A, Table III). With a FC of 0.55,
miR-381-3p exhibited significantly (P=0.006) lower expression in
the dT EVs. Similarly, miR 376a 3p exhibited significantly (FC
0.59; P=0.013) lower expression levels in the dT EV samples
compared with those in the pT EV samples, thereby confirming the
results of the small RNA-Seq analysis.
| Table IIITGFBR2 regulated gene expression and
the effect of doxycycline. |
Table III
TGFBR2 regulated gene expression and
the effect of doxycycline.
| miRNA | HCT116-TGFBR2 (FC)
| Control (FC)
RT-qPCR |
|---|
| NGS | RT-qPCR |
|---|
| Parental MSI
cells |
| miR-381-3p | 0.33 | 0.39 | 0.99 |
| miR-379-5p | 0.35 | 0.39 | 1.04 |
| miR-181a-2-3p | 0.61 | 0.80 | 1.04 |
| EVs |
| miR-381-3p | 0.50 | 0.55 | 1.05 |
| miR-376a-3p | 0.44 | 0.59 | 1.00 |
For validation of the TGFBR2 regulated miRNAs in the
parental MSI HCT116 TGFBR2 cells (Fig.
6B, Table III), the
expression levels of miR-381-3p, miR-379-5p and miR-181-2-3p were
investigated. A statistically significant (FC 0.39; P=0.005)
downregulation of miR-381-3p was found in the dT cells compared
with that in the pT cells. For the two cellular candidates,
miR-379-5p (FC 0.39; P=0.154) and miR-181a-2-3p (FC 0.80; P=0.745),
a trend towards lower expression in dT cells was observed, although
this was not statistically significant (Fig. 6B).
In order to investigate potential changes of miRNA
profiles caused by dox treatment, EVs were isolated from the +dox
and dox treated HCT116 Tet On control cells. Differential miRNA
expression was not observed in these control cells or their derived
control EVs (Table III), thus
excluding any dox-related effect on the identified and successfully
validated TGFBR2-dependent miRNA expression signatures in the EVs
and parental MSI tumor cells.
Discussion
The majority of cases of MSI CRC are affected by the
mutational inactivation of TGFBR2, allowing MSI tumor cells to
evade normal TGF β signaling and gain oncogenic growth advantages.
In an attempt to dissect the inherent complexity of molecular and
biological mechanisms associated with TGFBR2 signaling in normal
and tumor cells, the present study established a genetically
modified MSI CRC cell line, referred to as HCT116 TGFBR2. This MSI
model cell line allows inducible, reconstituted expression of a
wild type TGFBR2 transgene and controlled activation of
canonical TGF β signal transduction in an isogenic background
(15). As a consequence, the
downstream effects and modifications identified in the EV cargo can
be assigned specifically to the TGFBR2 expression status of MSI
cells. For example, our previous studies showed that the
reconstituted expression of TGFBR2 alters the glycophenotype of MSI
tumor cells (15,32,33),
and tumor driver induced glycome changes have been linked to TGFBR2
regulated genes (34).
Additionally, the reconstituted expression of TGFBR2 can cause
differential de novo protein expression (35). In addition to these
(glyco)proteomic changes of MSI cells, the reconstituted expression
of TGFBR2 can modulate the protein cargo of MSI derived small EVs
(14). Although TGFBR2 serves a
crucial role in the MSI pathway of CRC development and progression,
knowledge of the TGFBR2 dependent effects on the molecular cargo of
small EVs released by MSI tumor cells remains limited. The present
study provides evidence for TGFBR2 regulated miRNA expression
profiles in EVs and corresponding parental cells that exhibit the
MSI phenotype. Although gene expression differences between CRC and
normal tissues and CRC cells and their EVs have been identified
(36,37), the contribution of TGFBR2 to the
expression patterns of non-coding RNA in MSI tumor cells and shed
vesicles has not been investigated previously. Using
high-throughput small RNA-Seq and the well characterized HCT116
TGFBR2 model system, the present study identified 25 candidate
miRNAs (cells n=15; EVs n=10) for which differential expression
appears to be regulated in a TGFBR2-dependent manner. As TGFBR2
deficiency is a hallmark of the majority of primary MSI tumors and
is considered to be a MSI driver, those miRNAs with altered
expression upon TGFBR2 deficiency were of interest. In total, 56%
of the miRNAs were found to be expressed in all four groups. At a
qualitative level, this finding emphasizes the general overlap of
miRNA profiles between MSI CRC cells and their secreted EVs but
also indicated TGFBR2 dependent differences among these groups.
More refined and quantitative analysis by DESeq2 then provided
additional evidence for the impact of a single tumor driver
mutation on altering cellular and EV miRNA profiles. In particular,
TGFBR2 deficiency caused the upregulation and downregulation of
five and 20 miRNAs, respectively. In independent RT-qPCR
experiments, the differential expression of four TGFBR2 regulated
miRNAs (miR-381-3p, miR-376a-3p, miR-379-5p and miR-181a-2-3p) was
successfully validated. One of the validated candidates, miR-381-3p
was downregulated in both dT EVs and dT cells. Accordingly, it was
predicted that TGFBR2 deficiency leads to the downregulation of
miR-381-3p in vivo. Such altered expression levels are
expected to be of functional relevance and may contribute to
MSI-specific tumor characteristics.
Several studies have shown that miR-381-3p can play
a dual role in carcinogenesis. Depending on the cancer entity, it
can confer tumor promoting or suppressive effects (38,39).
For CRC, its expression was reported to be significantly
downregulated in primary tumor tissue compared with that in the
normal colon mucosa (36,40). As reported by Hu et al,
miR-381-3p is the only miRNA that targets the 3'-untranslated
region of both Twist and Snail mRNA in the colon epithelium
(41). TGFBR2-mediated TGF-β
signaling can trigger the expression of Twist and Snail and thereby
facilitate the conversion of epithelial cells into motile
mesenchymal cells (42,43). As miR-381-3p has an inhibitory
effect on epithelial-to-mesenchymal transition (EMT) through
targeting Twist and Snail in colon cells, it is predicted that MSI
tumors may gain invasive properties by downregulating miR-381-3p.
In agreement with this hypothesis, MSI tumors typically invade the
local tumor microenvironment (TME), have a lower propensity to
metastasize to distant tissues and have a more favorable prognosis
compared with microsatellite stable (MSS) phenotypes (44). Furthermore, liver metastases and
poor survival rates of patients with CRC have been linked to
elevated expression levels of miR-181a-2-3p (45,46),
which is a direct target of the TGF-β pathway (47). This is in line with the data
obtained in the present study demonstrating elevated expression
levels of miR-181a-2-3p in pT cells and decreased expression levels
in dT cells. Functional studies have shown that the restoration of
miR-381-3p hindered the migratory and invasive capacity and
proliferation of CRC cells by directly targeting LRH 1 and Twist 1
(36,40). Twist 1 can also be repressed by miR
134 5p (48), another candidate
downregulated in dT cells. It was described that the overexpression
of miR-134-5p resulted in repression of the proliferation and
growth of CRC cells (49). Our
previous study reported that the reconstitution of TGFBR2 in
HCT116-TGFBR2 cells significantly reduced cellular proliferation
(50). Based on the evidence
mentioned above, this decreased proliferation rate in pT cells may
at least partly be caused by elevated expression levels of
miR-381-3p and miR-134-5p (36,40,49).
However, the possibility that multiple factors account for the
altered proliferation rate cannot be excluded.
In gastric cancer, miR-381-3p and its target TMEM16A
has been shown to contribute to cell invasion by promoting TGF-β
secretion (51,52). TGF-β is a potent inducer of EMT and
thus serves a crucial role in cancer invasion, motility and
metastasis (53). miR-381-3p
suppressed TGF-β signaling and EMT moderately by targeting TMEM16A.
In this context, TGF β may operate as a mediator between
miR-381-3p, TMEM16A and EMT (52).
The process of EMT requires the tight control of cell junctions. It
was reported that the tight junction proteins occludin and zonula
occludens (ZO-1) are significantly higher expressed when miR-381-3p
is downregulated in intestinal epithelial cells (54). This is in agreement with our
previous proteomic study, which showed that ZO-1 was exclusively
expressed in dT EVs, which exhibited significantly lower expression
levels of miR-381-3p (14). This
correlation suggests a functional role of miR-381-3p in EVs, which
may contribute to the modulation of the TME by altering tight
junctions at local and more distant sites. Although emerging
evidence described the expression and functional relevance of
miR-381-3p in various tissues, its expression and biological role
in secreted EVs remains to be fully elucidated. Among other miRNA
candidates, increased levels of miR-381-3p have been detected in
small EVs isolated from TGF β1 stimlutated A549 human lung cancer
cells with a mesenchymal phenotype, compared with small EVs
isolated from untreated epithelial A549 cells or 16HBE human normal
bronchial epithelial cells (55).
In a previous study focusing on CRC, EVs were isolated from a
cohort of 100 patients with CRC (n=25 each of stages I-IV) and 50
healthy controls, and the EV RNA content was compared between the
two groups (56). Based on RNA-Seq
data, it was reported that the number of CRC associated miRNA
isoforms (isomiRs) detected in EVs isolated from patients with CRC
increased significantly with disease progression. Additionally,
isoforms of miR-381-3p were identified in the cargo of EVs with
significant differences between disease stages (56). In a follow up study, miR-381-3p and
two other TGFBR2 regulated candidates (miR-376a-3p and miR-320d)
were found to be downregulated in EVs isolated from patients with
stage I and II CRC compared with the expression levels detected in
EVs from healthy donors (57). In
the present study, the downregulation of miR-381-3p and miR-376a-3p
was detected in dT EVs, whereas higher expression levels of
miR-320d were detected in dT EVs. Similarly, elevated expression
levels of miR-320c were observed in dT EVs. Wang et al
reported that miR-320c was significantly upregulated in plasma EVs
from patients with early stage CRC (57). However, they did not include
information regarding the MSS and MSI status of the CRC patient
cohort, making it impossible to connect the observed changes in
expression to the MSI phenotype or lack of TGFBR2 expression. In
addition to miR-320c and miR-320d, the present study detected
increased expression levels of miR-3187-3p in dT EVs. Experimental
evidence suggests that miR-3178-3p is specifically sorted into
CRC-derived EVs, leading to elevated levels compared with cellular
miR-3178-3p expression (37).
Further evidence has shown that increased expression levels of
miR-3178-3p in the colonic epithelium can be caused by single
nucleotide polymorphisms affecting the TGFBR1 gene (58). In the present study, an association
between miR-3178-3p and TGFBR2 expression status was found.
However, the function of miR-3178-3p in the pathogenesis of CRC
remains to be elucidated.
By comparing miRNA expression levels between dT
cells and pT cells, two miRNAs (miR-4521 and miR-31-3p) were
upregulated in dT cells. It has been reported that miR-4521 is
significantly upregulated in colon cancer stem cells compared with
that in non stem cells (59). Of
note, TGF β signaling has emerged as key pathway for controlling
stem cell renewal and the differentiation of intestinal epithelial
cells (60). miR-4521-3p was also
upregulated in patients with inflamed colonic epithelium of colitis
ulcerosa (61). MSI colorectal
tumors are highly immunogenic tumors and are often characterized by
marked lymphocyte infiltration and inflammatory reactions (44). Therefore, it was hypothesized that
high levels of miR-4521-3p may favor the inflammatory environment
often observed in MSI tumors. The second candidate found to be
upregulated in dT cells, miR-31-3p, has also been associated with
intestinal inflammation (62).
Olaru et al suggested that the expression of miR-31-3p
increases during the progression of inflammation-associated
intestinal neoplasia (63).
Experiments have shown that miR-31-3p can repress the transcription
factor E2F2 that controls the expression of several TGF β target
genes, including survivin, c myc and cyclin A2 (64). Using an miRNA array, Nosho et
al reported higher expression levels of miR-31-3p/-5p in
BRAF (V600E) mutated CRC compared with BRAF wild-type
CRC (65). It was suggested that
high expression levels of miR-31 are associated with the MSI
phenotype, although they did not investigate the expression status
of TGFBR2. In the present study, it was shown for the first time,
to the best of our knowledge, that the upregulation of miR-31-3p
may positively correlate with TGFBR2 deficiency in MSI tumor cells.
In addition to being a potential MSI marker, other studies have
highlighted the potential of miR-31-3p as a predictive biomarker of
anti-epidermal growth factor receptor therapy efficacy for patients
with RAS wild type and metastatic CRC (66).
In conclusion, the present study linked the
regulation of 25 miRNAs in EVs and their MSI tumor cells to the
expression status of TGFBR2. Although the study did not investigate
which intracellular pathways downstream of TGFBR2 may affect the
differential miRNA expression, specific tumor driver-dependent
alterations in miRNA expression were identified in EVs and parental
MSI tumor cells by combining a well-defined dox-inducible model
system, a reproducible EV isolation protocol and high-throughput
small RNA-Seq. In general, the results emphasize the broad overlap
of miRNA content in EVs and their secreting cells. In particular,
this study highlights the impact of the recurrent MSI tumor driver
mutation affecting TGFBR2 on altering the miRNA signatures
of EVs and their parental MSI CRC cells.
Future investigations are required to determine
which intracellular pathways downstream of TGFBR2 caused the
observed differential miRNA expression patterns. Although the
TGF-/dox-mediated activation of canonical signaling was shown in
the model system, ligand binding can also stimulate several
non-canonical pathways downstream of the receptor that may have an
impact on miRNA regulation. This can be addressed in further
experiments by selectively targeting each of these different
pathways using specific inhibitors. In addition, the results of the
present study require confirma tion in additional MSI CRC cell
lines and the role of miRNA candidates in MSI tumorigenesis
requires assessment though functional studies.
Supplementary Data
Abbreviations:
|
p-adj
|
adjusted P-value
|
|
CRC
|
colorectal cancer
|
|
Cq
|
quantification cycle
|
|
DGE
|
differential gene expression
|
|
MMR
|
mismatch-repair
|
|
dox
|
doxycycline
|
|
dT
|
TGFBR2 deficient
|
|
EMT
|
epithelial-to-mesenchymal
transition
|
|
EV
|
extracellular vesicle
|
|
FU
|
fluorescent unit
|
|
HCA
|
hierarchical cluster analysis
|
|
log2FC
|
log2 fold change
|
|
miRNA
|
microRNA
|
|
MSI
|
microsatellite instability
|
|
MSS
|
microsatellite stability
|
|
NTA
|
nanoparticle tracking analysis
|
|
PCA
|
principal component analysis
|
|
pT
|
TGFBR2 proficient
|
|
rRNA
|
ribosomal RNA
|
|
RT-qPCR
|
reverse transcription-quantitative
polymerase chain reaction
|
|
RNA-Seq
|
RNA sequencing
|
|
snoRNA
|
small nucleolar RNA
|
|
snRNA
|
small nuclear RNA
|
|
TEM
|
transmission electron microcopy
|
|
TGFBR2
|
transforming growth factor-β receptor
type 2
|
|
TME
|
tumor microenvironment
|
|
tRNA
|
transfer RNA
|
Acknowledgments
The authors gratefully acknowledge Mrs. Ulrike
Ganserer (EM Lab, University Hospital Heidelberg), Mrs. Sigrun
Himmelsbach and Mrs. Vera Fuchs (Dept. of Applied Tumor Biology,
University Hospital Heidelberg) for their tech nical assistance,
Mr. Benedikt Kirchner (Dept. of Animal Physiology and Immunology,
Technical University of Munich) and Dr Christine Wurmser (Animal
Breeding, Technical University of Munich) for their support in
sequencing and processing small RNA libraries, and Claussen Simon
Stiftung for their encouragement.
Funding
This study was supported by intramural funding from
the Technical University of Munich (MP) and the University Hospital
Heidelberg (grant nos. F.204078 to JG and F.204008 to JK).
Availability of data and materials
Sequencing data were deposited in the European
Nucleotide Archive (ENA) under accession no. PRJEB30305 (http://www.ebi.ac.uk/ena/data/view/PRJEB30305)
(67). EV data were submitted to
the EV TRACK knowledgebase (http://evtrack.org/; EV track ID: EV180072) (68).
Authors' contributions
JG, JK, MP, FF, VM and DB designed the experiments.
FF, VM, IH performed the experiments. All authors contributed to
data analysis. JG, JK, MP, FF, VM and DB prepared the manuscript.
All authors have approved the final manuscript.
Ethics approval and consent to
participate
Not applicable.
Patient consent for publication
Not applicable.
Competing interests
The authors declare that they have no competing
interests.
References
|
1
|
Boland CR and Goel A: Microsatellite
instability in colorectal cancer. Gastroenterology.
138:2073–2087.e3. 2010. View Article : Google Scholar : PubMed/NCBI
|
|
2
|
Woerner SM, Benner A, Sutter C, Sutter C,
Schiller M, Yuan YP, Keller G, Bork P, Doeberitz Mv and Gebert JF:
Pathogenesis of DNA repair-deficient cancers: A statistical
meta-analysis of putative Real Common Target genes. Oncogene.
22:222622352003. View Article : Google Scholar : PubMed/NCBI
|
|
3
|
Markowitz S, Wang J, Myeroff L, Parsons R,
Sun L, Lutterbaugh J, Fan RS, Zborowska E, Kinzler KW, Vogelstein
B, et al: Inactivation of the type II TGF beta receptor in colon
cancer cells with microsatellite instability. Science.
268:1336–1338. 1995. View Article : Google Scholar : PubMed/NCBI
|
|
4
|
Massagué J: TGFβ signalling in context.
Nat Rev Mol Cell Biol. 13:616–630. 2012. View Article : Google Scholar
|
|
5
|
Butz H, Rácz K, Hunyady L and Patócs A:
Crosstalk between TGF β signaling and the microRNA machinery.
Trends Pharmacol Sci. 33:382–393. 2012. View Article : Google Scholar : PubMed/NCBI
|
|
6
|
Bartel DP: MicroRNAs: Genomics,
biogenesis, mechanism, and function. Cell. 116:281–297. 2004.
View Article : Google Scholar : PubMed/NCBI
|
|
7
|
Gebert LFR and MacRae IJ: Regulation of
microRNA function in animals. Nat Rev Mol Cell Biol. 20:21–37.
2019. View Article : Google Scholar :
|
|
8
|
Friedman RC, Farh KK, Burge CB and Bartel
DP: Most mamma lian mRNAs are conserved targets of microRNAs.
Genome Res. 19:92–105. 2009. View Article : Google Scholar :
|
|
9
|
Zhang J, Li S, Li L, Li M, Guo C, Yao J
and Mi S: Exosome and exosomal microRNA: Trafficking, sorting, and
function. Genomics Proteomics Bioinformatics. 13:17–24. 2015.
View Article : Google Scholar : PubMed/NCBI
|
|
10
|
Cantini L, Isella C, Petti C, Picco G,
Chiola S, Ficarra E, Caselle M and Medico E: MicroRNA mRNA
interactions under lying colorectal cancer molecular subtypes. Nat
Commun. 6:88782015. View Article : Google Scholar
|
|
11
|
van Niel G, D'Angelo G and Raposo G:
Shedding light on the cell biology of extracellular vesicles. Nat
Rev Mol Cell Biol. 19:213–228. 2018. View Article : Google Scholar : PubMed/NCBI
|
|
12
|
Bellingham SA, Shambrook M and Hill AF:
Quantitative Analysis of Exosomal miRNA via qPCR and Digital PCR.
Methods Mol Biol. 1545:55–70. 2017. View Article : Google Scholar
|
|
13
|
Mathieu M, Martin-Jaular L, Lavieu G and
Théry C: Specificities of secretion and uptake of exosomes and
other extracellular vesi cles for cell to cell communication. Nat
Cell Biol. 21:9–17. 2019. View Article : Google Scholar : PubMed/NCBI
|
|
14
|
Fricke F, Lee J, Michalak M, Warnken U,
Hausser I, Suarez Carmona M, Halama N, Schnölzer M, Kopitz J and
Gebert J: TGFBR2 dependent alterations of exosomal cargo and
functions in DNA mismatch repair-deficient HCT116 colorectal cancer
cells. J Cell Commun Signal. 15:142017. View Article : Google Scholar
|
|
15
|
Lee J, Ballikaya S, Schönig K, Ball CR,
Glimm H, Kopitz J and Gebert J: Transforming growth factor beta
receptor 2 (TGFBR2) changes sialylation in the microsatellite
unstable (MSI) Colorectal cancer cell line HCT116. PLoS One.
8:e570742013. View Article : Google Scholar : PubMed/NCBI
|
|
16
|
Welman A, Barraclough J and Dive C:
Generation of cells expressing improved doxycycline regulated
reverse transcrip tional transactivator rtTA2S-M2. Nat Protoc.
1:803–811. 2006. View Article : Google Scholar
|
|
17
|
Andrews S: FastQC: A quality control tool
for high throughput sequence data. Bioinformatics Babraham.
http://www.bioinformatics.babraham.ac.uk/projects/fastqc.
Accessed 18 Dec, 2018.
|
|
18
|
Kong Y: Btrim: A fast, lightweight adapter
and quality trim ming program for next-generation sequencing
technologies. Genomics. 98:152–153. 2011. View Article : Google Scholar : PubMed/NCBI
|
|
19
|
The RNAcentral Consortium; Petrov AI, Kay
SJE, Kalvari I, Howe KL, Gray KA, Bruford EA, Kersey PJ, Cochrane
G, Finn RD, et al: A comprehensive database of non coding RNA
sequences. Nucleic Acids Res. 45:D28–D134. 2017.
|
|
20
|
Kozomara A and Griffiths-Jones S: miRBase:
Annotating high confidence microRNAs using deep sequencing data.
Nucleic Acids Res. 42:68–73. 2014. View Article : Google Scholar
|
|
21
|
Langmead B, Trapnell C, Pop M and Salzberg
SL: Ultrafast and memory-efficient alignment of short DNA sequences
to the human genome. Genome Biol. 10:R252009. View Article : Google Scholar : PubMed/NCBI
|
|
22
|
Love MI, Huber W and Anders S: Moderated
estimation of fold change and dispersion for RNA-seq data with
DESeq2. Genome Biol. 15:5502014. View Article : Google Scholar : PubMed/NCBI
|
|
23
|
Benjamini Y and Hochberg Y: Controlling
the False discovery rate: A practical and powerful approach to
multiple testing. J R Stat Soc Series B Stat Methodol. 57:289–300.
1995.
|
|
24
|
Fan Y, Siklenka K, Arora SK, Ribeiro P,
Kimmins S and Xia J: miRNet dissecting miRNA-target interactions
and functional associations through network based visual analysis.
Nucleic Acids Res. 44:W135–W141. 2016. View Article : Google Scholar : PubMed/NCBI
|
|
25
|
Fabregat A, Sidiropoulos K, Garapati P,
Gillespie M, Hausmann K, Haw R, Jassal B, Jupe S, Korninger F,
McKay S, et al: The Reactome pathway Knowledgebase. Nucleic Acids
Res. 44:D481–D487. 2016. View Article : Google Scholar :
|
|
26
|
Pfaffl MW: A new mathematical model for
relative quantification in real time RT PCR. Nucleic Acids Res.
29:e452001. View Article : Google Scholar
|
|
27
|
Livak KJ and Schmittgen TD: Analysis of
relative gene expres sion data using real-time quantitative PCR and
the 2(-Delta Delta C(T)) method. Methods. 25:402–408. 2001.
View Article : Google Scholar
|
|
28
|
Andersen CL, Jensen JL and Ørntoft TF:
Normalization of real-time quantitative reverse transcription-PCR
data: A model based variance estimation approach to identify genes
suited for normalization, applied to bladder and colon cancer data
sets. Clin Cancer Res. 64:5245–5250. 2004.
|
|
29
|
Vandesompele J, De Preter K, Pattyn F,
Poppe B, Van Roy N, De Paepe A and Speleman F: Accurate
normalization of real time quantitative RT-PCR data by geometric
averaging of multiple internal control genes. Genome Biol.
3:RESEARCH00342002. View Article : Google Scholar
|
|
30
|
Théry C, Witwer KW, Aikawa E, Alcaraz MJ,
Anderson JD, Andriantsitohaina R, Antoniou A, Arab T, Archer F,
Atkin Smith GK, et al: Minimal information for studies of extra
cellular vesicles 2018 (MISEV2018): A position statement of the
International Society for Extracellular Vesicles and update of the
MISEV2014 guidelines. J Extracell Vesicles. 7:15357502018.
View Article : Google Scholar
|
|
31
|
Ewing B, Hillier L, Wendl MC and Green P:
Base calling of automated sequencer traces using phred. I Accuracy
assessment. Genome Res. 8:175–185. 1998. View Article : Google Scholar : PubMed/NCBI
|
|
32
|
Patsos G, André S, Roeckel N, Gromes R,
Gebert J, Kopitz J and Gabius HJ: Compensation of loss of protein
function in microsat ellite-unstable colon cancer cells (HCT116): A
gene dependent effect on the cell surface glycan profile.
Glycobiology. 19:726–734. 2009. View Article : Google Scholar : PubMed/NCBI
|
|
33
|
Lee J, Warnken U, Schnölzer M, Gebert J
and Kopitz J: A new method for detection of tumor driver dependent
changes of protein sialylation in a colon cancer cell line reveals
nectin 3 as TGFBR2 target. Protein Sci. 24:1686–1694. 2015.
View Article : Google Scholar : PubMed/NCBI
|
|
34
|
Lee J, Katzenmaier EM, Kopitz J and Gebert
J: Reconstitution of TGFBR2 in HCT116 colorectal cancer cells
causes increased LFNG expression and enhanced
N-acetyl-d-glucosamine incorporation into Notch1. Cell Signal.
28:1105–1113. 2016. View Article : Google Scholar : PubMed/NCBI
|
|
35
|
Lee J, Fricke F, Warnken U, Schnölzer M,
Kopitz J and Gebert J: Reconstitution of TGFBR2 mediated signaling
causes upregulation of GDF-15 in HCT116 colorectal cancer cells.
PLoS One. 10:e01315062015. View Article : Google Scholar
|
|
36
|
He X, Wei Y, Wang Y, Liu L, Wang W and Li
N: MiR-381 func tions as a tumor suppressor in colorectal cancer by
targeting Twist1. Onco Targets Ther. 9:1231–1239. 2016.
|
|
37
|
Cha DJ, Franklin JL, Dou Y, Liu Q,
Higginbotham JN, Demory Beckler M, Weaver AM, Vickers K, Prasad N,
Levy S, et al: KRAS-dependent sorting of miRNA to exosomes. Elife.
4:e071972015. View Article : Google Scholar : PubMed/NCBI
|
|
38
|
Tang H, Wang Z, Liu Q, Liu X, Wu M and Li
G: Disturbing miR-182 and -381 inhibits BRD7 transcription and
glioma growth by directly targeting LRRC4. PLoS One. 9:e841462014.
View Article : Google Scholar : PubMed/NCBI
|
|
39
|
Zhang M, Huang S and Long D: MiR-381
inhibits migration and invasion in human gastric carcinoma through
downregulatedting SOX4. Oncol Lett. 14:3760–3766. 2017. View Article : Google Scholar : PubMed/NCBI
|
|
40
|
Liang Y, Zhao Q, Fan L, Zhang Z, Tan B,
Liu Y and Li Y: Down-regulation of MicroRNA-381 promotes cell
proliferation and invasion in colon cancer through up-regulation of
LRH 1. Biomed Pharmacother. 75:137–141. 2015. View Article : Google Scholar : PubMed/NCBI
|
|
41
|
Hu WW, Chen PC, Chen JM, Wu YM, Liu PY, Lu
CH, Lin YF, Tang CH and Chao CC: Periostin promotes epithelial
mesen chymal transition via the MAPK/miR-381 axis in lung cancer.
Oncotarget. 8:62248–62260. 2017.PubMed/NCBI
|
|
42
|
Thiery JP, Acloque H, Huang RY and Nieto
MA: Epithelial mesenchymal transitions in development and disease.
Cell. 139:871–890. 2009. View Article : Google Scholar : PubMed/NCBI
|
|
43
|
Heldin CH, Vanlandewijck M and Moustakas
A: Regulation of EMT by TGFβ in cancer. FEBS Lett. 586:1959–1970.
2012. View Article : Google Scholar : PubMed/NCBI
|
|
44
|
Buckowitz A, Knaebel HP, Benner A, Bläker
H, Gebert J, Kienle P, von Knebel Doeberitz M and Kloor M:
Microsatellite instability in colorectal cancer is associated with
local lympho cyte infiltration and low frequency of distant
metastases. Br J Cancer. 92:1746–1753. 2005. View Article : Google Scholar : PubMed/NCBI
|
|
45
|
Nishimura J, Handa R, Yamamoto H, Tanaka
F, Shibata K, Mimori K, Takemasa I, Mizushima T, Ikeda M, Sekimoto
M, et al: microRNA-181a is associated with poor prognosis of
colorectal cancer. Oncol Rep. 28:2221–2226. 2012. View Article : Google Scholar : PubMed/NCBI
|
|
46
|
Ji D, Chen Z, Li M, Zhan T, Yao Y, Zhang
Z, Xi J, Yan L and Gu J: MicroRNA-181a promotes tumor growth and
liver metastasis in colorectal cancer by targeting the tumor
suppressor WIF 1. Mol Cancer. 13:862014. View Article : Google Scholar
|
|
47
|
Taylor MA, Sossey Alaoui K, Thompson CL,
Danielpour D and Schiemann WP: TGF-β upregulates miR-181a
expression to promote breast cancer metastasis. J Clin Invest.
123:150–163. 2013. View Article : Google Scholar
|
|
48
|
Ji LJ, Su J, Xu AL, Pang B and Huang QM:
MiR-134-5p attenu ates neuropathic pain progression through
targeting Twist1. J Cell Biochem. Sep 6–2018. View Article : Google Scholar : Epub ahead of
print.
|
|
49
|
El Daly SM, Abba ML, Patil N and Allgayer
H: miRs-134 and-370 function as tumor suppressors in colorectal
cancer by inde pendently suppressing EGFR and PI3K signalling. Sci
Rep. 6:247202016. View Article : Google Scholar
|
|
50
|
Oh BY, Kim SY, Lee YS, Hong HK, Kim TW,
Kim SH, Lee WY and Cho YB: Twist1 induced epithelial -mesenchymal
transition according to microsatellite instability status in colon
cancer cells. Oncotarget. 7:57066–57076. 2016. View Article : Google Scholar : PubMed/NCBI
|
|
51
|
Liu F, Cao QH, Lu DJ, Luo B, Lu XF, Luo RC
and Wang XG: TMEM16A overexpression contributes to tumor invasion
and poor prognosis of human gastric cancer through TGF β signaling.
Oncotarget. 6:11585–11599. 2015.PubMed/NCBI
|
|
52
|
Cao Q, Liu F, Ji K, Liu N, He Y, Zhang W
and Wang L: MicroRNA 381 inhibits the metastasis of gastric cancer
by targeting TMEM16A expression. J Exp Clin Cancer Res. 36:292017.
View Article : Google Scholar
|
|
53
|
Katsuno Y, Lamouille S and Derynck R:
TGF-β signaling and epithelial mesenchymal transition in cancer
progression. Curr Opin Oncol. 25:76–84. 2013. View Article : Google Scholar
|
|
54
|
Liu L, Yao J, Li Z, Zu G, Feng D, Li Y,
Qasim W, Zhang S, Li T, Zeng H and Tian X: miR-381-3p knockdown
improves intestinal epithelial proliferation and barrier function
after intestinal isch emia/reperfusion injury by targeting nurr1.
Cell Death Dis. 9:4112018. View Article : Google Scholar
|
|
55
|
Tang YT, Huang YY, Li JH, Qin SH, Xu Y, An
TX, Liu CC, Wang Q and Zheng L: Alterations in exosomal miRNA
profile upon epithelial mesenchymal transition in human lung cancer
cell lines. BMC Genomics. 19:8022018. View Article : Google Scholar
|
|
56
|
Yuan T, Huang X, Woodcock M, Du M, Dittmar
R, Wang Y, Tsai S, Kohli M, Boardman L, Patel T and Wang L: Plasma
extracellular RNA profiles in healthy and cancer patients. Sci Rep.
6:194132016. View Article : Google Scholar : PubMed/NCBI
|
|
57
|
Wang J, Yan F, Zhao Q, Zhan F, Wang R,
Wang L, Zhang Y and Huang X: Circulating exosomal miR 125a 3p as a
novel biomarker for early-stage colon cancer. Sci Rep. 7:41502017.
View Article : Google Scholar
|
|
58
|
Slattery ML, Trivellas A, Pellatt AJ,
Mullany LE, Stevens JR, Wolff RK and Herrick JS: Genetic variants
in the TGFβ-signaling pathway influence expression of miRNAs in
colon and rectal normal mucosa and tumor tissue. Oncotarget.
8:16765–16783. 2017. View Article : Google Scholar : PubMed/NCBI
|
|
59
|
Fang Y, Xiang J, Chen Z, Gu X, Li Z, Tang
F and Zhou Z: miRNA expression profile of colon cancer stem cells
compared to non-stem cells using the SW1116 cell line. Oncol Rep.
28:2115–2124. 2012. View Article : Google Scholar : PubMed/NCBI
|
|
60
|
Mishra L, Derynck R and Mishra B:
Transforming growth factor-beta signaling in stem cells and cancer.
Science. 310:68–71. 2005. View Article : Google Scholar : PubMed/NCBI
|
|
61
|
Valmiki S, Ahuja V and Paul J: MicroRNA
exhibit altered expression in the inflamed colonic mucosa of
ulcerative colitis patients. World J Gastroenterol. 23:5324–5332.
2017. View Article : Google Scholar : PubMed/NCBI
|
|
62
|
Fang K, Law IKM, Padua D, Sideri A, Huang
V, Kevil CG, Iliopoulos D and Pothoulakis C: MicroRNA-31-3p is
involved in substance P (SP)-associated inflammation in human
colonic epithelial cells and experimental colitis. Am J Pathol.
188:586–599. 2018. View Article : Google Scholar :
|
|
63
|
Olaru AV, Selaru FM, Mori Y, Vazquez C,
David S, Paun B, Cheng Y, Jin Z, Yang J, Agarwal R, et al: Dynamic
changes in the expression of MicroRNA-31 during inflammatory bowel
disease-associated neoplastic transformation. Inflamm Bowel Dis.
17:221–231. 2011. View Article : Google Scholar
|
|
64
|
Li T, Luo W, Liu K, Lv X and Xi T: miR 31
promotes prolifera tion of colon cancer cells by targeting E2F2.
Biotechnol Lett. 37(523): 5322015. View Article : Google Scholar
|
|
65
|
Nosho K, Igarashi H, Nojima M, Ito M,
Maruyama R, Yoshii S, Naito T, Sukawa Y, Mikami M, Sumioka W, et
al: Association of microRNA-31 with BRAF mutation, colorectal
cancer survival and serrated pathway. Carcinogenesis. 35:776–783.
2014. View Article : Google Scholar
|
|
66
|
Laurent Puig P, Grisoni ML, Heinemann V,
Liebaert F, Neureiter D, Jung A, Montestruc F, Gaston Mathe Y,
Thiébaut R and Stintzing S: Validation of miR 31 3p expression to
predict cetuximab efficacy when used as first-line treatment in RAS
Wild-type metastatic colorectal cancer. Clin Cancer Res.
25:134–141. 2019. View Article : Google Scholar
|
|
67
|
Harrison PW, Alako B, Amid C, Cerdeño
Tárraga A, Cleland I, Holt S, Hussein A, Jayathilaka S, Kay S,
Keane T, et al: The European nucleotide archive in 2018. Nucleic
Acids Res. 47:D84–D88. 2019. View Article : Google Scholar :
|
|
68
|
EV-TRACK Consortium; Van Deun J, Mestdagh
P, Agostinis P, Akay Ö, Anand S, Anckaert J, Martinez ZA, Baetens
T, Beghein E, et al: EV TRACK: Transparent reporting and
centralizing knowledge in extracellular vesicle research. Nat
Methods. 14:228–232. 2017. View Article : Google Scholar : PubMed/NCBI
|