Introduction
Colorectal cancer (CRC) is the third most common
cancer worldwide, with >1,000,000 new cases diagnosed annually,
accounting for 10% of all cancer cases (1). It has been reported that CRC
initiation and progression involve a variety of signaling pathways,
such as WNT, transforming growth factor-β (TGF-β), receptor
tyrosine kinase and mammalian target of rapamycin (mTOR) signaling
(2,3). Among these, the mTOR signaling
pathway has been shown to serve a crucial role in the development
and progression of various human cancers (4-6).
Particularly, ribosomal protein S6 kinase β1 (RPS6KB1) mediates
effects of the PI3K/AKT/mTOR pathway on mRNA translation, cell
proliferation, metastasis and angiogenesis (7-10).
MicroRNAs (miRNAs/miRs) are small non-coding RNAs
(19-22 nucleotides in length) that negatively regulate gene
expression by binding to the 3′untranslated region (3′UTR) of their
target mRNAs. Various studies have reported the dysregulation of
miRNAs in numerous types of human cancer, including breast cancer
(11,12), lung cancer (13,14),
and CRC (15,16). In terms of cancer-related
functions, miRNAs can be defined as oncogenes or tumor suppressors,
depending on their target genes. A number of miRNAs have been
reported to function as tumor suppressors in cancer. miR-34 is a
well-known tumor suppressor miRNA family that induces apoptosis in
various cancers (17-19). miR-15 and miR-16 induce apoptosis
by targeting B-cell lymphoma 2 (BCL2) (20). miR-96 suppresses tumorigenesis by
targeting KRAS in pancreatic cancer (21). These studies suggest that
identification of tumor suppressor miRNAs is important to
understand the molecular mechanisms underlying cancer progression.
Previous studies have demonstrated that miRNAs can interact with
the mTOR pathway during tumorigenesis, such as by targeting
RPS6KB1, an important mediator of mTOR signaling. For example,
miR-195 suppresses prostate cancer by directly targeting RPS6KB1
(22), and miR-15 and miR-16 have
been reported to be involved in cell cycle arrest by targeting
RPS6KB1 in breast cancer (23).
Furthermore, miR-223 and miR-128 have also been reported to inhibit
cancer by directly targeting RPS6KB1 (24,25).
In our previous studies, several novel candidate
miRNAs regulating the physiology of cancer cells were identified
via functional screenings of miRNAs (26-29).
Following the screenings, the functional mechanisms of the tumor
suppressor miRNAs, miR-5582-5p and miR-550a-3-5p (26,27),
and the epithelial-to-mesenchymal transition (EMT)-promoting
miRNAs, miR-5003-3p and miR-181b-3p were demonstrated (28,29).
In this study, miR-5191, one of the miRNAs selected from the
screening of miRNAs regulating the growth of the CRC cell line
HCT116 (26), was characterized,
and it was demonstrated that miR-5191 functions as a tumor
suppressor in CRC by directly targeting RPS6KB1.
Materials and methods
Cell culture and reagents
Human CRC cell lines HCT116, HT-29, HCT15 and DLD1,
and the human colon fibroblast line CCD-18co were obtained from the
American Type Culture Collection and cultured in RPMI medium
(Corning, Inc.) supplemented with 10% fetal bovine serum (Corning,
Inc.), penicillin (100 U/ml) and streptomycin (10 µg/ml;
both Gibco; Thermo Fisher Scientific, Inc.) at 37°C in a humidified
incubator containing 5% CO2. Antibodies against RPS6KB1
(cat. no. 9202), poly(ADP-ribose) polymerase (PARP; cat. no. 9542),
retinoblastoma protein 1 (RB1; cat. no. 9309), cyclin D1 (cat. no.
2978), mTOR (cat. no. 2983) and S6 (cat. no. 2217) were purchased
from Cell Signaling Technology, Inc. Antibodies against vimentin
(cat. no. A301-620A), NOTCH2 (cat. no. A302-083A) and
BCL2-associated agonist of cell death (BAD; cat. no. A302-384A)
were purchased from Bethyl Laboratories, Inc. Antibodies against
phosphorylated RB1 (cat. no. sc-271930), cyclin-dependent kinase 4
(CDK4; cat. no. sc-749), BAX (cat. no. sc-493), BCL2 (cat. no.
sc-492), BAD (cat. no. sc-943), cyclin E (cat. no. sc-481) and
β-actin (cat. no. sc-47778) were purchased from Santa Cruz
Biotechnology, Inc. Antibodies against E-cadherin (cat. no. 610181)
and N-cadherin (cat. no. 610920) were purchased from BD
Biosciences. Horseradish peroxidase (HRP)-conjugated anti-mouse IgG
(cat. no. A90-116P) and anti-rabbit IgG (cat. no. A120-101P)
secondary antibodies were purchased from Bethyl Laboratories, Inc.
To examine the epigenetic regulation of miR-5191 expression, cells
were treated with histone methylation inhibitor
5-aza-2′-deoxycytidine (Merck KGaA) at 50 µM for 72 h,
histone deacetylase inhibitor trichostatin A (Sigma-Aldrich; Merck
KGaA) at 500 nM for 12 h, or TGF-β (Sigma-Aldrich; Merck KGaA) at 5
ng/ml for 48 h.
Transfection with RNA oligonucleotides
and expression vectors
miR-5191 mimic was synthesized by Genolution
Pharmaceuticals, Inc. as RNA duplexes designed from the sequences
(5′-AGG AUA GGA AGA AUG AAG UGC U-3′) registered in the miRBase
database 22.1 (http://www.mirbase.org) (30). RNA duplex containing the sequence
5′-CUU ACG CUG AGU ACU UCG AUU-3′ was used as a control miRNA.
pcDNA3 plasmid and the expression vector for RPS6KB1 containing an
N-terminal Myc with a pcDNA backbone (cat. no. 26610) were
purchased from Invitrogen and Addgene, Inc., respectively. Small
interfering (si)RNA duplex oligonucleotide targeting RPS6KB1
(si-RPS6KB1; cat. no. 36165) and scrambled negative control siRNA
(cat. no. 37007) were purchased from Santa Cruz Biotechnology, Inc.
For functional analyses, HCT116 and HT-29 cells were transfected at
30% confluency with miRNA mimic or siRNA at a final concentration
of 20 nM, and expression vectors (2 µg) using G-fectin
(Genolution Pharmaceuticals, Inc.) according to the manufacturer's
protocol.
Determination of cell growth and cell
cycle analysis
HCT116 and HT-29 cells were seeded in 24-well plates
(1×10⁴ cells/well) and transfected with miRNAs. At 24,
48, 72 and 96 h after transfection, cell growth was determined by
counting the number of cells excluding trypan blue. Cells were
stained with 0.4% trypan blue solution (Thermo Fisher Scientific,
Inc.) at room temperature for 10 min and placed on a
hematocytometer. Non-stained live cells and violet-stained dead
cells were counted using an Eclips-TS2 microscope (magnification,
×200; Nikon Corporation) in four randomly selected fields.
For cell cycle analysis, cells were fixed in
ice-cold 70% ethanol for 2 h and treated with RNase A (20
µg/ml). Then, the cells were stained with propidium iodide
(PI; 50 µg/ml) at room temperature for 30 min, and cell
cycle distribution was analyzed using a FACSCalibur™ flow cytometer
(BD Biosciences) and BD CellQuest Pro software version 5.2.1 (BD
Biosciences).
Soft agar colony formation assay
Transfected HCT116 and HT-29 cells were suspended in
0.35% low-melting agarose/growth media and seeded on the top of
solidified 0.5% low-melting agarose/growth media in 60-mm dishes
(500 cells/dish). The dishes were incubated at 37°C for 2 weeks
with addition of fresh growth media every week. Cells were fixed
with 4% formaldehyde at room temperature for 10 min and stained
with 0.005% crystal violet at room temperature for 30 min, and the
number of colonies was counted.
Apoptosis analysis
Cell apoptosis was evaluated via flow cytometry
after Annexin-FITC/PI double staining using an Annexin V-FITC
Apoptosis Detection Kit I (BD Biosciences) according to the
manufacturer's protocols. Briefly, the cells seeded in 6-well
plates (2×10⁵ cells/well) were transfected with miR-5191
or control miRNA and cultured for 48 h. The cells were then stained
and analyzed using FACSCalibur™ flow cytometer (BD Biosciences) and
BD CellQuest Pro software version 5.2.1 (BD Biosciences). The sum
of early and late apoptotic cells was calculated to determine the
apoptotic rate.
RNA isolation and reverse
transcription-quantitative PCR (RT-qPCR) analysis
Total RNA was isolated from cultured cells or frozen
tumor tissues using TRIzol® reagent (Invitrogen; Thermo
Fisher Scientific, Inc.) or an RNeasy Mini kit (Qiagen GmbH),
respectively, according to the manufacturers' protocols. To
quantify mRNA expression, total RNA (1 µg) was reverse
transcribed into cDNA using an AMPIGENE® cDNA Synthesis
kit (Enzo Biochem, Inc.). The reaction mixtures were incubated
sequentially at 42°C for 30 min and at 85°C for 10 min. qPCR for
mRNA determination was conducted using AMPIGENE® qPCR
Green Mix (Enzo Biochem, Inc.) and an iCycler real-time PCR
detection system (Bio-Rad Laboratories, Inc.) according to the
manufacturers' protocols. The qPCR reaction conditions were as
follows: Denaturation at 95°C for 2 min, and 40 cycles of 95°C for
5 sec, 60°C for 30 sec and 72°C for 30 sec. β-Actin was used as the
endogenous control for mRNA determination. The sequences of the
specific primers were as follows: RPS6KB1, forward,
5′-CGGGACGGCTTTTACCCAG-3′ and reverse,
5′-TTTCTCACAATGTTCCATGCCA-3′; NOTCH2, forward,
5′-CAACCGCAATGGAGGCTATG-3′, and reverse,
5′-GCGAAGGCACAATCATCAATGTT-3′; β-actin, forward,
5′-ACCGAGCGCGGCTACAG-3′ and reverse,
5′-CTTAATGTCACGCACGATTTCC-3′.
To quantify miRNA expression, total RNA (1
µg) was reverse transcribed into cDNA using an Mir-X miRNA
First-Strand kit (Clontech Laboratories, Inc.). The reaction
mixtures were incubated sequentially at 37°C for 1 h and at 85°C
for 5 min. qPCR for miRNA quantification was performed using an
Mir-X miRNA qRT-PCR SYBR kit (Clontech Laboratories, Inc.). The
thermocycling reaction conditions were as follows: Denaturation at
95°C for 10 sec, and 42 cycles of 95°C for 5 sec, 60°C for 20 sec
and 72°°C for 30 sec. qPCR for miRNA quantification was performed
using an Mir-X miRNA qRT-PCR SYBR kit (Clontech Laboratories,
Inc.). The sequences of the specific primers for each miRNA were as
follows: miR-5191, 5′-AGGATAGGAAGAATGAAGTGCT-3′; miR-15a-5p,
5′-TAGCAGCACATAATGGTTTGTG-3′; miR-128, 5′-TCACAGTGAACCGGTCTCTTT-3′;
miR-195, 5′-TAGCAGCACAGAAATATTGGC-3′; and miR-223-3p,
5′-TGTCAGTTTGTCAAATACCCCA-3′. RNU6B primers provided as a component
of the kit were used as an endogenous control.
The expression levels of mRNA and miRNA were
calculated according to the 2-ΔΔCq method (31).
Western blotting
Cells were lysed by boiling in 1X SDS sample buffer
(Elpis Biotech. Inc.) to harvest proteins. Protein concentrations
were measured using a Bicinchoninic Acid Assay kit (Thermo Fisher
Scientific, Inc.). Denatured proteins (20 µg) were separated
via 8-10% SDS-PAGE, and transferred to nitrocellulose membranes.
After the transfer, the membranes were blocked in 5% skim milk in
TBS-Tween 20 (TBST; 10 mM Tris-HCl, pH 8.0, 150 mM NaCl, 0.05%
Tween 20) at room temperature for 40 min and incubated with
specific primary antibodies diluted to 1:1,000 in the blocking
solution at room temperature for 2 h (for E-cadherin and
N-cadherin) or overnight at 4°C (for all other antibodies). The
membranes were then washed 3 times with TBST and incubated with
HRP-conjugated anti-mouse IgG or anti-rabbit IgG secondary
antibodies diluted to 1:5,000 in the blocking solution at room
temperature for 1 h, followed by detection using an enhanced
chemiluminescence system (Amersham; GE Healthcare Life Sciences).
Band intensities were quantitated using ImageJ software version
1.51J8 (National Institutes of Health) and normalized to
β-actin.
Sphere formation assay
For sphere culture, cells were incubated in DMEM/F12
serum-free medium (Invitrogen; Thermo Fisher Scientific, Inc.)
supplemented with 2% B-27 (Invitrogen; Thermo Fisher Scientific,
Inc.), 20 ng/ml epidermal growth factor (EGF; R&D Systems,
Inc.) and 20 ng/ml basic fibroblast growth factor (R&D Systems,
Inc.) in 6-well ultra-low cluster plates (Corning, Inc.). When the
diameters of formed spheres reached ~50 µm, spheroid cells
were transfected with miR-5191 or control miRNA at a final
concentration of 100 nM, si-RPS6KB1 or control siRNA at a final
concentration of 100 nM, or RPS6KB1 expression vector or empty
pcDNA3 plasmid (2 µg) using Viromer-Blue (Lipocalyx GmbH)
according to the manufacturer's protocol. At 4 days after
transfection, the images of spheres were captured with an
Eclips-TS2 microscope (magnification, x200), and the number and
diameter of spheres were measured in four randomly selected
fields.
Organoid culture
Human CRC tissue resected from a 59-year-old female
patient with CRC in March 2018 was obtained from the Korea Cancer
Center Hospital in Korea Institute of Radiological and Medical
Sciences (KIRAMS). Informed consent was obtained from patients, and
the study was approved by the institutional review board (IRB) of
KIRAMS (IRB no. 2017-07-001). Tumor cells were isolated as
described by Sato et al (32) and were suspended in Matrigel
(Sigma-Aldrich; Merck KGaA) and solidified in multi-well plates.
Well containing solidified Matrigel were filled with organoid
culture medium (1X B-27 supplement, 1.25 mM n-acetyl cysteine, 50
ng/ml EGF, 50 ng/ml noggin, 10 nM gastrin, 500 nM A83-01 and 100
mg/ml primocin) and incubated at 37°C in a humidified incubator
containing 5% CO2. Organoids were trypsinized in TripLE
(Invitrogen; Thermo Fisher Scientific, Inc.) at 37°C for 5 min to
obtain single cells. The cells were plated in 48-well plates at 70%
confluency and transfected with miR-5191 or control miRNA at a
final concentration of 100 nM using Lipofectamine® 2000
(Invitrogen; Thermo Fisher Scientific, Inc.) according to the
manufacturer's protocol. Then the cells were reseeded in Matrigel.
After 7 days, organoid viability was determined by MTT assay as
described previously (33). In
brief, MTT solution was added to the organoid culture at a final
concentration of 500 µg/ml. After incubation for 1 h, 20
µl of 2% SDS solution was added to solubilize the Matrigel
and 100 µl of DMSO was added to solubilize the reduced MTT,
and the optical density was measured at 562 nm. The images of
organ-oids were acquired using an EVOS FL Cell Imaging System
(Thermo Fisher Scientific, Inc), and the number and size of
organoids were analyzed by ImageJ software version 1.51J8 in four
randomly selected fields.
Invasion assay
For the invasion assay, transfected cells suspended
in serum-free RPMI medium were reseeded onto Matrigel-coated
filters in the upper chamber (5×10⁴ cells/well) of
Boyden chambers (Corning, Inc.). The lower chambers were filled
with 800 µl of complete medium. After incubation for 48 h
for HCT116 cells and 60 h for HT-29 cells, the invaded cells in the
lower surface of the filters were fixed for 5 min in solution A,
and stained for 5 min in solution B and solution C each, then
washed 3 times for 1 min in distilled water (all at room
temperature) using a Diff-Quick stain kit (Polysciences, Inc.). The
stained cells were counted using an Eclips-TS2 microscope
(magnification, ×200) in four randomly selected fields.
Selection of the putative targets of
miR-5191
Putative binding sites for miR-5191 were predicted
using miRNA target prediction programs: DIANA-MICROT (http://www.diana.imis.athena-innovation.gr) (34); TargetScan (http://www.targetscan.org) (35); and miRDB (http://www.mirdb.org) (36). The genes predicted by all three
different algorithms to contain the putative binding sites of
miR-5191 in their 3′UTRs were selected as targets of miR-5191.
Reporter assay
To prepare the reporter constructs, a DNA fragment
of the human RPS6KB1 3′UTR containing the putative miR-5191 binding
site was cloned into a pGL3UC vector (kindly provided by V.N. Kim,
Seoul National University, Republic of Korea) (37). The 3′UTR sequence of the RPS6KB1
gene containing the putative binding sites of miR-5191 was
amplified using GenomicsOne 5× PCR Premix (GenomicsOne Co., Ltd.)
according to the manufacturer's protocol. PCR reaction conditions
were: Denaturation at 94°C for 2 min, and 35 cycles of 94°C for 30
sec, 54°C for 30 sec and 72°C for 30 sec. The nucleotide sequences
of primers for the amplification of the RPS6KB1 3′UTR were forward,
5′-CCT CTA GAG CAA GCT GGA CAA AC-3′ and reverse, 5′-CCG AAT TCG
GTG TTA CCC TCA TAG-3′. HCT116 cells were seeded in 24-well plates
(5x10⁴ cells/well) and co-transfected with the reporter
plasmid/empty pGL3UC (100 ng), pRL-CMV-Renilla plasmid (2
ng; Promega Corporation) and miR-5191 mimic/control miRNA (20 nM)
using Lipofectamine® 2000 according to the
manufacturer's protocol. After 48 h of transfection, luciferase
activity was measured using a Dual Luciferase Reporter Assay system
(Promega Corporation) according to the manufacturer's protocol.
Firefly luciferase activity was normalized to Renilla
luciferase activity. Experiments were performed in triplicate.
Patient specimens
Twenty-two pairs of CRC and adjacent normal colon
tissues were obtained from the KIRAMS Radiation Tissue Biobank
(patient information was not available for these tissue samples).
Written informed consent was obtained from each patient before the
collection of specimens, and the use of CRC patient specimens was
approved by the IRB of KIRAMS (IRB no. K-1610-002-003). The study
was conducted in accordance with the Declaration of Helsinki.
Tumor xenograft experiments
The protocol for animal experiments was reviewed and
approved by the Institutional Animal Care and Use Committee of
KIRAMS (permit no. 2017-0056). A total of 16 female BALB/c nu/nu
mice (4-week-old females weighing 18-20 g) were purchased from
Orientbio Inc. and maintained under specific pathogen-free
conditions at 23±1°C with 50±10% humidity-controlled conditions
under a 12:12-h light/dark cycle. Food and water were provided
ad libitum. HCT116 xenografts were established by
subcutaneous injection of 5×10⁶ cells into the right
hind leg of 5-week-old mice. When the average tumor size reached
150 mm3, intratumoral injection of miRNA was started and
repeated once, with a 3-day interval. Control miRNA or miR-5191 (10
µg) was complexed with 1.2 µl of in
vivo-jetPEI (Polyplus-transfection SA) in a volume of 50
µl per injection according to the manufacturer's protocol
(n=6/group). Tumor size was measured twice a week, and the tumor
volume was calculated using the equation: Tumor volume (V)=(small
diameter)2 × (large diameter) x (π/6). Mice were
sacrificed by CO2 euthanasia before the tumor volume
reached 1,800 mm3, with a fill rate of 10-30% of the
chamber volume/min. After 3 min of CO2 injection into
the chamber, mice were checked for a lack of respiration and faded
eye color to confirm euthanasia.
Immunohistochemistry (IHC) of xenograft tumor
tissues was performed using a Ready-to-use IHC/ICC kit (BioVision,
Inc.) according to the manufacturer's protocol. Briefly, the mouse
tumor tissues were fixed with 4% formaldehyde at room temperature
for 24 h. Paraffin-embedded tissues were cut into 5 µm-thick
sections, deparaffinized, rehydrated and microwaved in citrate
buffer (cat. no. ab93678; Abcam) for antigen retrieval. The slides
were incubated in 3% H2O2 at room temperature
for 30 min to quench endogenous peroxidase activity, and then
blocked in blocking buffer (BioVision, Inc.) at room temperature
for 15 min, followed by incubation with anti-RPS6KB1 (1:100),
anti-cyclin D1 (1:100) or anti-BAD (1:100) antibodies at room
temperature for 30 min. After incubation with HRP-anti-mouse or
-rabbit IgG polymer at room temperature for 20 min and washing with
PBS, the tissue sections were treated with 3,3′-diaminobenzidine at
room temperature for 10 min, followed by counterstaining with
hematoxylin at room temperature for 1 min. Images were captured
with an Eclips-TS2 microscope (magnification, ×200).
Statistical analysis
All data are presented as the mean ± SEM. All
statistical analyses were performed using SPSS 17.0 (SPSS, Inc.)
and GraphPad Prism software 5 (GraphPad Software, Inc.). Student's
t-test was used to compare the difference between two groups, and
one-way ANOVA with post hoc Tukey's test was performed to compare
the differences among more than two groups. Repeated-measures ANOVA
was used to analyze tumor volume over time in the xenograft study.
P<0.05 were considered to indicate a statistically significant
difference. The correlation between the expression levels of
RPS6KB1 and miR-5191 was determined by Spearman analysis.
Results
miR-5191 induces apoptosis and cell cycle
arrest
Several novel candidate miRNAs were previously
identified following a functional screening of proliferation
inhibition in HCT116 cells (26);
miR-5191 was one of the selected miRNAs. To determine the
functional roles of miR-5191 in tumor initiation and progression,
HCT116 and HT-29 cells were transfected with miR-5191 or control
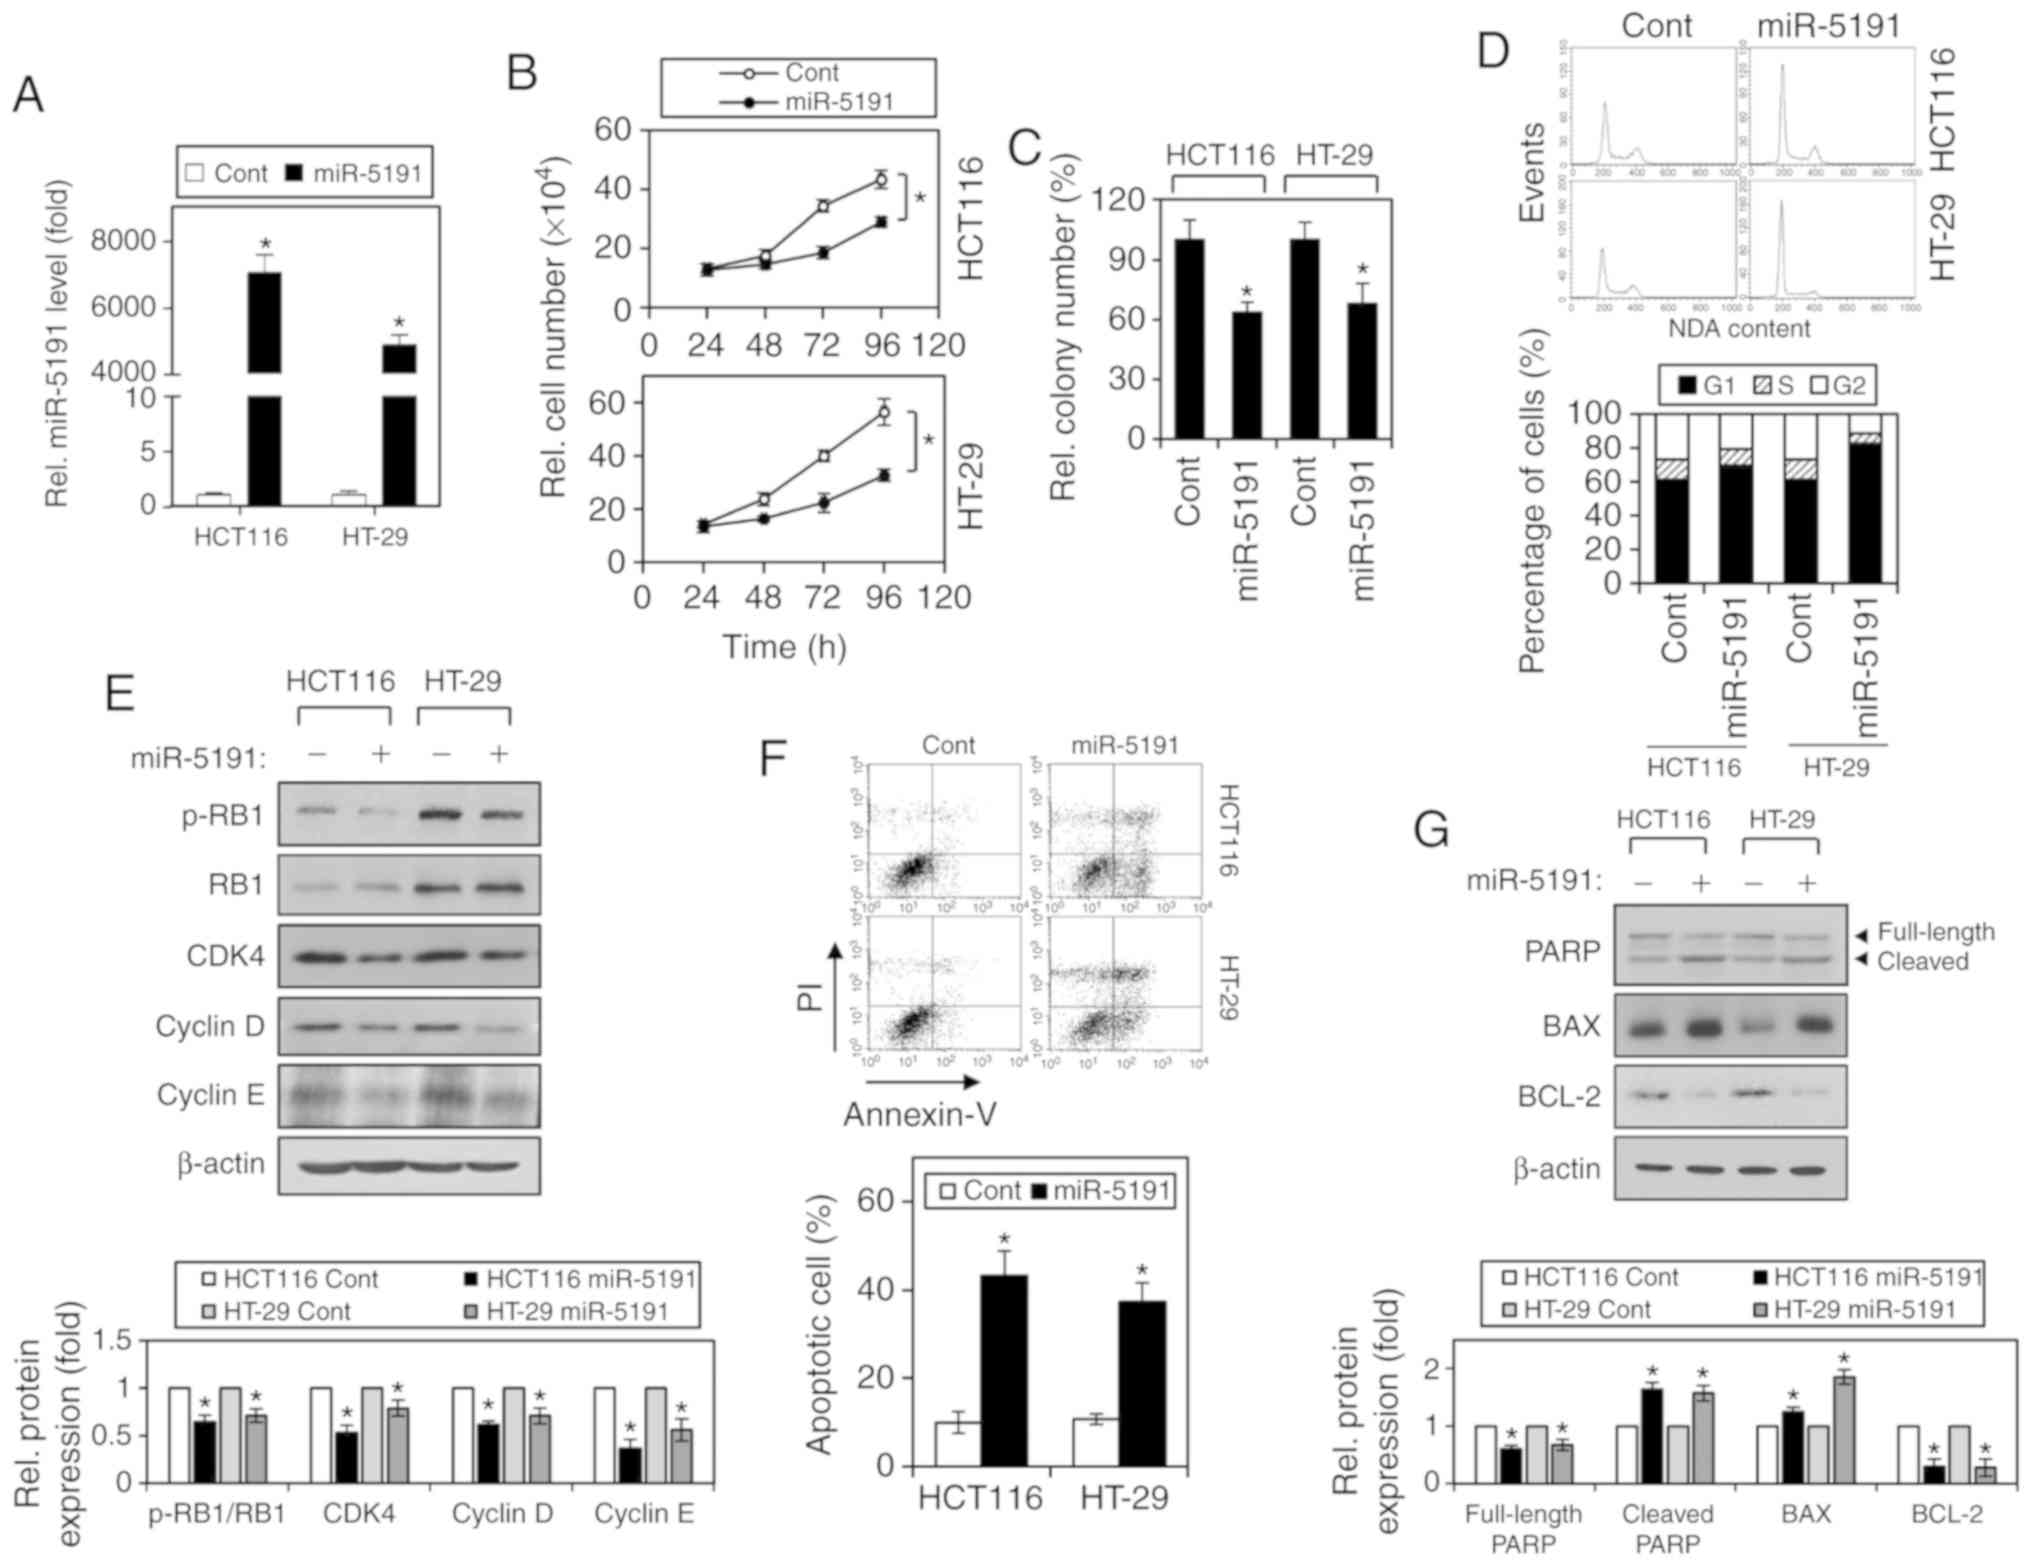
miRNA and the effects were assessed. Transfection efficacy was
confirmed by RT-qPCR analysis, revealing that miR-5191 levels were
significantly increased after transfection with miR-5191 (Fig. 1A). Viable cell counting after
transfection with miR-5191 revealed that cell proliferation was
inhibited by miR-5191 in both CRC cell lines (Fig. 1B). Colony formation in soft agar
was also inhibited by miR-5191 transfection (Fig. 1C). Furthermore, transfection with
miR-5191 resulted in an increased G1-phase cell
population and a decreased S-phase cell population, indicating cell
cycle arrest at the G1/S-phase boundary induced by
miR-5191 (Fig. 1D). Accordingly,
RB phosphorylation, and the expression levels of the cell
cycle-associated proteins CDK4, cyclin D and cyclin E, were reduced
after miR-5191 transfection (Fig.
1E). In addition, apoptosis was significantly induced in HCT116
and HT-29 cells after miR-5191 transfection (Fig. 1F). miR-5191-induced apoptosis was
accompanied by PARP cleavage, increased expression of proapoptotic
BAX and decreased expression of antiapoptotic BCL2 (Fig. 1G).
miR-5191 suppresses the sphere formation,
organoid growth and invasiveness of CRC cells
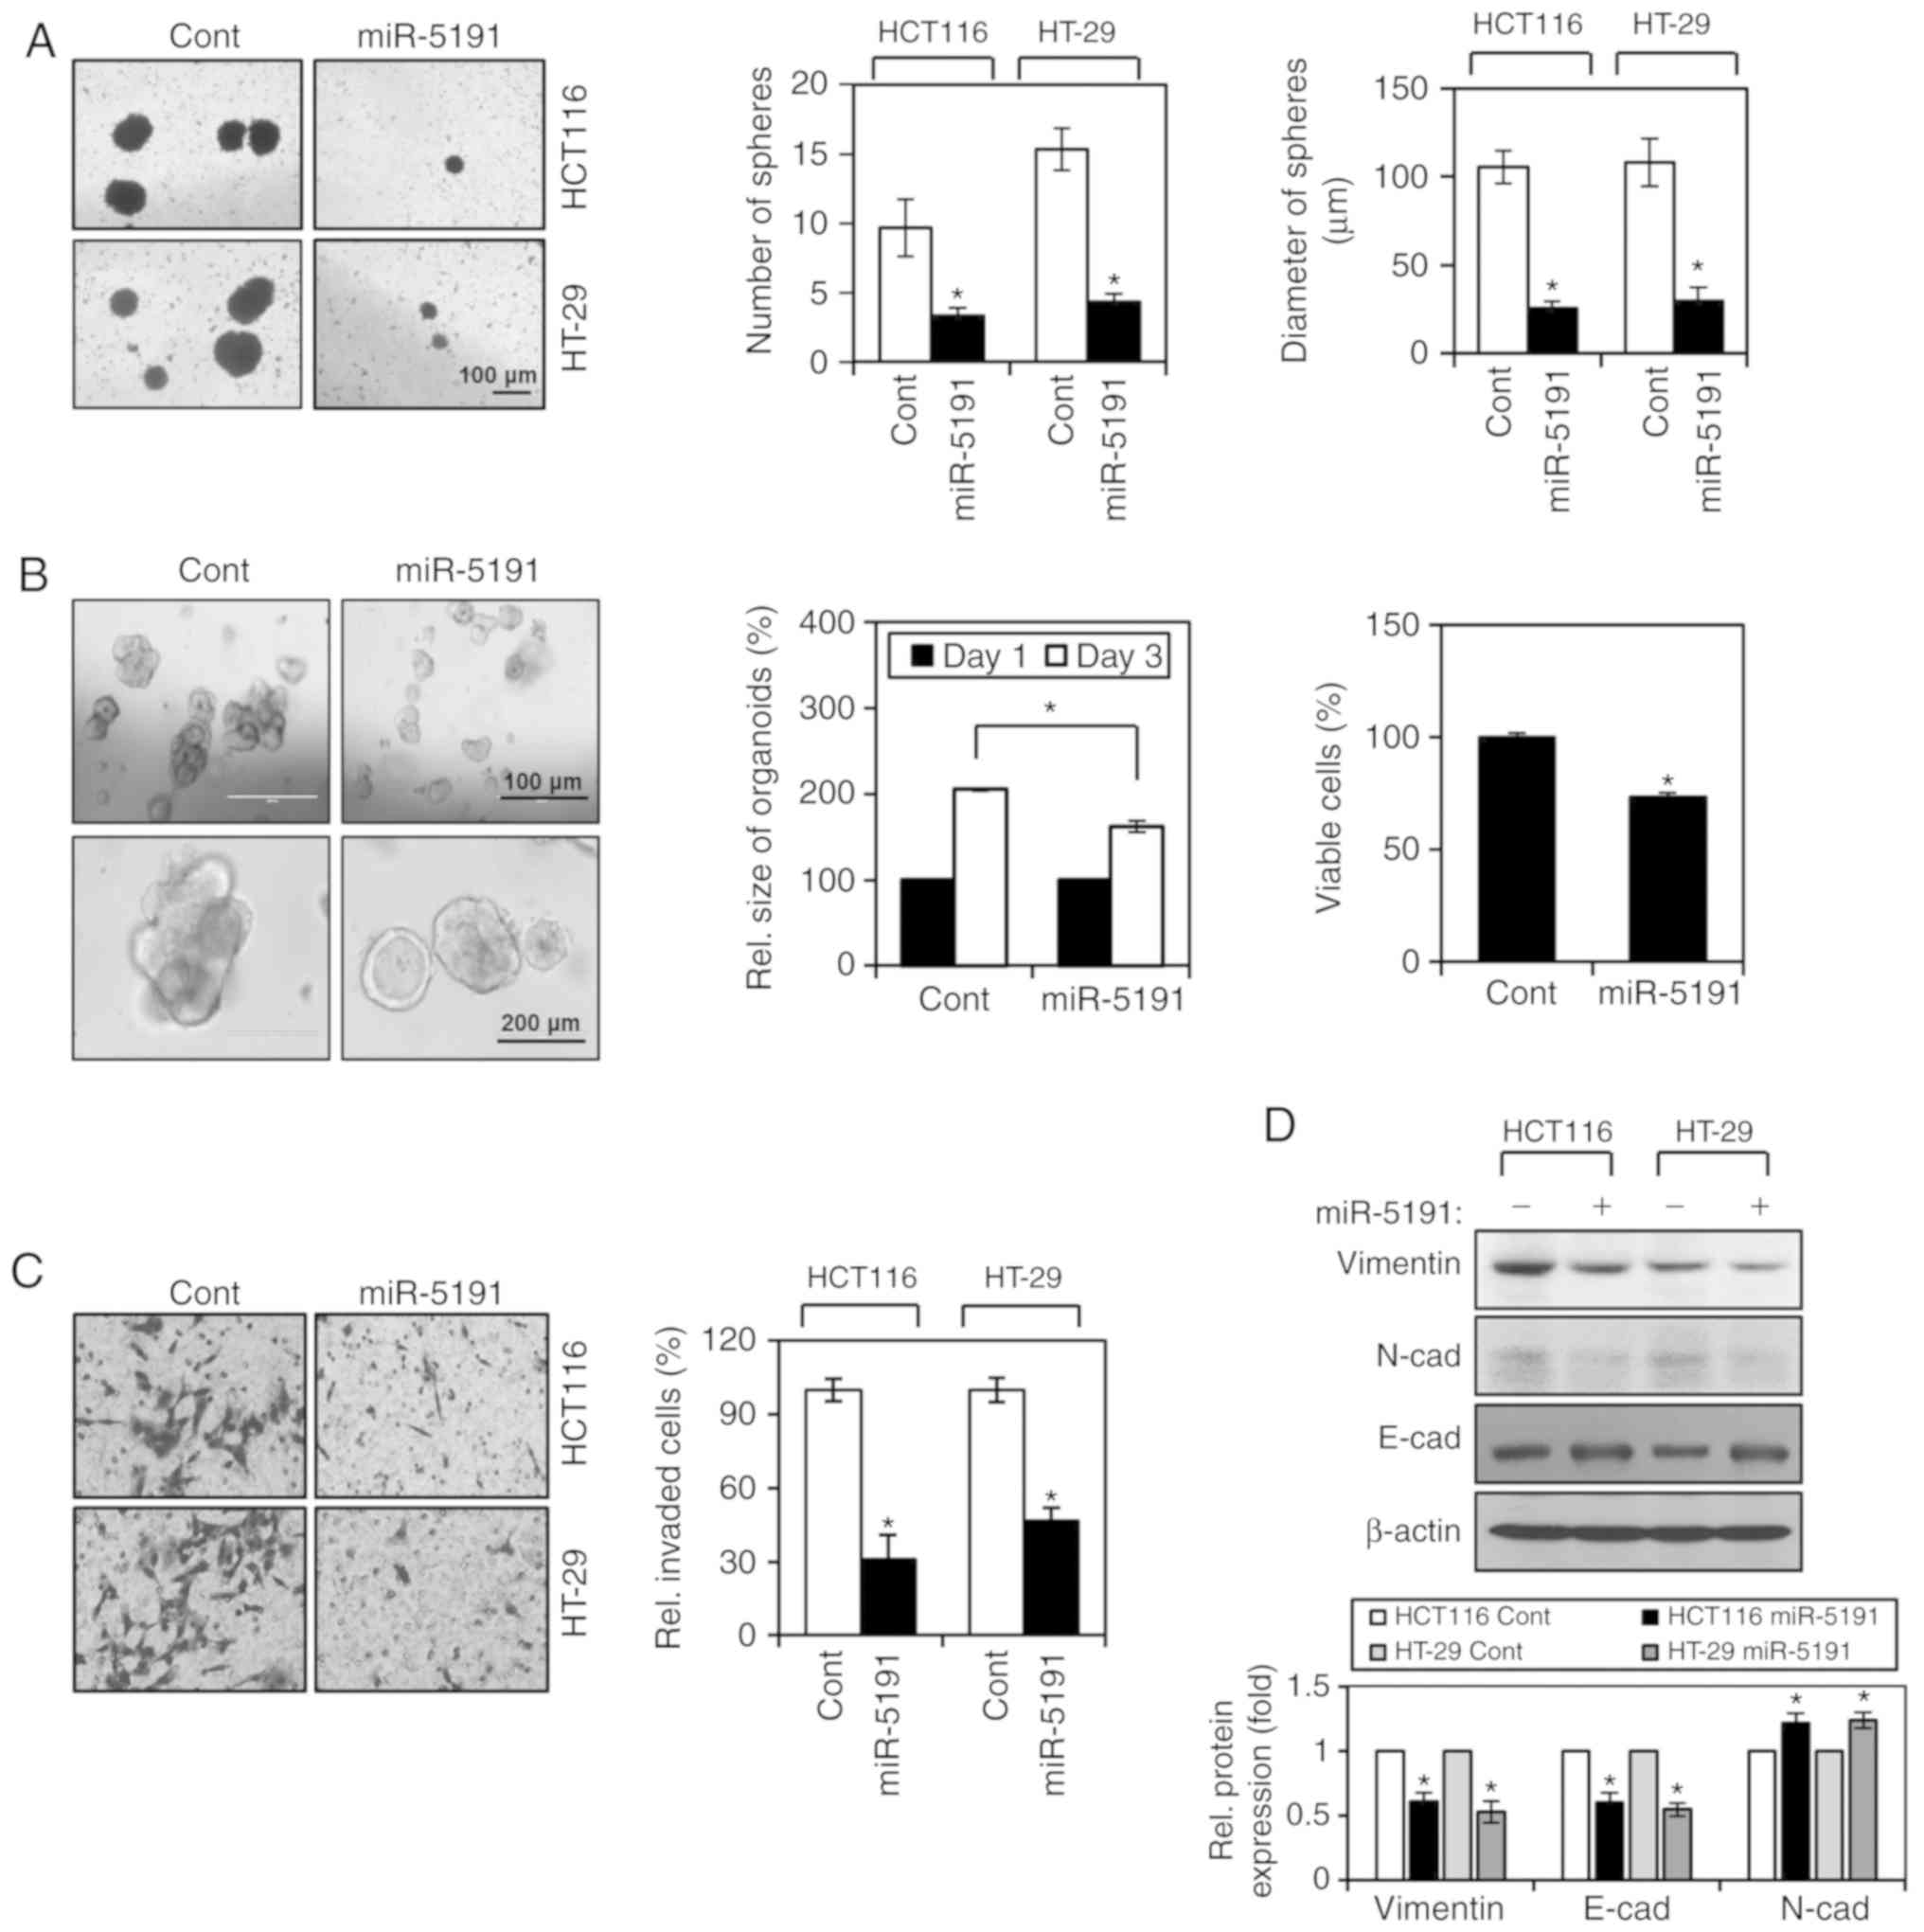
Next, the effects of miR-5191 on various
tumorigenesis-associated characteristics of CRC cells were
assessed. First, whether miR-5191 affected the maintenance of the
cancer stem cell (CSC)-like phenotype of CRC cells was evaluated.
Sphere culture under a serum-free condition has been used
successfully to enrich CSC-like cells (38) and thus can be used to determine the
self-renewal capacity of CSCs. The tumorsphere formation ability of
HCT116 and HT-29 cells in stem cell medium was assessed 4 days
after transfection with miR-5191 or control miRNA (Fig. 2A). The number and size of
tumorspheres were significantly decreased by miR-5191 transfection
(Fig. 2A). Recently, organoid
model systems employing 3D cultures in Matrigel-containing
serum-free medium have been increasingly used to determine the
biological characteristics of various CSCs (39-41).
Patient-derived tumor organoids were used to investigate the
function of miR-5191 on tumor organoid growth. miR-5191-transfected
cells formed smaller tumor organoids compared with
control-transfected cells (Fig.
2B). Suppression of tumor organoid growth by miR-5191 was also
determined by evaluating cell viability using an MTT assay
(Fig. 2B). Aggressive and
metastatic cancer cells are characterized by high invasiveness,
which is closely associated with EMT (42). Transwell assays with Matrigel were
used to determine the invasive potential of cancer cells.
Transfection with miR-5191 significantly decreased the invasive
abilities of HCT116 and HT-29 cells (Fig. 2C). In accordance, miR-5191
transfection inhibited the expression of the mesenchymal markers
vimentin and N-cadherin, and enhanced the expression of the
epithelial marker E-cadherin, indicating suppression of EMT by
miR-5191 (Fig. 2D).
miR-5191 directly targets RPS6KB1
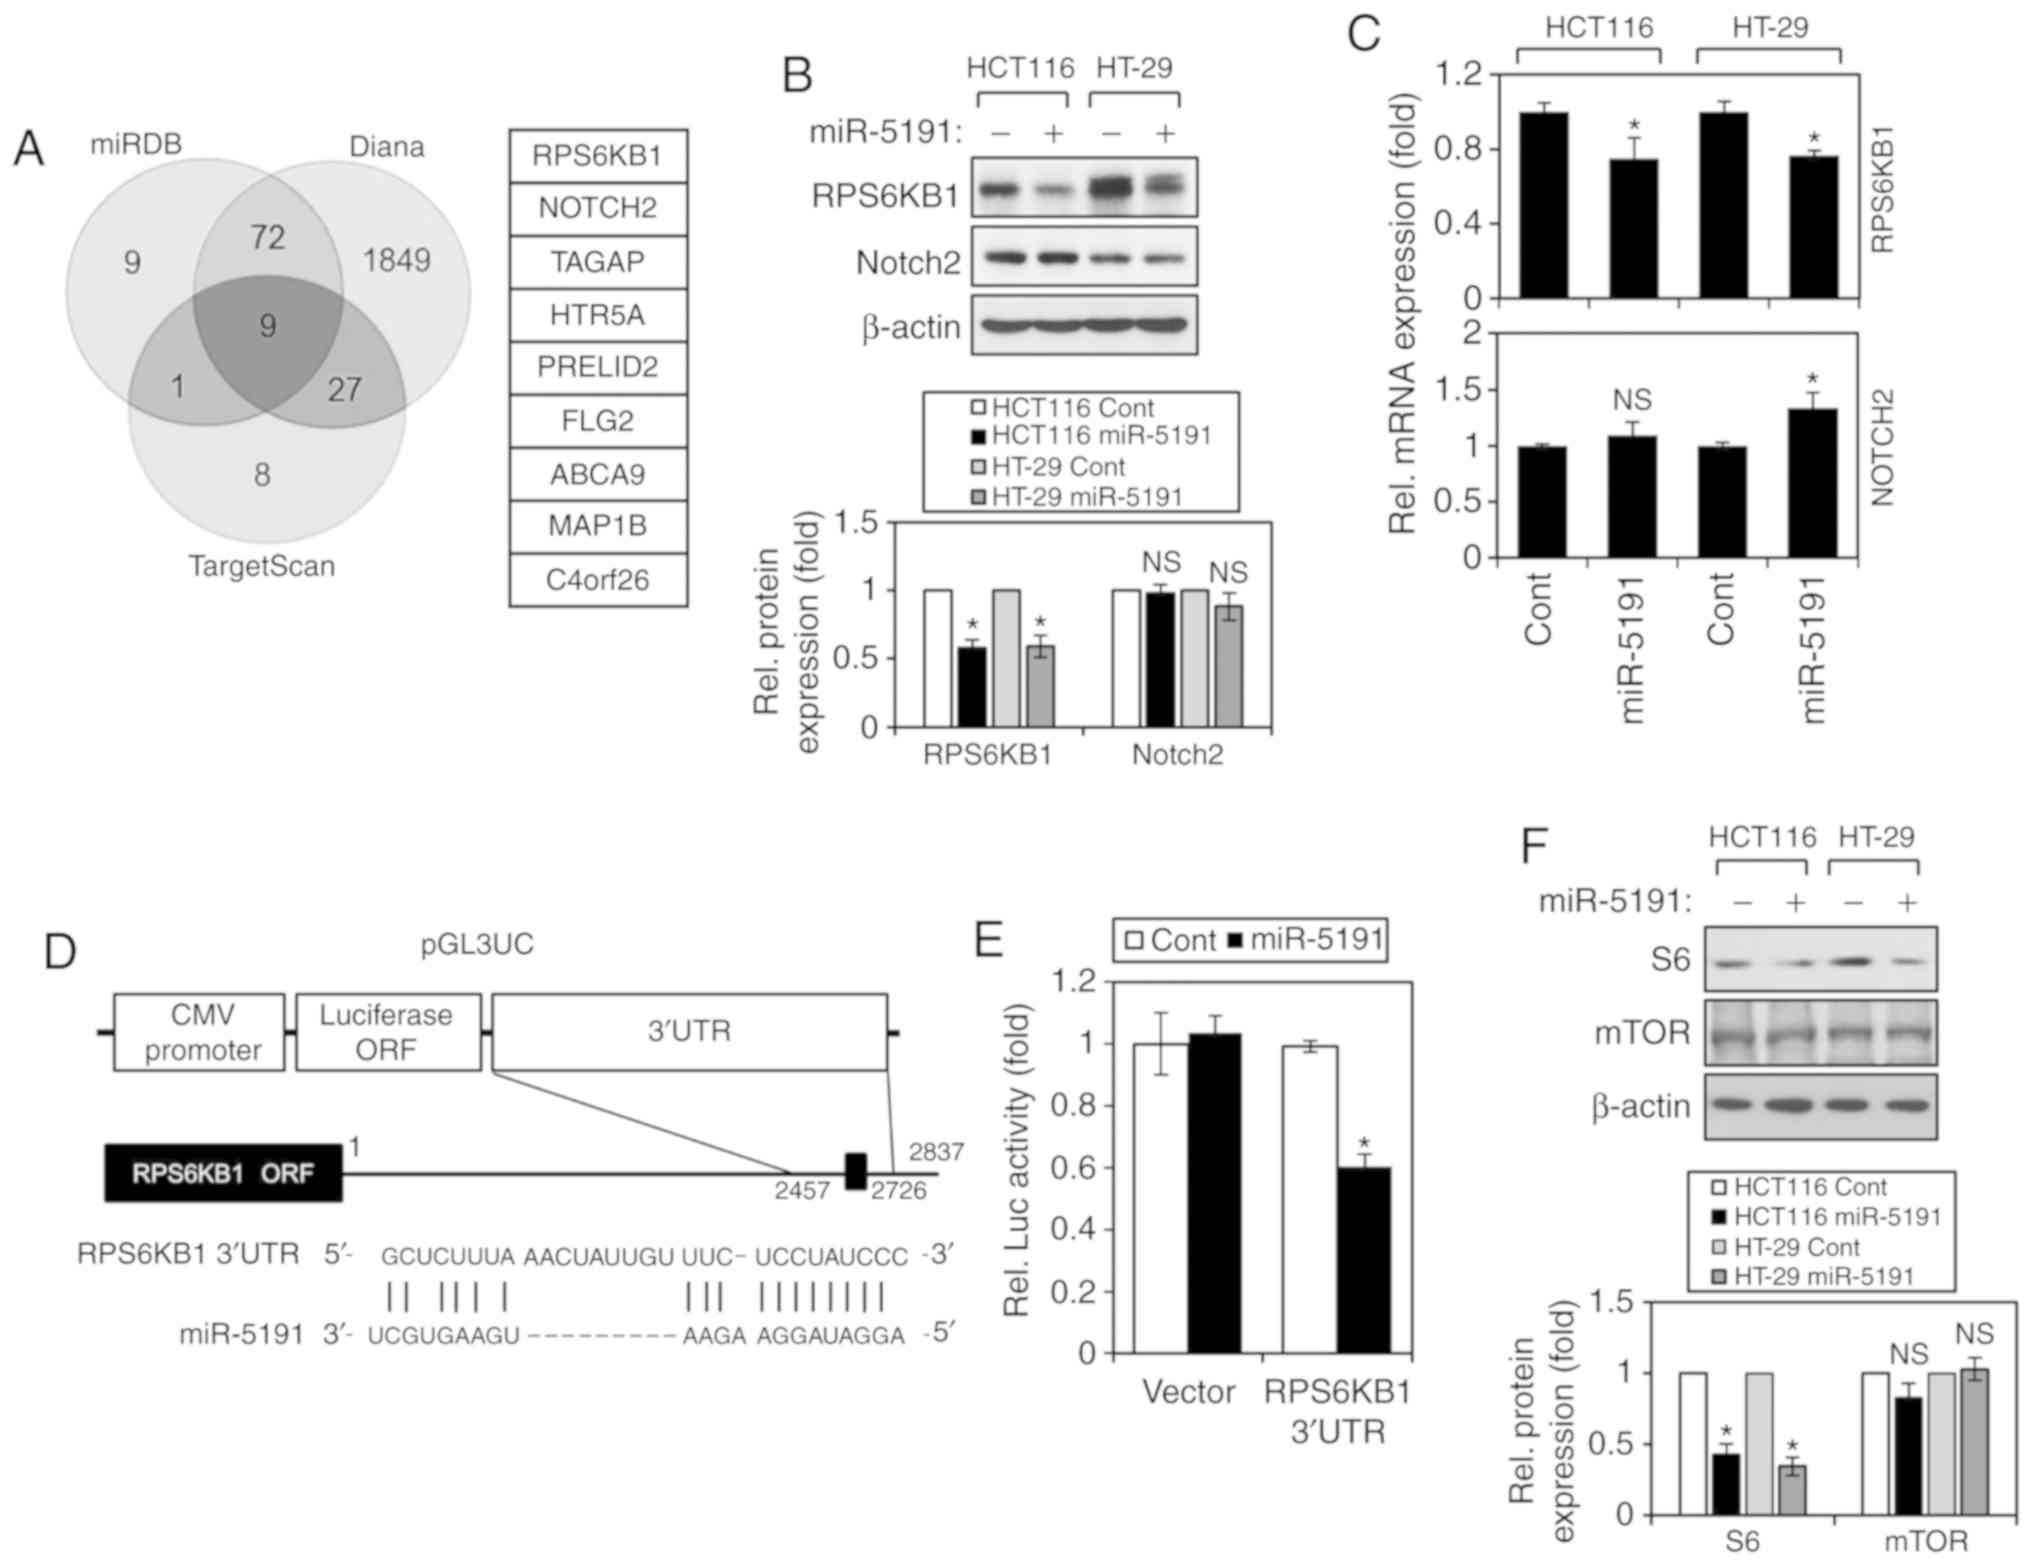
A number of candidate proteins were predicted as
targets of miR-5191 by the miRNA target prediction algorithms
miRDB, Diana, and TargetScan (Fig.
3A). Among the nine proteins commonly predicted by the three
algorithms, two proteins, RPS6KB1 and NOTCH2, which are well-known
oncogenic molecules involved in various types of tumorigenesis
(43,44), were selected for validation as
targets of miR-5191. First, the protein and mRNA expression levels
of the two target candidates were evaluated after transfection of
miR-5191 into HCT116 and HT-29 cells. In both cell lines, the
protein expression levels of RPS6KB1 were significantly reduced
when the cells were transfected with miR-5191, whereas those of
NOTCH2 were not altered (Fig. 3B).
Consistent with this observation, the mRNA levels of RPS6KB1, but
not those of NOTCH2, were also decreased upon transfection with
miR-5191 (Fig. 3C). Based on these
results, RPS6KB1 was further investigated to evaluate whether it is
a direct target of miR-5191 by means of a reporter assay. One
putative miR-5191-binding site that is complementary to the seed
region of miR-5191 was identified in the 3′UTR of RPS6KB1. The
putative miR-5191-binding sequence was cloned into the modified
pGL3 reporter vector pGL3UC, as presented in Fig. 3D. Luciferase activity was measured
48 h after co-transfection of the reporter construct with either
control miRNA or miR-5191 into HCT116 cells. Co-transfection with
miR-5191 significantly reduced the relative luciferase activity of
the RPS6KB1 3′UTR reporter (Fig.
3E), indicating that RPS6KB1 is a direct target of miR-5191. As
RPS6KB1 is a key effector molecule of mTOR signaling, the effects
of miR-5191 on the expression of mTOR and S6 were also examined.
miR-5191 transfection reduced the expression of S6, a downstream
target of RPS6KB1, but did not alter the expression levels of mTOR,
an upstream effector of RPS6KB1 (Fig.
3F).
miR-5191-induced tumor suppression occurs
through the downregulation of RPS6KB1
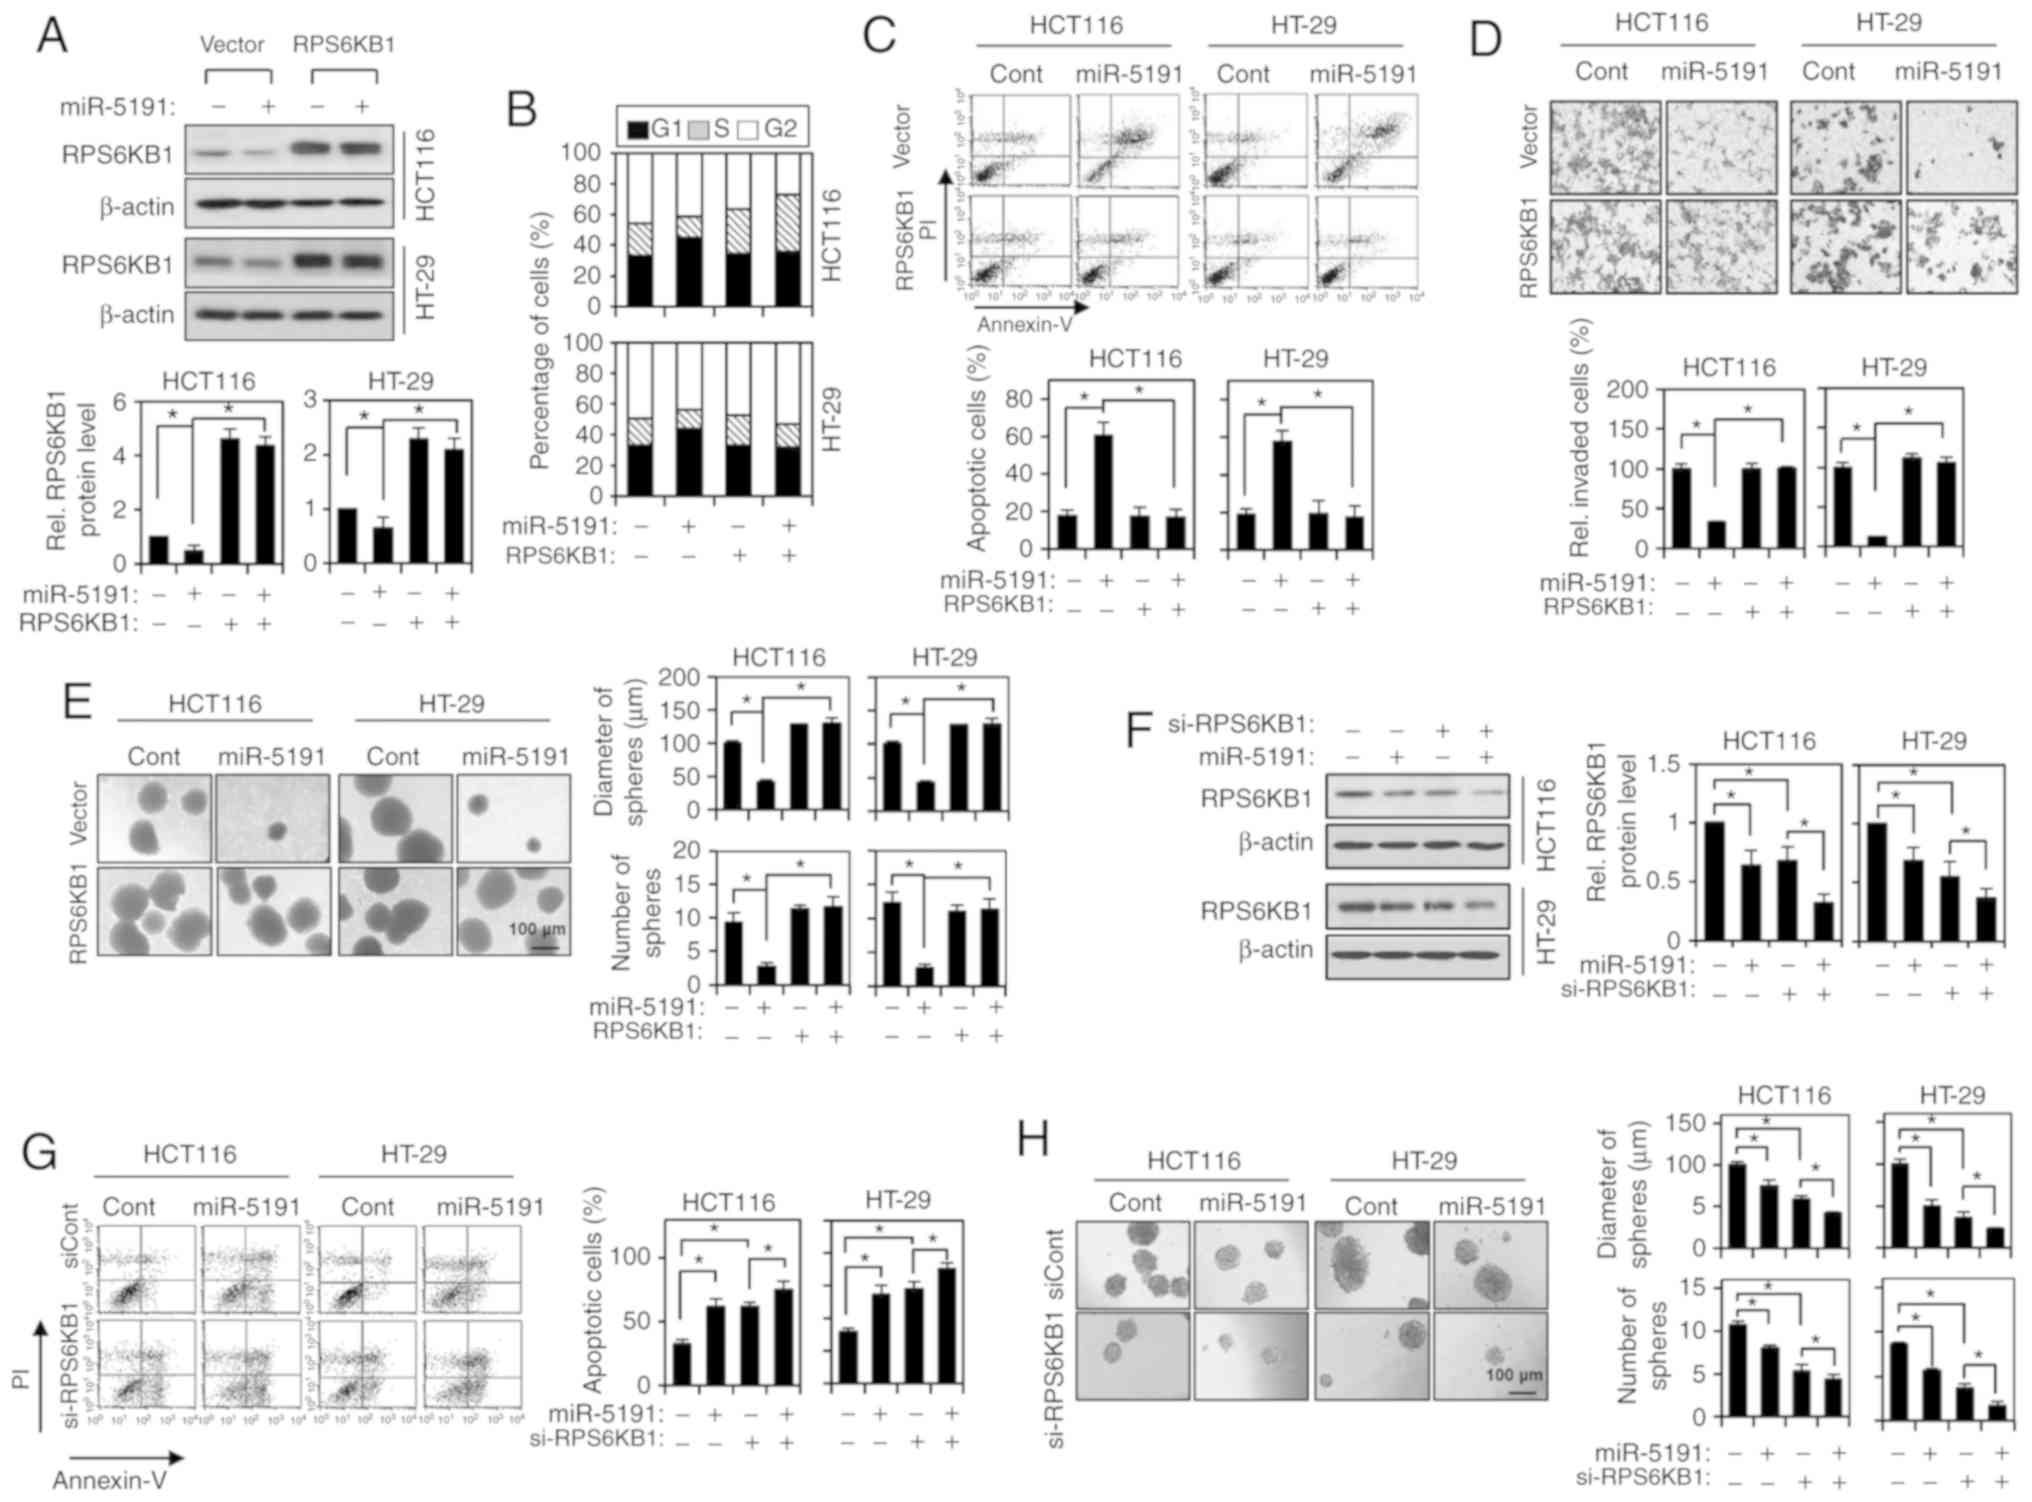
To validate the importance of directly targeting
RPS6KB1 for the tumor-suppressive function of miR-5191, whether the
restoration of RPS6KB1 expression could suppress the effects of
miR-5191 transfection was then investigated. Ectopic expression of
RPS6KB1, from a myc-RPS6KB1 expression vector, co-transfected with
miR-5191, prevented the G1-phase population increase
induced by miR-5191 (Fig. 4A and
B). Moreover, ectopic expression of RPS6KB1 efficiently
suppressed miR-5191-induced apoptosis (Fig. 4C). Ectopic expression of RPS6KB1
also attenuated the inhibition of cell invasion induced by miR-5191
transfection (Fig. 4D). Then, the
effect of RPS6KB1 expression on the sphere growth-inhibiting
activity of miR-5191 was examined. The size and number of spheres,
which were reduced by miR-5191 transfection, were restored to those
of control cultures by co-expression of the RPS6KB1 protein
(Fig. 4E). To further evaluate the
importance of RPS6KB1-trageting, the effects of enforced
downregulation of RPS6KB1 expression using si-RPS6KB1. RPS6KB1
expression was downregulated similarly by transfection with siRNA
or miR-5191, and further downregulated by the combined transfection
of si-RPS6KB1 and miR-5191 (Fig.
4F). Knocking down RPS6KB1 expression significantly induced
apoptosis and inhibited sphere growth in the same manner as
miR-5191 (Fig. 4G and H).
Co-transfection with miR-5191 further augmented the induction of
apoptosis and inhibition of sphere growth, suggesting other targets
may serve additional roles in the tumor-suppressive function of
miR-5191.
miR-5191 and RPS6KB1 expression levels
are inversely correlated in CRC tissues
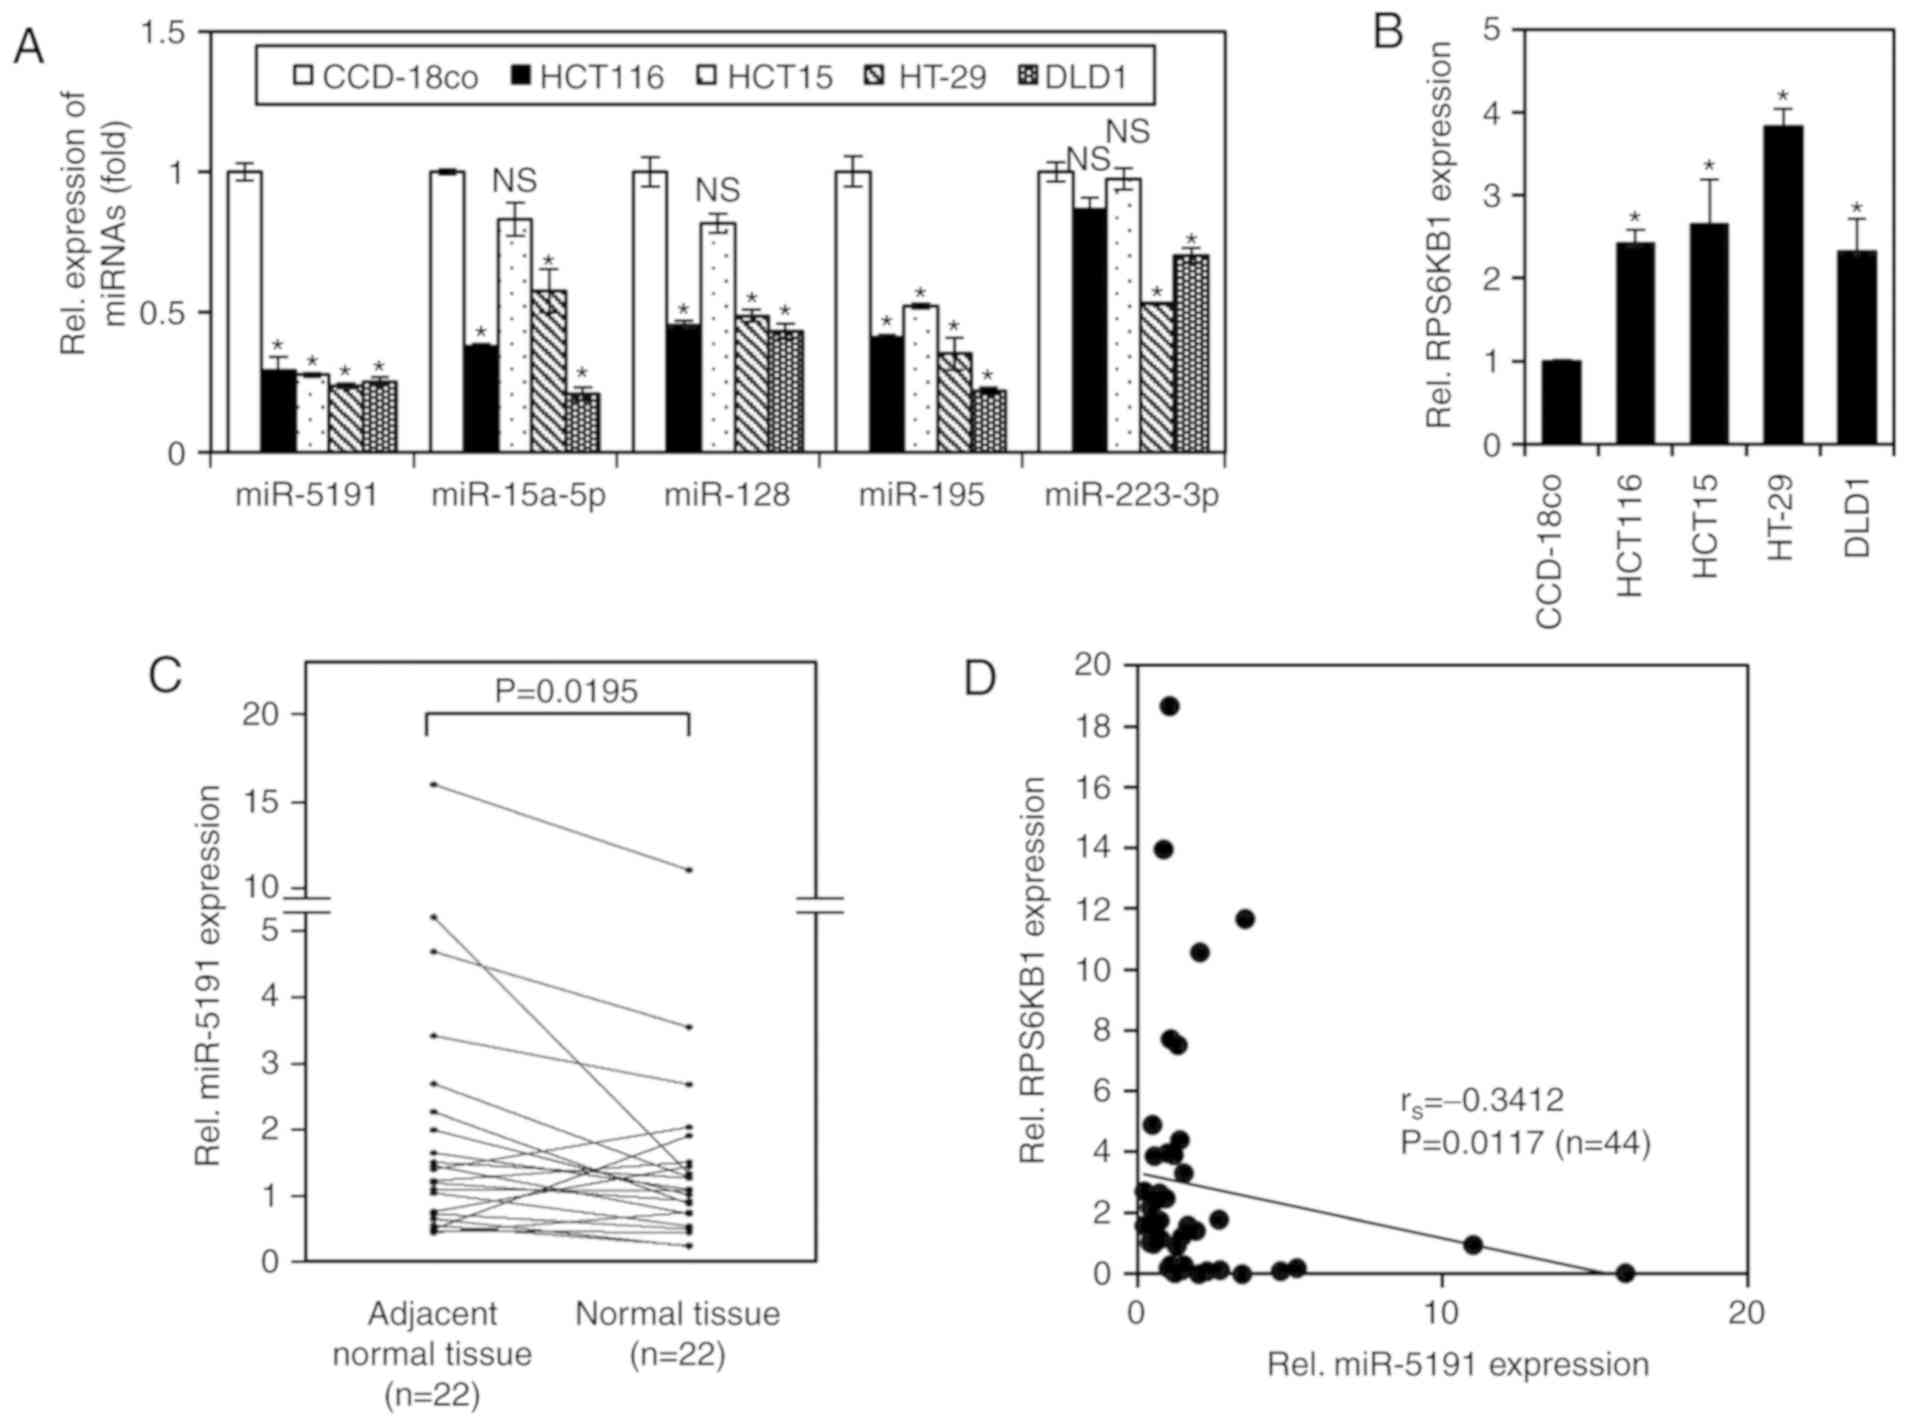
The expression levels of miR-5191 and other miRNAs
known to target RPS6KB1 (22-25)
were determined in CRC and normal cell lines via RT-qPCR analysis.
miR-5191 expression levels were significantly lower in CRC cell
lines (HCT116, HCT15, HT-29 and DLD1) compared with in the
colon-derived normal cell line CCD18-co; the expression levels of
the other miRNAs were also generally lower in the cancer cell
lines, with some variations depending on cell line (Fig. 5A). Similarly, the mRNA expression
of RPS6KB1 was upregulated in CRC cell lines compared with in
normal cell lines (Fig. 5B).
To validate the clinical relevance of miR-5191 as a
tumor suppressor, miR-5191 expression levels were compared between
tumor tissues and matched adjacent normal tissues using 22 pairs of
frozen specimens from patients with CRC. miR-5191 expression levels
were significantly lower in tumor tissues than in matched adjacent
normal tissues (Fig. 5C).
Furthermore, the correlation between RPS6KB1 and miR-5191
expression levels in the same CRC specimens was evaluated. This
revealed a significant inverse correlation between miR-5191 and
RPS6KB1 expression in human CRC tissues (Fig. 5D).
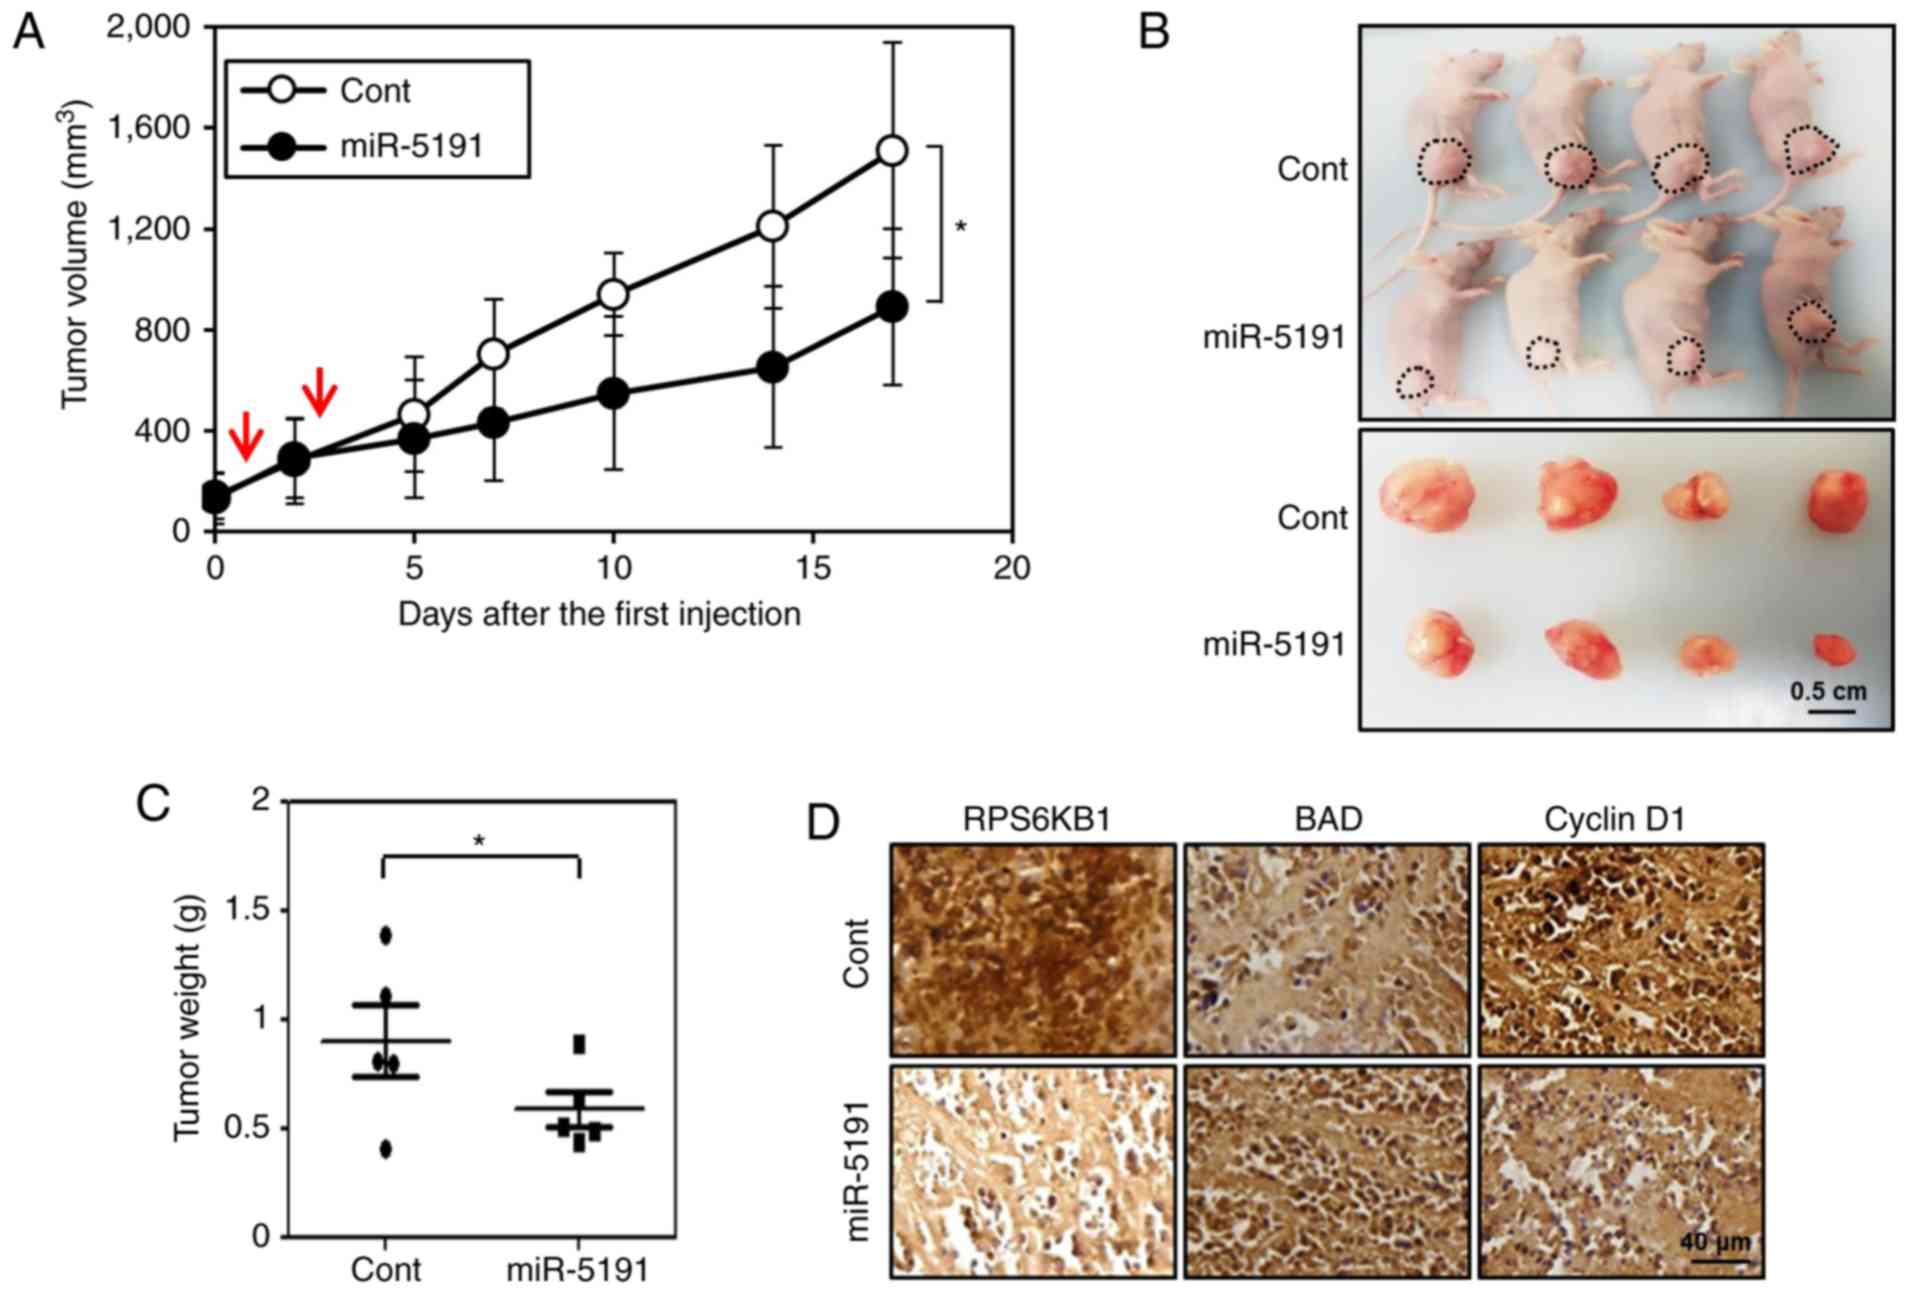
miR-5191 inhibits tumor growth in mouse
xenografts
To validate the in vivo tumor-suppressive
effects of miR-5191, the changes in xenograft tumor volume after
miR-5191 delivery were measured. Tumors established using HCT116
cells were injected with control miRNA or miR-5191 in a complex
with an in vivo transfection agent. After two injections of
miR-5191 with a 3-day interval, the tumor growth rate was
significantly slower compared with in the control-injected tumors
(Fig. 6A). Additionally, end-point
tumor weights of miR-5191-injected mice were significantly reduced
compared with those of control-injected mice (Fig. 6B and C). IHC analysis revealed that
intratumoral injection of miR-5191 decreased the expression levels
of the target protein RPS6KB1 and the cell cycle-associated protein
cyclin D1, while increasing the expression of the proapoptotic
protein BAD (Fig. 6D). These
results indicated that miR-5191 functions as a tumor suppressor
in vivo and exhibits potential for application in cancer
therapy.
Discussion
Numerous studies (11-17)
have reported that a variety of miRNAs are abnormally expressed in
various types of cancers, and serve important roles in cancer
development and progression by acting as tumor suppressors or
oncogenes. Thus, it is valuable to discover and characterize novel
miRNAs with tumor-suppressive or oncogenic functions, not only for
improved understanding of cancer, but also for the development of
novel anticancer therapeutic agents. In one such effort, several
new tumor-suppressive miRNAs were identified by employing a
functional screening approach (26,27).
Following this, miR-5191 was characterized as a tumor-suppressive
miRNA in the present study.
RPS6KB1, a key effector molecule of PI3K/Akt/mTOR
signaling, was identified as a direct target of miR-5191.
Importantly, the targeting of RPS6KB1 by miR-5191 suppressed
various tumorigenic characteristics of CRC cells. RPS6KB1 is one of
the most well-known downstream targets of mTOR complex 1 (mTORC1).
Activated mTORC1 directly phosphorylates RPS6KB1 to regulate a
variety of biological processes such as translational initiation,
cell cycle progression and cell survival (9,45).
Abnormal activation of PI3K/Akt signaling is common in CRCs
(46,47), and numerous studies have shown that
modulation of PI3K/Akt/mTOR signaling may provide therapeutic
efficacy for cancer treatment (48-50).
mTOR is a serine/threonine kinase that is activated in response to
various stimuli through PI3K/Akt, and is present in multiprotein
complexes with mTORC1 and mTORC2 (51,52).
Several studies have shown that various miRNAs contribute to
preventing tumorigenesis by targeting various steps of the
PI3K/Akt/mTOR pathway, including RPS6KB1. For example, miR-99
inhibits PI3K by targeting insulin-like growth factor (IGF)/(IGF)
receptor in hepatocellular carcinoma (53). miR-218 suppresses tumor cell
invasion and migration by targeting phosphatidylinositol
4-phosphate 3-kinase C2 domain-containing a polypeptide and PI3K
regulatory subunit 1 in CRC cells (54). miR-100 inhibits tumorigenesis by
directly targeting mTOR in bladder cancer (55), and miR-199a-3p induces cell cycle
arrest and apoptosis by targeting mTOR in hepatocellular carcinoma
(56). Furthermore, miR-195,
miR-15/16, miR-223 and miR-128 have been reported to suppress
various types of cancers by directly targeting RPS6KB1 (22-25).
These reports suggest that targeting RPS6KB1 or upstream components
of mTOR signaling is a plausible strategy for the development of
anticancer therapies. It was demonstrated in the present study that
miR-5191 inhibits not only monolayer CRC cell proliferation, by
inducing apoptosis and cell cycle arrest, but also invasion,
spheroid growth, and organoid growth. These inhibitory functions of
miR-5191 were suppressed by over-expression of RPS6KB1, indicating
that targeting RPS6KB1 is a central mechanism for the
tumor-suppressive functions of miR-5191. Our results are consistent
with previous reports showing the diverse tumor-suppressive
functions of miRNAs targeting RPS6KB1 (22-25).
In contrast, the observation that miR-5191 exhibited further
tumor-suppressive effect in RPS6KB1-depleted cells suggested that
the tumor-suppressive function of miR-5191 may not be entirely
dependent on RPS6KB1 targeting, but also involves targeting of
other proteins. These additional mechanisms remain to be pursued in
future studies.
In vasiveness, spheroid growth and organoid growth
are features of aggressive CSC-like cells, which exhibit resistance
to treatments and are widely accepted to be the major causes of
cancer recurrence. Thus, the present findings showing inhibition of
these CSC features by miR-5191 suggest that miR-5191 is an
efficient tumor-suppressive miRNA that can be utilized as a
promising candidate for the development of potent miRNA
therapeutics to overcome obstacles to CRC therapy. Increasing the
abundance of tumor-suppressive miRNAs in tumors is a good approach
for the development of anticancer miRNA therapeutics. Furthermore,
the antitumor effects of miR-5191 were verified in a mouse
xenograft model. Similar to the in vitro function,
intratumorally-injected miR-5191 effectively suppressed tumor
growth and target gene expression. Taken together, these results
demonstrated the potential of miR-5191 as a miRNA therapeutic with
anticancer function.
In accordance with the tumor-suppressive function of
miR-5191, the expression of miR-5191 was found to be down-regulated
in CRC tumor tissues as well as in cancer cells, when compared with
adjacent normal tissues and normal cells, respectively. An inverse
correlation between miR-5191 and RPS6KB1 expression in CRC tumor
tissues further supported the in vitro data indicating that
miR-5191 functioned by targeting RPS6KB1. At present, little is
known regarding the mechanisms underlying the regulation of
miR-5191 expression. However, it was observed that treatment with
DNA methylation inhibitor 5-aza-2′-deoxycytidine, histone
deacetylase inhibitor trichostatin A or TGF-β did not alter the
expression of miR-5191 in CRC cells (data not shown). This suggests
that epigenetic regulation by DNA methylation or histone
acetylation is not involved in the regulation of miR-5191
expression. The mechanism via which miR-5191 expression is
regulated requires demonstration in future studies and will provide
novel insight into the mechanistic role of miR-5191 in cancer
physiology. While this is the first report on the tumor-suppressive
function and downregulation of miR-5191 in CRC, one study has
described the expression levels of miR-5191 in salivary adenoid
cystic carcinoma (SACC) cells (57). In their study, miR-5191 was
identified as one of the miRNAs that w significantly downregulated
in a highly metastatic variant of SACC cells, implicating a
potential inhibitory role of miR-5191 during metastatic progression
of SACC. This raises the possibility that the tumor-suppressive
function and potential therapeutic potential of miR-5191 can be
extended to various other cancer types.
Acknowledgments
Not applicable.
Funding
This work was supported by a grant of the Korea
Institute of Radiological and Medical Sciences, funded by the
Ministry of Science and ICT, Republic of Korea (grant no.
50531-2019) and in part by a grant from the National Research
Foundation of Korea (grant no. NRF-2017R1A2B2004055 to YHH).
Availability of data and materials
All data generated or analyzed during current study
are included in this published article.
Authors' contributions
HJA and MP performed the experiments. HJA, MP, JK
and YHH planned the experiments, analyzed data and interpreted the
results. HJA and YHH drafted the manuscript. YHH designed and
oversaw the entire study. All authors read and approved the final
manuscript for publication.
Ethics approval and consent to
participate
The mice used in the present study were maintained
according to guidelines approved by the Institutional Animal Care
and Use Committee of Korea Institute of Radiological and Medical
Sciences (KIRAMS; permit no. 2017-0056), and were conducted
according to AVMA guidelines. Collection and use of CRC patient
specimens were approved by the Institutional Review Board (IRB) of
KIRAMS (IRB no. K-1610-002-003). For organoid culture, surgical
human colonic tissues were obtained from Korea Cancer Center
Hospital in KIRAMS after informed consent was provided, and the
study was approved by the IRB of KIRAMS (IRB no. 2017-07-001). The
study was conducted in accordance with the Declaration of
Helsinki.
Patient consent for publication
The present study obtained consent for publication
from all patients.
Competing interests
The authors declare that there are no competing
interests.
References
|
1
|
Siegel RL, Miller KD and Jemal A: Cancer
statistics, 2017. CA Cancer J Clin. 67:7–30. 2017. View Article : Google Scholar : PubMed/NCBI
|
|
2
|
Fearon ER: Molecular genetics of
colorectal cancer. Annu Rev Pathol. 6:479–507. 2011. View Article : Google Scholar
|
|
3
|
Cancer Genome Atlas Network: Comprehensive
molecular characterization of human colon and rectal cancer.
Nature. 487:330–337. 2012. View Article : Google Scholar : PubMed/NCBI
|
|
4
|
Easton JB and Houghton PJ: mTOR and cancer
therapy. Oncogene. 25:6436–6446. 2006. View Article : Google Scholar : PubMed/NCBI
|
|
5
|
Pópulo H, Lopes JM and Soares P: The mTOR
signalling pathway in human cancer. Int J Mol Sci. 13:1886–1918.
2012. View Article : Google Scholar : PubMed/NCBI
|
|
6
|
Ilagan E and Manning BD: Emerging role of
mTOR in the response to cancer therapeutics. Trends Cancer.
2:241–251. 2016. View Article : Google Scholar : PubMed/NCBI
|
|
7
|
Showkat M, Beigh MA and Andrabi KI: mTOR
signaling in protein translation regulation: Implications in cancer
genesis and therapeutic interventions. Mol Biol Int.
2014:6869842014. View Article : Google Scholar : PubMed/NCBI
|
|
8
|
Kurgan N, Tsakiridis E, Kouvelioti R,
Moore J, Klentrou P and Tsiani E: Inhibition of human lung cancer
cell proliferation and survival by Post-exercise serum is
associated with the inhibition of Akt, mTOR, p70 S6K, and Erk1/2.
Cancers (Basel). 9. pii: E46. 2017, View Article : Google Scholar
|
|
9
|
Wang H, Duan L, Zou Z, Li H, Yuan S, Chen
X, Zhang Y, Li X, Sun H, Zha H, et al: Activation of the
PI3K/Akt/mTOR/p70S6K pathway is involved in S100A4-induced
viability and migration in colorectal cancer cells. Int J Med Sci.
11:841–849. 2014. View Article : Google Scholar : PubMed/NCBI
|
|
10
|
Holz MK: The role of S6K1 in ER-positive
breast cancer. Cell Cycle. 11:3159–3165. 2012. View Article : Google Scholar : PubMed/NCBI
|
|
11
|
Gao J, Zhang Q, Xu J, Guo L and Li X:
Clinical significance of serum miR-21 in breast cancer compared
with CA153 and CEA. Chin J Cancer Res. 25:743–748. 2013.
|
|
12
|
Hamam R, Hamam D, Alsaleh KA, Kassem M,
Zaher W, Alfayez M, Aldahmash A and Alajez NM: Circulating
microRNAs in breast cancer: Novel diagnostic and prognostic
biomarkers. Cell Death Dis. 8:e30452017. View Article : Google Scholar : PubMed/NCBI
|
|
13
|
Rabinowits G, Gerçel-Taylor C, Day JM,
Taylor DD and Kloecker GH: Exosomal microRNA: A diagnostic marker
for lung cancer. Clin Lung Cancer. 10:42–46. 2009. View Article : Google Scholar : PubMed/NCBI
|
|
14
|
Wu X, Piper-Hunter MG, Crawford M, Nuovo
GJ, Marsh CB, Otterson GA and Nana-Sinkam SP: MicroRNAs in the
pathogenesis of lung cancer. J Thorac Oncol. 4:1028–1034. 2009.
View Article : Google Scholar : PubMed/NCBI
|
|
15
|
Slattery ML, Lee FY, Pellatt AJ, Mullany
LE, Stevens JR, Samowitz WS, Wolff RK and Herrick JS: Infrequently
expressed miRNAs in colorectal cancer tissue and tumor molecular
phenotype. Mod Pathol. 30:1152–1169. 2017. View Article : Google Scholar : PubMed/NCBI
|
|
16
|
Toyota M, Suzuki H, Sasaki Y, Maruyama R,
Imai K, Shinomura Y and Tokino T: Epigenetic silencing of
microRNA-34b/c and B-cell translocation gene 4 is associated with
CpG island meth-ylation in colorectal cancer. Cancer Res.
68:4123–4132. 2008. View Article : Google Scholar : PubMed/NCBI
|
|
17
|
Hermeking H: The miR-34 family in cancer
and apoptosis. Cell Death Differ. 17:193–199. 2010. View Article : Google Scholar
|
|
18
|
Xi L, Zhang Y, Kong S and Liang W: miR-34
inhibits growth and promotes apoptosis of osteosarcoma in nude mice
through targetly regulating TGIF2 expression. Biosci Rep. 38:pii:
BSR20180078. 2018. View Article : Google Scholar
|
|
19
|
Li XJ, Ren ZJ and Tang JH: MicroRNA-34a: A
potential therapeutic target in human cancer. Cell Death Dis.
5:e13272014. View Article : Google Scholar : PubMed/NCBI
|
|
20
|
Cimmino A, Calin GA, Fabbri M, Iorio MV,
Ferracin M, Shimizu M, Wojcik SE, Aqeilan RI, Zupo S, Dono M, et
al: miR-15 and miR-16 induce apoptosis by targeting BCL2. Proc Natl
Acad Sci USA. 102:13944–13949. 2005. View Article : Google Scholar : PubMed/NCBI
|
|
21
|
Yu S, Lu Z, Liu C, Meng Y, Ma Y, Zhao W,
Liu J, Yu J and Chen J: miRNA-96 suppresses KRAS and functions as a
tumor suppressor gene in pancreatic cancer. Cancer Res.
70:6015–6025. 2010. View Article : Google Scholar : PubMed/NCBI
|
|
22
|
Cai C, Chen QB, Han ZD, Zhang YQ, He HC,
Chen JH, Chen YR, Yang SB, Wu YD, Zeng YR, et al: miR-195 inhibits
tumor progression by targeting RPS6KB1 in Human prostate cancer.
Clin Cancer Res. 21:4922–4934. 2015. View Article : Google Scholar : PubMed/NCBI
|
|
23
|
Janaki Ramaiah M, Lavanya A, Honarpisheh
M, Zarea M, Bhadra U and Bhadra MP: MiR-15/16 complex targets p70S6
kinase 1 and controls cell proliferation in MDA-MB-231 breast
cancer cells. Gene. 552:255–264. 2014. View Article : Google Scholar : PubMed/NCBI
|
|
24
|
Dai GH, Ma PZ, Song XB, Liu N, Zhang T and
Wu B: MicroRNA-223-3p inhibits the angiogenesis of ischemic cardiac
microvascular endothelial cells via affecting RPS6KB1/hif-1a signal
pathway. PLoS One. 9:e1084682014. View Article : Google Scholar : PubMed/NCBI
|
|
25
|
Shi ZM, Wang J, Yan Z, You YP, Li CY, Qian
X, Yin Y, Zhao P, Wang YY, Wang XF, et al: MiR-128 inhibits tumor
growth and angiogenesis by targeting p70S6K1. PLoS One.
7:e327092012. View Article : Google Scholar : PubMed/NCBI
|
|
26
|
An HJ, Kwak SY, Yoo JO, Kim JS, Bae IH,
Park MJ, Cho MY, Kim J and Han YH: Novel miR-5582-5p functions as a
tumor suppressor by inducing apoptosis and cell cycle arrest in
cancer cells through direct targeting of GAB1, SHC1, and CDK2.
Biochim Biophys Acta. 1862:1926–1937. 2016. View Article : Google Scholar : PubMed/NCBI
|
|
27
|
Choe MH, Yoon Y, Kim J, Hwang SG, Han YH
and Kim JS: miR-550a-3-5p acts as a tumor suppressor and reverses
BRAF inhibitor resistance through the direct targeting of YAP. Cell
Death Dis. 9:6402018. View Article : Google Scholar : PubMed/NCBI
|
|
28
|
Kwak SY, Yoo JO, An HJ, Bae IH, Park MJ,
Kim J and Han YH: miR-5003-3p promotes epithelial-mesenchymal
transition in breast cancer cells through Snail stabilization and
direct targeting of E-cadherin. J Mol Cell Biol. Jun 9–2016.Epub
ahead of print. View Article : Google Scholar : PubMed/NCBI
|
|
29
|
Yoo JO, Kwak SY, An HJ, Bae IH, Park MJ
and Han YH: miR-181b-3p promotes epithelial-mesenchymal transition
in breast cancer cells through Snail stabilization by directly
targeting YWHAG. Biochim Biophys Acta. 1863:1601–1611. 2016.
View Article : Google Scholar : PubMed/NCBI
|
|
30
|
Kozomara A and Griffiths-Jones S: miRBase:
Integrating microRNA annotation and deep-sequencing data. Nucleic
Acids Res. 39(Database Issue): D152–D157. 2011. View Article : Google Scholar :
|
|
31
|
Livak KJ and Schmittgen TD: Analysis of
relative gene expression data using real-time quantitative PCR and
the 2(-Delta Delta C(T)) method. Methods. 25:402–408. 2001.
View Article : Google Scholar
|
|
32
|
Sato T, Stange DE, Ferrante M, Vries RG,
Van Es JH, Van den Brink S, Van Houdt WJ, Pronk A, Van Gorp J,
Siersema PD and Clevers H: Long-term expansion of epithelial
organoids from human colon, adenoma, adenocarcinoma, and Barrett's
epithelium. Gastroenterology. 141:1762–1772. 2011. View Article : Google Scholar : PubMed/NCBI
|
|
33
|
Grabinger T, Luks L, Kostadinova F,
Zimberlin C, Medema JP, Leist M and Brunner T: Ex vivo culture of
intestinal crypt organoids as a model system for assessing cell
death induction in intestinal epithelial cells and enteropathy.
Cell Death Dis. 5:e12282014. View Article : Google Scholar : PubMed/NCBI
|
|
34
|
Vlachos IS, Kostoulas N, Vergoulis T,
Georgakilas G, Reczko M, Maragkakis M, Paraskevopoulou MD,
Prionidis K, Dalamagas T and Hatzigeorgiou AG: DIANA miRPath v20:
Investigating the combinatorial effect of microRNAs in pathways.
Nucleic Acids Res. 40:W498–W504. 2012. View Article : Google Scholar : PubMed/NCBI
|
|
35
|
Agarwal V, Bell GW, Nam JW and Bartel DP:
Predicting effective microRNA target sites in mammalian mRNAs.
Elife. 4:2015. View Article : Google Scholar
|
|
36
|
Wong N and Wang X: miRDB: An online
resource for microRNA target prediction and functional annotations.
Nucleic Acids Res. 43(Database Issue): D146–D152. 2015. View Article : Google Scholar :
|
|
37
|
Park SY, Lee JH, Ha M, Nam JW and Kim VN:
miR-29 miRNAs activate p53 by targeting p85 alpha and CDC42. Nat
Struct Mol Biol. 16:23–29. 2009. View Article : Google Scholar
|
|
38
|
Shaheen S, Ahmed M, Lorenzi F and Nateri
AS: Spheroid-formation (Colonosphere) assay for in vitro assessment
and expansion of stem cells in colon cancer. Stem Cell Rev.
12:492–499. 2016. View Article : Google Scholar :
|
|
39
|
Shimono Y, Mukohyama J, Isobe T, Johnston
DM, Dalerba P and Suzuki A: Organoid culture of human cancer stem
cells. Methods Mol Biol. Sep 22–2016.Epub ahead of print.
View Article : Google Scholar : PubMed/NCBI
|
|
40
|
Crespo M, Vilar E, Tsai SY, Chang K, Amin
S, Srinivasan T, Zhang T, Pipalia NH, Chen HJ, Witherspoon M, et
al: Colonic organoids derived from human induced pluripotent stem
cells for modeling colorectal cancer and drug testing. Nat Med.
23:878–884. 2017. View Article : Google Scholar : PubMed/NCBI
|
|
41
|
Hubert CG, Rivera M, Spangler LC, Wu Q,
Mack SC, Prager BC, Couce M, McLendon RE, Sloan AE and Rich JN: A
Three-dimensional organoid culture system derived from human
glioblastomas recapitulates the hypoxic gradients and cancer stem
cell heterogeneity of tumors found in vivo. Cancer Res.
76:2465–2477. 2016. View Article : Google Scholar : PubMed/NCBI
|
|
42
|
Thompson EW, Newgreen DF and Tarin D:
Carcinoma invasion and metastasis: A role for
epithelial-mesenchymal transition? Cancer Res. 65:5991–5995. 2005.
View Article : Google Scholar : PubMed/NCBI
|
|
43
|
Amaral CL, Freitas LB, Tamura RE, Tavares
MR, Pavan IC, Bajgelman MC and Simabuco FM: S6Ks isoforms
contribute to viability, migration, docetaxel resistance and tumor
formation of prostate cancer cells. BMC Cancer. 16:6022016.
View Article : Google Scholar : PubMed/NCBI
|
|
44
|
Fu YP, Edvardsen H, Kaushiva A, Arhancet
JP, Howe TM, Kohaar I, Porter-Gill P, Shah A, Landmark-Høyvik H,
Fosså SD, et al: NOTCH2 in breast cancer: Association of SNP
rs11249433 with gene expression in ER-positive breast tumors
without TP53 mutations. Mol Cancer. 9:1132010. View Article : Google Scholar : PubMed/NCBI
|
|
45
|
Ekim B, Magnuson B, Acosta-Jaquez HA,
Keller JA, Feener EP and Fingar DC: mTOR kinase domain
phosphorylation promotes mTORC1 signaling, cell growth, and cell
cycle progression. Mol Cell Biol. 31:2787–2801. 2011. View Article : Google Scholar : PubMed/NCBI
|
|
46
|
Danielsen SA, Eide PW, Nesbakken A, Guren
T, Leithe E and Lothe RA: Portrait of the PI3K/AKT pathway in
colorectal cancer. Biochim Biophys Acta. 1855:104–121. 2015.
|
|
47
|
Zhang T, Ma Y, Fang J, Liu C and Chen L: A
deregulated PI3K-AKT signaling pathway in patients with colorectal
cancer. J Gastrointest Cancer. 50:35–41. 2019. View Article : Google Scholar
|
|
48
|
Johnson SM, Gulhati P, Rampy BA, Han Y,
Rychahou PG, Doan HQ, Weiss HL and Evers BM: Novel expression
patterns of PI3K/Akt/mTOR signaling pathway components in
colorectal cancer. J Am Coll Surg. 210:767–778. 2010. View Article : Google Scholar : PubMed/NCBI
|
|
49
|
Crowell JA, Steele VE and Fay JR:
Targeting the AKT protein kinase for cancer chemoprevention. Mol
Cancer Ther. 6:2139–2148. 2007. View Article : Google Scholar : PubMed/NCBI
|
|
50
|
Bitting RL and Armstrong AJ: Targeting the
PI3K/Akt/mTOR pathway in castration-resistant prostate cancer.
Endocr Relat Cancer. 20:R83–R99. 2013. View Article : Google Scholar : PubMed/NCBI
|
|
51
|
Hassan B, Akcakanat A, Holder AM and
Meric-Bernstam F: Targeting the PI3-kinase/Akt/mTOR signaling
pathway. Surg Oncol Clin N Am. 22:641–664. 2013. View Article : Google Scholar : PubMed/NCBI
|
|
52
|
Soliman GA: The role of mechanistic target
of rapamycin (mTOR) complexes signaling in the immune responses.
Nutrients. 5:2231–2257. 2013. View Article : Google Scholar : PubMed/NCBI
|
|
53
|
Li D, Liu X, Lin L, Hou J, Li N, Wang C,
Wang P, Zhang Q, Zhang P, Zhou W, et al: MicroRNA-99a inhibits
hepatocellular carcinoma growth and correlates with prognosis of
patients with hepatocellular carcinoma. J Biol Chem.
286:36677–36685. 2011. View Article : Google Scholar : PubMed/NCBI
|
|
54
|
Zhang X, Shi H, Tang H, Fang Z, Wang J and
Cui S: miR-218 inhibits the invasion and migration of colon cancer
cells by targeting the PI3K/Akt/mTOR signaling pathway. Int J Mol
Med. 35:1301–1308. 2015. View Article : Google Scholar : PubMed/NCBI
|
|
55
|
Xu C, Zeng Q, Xu W, Jiao L, Chen Y, Zhang
Z, Wu C, Jin T, Pan A, Wei R, et al: miRNA-100 inhibits human
bladder urothe-lial carcinogenesis by directly targeting mTOR. Mol
Cancer Ther. 12:207–219. 2013. View Article : Google Scholar
|
|
56
|
Fornari F, Milazzo M, Chieco P, Negrini M,
Calin GA, Grazi GL, Pollutri D, Croce CM, Bolondi L and Gramantieri
L: MiR-199a-3p regulates mTOR and c-Met to influence the
doxorubicin sensitivity of human hepatocarcinoma cells. Cancer Res.
70:5184–5193. 2010. View Article : Google Scholar : PubMed/NCBI
|
|
57
|
Chen W, Zhao X, Dong Z, Cao G and Zhang S:
Identification of microRNA profiles in salivary adenoid cystic
carcinoma cells during metastatic progression. Oncol Lett.
7:2029–2034. 2014. View Article : Google Scholar : PubMed/NCBI
|