Introduction
Glioblastoma (1,2) is
the most common form of malignant brain cancer in adults. It is
highly lethal, with a median survival of <15 months (3). Surgery, radiation therapy and
temozolomide are the main therapeutic options against glioblastoma.
A lack of expression of methyl guanyl methyltransferase [MGMT; a
DNA repair enzyme (4) that
reverses the temozolomide-induced O6 guanine
methylation] due to MGMT promoter methylation is associated with
improved clinical response to temozolomide, whereas patients with
unmethylated MGMT promoters exhibit resistance to temozolomide
(4). Temozolomide resistance and
radiotherapy resistance represent major challenges in the treatment
of this disease (3,5,6).
Brain tumors are not only developed by gene
mutation, but also by epigenetic changes, mainly DNA methylation,
histone acetylation, histone methylation and microRNA dysregulation
(7-11). Unlike genetic alterations,
epigenetic changes are reversible, and as such are considered
attractive targets for cancer therapy. Two main epigenetic
modulators were investigated in the present study, one that targets
the enhancer of zeste homolog 2 (EZH2) histone methyltransferase
[3-deazaneplanocin A (DZ-Nep) (12)], and a second one that targets
histone deacetylases (HDACs), panobinostat (13).
EZH2, the catalytically active component of polycomb
repressive complex 2, trimethylates lysine 27 of histone H3
(H3K27met3) (14). EZH2 is
overexpressed in ovarian carcinoma (15), prostate cancer (16), glioblastoma (17) and other tumors, and predicts poor
prognosis, high tumor grade and high clinical stage (18) by favoring cell invasion and tumor
angiogenesis. DZ-Nep, an inhibitor of EZH2, demonstrated antitumor
activity against breast (19),
lung (20), brain (21), prostate (22) and liver (23) cancer cells, blocked cancer cell
migration and invasion in prostate cancer cells (22), and reduced tumor-associated blood
vessel formation in a glioblastoma xenograft model, suggesting
antiangiogenic activity in vivo (18,24).
Recent studies have reinforced the value of EZH2 as a target in
cancer, even associated microRNAs and long non coding RNAs with the
regulation of EZH2 (25-27).
Histone acetylation by histone acetyltransferases
induces a relaxed status of chromatin and promotes the expression
of adjacent genes, whereas HDACs condense chromatin and inhibit
gene expression. One proposed strategy against cancer is the use of
inhibitors of HDACs, such as panobinostat (28-33),
that target certain pathways that serve important roles in cancer
development (13,34-36)
at the level of the cell cycle, apoptosis, DNA damage responses,
metastasis, angiogenesis or autophagy.
The aim of the present study was to investigate the
therapeutic potential of different combinations of DZ-Nep,
panobinostat and temozolomide for the in vitro treatment of
glioblastoma, as well as the possible synergistic effects that
could exist between them.
Materials and methods
In vitro culture of cell lines and
primary tumors
Cell lines
A172 (CRL1620), U87MG (HTB14), T98G (92090213),
MOG-C-CCM (86022702), LN405 (ACC189), and GOS-3 (ACC408) human
glioblastoma cell lines were used for the study. A172 and U87MG
(glioblastoma of unknown origin) were obtained from the American
Type Culture Collection. T98G and MOG-C-CCM were obtained from the
European Collection of Authenticated Cell Cultures. LN405 and GOS-3
were obtained from the German Collection of Microorganisms and Cell
Cultures GmbH. A172, GOS-3, T98G, MOG-C-CCM, LN405 cells were
cultured using RPMI L-Glutamax medium (Gibco; Thermo Fisher
Scientific, Inc.), supplemented with 10% fetal bovine serum (FBS;
Gibco; Thermo Fisher Scientific, Inc.), 1% penicillin/streptomycin
(Gibco; Thermo Fisher Scientific, Inc.) and 0.1% amphotericin B
(Gibco; Thermo Fisher Scientific, Inc.). U87MG cells were cultured
using DMEM L-Glutamax (Gibco; Thermo Fisher Scientific, Inc.)
supplemented with 10% FBS, 4% non-essential amino acids, 1%
penicillin/streptomycin and 0.1% amphotericin B. Cells were
maintained under normoxic conditions at 37°C with a humid
atmosphere of 5% CO2. Subcultures were performed upon
reaching ~80% confluence using trypsin/EDTA (Gibco; Thermo Fisher
Scientific, Inc.), after a previous wash with phosphate buffered
saline (PBS; Gibco; Thermo Fisher Scientific, Inc.). Table I presents the molecular profiles of
the cell lines used.
 | Table IMolecular profile of PTEN and p53
genes in cell lines and primary cell cultures. |
Table I
Molecular profile of PTEN and p53
genes in cell lines and primary cell cultures.
| Cell line | Type | PTEN | p53 |
|---|
| A172 | GB | MUT (60) | WT (61) |
| A172-TMZR | GB | MUT (60) | WT (61) |
| U87MG | GB | MUT (62) | WT (61) |
| LN405 | GB | MUTa | MUTa |
| LN405-TMZR | GB | MUTa | MUTa |
| T98G | GB | MUT (63) | MUT (61) |
| GOS-3 | GB | hemi-METH (64) | WT (65) |
| MOG-G-CCM | GB | hemi-METH (64) | MUT (66) |
| PE8 | GB-1 | ND | ND |
| PE9 | GB-1 | ND | ND |
Obtaining temozolomide-resistant cell
lines
Cell lines A172 and LN405 were exposed to 500 µM
temozolomide for 72 h at 37°C in an atmosphere of 5%
CO2. The surviving cells were subsequently allowed to
grow until they developed colonies. The colonies were trypsinized
and reseeded. Once the cells reached ~70% confluence, they were
treated again with temozolomide as aforementioned. There were three
total exposures to temozolomide. The cell lines obtained, with
increased resistance to temozolomide, were designated A172-TMZR and
LN405-TMZR, and were cultured under the same conditions as the
parental cells from which they were derived.
Every 10 passes, a recall dose (500 µM) was followed
by a rest step as described above. Regarding the final dose of
temozolomide to which cells were resistant to, note that it was not
intended for the resistant cells to acquire resistance to a dose of
temozolomide at which all parental cells would die, but that the
resistant lines exhibited greater resistance to the drug
(particularly A172, as LN405 started with a large basal
resistance).
Culture of primary tumors
The study was authorized by the Ethics Committee of
the University of Navarra (ref. no. CEI0502012) for conducting
research on the genetics of tumors of the nervous system. All
samples were fully anonymized prior to accessing; therefore,
patient details were not known. Patients provided informed consent
for the use of their samples for research. Primary tumors obtained
from the Hospital Complex of Navarra were cultured. Tumor fragments
were completely frozen in vials at -80°C and in liquid nitrogen.
The remainder of the tumor tissue was cut with scalpels into ~22-mm
thick fragments, which were treated with 0.1% trypsin and later
mechanically processed until tumor tissue was disintegrated into
individual cells. The cells were cultured in flasks pretreated with
laminin in neurosphere medium (composition described below).
Starting with 1 mg/ml laminin (Sigma-Aldrich; Merck KGaA), a 10
µg/ml final concentration solution was prepared using PBS. The
culture flasks were treated by adding 3 ml of this solution. After
incubating the flasks overnight at 4°C, excess laminin was removed
and three washes were made with 3 ml of PBS. The culture medium
used was DMEM + F12 (Gibco; Thermo Fisher Scientific, Inc.) in the
absence of serum and supplemented with 1X B27 (Gibco; Thermo Fisher
Scientific, Inc.), 20 ng/ml epidermal growth factor (Sigma-Aldrich;
Merck KGaA) and 20 ng/ml basic fibroblast growth factor
(Sigma-Aldrich; Thermo Fisher Scientific, Inc.). The cell lines
derived from primary tumors used in this study were termed PE8 and
PE9. Short tandem repeat (STR) profiles of both cell lines were
analyzed (Figs. S1 and S2) and
the resulting alleles of 16 STR loci are listed for further
matching studies (Tables SI and
SII).
Experiments were performed using the primary tumor
cell lines throughout the study with the various combinations of
drugs, ensuring that cells did not undergo >20 passes.
Pharmacological treatments
DZ-Nep, panobinostat and temozolomide (all
Sigma-Aldrich; Merck KGaA), in individual or combined treatments,
were used to treat the cell lines and primary cultures under
investigation. A stock solution of the drugs was prepared by
diluting them in DMSO at a concentration of 33.45 mM (DZ-Nep), 500
µM (panobinostat), and 51.5 mM (temozolomide). The drugs were
stored in aliquots at -20°C (DZ-Nep and temozolomide) or -80°C
(panobinostat). Each drug was diluted in medium to the
corresponding concentration for each experiment. All experimental
treatments were performed with the same quantity of DMSO diluted in
medium, always <0.1%. Control treatments entailed treatment with
DMSO (<0.1%) only diluted in medium.
Analysis of cell viability using
MTT
Cell viability was measured using an MTT
colorimetric assay from Sigma-Aldrich (Merck KGaA). Cells were
seeded in 96-well plates at a density of 5,000 cells/well, and 8
replicates were used for each control and each treatment. Cells
were treated with different concentrations of each drug for 0, 24,
48 and 72 h at 37°C. The concentrations employed for DZ-Nep and
temozolomide spanned a spectrum from 1-200 µM. Panobinostat
treatments covered a range of 0.001-200 µM. After the
aforementioned treatment durations, MTT solution (0.5 mg/ml) was
added to the plates and incubated for 2 h. After incubation, the
medium was removed and DMSO was added to the plates to dissolve the
formazan precipitates. The absorbance was measured at 550 nm.
Study of the synergy between drugs
according to the combination index (CI)
Definition of synergy
The combination of multiple treatments in
glioblastoma is a requirement imposed due to the genetic
heterogeneity of this type of brain tumor (37,38).
A treatment with a single active compound can lead to an incomplete
eradication of the tumor, or even to the appearance of resistance
against that particular compound; however, not all combinations of
chemotherapeutics are equally effective. Ideally, the objective of
treatment is the potentiation of the pharmaceutical effect on the
tumor, observing a response greater than predicted. This
enhancement is referred to as synergy, and may be due to a feedback
between the mechanisms of action of the two drugs. The effect
observed when the combination of the two drugs is less effective
than the application of the two drugs separately is known as
antagonism. An additive effect would correspond to the effect
observed when there is an absence of antagonism or synergy; that
is, when the effect produced by the two drugs supplied
simultaneously corresponds to the addition of the effects produced
by the two drugs supplied individually.
However, finding a mathematical model that explains
the antagonistic, additive or synergistic effects is a
controversial issue (39,40). For example, if drug A is able to
eliminate 30% of the tumor at a certain dose, and drug B another
30% at a given dose, assuming, as a consequence, that 60% of the
tumor would be eliminated if the two drugs followed an additive
model would be an excessive mathematical simplification. This and
other simplistic mathematical approaches have led to an erroneous
application of the concept of synergy in several pharmacological
studies (41).
Chou-Talalay's CI
Other mathematical approaches consider the different
non[sttbl]linear forms of the dose/effect curves that can stop the
different drugs, and attempt to determine which concentration of
each drug is capable of producing an equivalent quantitative
effect. These approaches are known as dose-effect strategies
(42), and in them the putative
additive effect of a combination depends on the individual
dose-effect curves and follows the mathematical model of Loewe's
addiction (43). Chou and Talalay
designed a simple equation (Fig.
S3A) capable of representing the synergistic effect evaluated
in vitro as a CI. Without entering into the mathematical
details of this equation, it could be summarized as follows: For a
combined dose of two drugs (A and B) for which a certain affected
cellular fraction (Fa) is observed, the CI would correspond to the
sum of the fractions of the doses of each drug in combination
[(Dcomb)1 or(Dcomb)2] divided by the dose of
each individual drug at which the same effect is observed
[(Dalone)1 or (Dalone)2]. If CI<1, the
combination could be considered synergistic; if CI>1, the
combination would be antagonistic; and CI=1 would be equivalent to
an additive effect (Fig.
S3A).
One of the advantages of this equation is the
assessment of the synergy for each Fa. The higher the concentration
of drugs (supplied individually or in combination), the higher the
Fa of the affected population. However, synergy does not
necessarily have to be constant through all the fractions affected
by the treatment of a combination of drugs at different
concentrations.
A study of in vitro synergy could provide
infinite combi-nations of concentrations of two drugs. Therefore,
Chou (44) recommends testing the
drug combinations following a constant ratio. Drug concentrations
are so mixed following a constant ratio and administered in
combination, from lower to higher doses. A good approximation is to
use the half-maximal inhibitory concentration (IC) of each drug in
a 1:1 ratio so that each compound has the same potency in the
combination. However, due to the nature of each chemotherapeutic,
this can be difficult to determine, rendering it necessary to work
with other quotients. For example, one of the drugs may have lower
solubility, or may be more difficult to obtain due to economic
reasons, or it may even be the case that the margin in which an
effect proportional to the dose delivered is observed is very
narrow. In those cases, combinations of drugs may be tested
following a non-constant ratio of drug concentrations.
Use of Compusyn software in the
combinatorial study of drugs
The free Compusyn software (http://www.combosyn.com/), developed by Chou's group,
allows rapid collection of the ICs calculated for each drug
combination. Its representation in graphs with the ICs of each drug
combination against their respective Fa (Fig. S3A) (44) is a useful tool that greatly
simplifies the analysis of drug combinations.
Study of the combination of ≥3
drugs
Often, the possible synergy of drugs is analyzed by
the combination of compounds in pairs, which facilitates
understanding of the results, as it represents a common situation
in clinical practice. Using combinations of ≥3 drugs is less common
clinically. The CI equation proposed by Chou and Talalay can be
used for the analysis of >2 drugs, and the Compusyn program
allows the study of the synergy of up to three simultaneous drugs.
However, it must be considered that the synergy obtained by the use
of ≥3 drugs may be due solely to the synergistic effect of two of
these drugs. Therefore, special care must be taken when
interpreting the results of these analyses (45). In the present study, Compusyn was
used for the combinatorial analysis of three different drugs:
DZ-Nep, panobinostat and temozolomide. The drugs were combined in
pairs or triplets. All combinations were studied following a
constant ratio.
Drug combination studies and their
synergy quantification
A drug combination study was conducted to determine
the synergistic potential of the drugs used according to the
Chou-Talalay method (46).
Commercial cell lines were used; however, due to their slower
proliferation, cell lines derived from primary tumors were not
used. Cells (5,000/well) were seeded in 96-well plates. The
following day, the culture medium was replaced with fresh medium
containing combinations of 5 different concentrations for each drug
(Table II). The effects of
DZ-Nep, panobinostat and temozolomide administered individually or
in combination were studied for 72 h. At the same time, whether
pre-treatment of a drug followed by a post-treatment of a separate
drug was a more efficient therapeutic strategy than simultaneous
double combination treatment was evaluated. For this, 5,000 cells
per well were seeded in 96-well plates, and the following day the
medium was changed by 5 different concentrations of each of the
drugs to be used in each pre-treatment. At 24 h later, the medium
was removed and changed to 5 different concentrations of each of
the possible post-treatments, allowing them to incubate for 48 h.
In any case, the experiments with combined treatment or with
individual pre-treatment followed by post-treatment were not
incubated for longer than 72 h. After incubation, MTT reagent was
added at a concentration of 0.5 mg/ml, and the plates were
incubated for 2 h at 37°C. The absorbance was measured at 550 nm,
and the percentage of surviving cells was determined for each
treatment in relation to untreated control cells. The Fa was
determined, which represents the inhibition of the respective
proliferation at each treatment, whereby an inhibition of 0%
corresponds to Fa=0, and an inhibition of 100% corresponds to Fa=1.
CI values were calculated and represented using dose-response
graphs in Compusyn software (47).
All combinations of drugs were analyzed using a constant ratio
(DZ-Nep, 5 µM; panobinostat, 0.01 nM; temozolomide, 12.5 µM). Drug
concentrations are presented in Table
II.
| Table IIExperimental concentrations of
compounds. |
Table II
Experimental concentrations of
compounds.
A, Concentrations
used for in vitro experiments (µM)
|
|---|
| Cell line | DZ-Nep | Panobinostat | Temozolomide |
|---|
| A172 | 5 | 0.02 | 0.2 |
| A172-TMZR | 5 | 0.02 | 0.2 |
| U87MG | 5 | 0.02 | 0.2 |
| LN405 | 5 | 0.02 | 0.2 |
| LN405-TMZR | 5 | 0.02 | 0.2 |
| T98G | 5 | 0.02 | 0.2 |
| GOS-3 | 5 | 0.02 | 0.2 |
| MOG-G-CCM | 5 | 0.02 | 0.2 |
| PE8 | 5 | 0.02 | 0.2 |
| PE9 | 5 | 0.02 | 0.2 |
|
| B, Concentrations
used for combinatorial experiments (µM) |
|
| Cell line | DZ-Nep | Panobinostat | Temozolomide |
|
| U87MG | 5-80 (5, 10, 20,
40, 80) | 0.01-0.16 (0.01,
0.02, 0.04, | 12.5-200 (12.5, 25,
50, |
| | 0.08, 0.16) | 100, 200) |
| LN405 | 5-80 | 0.01-0.16 | 12.5-200 |
| LN405-TMZR | 5-80 | 0.01-0.16 | 12.5-200 |
| GOS-3 | 5-80 | 0.01-0.16 | 12.5-200 |
| MOG-G-CCM | 5-80 | 0.01-0.16 | 12.5-200 |
|
| C, Concentrations
used for triple combinations (µM) |
|
| Cell line | DZ-Nep | Panobinostat | Temozolomide |
|
| U87MG | 1.66-26.67 (1.667,
3.333, | 0.003-0.053 (0.003,
0.007, | 4.167-66.67 (4.167,
8.333, |
| 6.667, 13.333,
26.667) | 0.013, 0.027,
0.053) | 16.667, 33.333,
66.667) |
| LN405 | 1.66-26.67 | 0.003-0.053 | 4.167-66.67 |
| LN405-TMZR | 1.66-26.67 | 0.003-0.053 | 4.167-66.67 |
| GOS-3 | 1.66-26.67 | 0.003-0.053 | 4.167-66.67 |
| MOG-G-CCM | 1.66-26.67 | 0.003-0.053 | 4.167-66.67 |
In vitro pharmacological effect
Cell lines and cells derived from primary tumors
were incubated for 72 h with DZ-Nep, panobinostat and temozolomide,
according to Table II (33,48,49).
Treatments were performed with individual drugs or two-drug
combinations. After 72 h of incubation, the cell culture medium was
removed and replaced with medium supplemented with fresh drug every
24 h. After incubation, cells were trypsinized, counted and used to
perform the in vitro functional experiments. Part of the
cells were frozen at -80°C for subsequent extraction of mRNA and
proteins. All in vitro experiments (apoptosis, soft agar
colony formation and colony formation assays on plate) were
performed in triplicate.
Apoptosis assay
The effects of drugs on the activation of
caspase-mediated apoptosis were studied in A172, A172-TMZR and
LN405 cells. For this, 5,000 cells/well were plated in 96-well
plates for 24 h, after which the culture medium was replaced by
cell medium containing drugs at the following concentrations: 5 µM
DZ-Nep, 20 nM panobinostat and/or 200 nM temozolomide. Drugs were
tested individually or in pairs. Cells were incubated at 37°C with
the drugs for 2 h. Then, the activity levels of caspases 3 and 7
were quantified by luminescence using a Caspase-Glo® 3/7
Assay kit (cat. no. G8090; Promega Corporation), according to the
manufacturer's protocols.
Soft agar colony formation assay
To study in vitro cell tumorigenicity under
conditions of anchorage independence, cells were seeded in agarose
in 6-well plates. For this, a solution containing 2 ml of 0.5%
agarose (Pronadisa; Laboratorios Conda) and DMEM (Sigma-Aldrich;
Merck KGaA) was first added to each well. Once this first agarose
layer had set, 10,000 cells diluted in 2 ml of 0.2% agarose and
DMEM were added. When this second layer solidified, 2 ml of the
corresponding culture medium of each cell line supplemented with
10% FBS was added to each well and renewed every 3 days. After 4
weeks of incubation, the medium was removed and the colonies were
stained with 250 µl of 1% crystal violet (Sigma-Aldrich; Merck
KGaA) overnight at 4°C. Five washes with autoclaved water were
performed to improve cell visualization. Images were acquired (5
photos/well) under a microscope (magnification, x10), and the
colonies formed in each visual field were counted. The different
pharmacological conditions were seeded in triplicate for each cell
line in three independent experiments. This assay was not performed
on A172, A172-TMZR, GOS-3 and MOG-C-CCM cells, due to sub-optimal
cell growth under these experimental conditions.
Colony formation assay in adherent
conditions
To study cellular clonogenicity under anchoring
conditions, the treated cells were seeded in 6-well plates, and
allowed to incubate for 14 days. Then, the medium was removed and
the cells were fixed using 4% paraformaldehyde (Panreac AppliChem
ITW Reagents) for 30 min, after which they were stained with 1%
crystal violet for 15 min (both at room temperature). The colonies
formed were counted using a Colony Counter 560 (Suntex Instruments
Co., Ltd.). The number of cells seeded varied depending on the cell
line; 300 cells/well were seeded for all cell lines, with the
exception of PE8, PE9 and GOS-3, for which 700 cells/well were
seeded.
Molecular studies
mRNA extraction and reverse
transcription (RT)
mRNA was extracted from the treated cell pellets for
72 h with the different drug conditions using an All Prep
DNA/RNA/Protein Mini kit (Qiagen GmbH), according to the
manufacturer's protocols. The mRNA concentration was determined
using a NanoDrop™ system (NanoDrop Technologies; Thermo Fisher
Scientific, Inc.).
The RT of mRNA to cDNA was performed using 2 μg of
RNA, 250 µg of random primers and 2 µl of dNTPs (stock 5 µM) in a
final volume of 12 µl of RNase-free water. The mixture was
incubated at 65°C for 5 min, after which 4 µl of 5X buffer and 2 µl
of DTT were added. After 2 min at 42°C, 1 µl of the enzyme
SuperScript™ II Reverse Transcriptase (Gibco; Thermo Fisher
Scientific, Inc.) was added and incu-bated at 25°C for 10 min, at
42°C for 50 min and at 70°C for 15 min. The obtained cDNA was
diluted 1/5 in autoclaved water and stored at -20°C until
subsequent use.
Quantitative PCR (qPCR)
Gene expression was measured via RT-qPCR. The design
and analysis of each pair of primers was conducted using Primer3
software (http://primer3.sourceforge.net/) and Primer Blast
(http://www.ncbi.nlm.nih.gov/tools/primer-blast/).
Primer sequences are shown in Table
III. The primers used were selected and aligned with the
nucleotide sequences obtained from RefSeq (http://www.ncbi.nlm.nih.gov/RefSeq/) and UCSC Genome
Browser (http://genome.ucsc.edu/).
| Table IIISequences of the primers used for
quantitative PCR. |
Table III
Sequences of the primers used for
quantitative PCR.
| Gene | Forward primer
(5'-3') | Reverse primer
(5'-3') | Tm (°C) | Annealing
temperature (°C) |
|---|
| GAPDH |
AACGTGTCAGTGGTGGACCTG |
AGTGGGTGTCGCTGTTGAAGT | 67.4 | 63.4 |
| BAX |
TTTGCTTCAGGGTTTCATCC |
CAGTTGAAGTTGCCGTCAGA | 60 | 56 |
| NOXA |
CTTGGAAACGGAAGATGGAA |
CGCCCAGTCTAATCACAGGT | 60 | 56 |
| BCL2 |
GGATGCCTTTGTGGAACTGT |
AGCCTGCAGCTTTGTTTCA | 60 | 56 |
| BCL-XL |
TCTGGTCCCTTGCAGCTAGT |
CAGGGAGGCTAAGGGGTAAG | 60 | 56 |
For RT-qPCR reactions, an IQ5 Multicolor Real-Time
PCR Detection System (Bio-Rad Laboratories, Inc.) was used. In each
well, 1.25 µl cDNA, 12.5 µl iQ™ SYBR® Green (cat. no.
1708882 Bio-Rad Laboratories, Inc.), 0.5 µl sense and antisense
primers and 10.25 µl milliQ autoclaved water were added. The
samples were subjected to the following protocol: Initial
denaturation cycle at 95°C for 10 min, followed by 45 cycles of
amplification comprising 30 sec at 95°C, 30 sec at the annealing
temperature of each pair of primers, and 30 sec at 72°C. After the
amplification step, the melting temperature curve was analyzed from
70°C to 90°C, with a 0.5°C increased at every 30 sec. The
transcripts of the genes were normal-ized with the transcripts of
the GAPDH control gene in each sample. Quantification and
normalization of the genes was performed using the
2-ΔΔCq method (50),
which allows the relative expression of the genes in a study to be
quantified. Three independent experiments were performed with the
samples subjected to a triplicate amplification protocol.
Statistical analysis
Three independent experiments were performed. All
data are presented as the mean ± standard deviation. All data are
normalized with respect to controls. To analyze the differences
observed between the different pharmacological conditions, ANOVA
was performed followed by Tukey's post hoc test using GraphPad
Prism 7 software (GraphPad Software, Inc.). P<0.05 was
considered to indicate a statistically significant difference.
Results
Development of temozolomide-resistant
glioblastoma cell lines
In this study a range of cell lines with different
p53 and PTEN gene statuses were employed, with
different sensitivities to temozolomide. The lines were selected
based on their molecular status for these genes documented in the
literature. In addition, the development of temozolomide resistance
was mimicked by exposing the cell lines A172 (p53wt/PTENmut) and
LN405 (p53mut/PTENmut) to a concentration of 500 µM of
temozolomide. The resulting cell lines were designated A172-TMZR
and LN405-TMZR (Table I). Fig. S3B shows the increase in resistance
to temozolomide in these two cell lines. A172-TMZR showed a
significant increase in resistance to temozolomide compared with
A172 at the highest concentrations studied (P<0.001). LN405-TMZR
cells exhibited a significant increase in resistance to
temozolomide at very high concentrations of this drug compared with
LN405 cells (P<0.05). It should be considered, however, that the
LN405 line is naturally more resistant to temozolomide than the
A172 line, which may explain the differences in the resistance
acquired to this drug by each cell line. Also, it would be of
interest to see whether, after the treatments, cells may develop
vulnerabilities to the other drugs. Those vulnerabilities may be
similar to those of the other temozolomide-resistant cell lines
(51).
DZ-Nep + panobinostat combined
treatment
DZ-Nep + panobinostat combined
treatment shows an additive/synergistic effect at the highest
concentrations
In DZ-Nep + panobinostat combined treatment, a
consistent-tendency towards synergy was not observed in all cell
lines. Simultaneous treatments resulted a greater Fa than the
therapies performed with pre-treatment and post-treatment (Table SIII).
All concentrations used in double simultaneous
treatments turned out to be synergistic in U87MG cells, whereas for
the other cell lines, synergistic effects appeared only in the
treatment combinations that resulted in a greater Fa, as confirmed
by the predictions obtained by Compusyn. These predictions
indicated a clear synergistic effect in DZ-Nep + panobinostat
combined treatment in the majority of cell lines; however, an
additive effect was predicted in the LN405 cell line, while in
LN405-TMZR, the prediction indicated that the combination was
antagonistic.
Conversely, predictions of pre-treatment therapies
followed by post-treatment do not appear to show a clear tendency
to synergy. Pre-treatment with DZ-Nep shows synergy with
panobinostat post-treatment in MOG-G-CCM cells, whereas the
pre-treatment with panobinostat shows the greatest synergy in U87MG
cells.
LN405 and LN405-TMZR cells, although showing less
synergism to the double simultaneous treatment of DZ-Nep +
panobinostat, clearly exhibited synergistic CI indexes in this
therapeutic strategy. Even so, DZ-Nep + panobinostat double
simultaneous treatment was the one that induced the highest
elevated fractions, indicating this as the most promising
therapeutic strategy for clinical settings. The ICs obtained
(Table SIII) were plotted on a
logarithmic scale in Fig. S4
using the Compusyn program.
Regarding GOS-3 (Table
SIII), there is synergy only for the panobinostat
pre-treatment/DZ-Nep post-treatment and at certain concentrations
of DZ-Nep pre-treatment/panobinostat post-treatment. Compusyn
predicts synergy at higher concentrations for the simultaneous 72-h
(D72P72) treatment (Fig. S4),
whereas for the other treatments it does not predict synergy.
Simultaneous D72P72 treatment produces high, non-synergistic
indices, potentially because the Fa values obtained are low. Thus,
synergy is predicted for the simultaneous double treatment at
higher concentrations, but only an additive effect was detected
with the largest experimental concentrations used.
DZ-Nep + panobinostat combined
treatment reduces cell clonogenicity of glioblastoma cells
The double treatment of DZ-Nep + panobinostat
significantly decreased the number of colonies on plates
(P<0.001) in T98G, LN405, LN405-TMZR, MOG-G-CCM, U87MG, A172 and
A172-TMZR cells, and in PE9 primary tumor cells. The clonogenicity
of PE8 cells was significantly reduced following exposure to each
individual treatment with respect to the control; however, combined
treatment was not significantly different to the individual
treatments. In GOS3 cells, the individual treatments induced
significant decreases in clonogenicity compared with the control;
however, combined treatment was not significantly different to
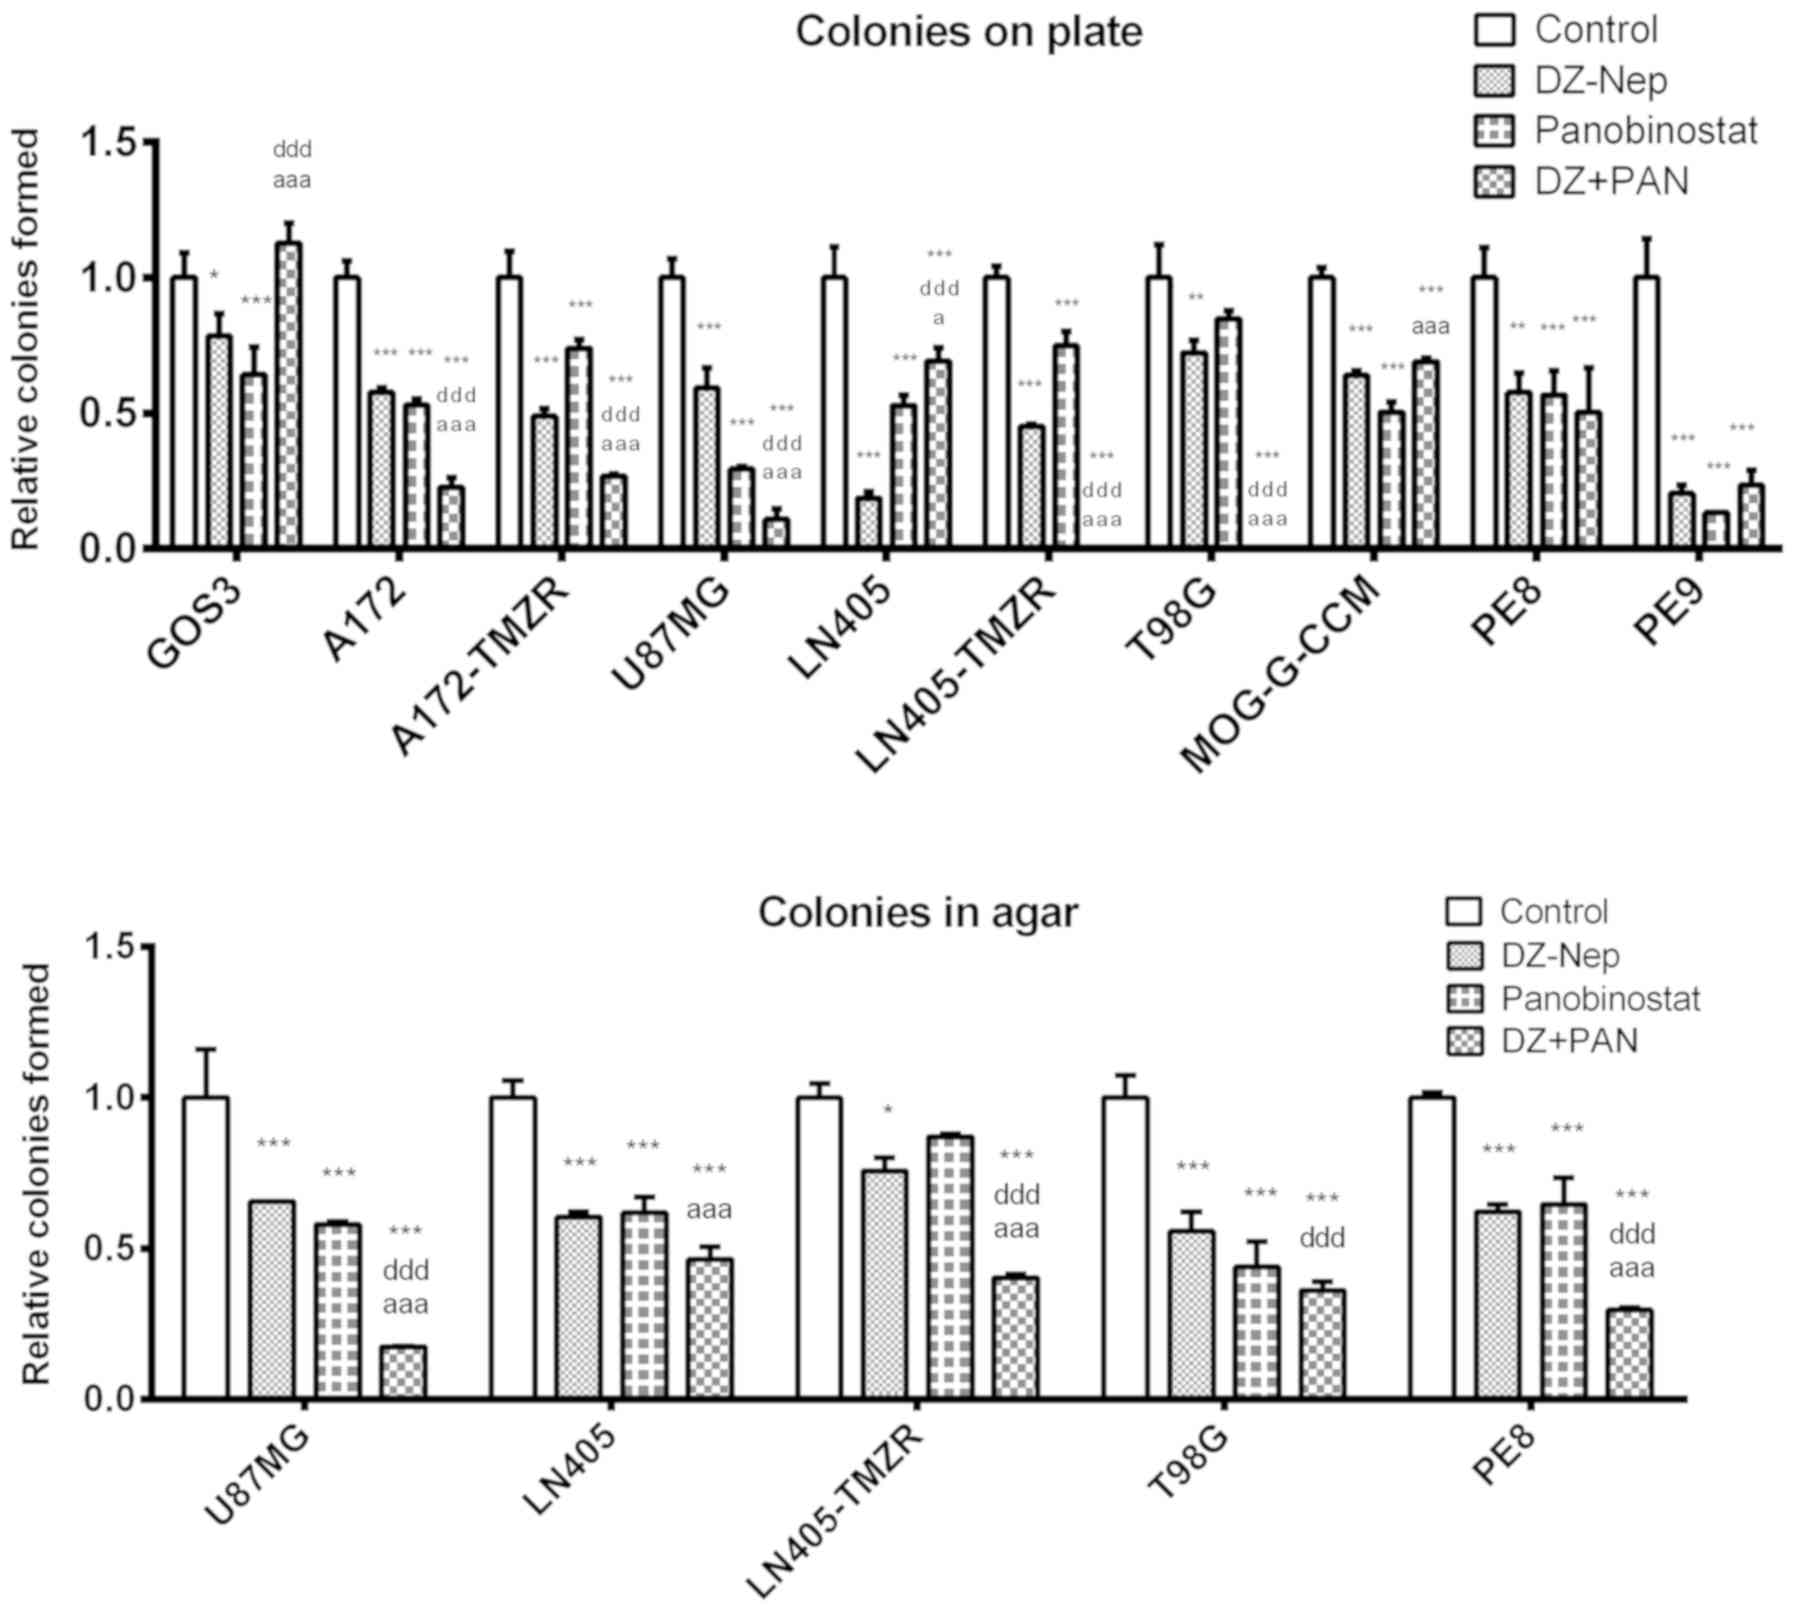
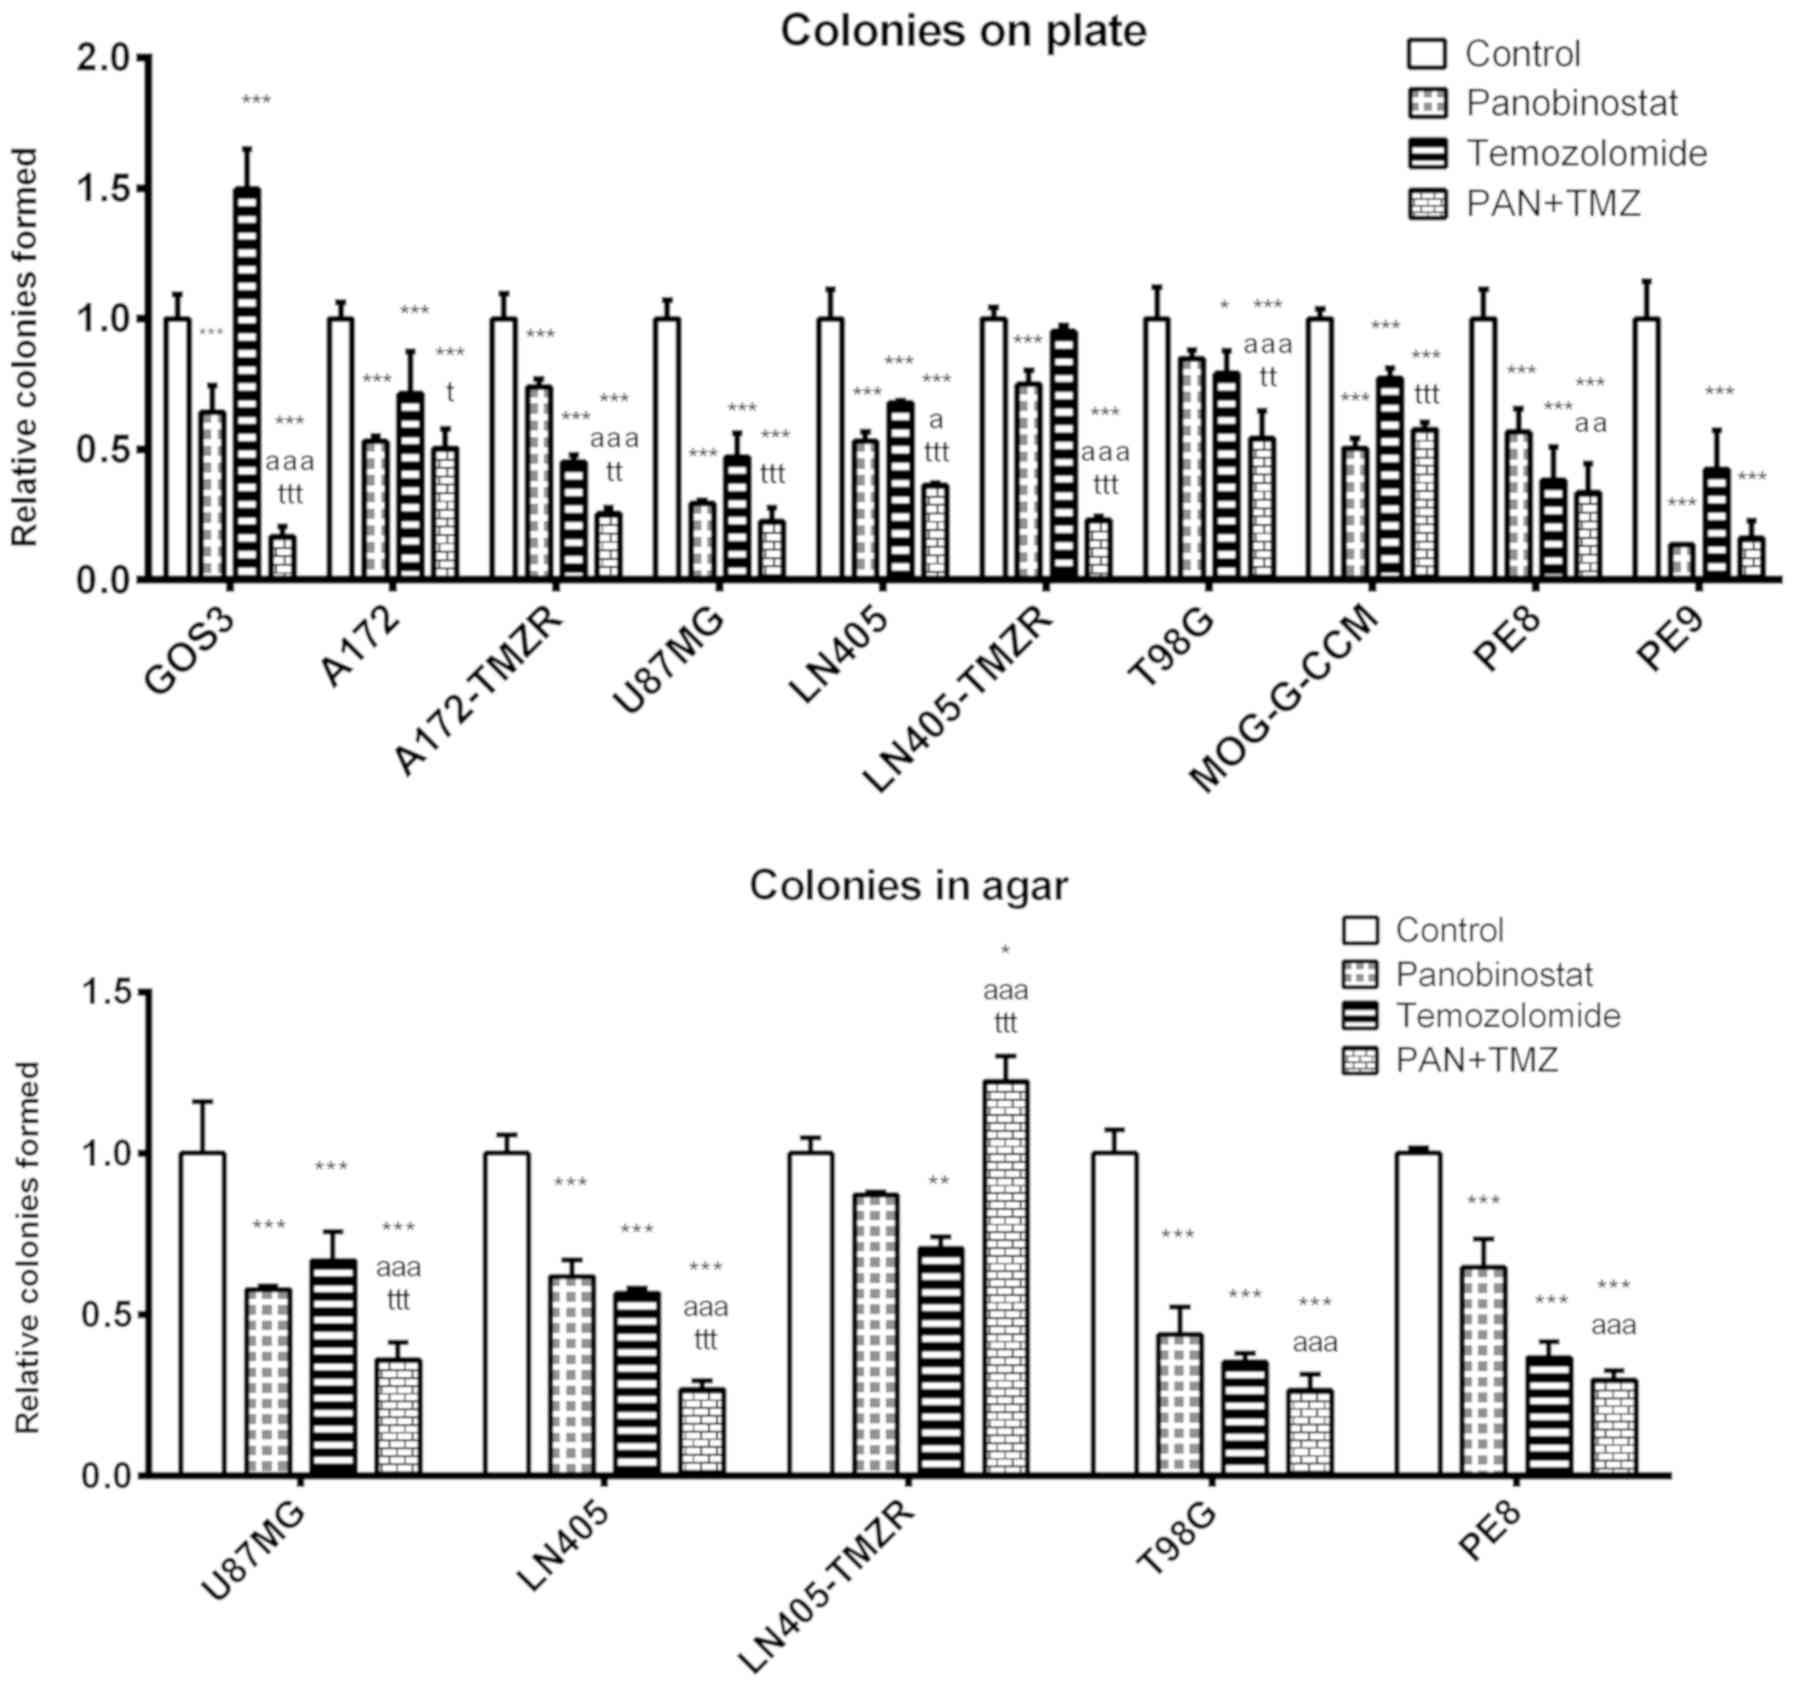
control treatment (Fig. 1).
In addition, combined treatment induced
significantly greater clonogenic inhibition than that caused by the
individual treatments (DZ-Nep or panobinostat) in A172, A172-TMZR,
U87MG, LN405-TMZR and T98G cell lines (P<0.001). Furthermore,
LN405-TMZR and T98G cells did not form any colonies on plates
following combined treatment. Of note, panobinostat individual
treatment induced a greater inhibition in the formation of colonies
on plates than DZ-Nep + panobinostat combined treatment in LN405
cells (Fig. 1). This is an unusual
phenomenon not observed in the other cell lines; however, the
genetic heterogeneity of cancer cells renders it possible.
Therefore, more cells and primary cultures are required in further
studies to obtain more consistent results. Studies on this topic
are therefore open to future research.
In the soft agar clonogenicity test (Fig. S5), although the greatest
inhibition of colony formation was observed after DZ-Nep +
panobinostat combined treatment in all cell lines (P<0.001), the
inhibition induced by this treatment was significantly different to
that induced by the two individual treatments (DZ-Nep or
panobinostat) only in U87MG, LN405-TMZR and PE8 cells (P<0.001;
Fig. 1). In the LN405 and T98G
cell lines, the double treatment induced a significantly greater
inhibition than the inhibition caused by the treatment of DZ-Nep
(P<0.001).
DZ-Nep + panobinostat combined
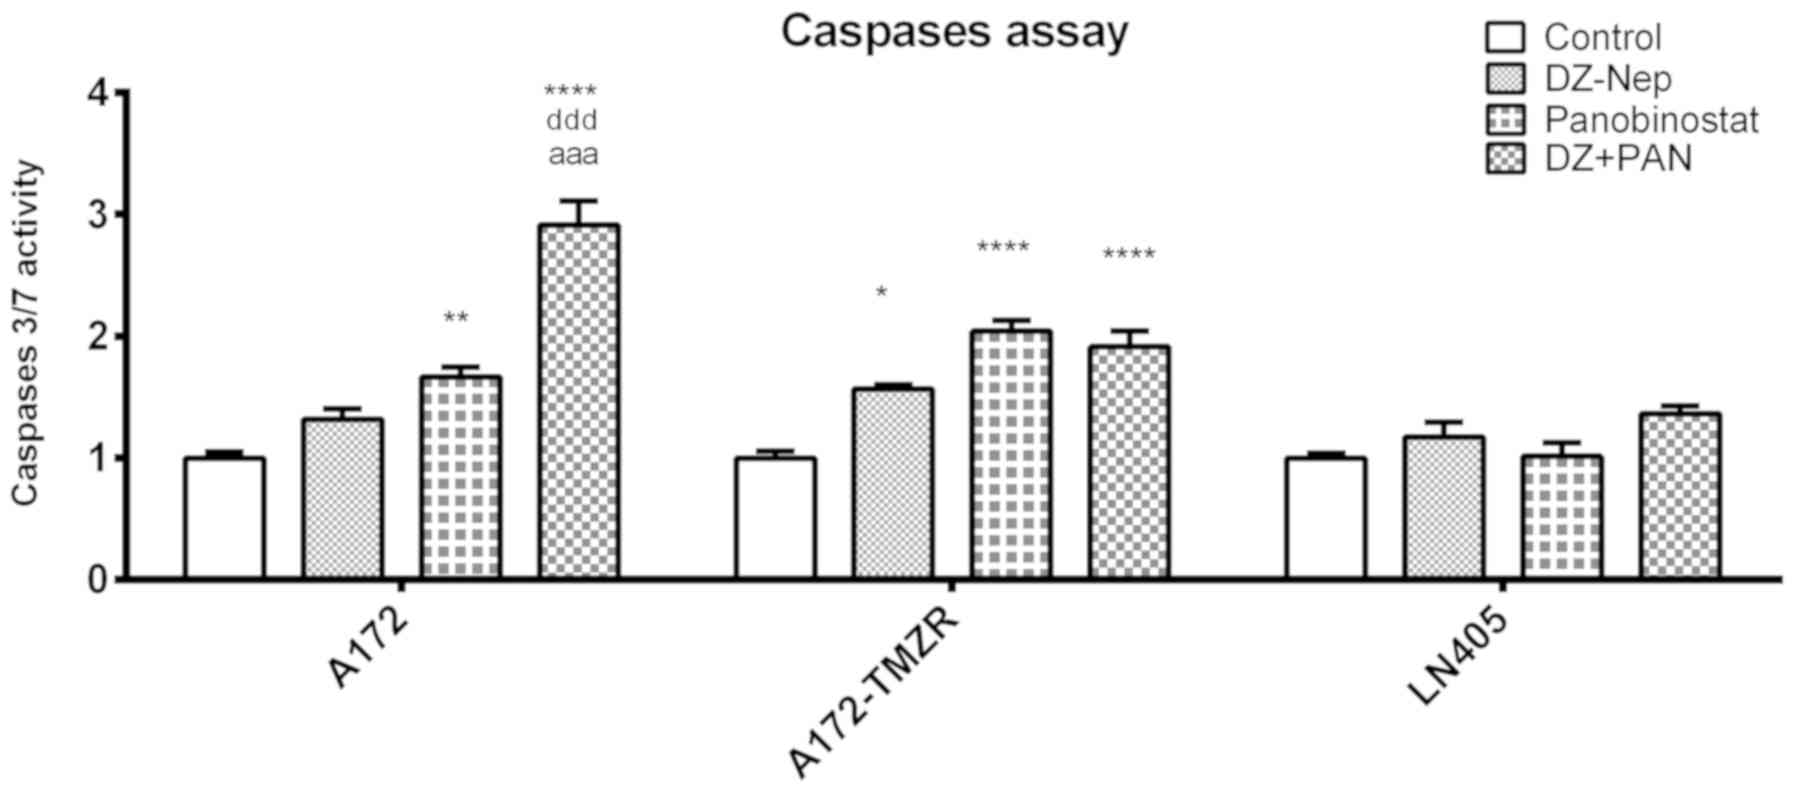
treatment increases apoptosis of glioblastoma cells
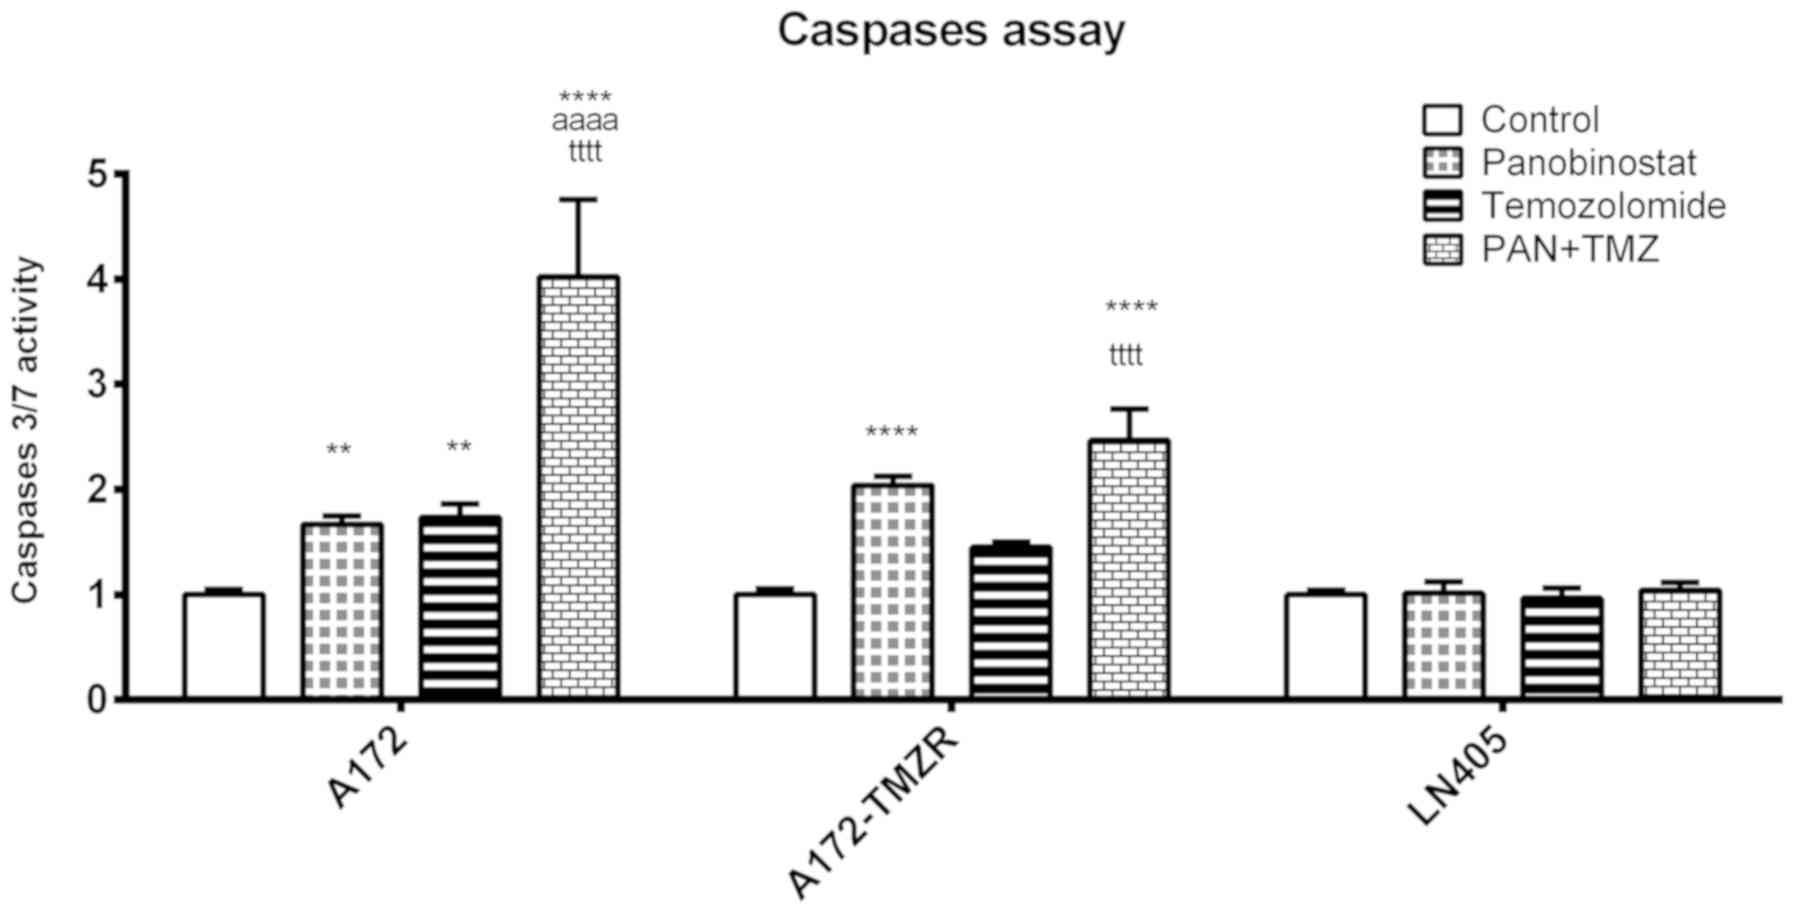
The levels of activation of caspases 3 and 7 were
measured in A172, A172-TMZR and LN405 cells after 2 h of individual
treatment with DZ-Nep and panobinostat, and the simultaneous double
treatment of DZ-Nep + panobinostat (Fig. 2). Double treatment produced a
significant activation of caspases in A172 and A172-TMZR cells
(P<0.001). Double treatment produced a significant increase in
activated caspases in A172 cells, but not in A172-TMZR cells, with
respect to individual treatments; similar values were produced in
A172-TMZR cells after either double treatment or panobinostat
individual treatment. No significant caspase activation was
observed in LN405 cells.
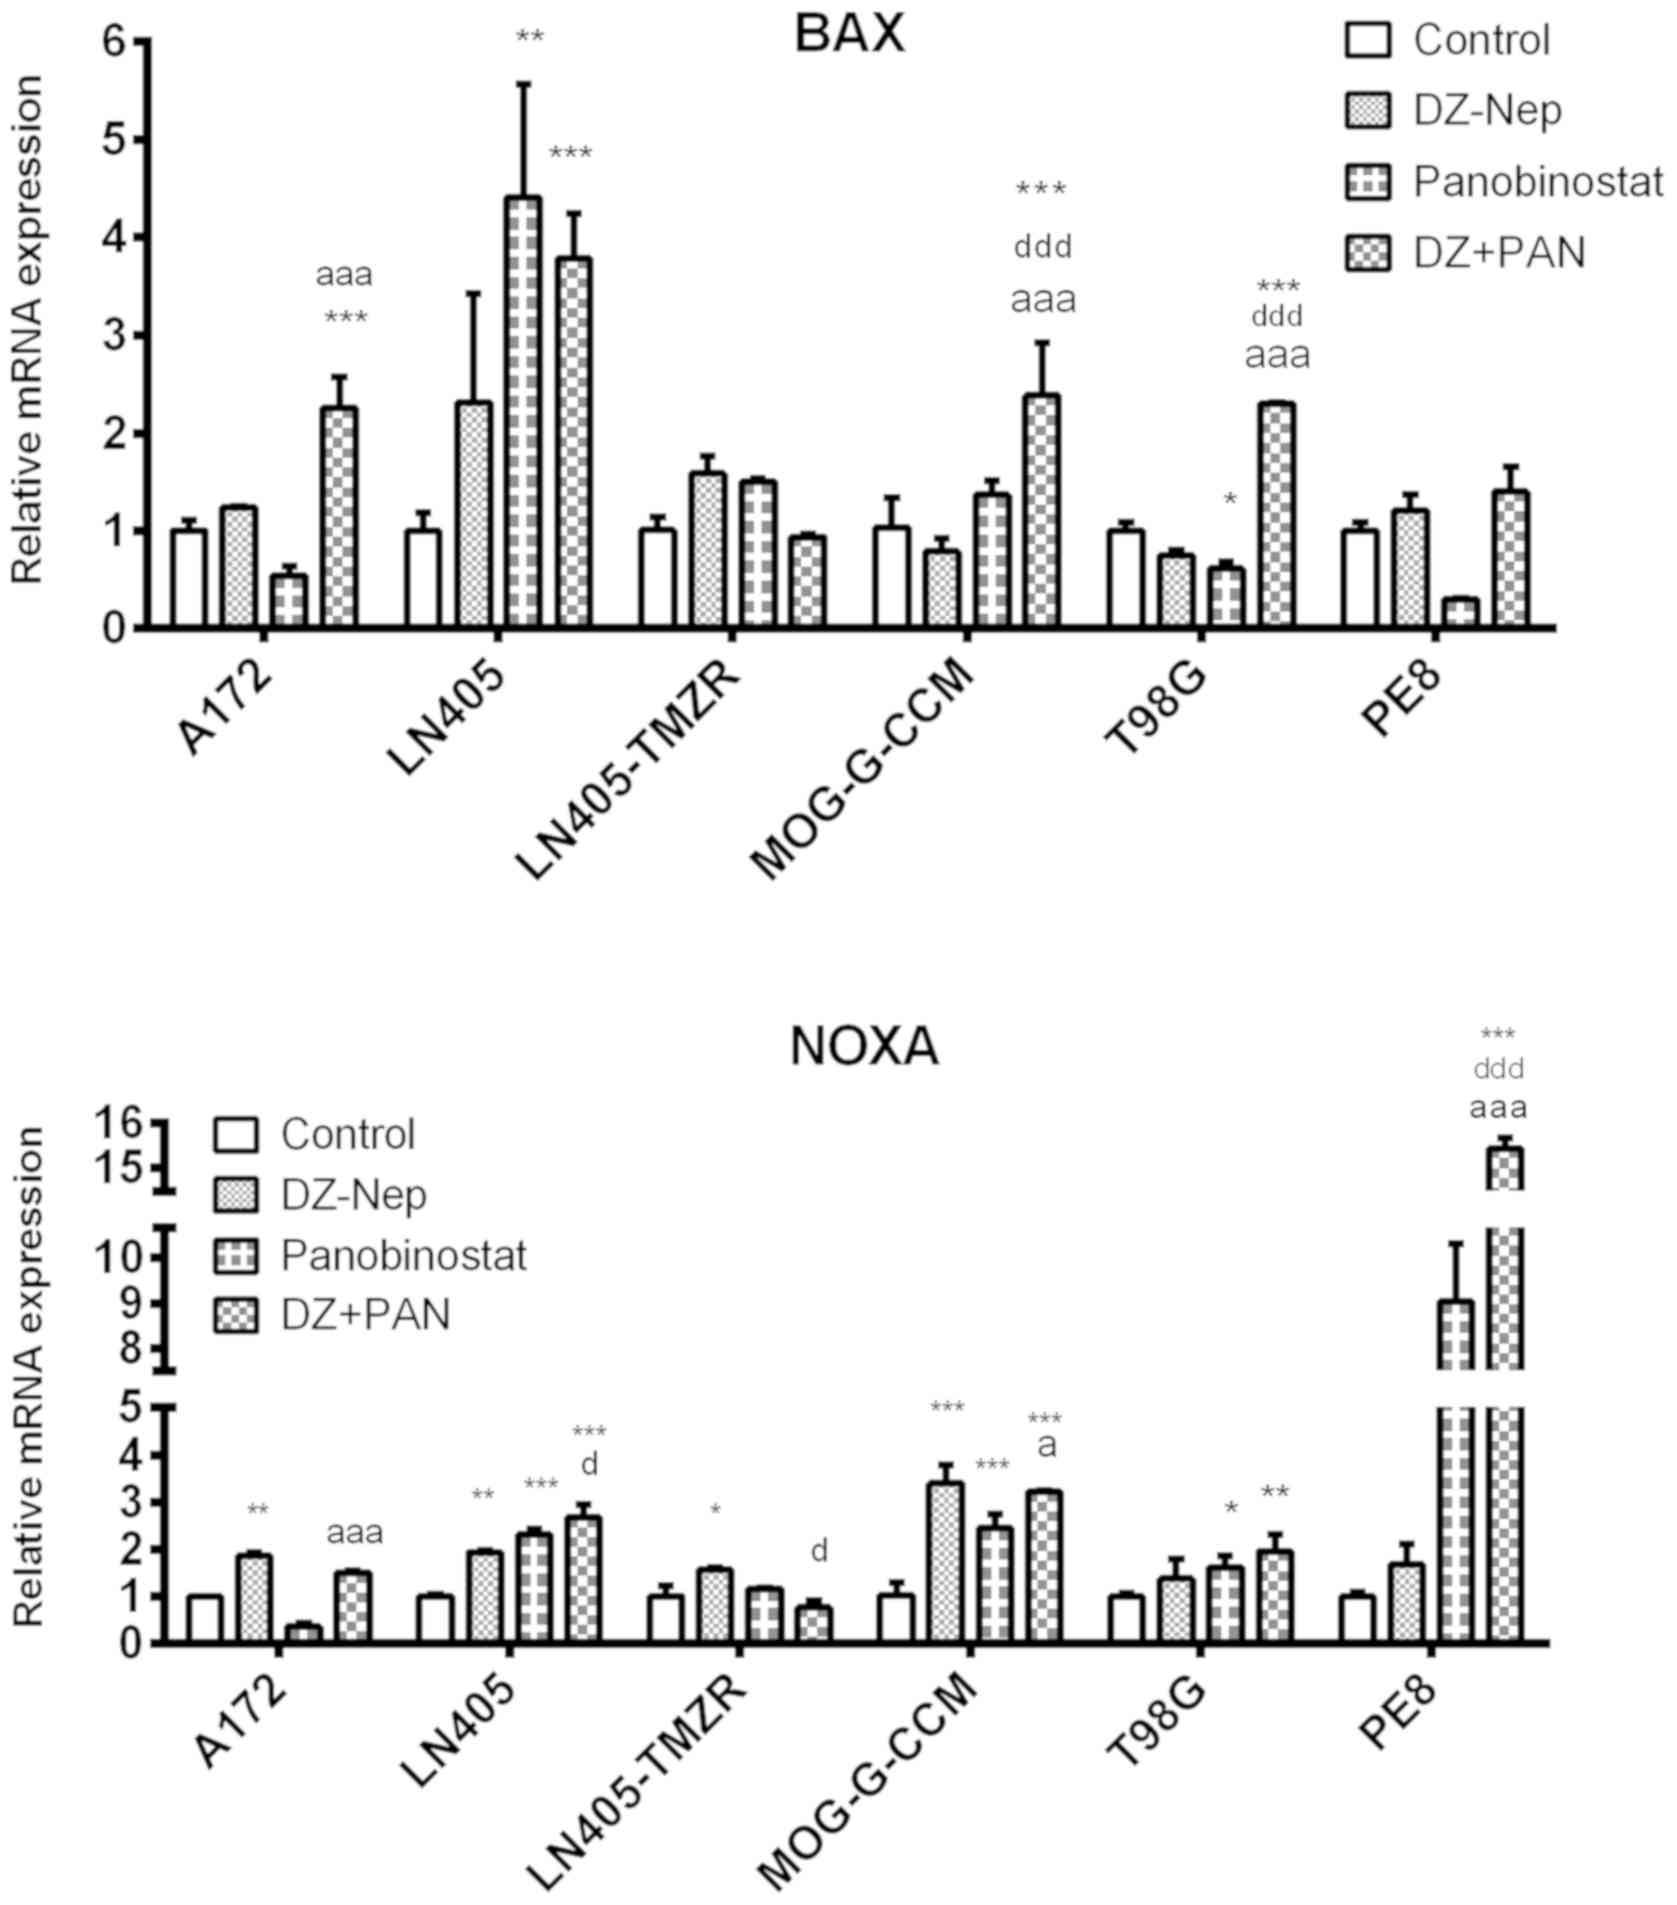
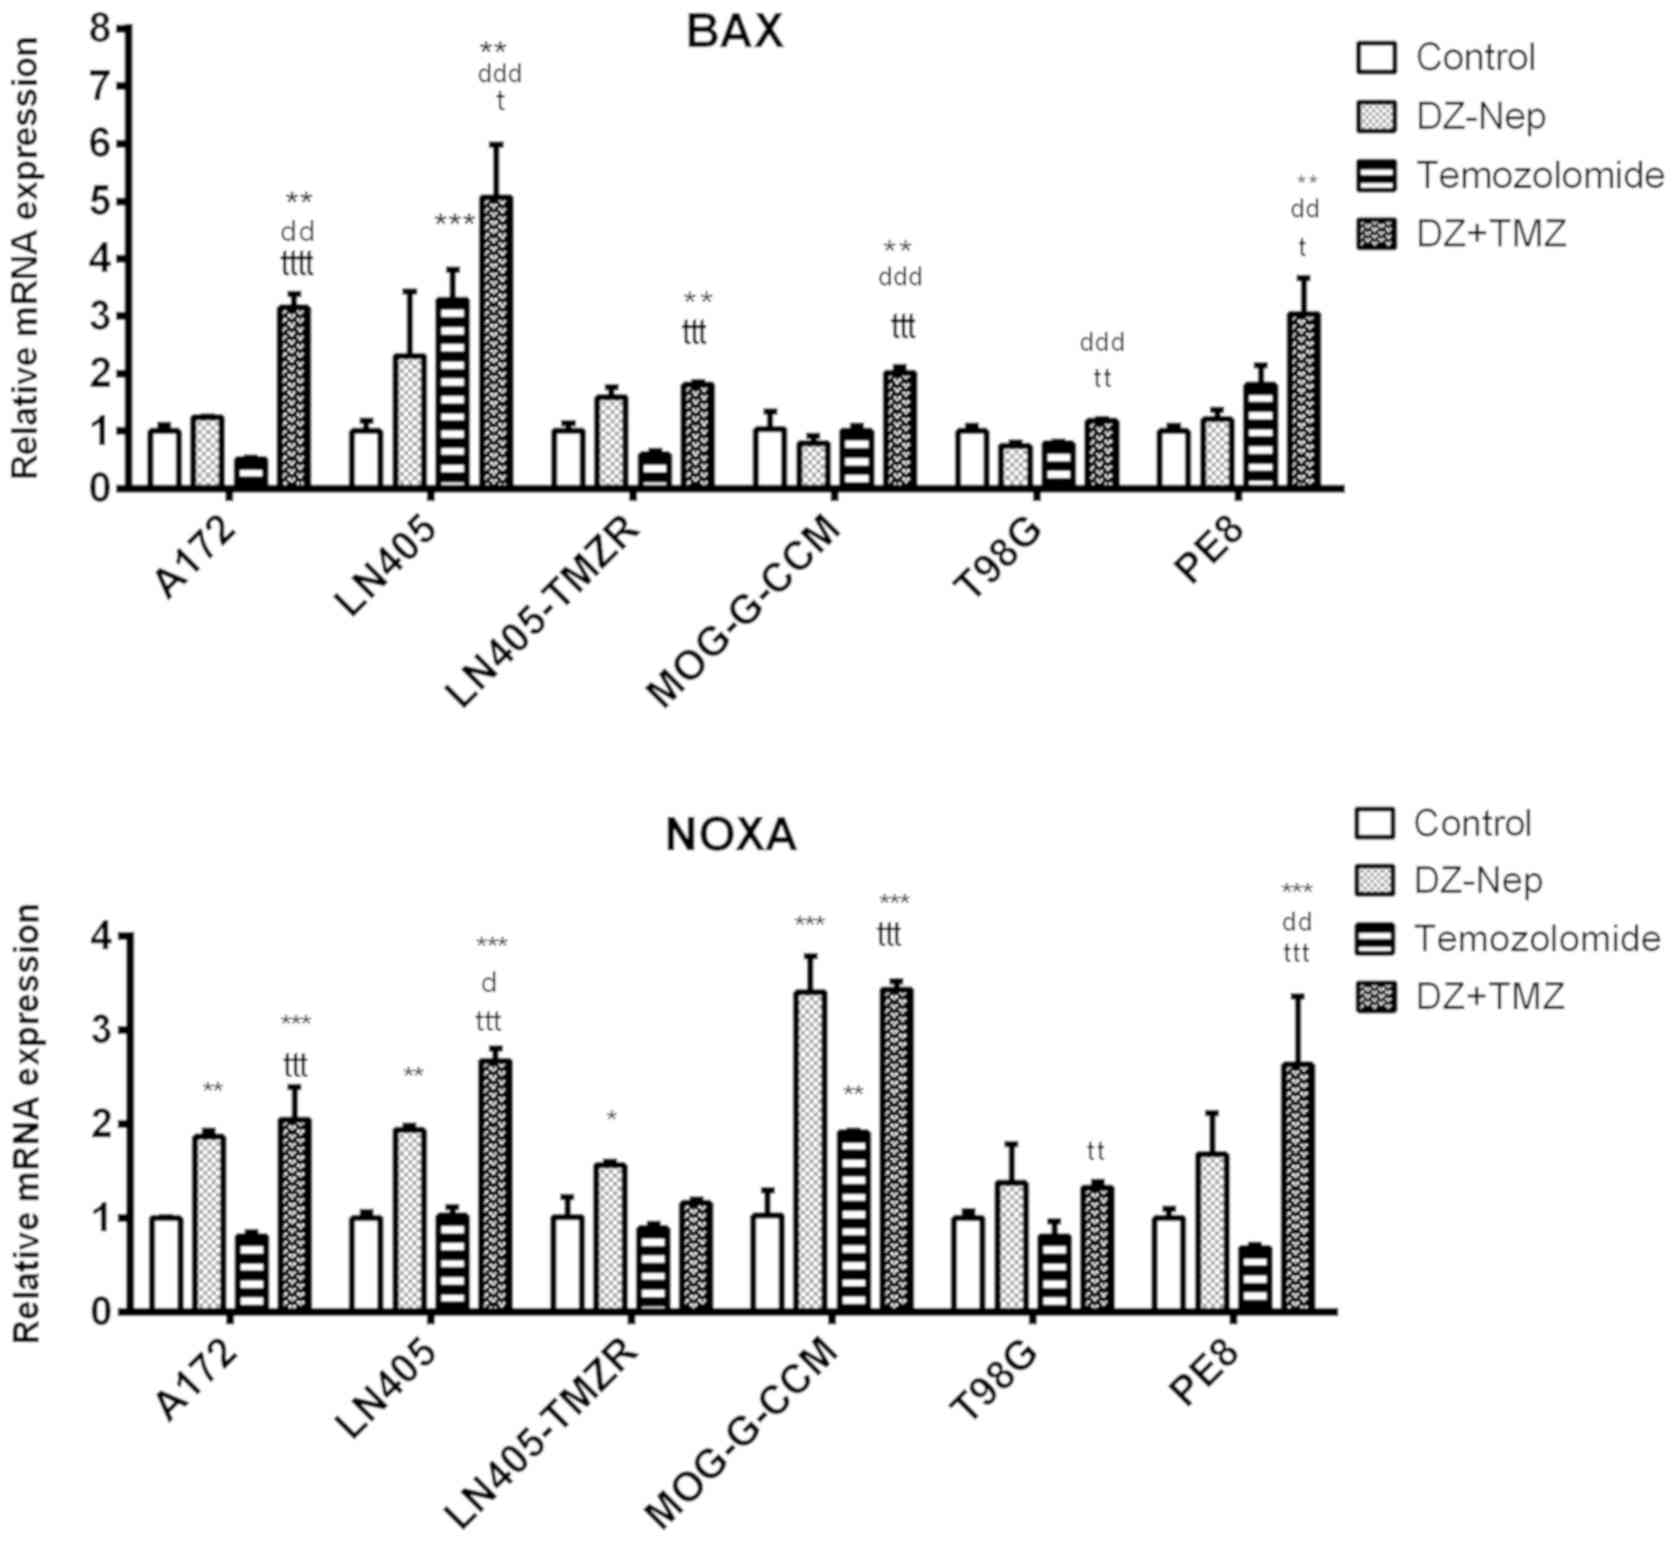
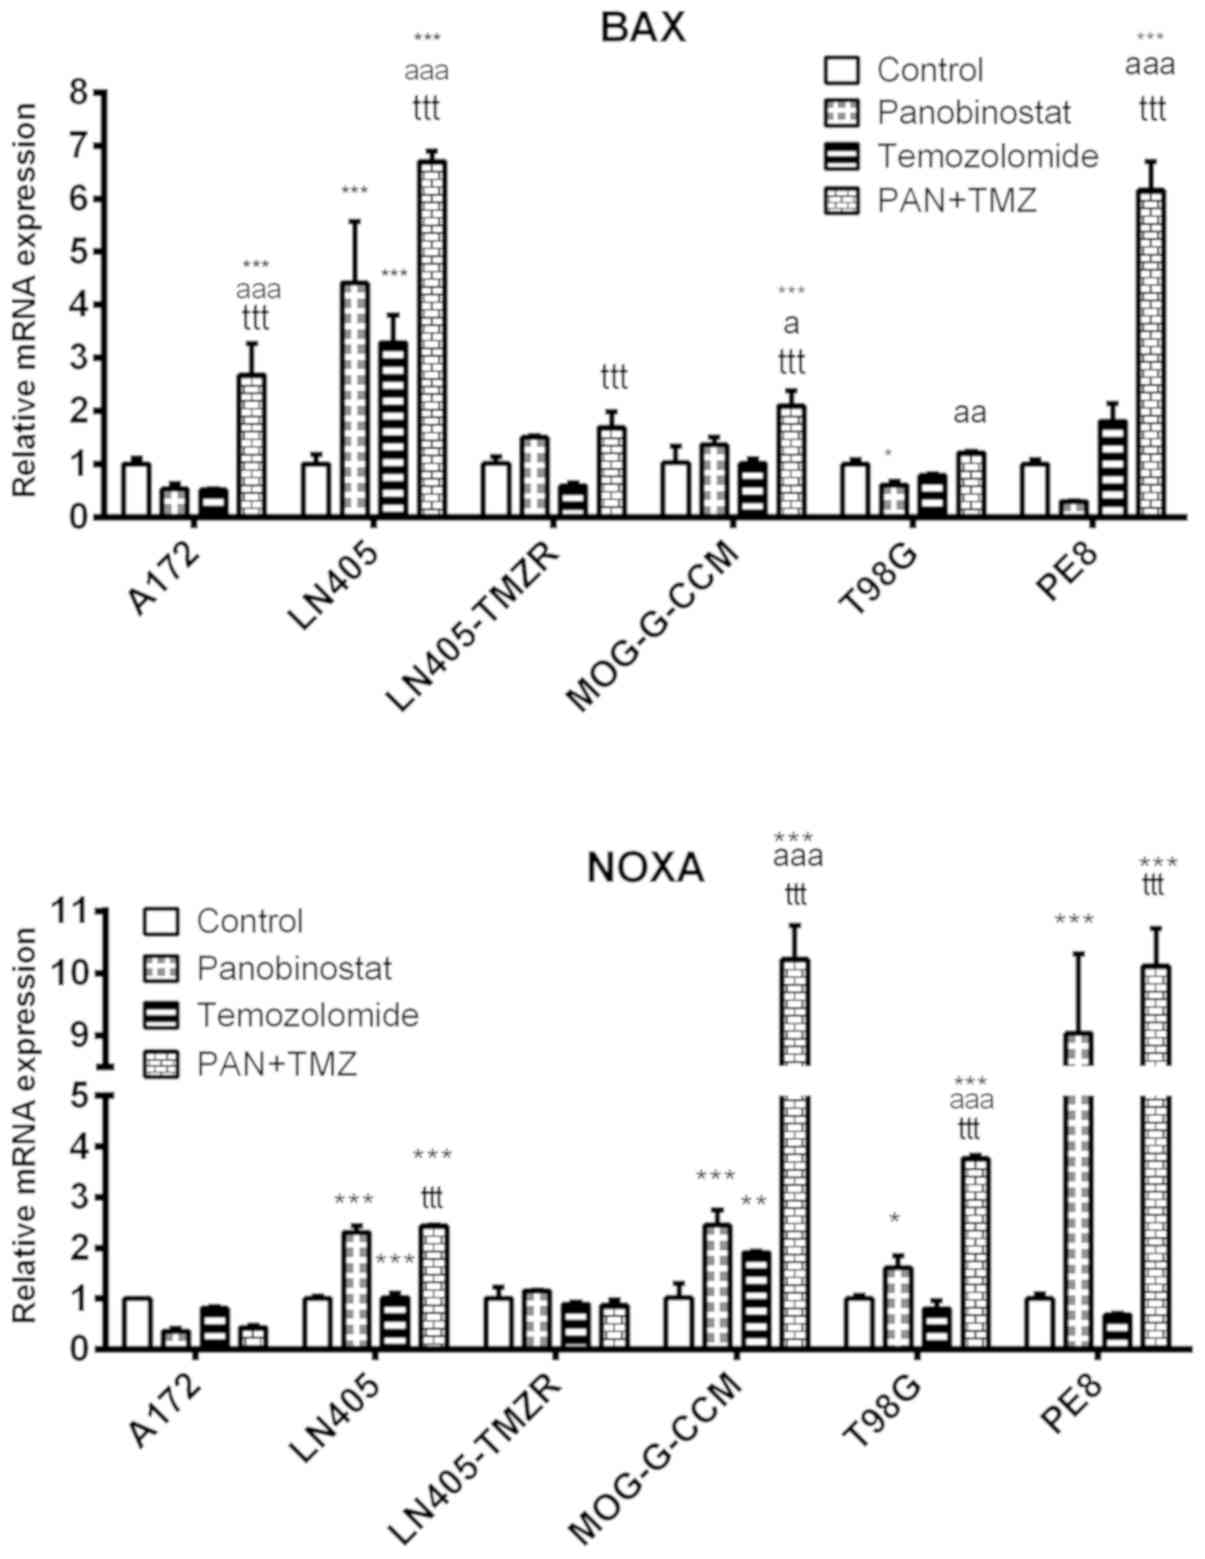
The combination of DZ-Nep + panobinostat
significantly increased BAX expression in A172, LN405, MOG-G-CCM
and T98G cells (P<0.001; Fig.
3). The increase produced by combined treatment in MOG-G-CCM
and T98G cells was significantly greater than that induced by the
individual treatments of DZ-Nep or panobinostat (P<0.001).
These changes were similar to those observed in the
expression of NOXA produced by the combined treatment of DZ-Nep +
panobinostat, where it was found that the double treatment
increased the expression of NOXA in T98G (P<0.01) and in LN405,
MOG-G-CCM and PE8 cells (P<0.001; Fig. 3). The greatest increase in NOXA was
detected in PE8 cells, significantly higher in the double treatment
compared with the individual treatments (both P<0.001).
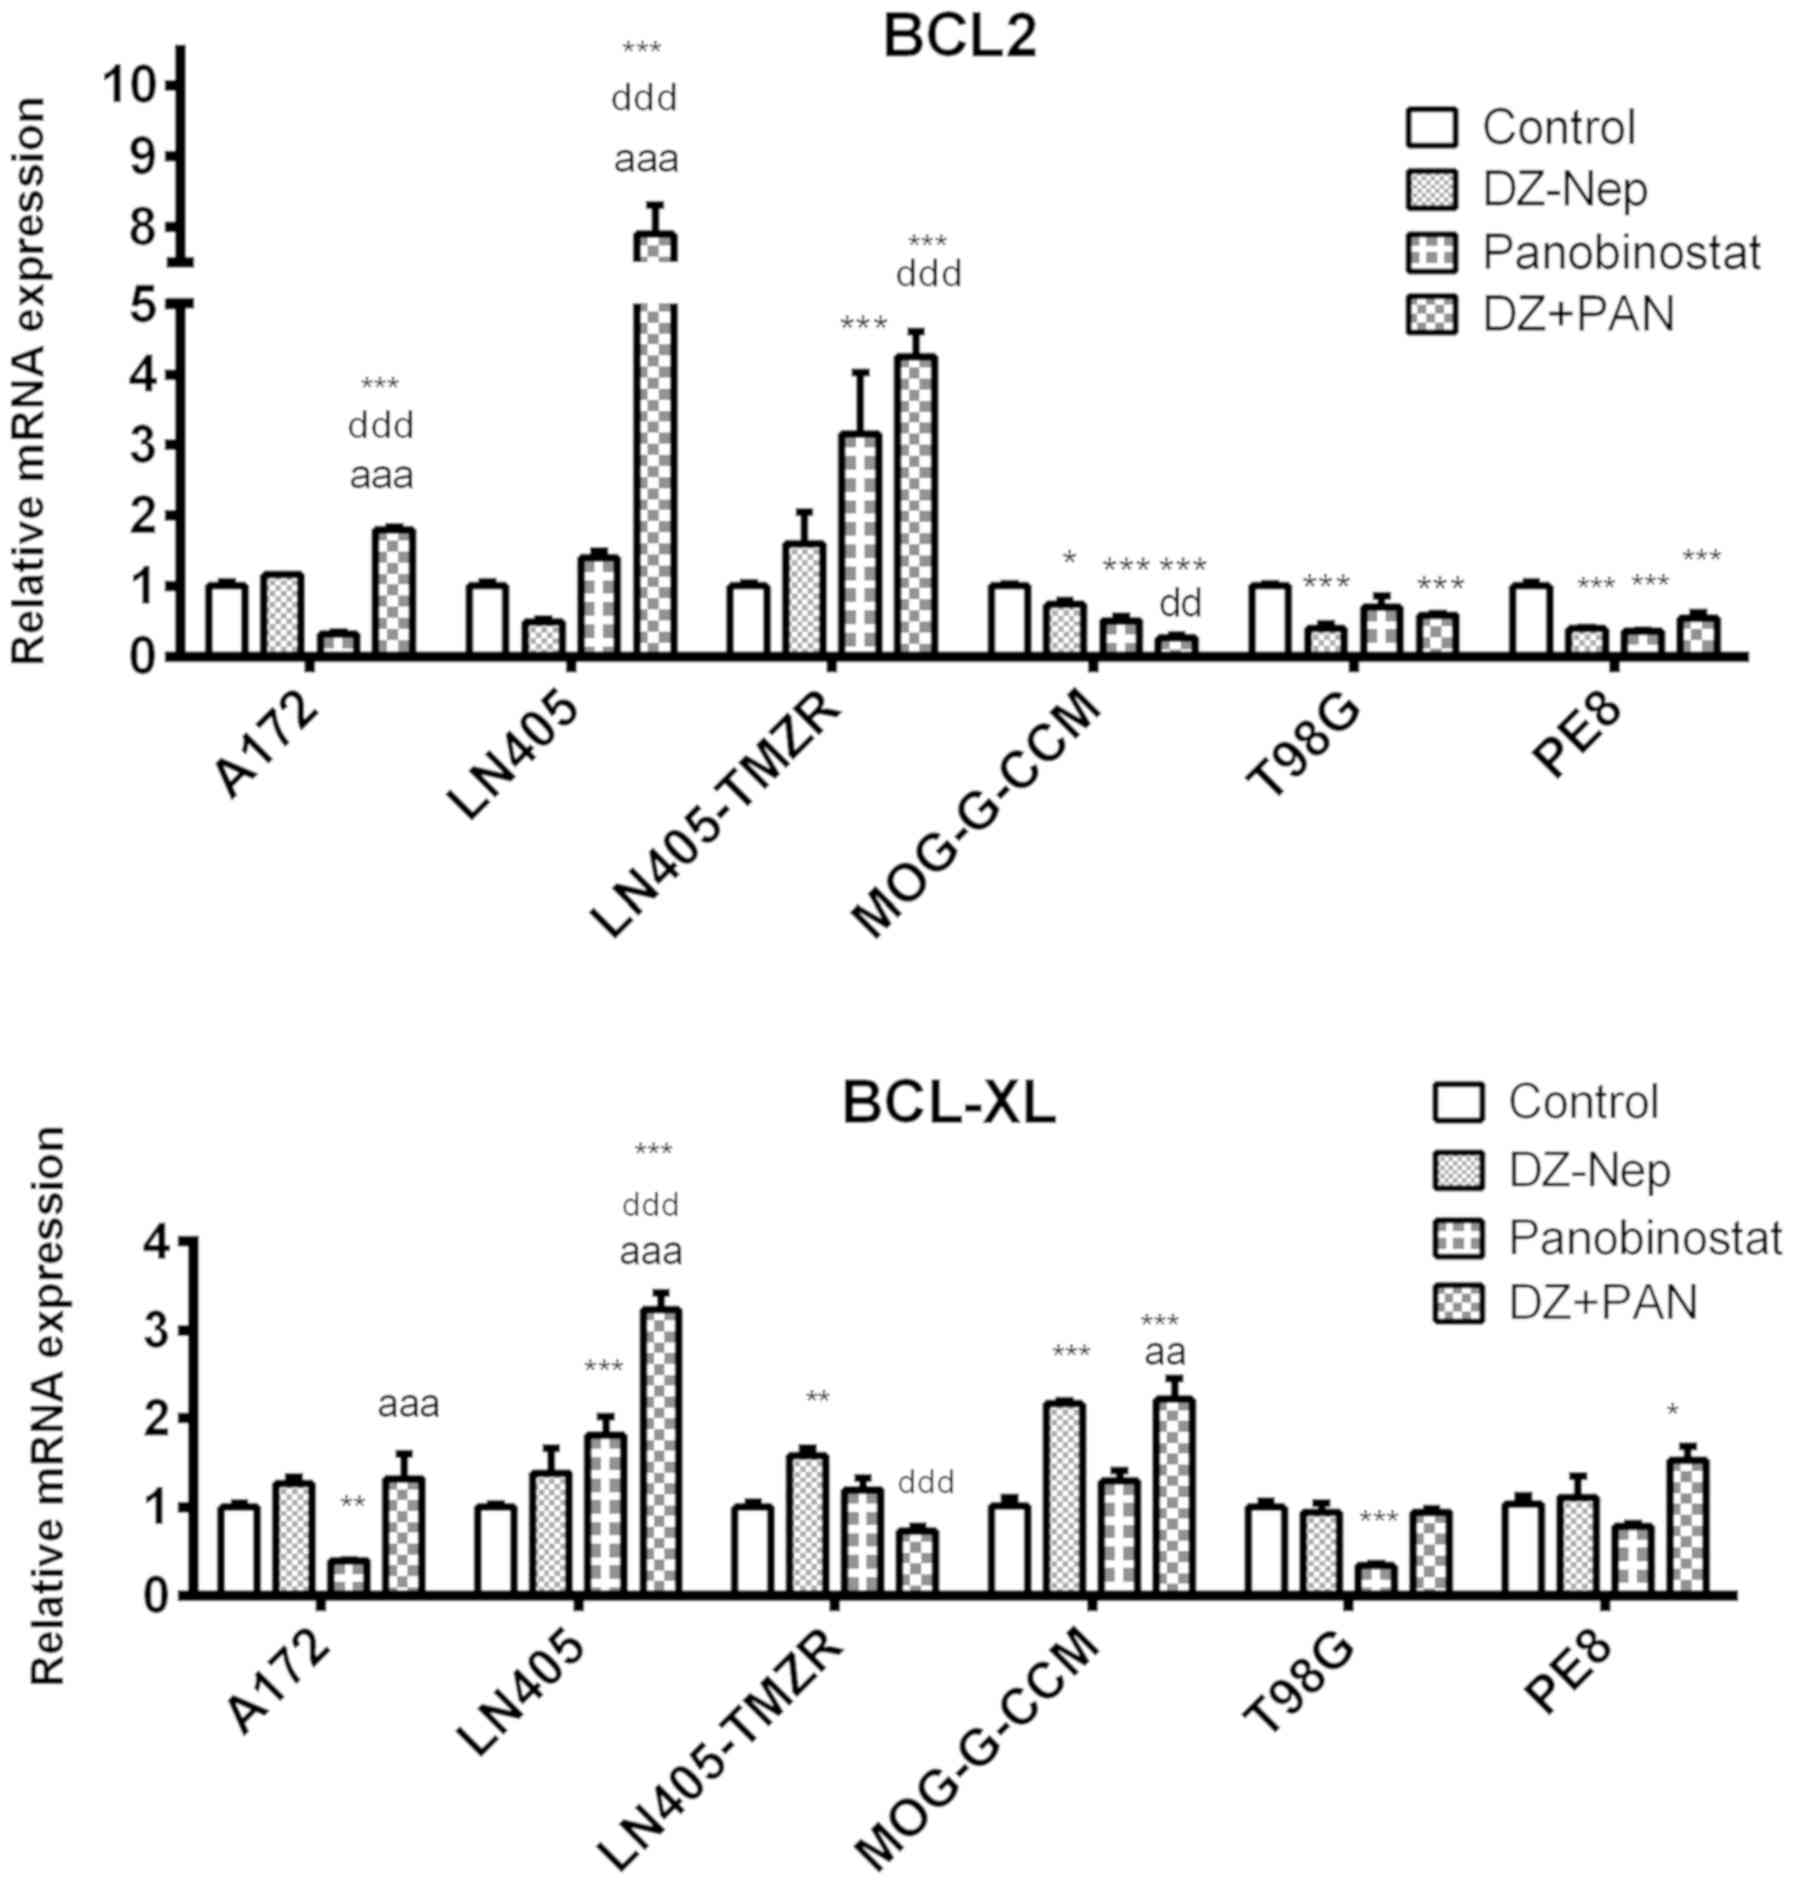
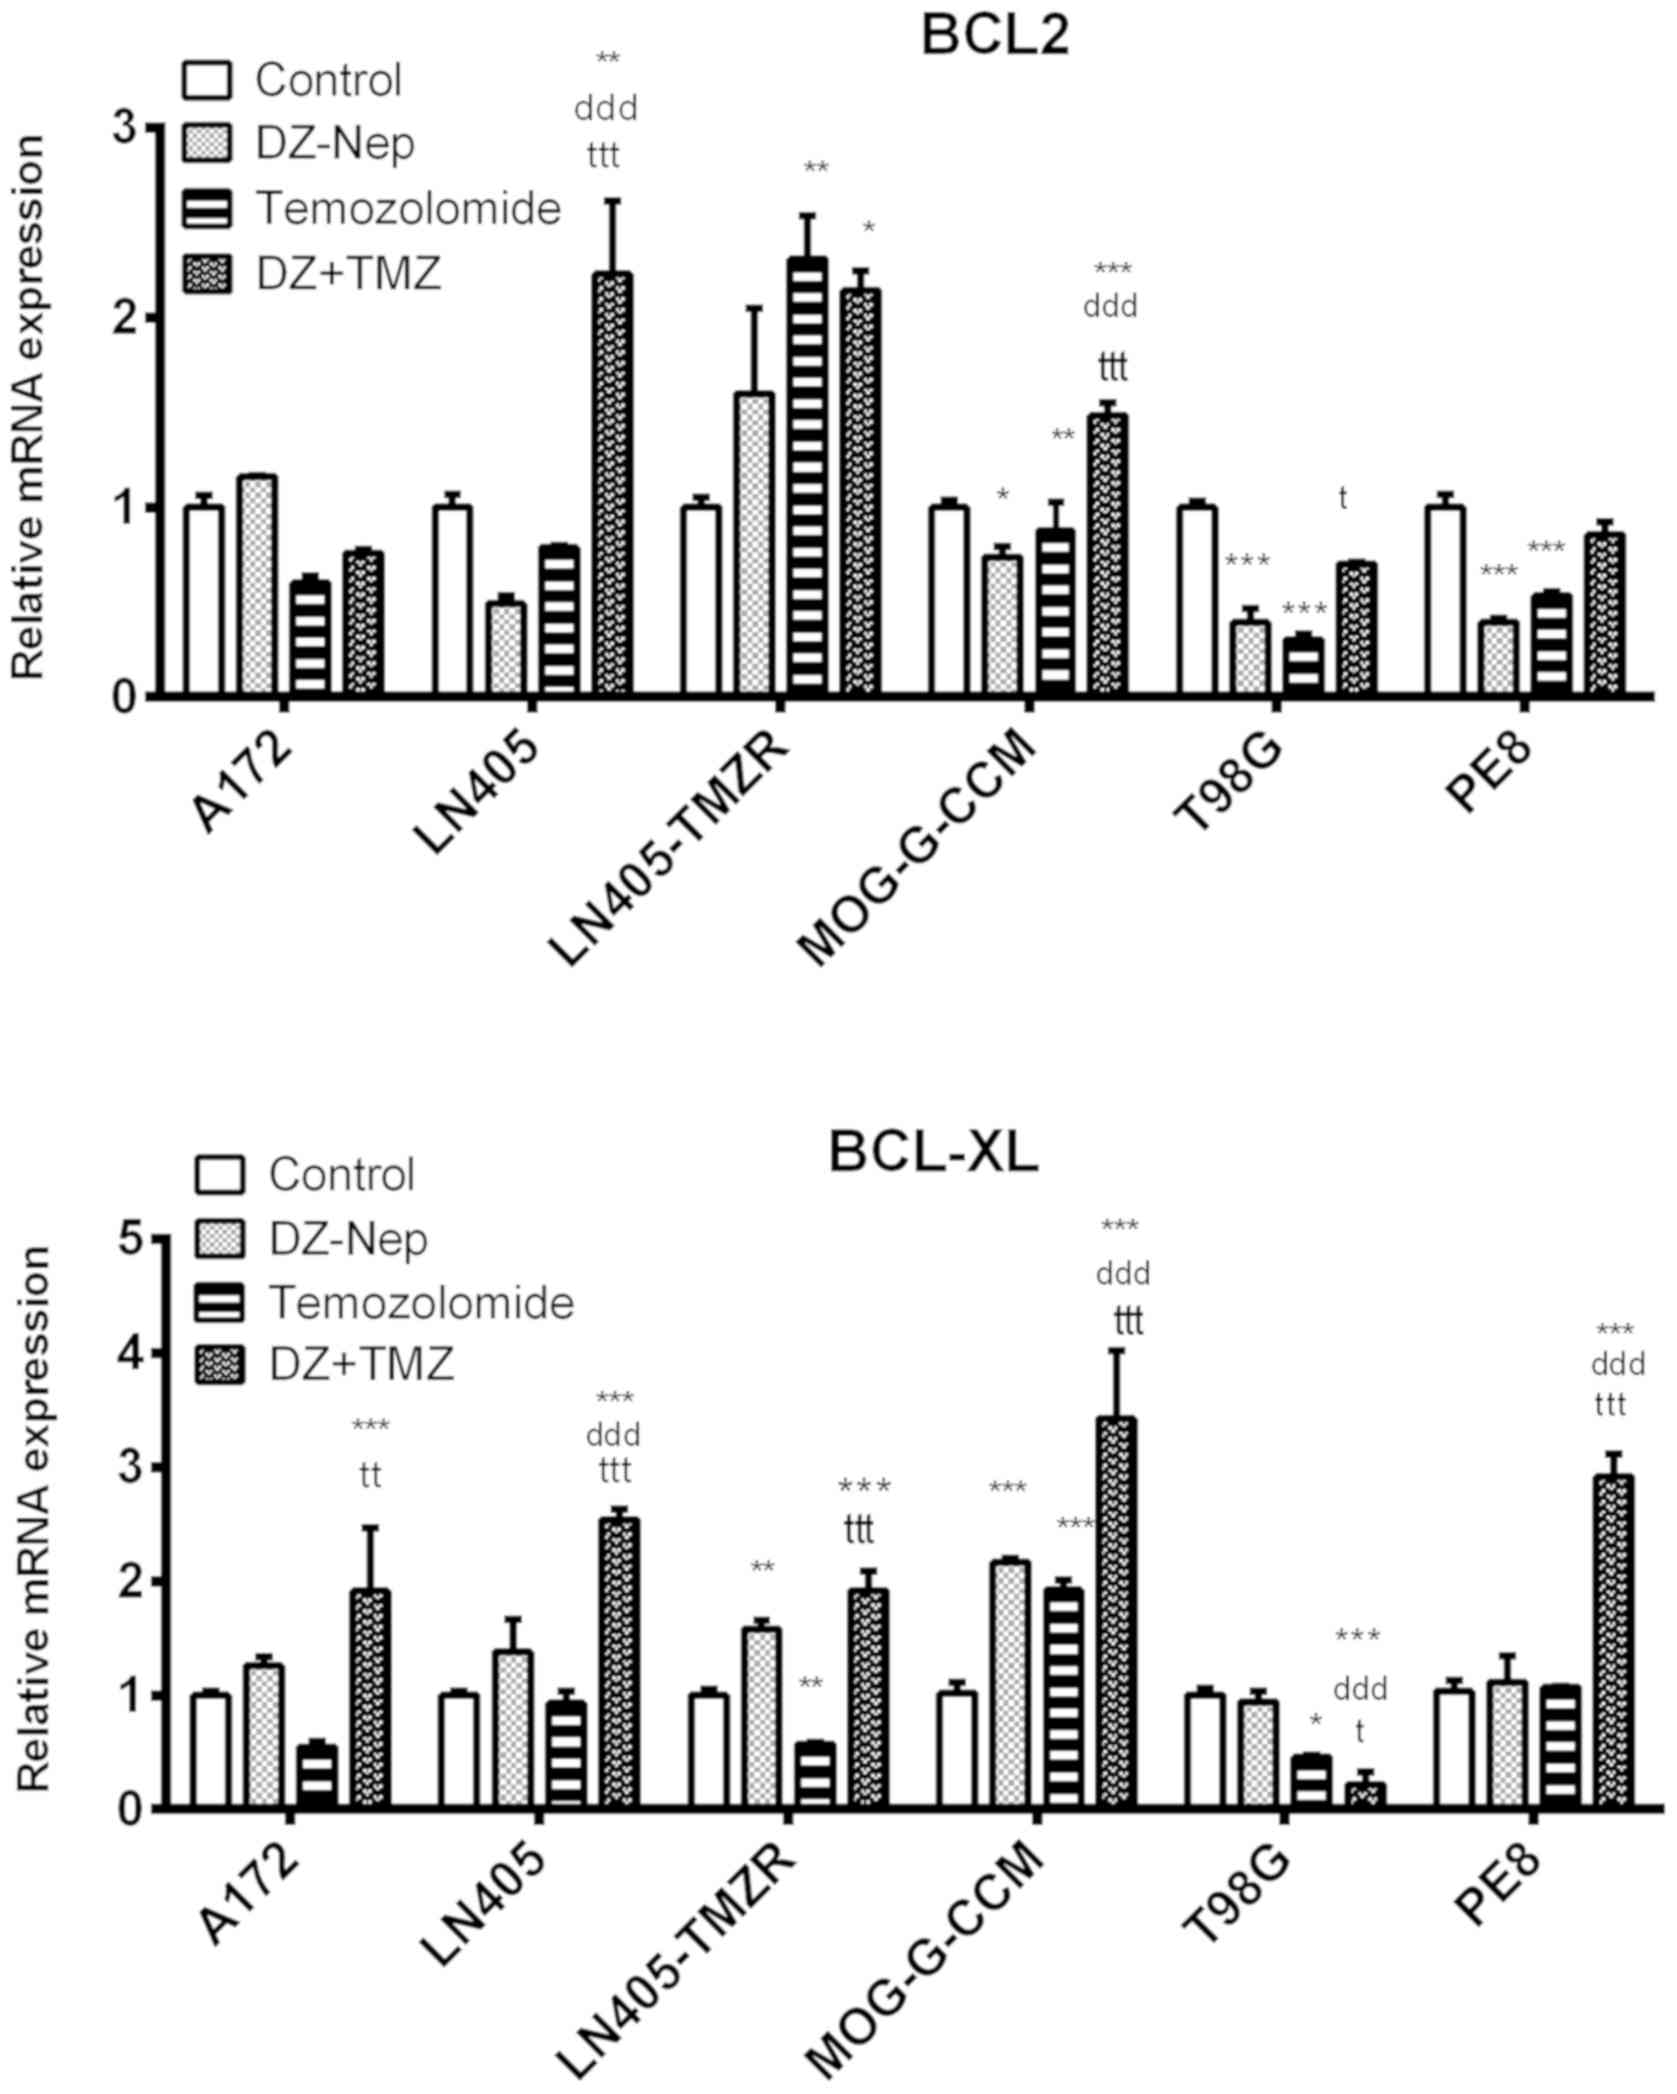
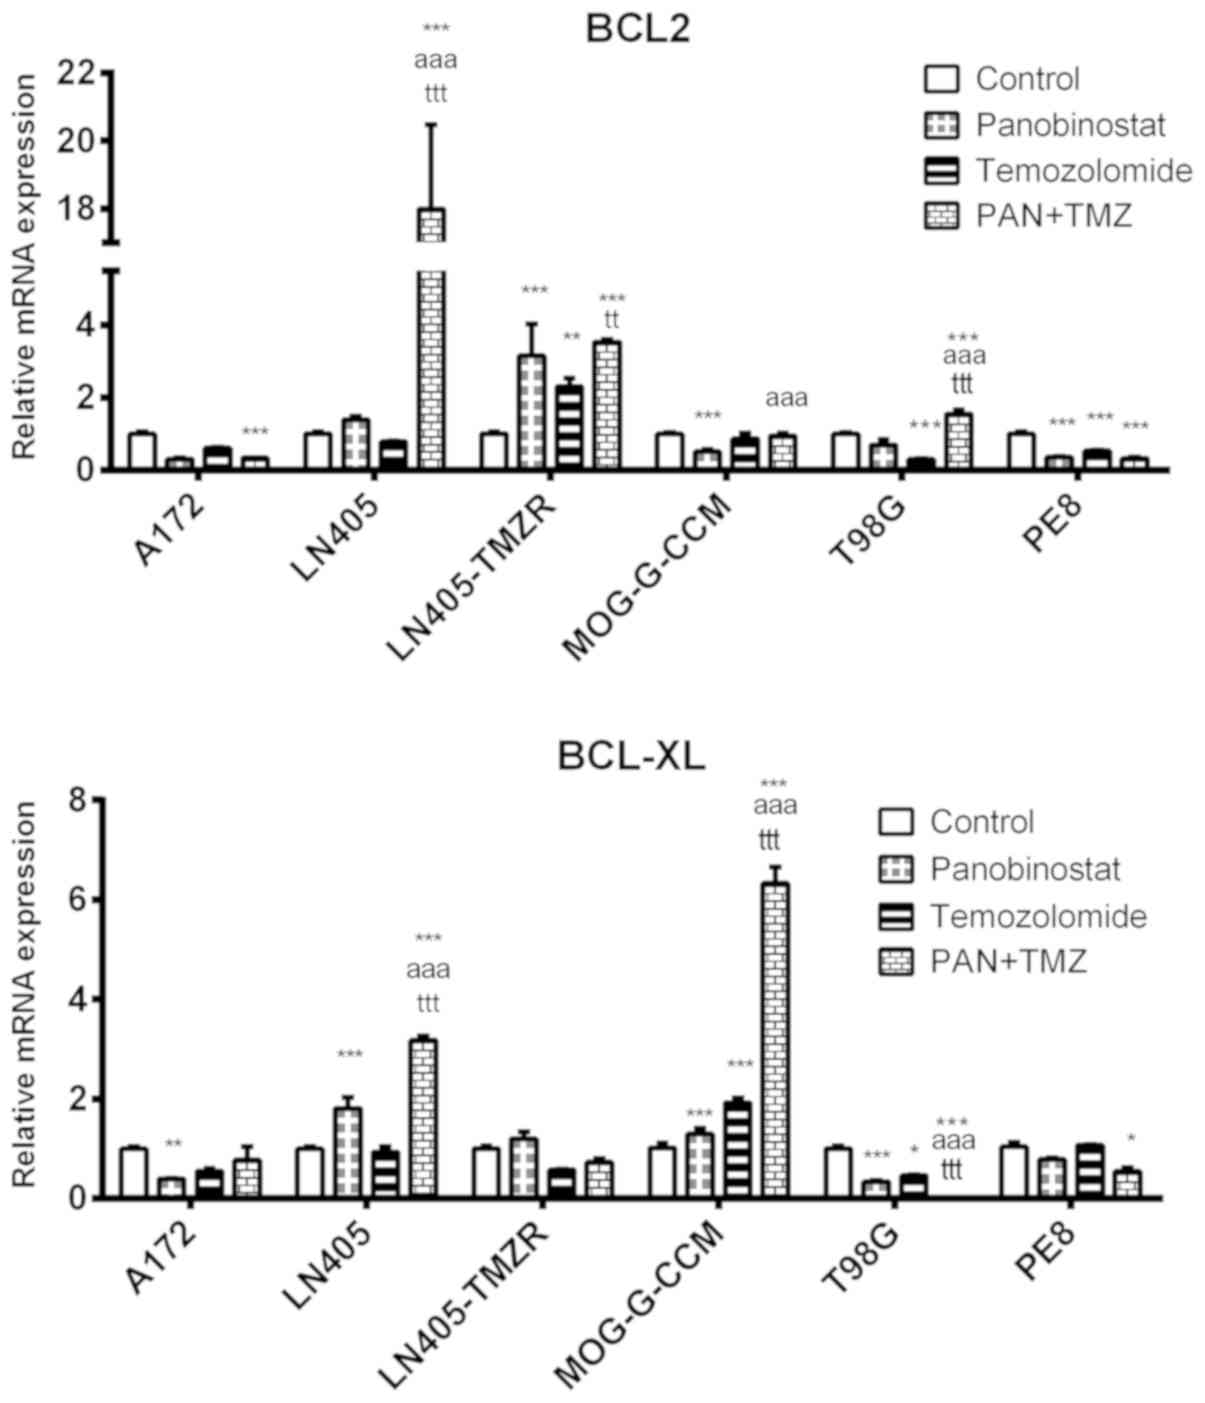
The combination of DZ-Nep + panobinostat
significantly decreased the expression of the BCL-2 antiapoptotic
gene in MOG-G-CCM, T98G and PE8 cells (P<0.001). Lines A172,
LN405 and LN405-TMZR showed significant increases in BCL-2
expression (P<0.001; Fig.
4).
The double treatment of DZ-Nep + panobinostat
significantly increased the expression of BCL-XL in LN405 and
MOG-G-CCM (P<0.001), and PE8 cells (P<0.05; Fig. 4).
DZ-Nep + temozolomide combined
treatment
DZ-Nep + temozolomide combined
treatment shows a syner- gistic effect at the highest
concentrations
The combination of DZ-Nep + temozolomide used did
not result in any Fa>0.5 (Table
SIV). A synergistic effect appeared after 72 h combined
treatment for LN405 cells. Compusyn predictions indicated a clear
synergy in the combined treatments of DZ-Nep + temozolomide, and in
the pre-treatment of temozolomide followed by post-treatment with
DZ-Nep in GOS-3, MOG-G-CCM and LN405 cells. LN405 and LN405-TMZR
cells were predicted to have synergy in the pre-treatment of DZ-Nep
followed by post-treatment of temozolomide; this treatment did not
prove to be effective in the other cell lines. U87MG cells
exhibited clear antagonism in all treatments with these two drugs.
The CI values obtained were plotted logarithmically in Fig. S6.
DZ-Nep + temozolomide combined
treatment specifically inhibits clonogenicity of
temozolomide-sensitive cells
The double treatment of DZ-Nep + temozolomide
significantly decreased the number of colonies on plates
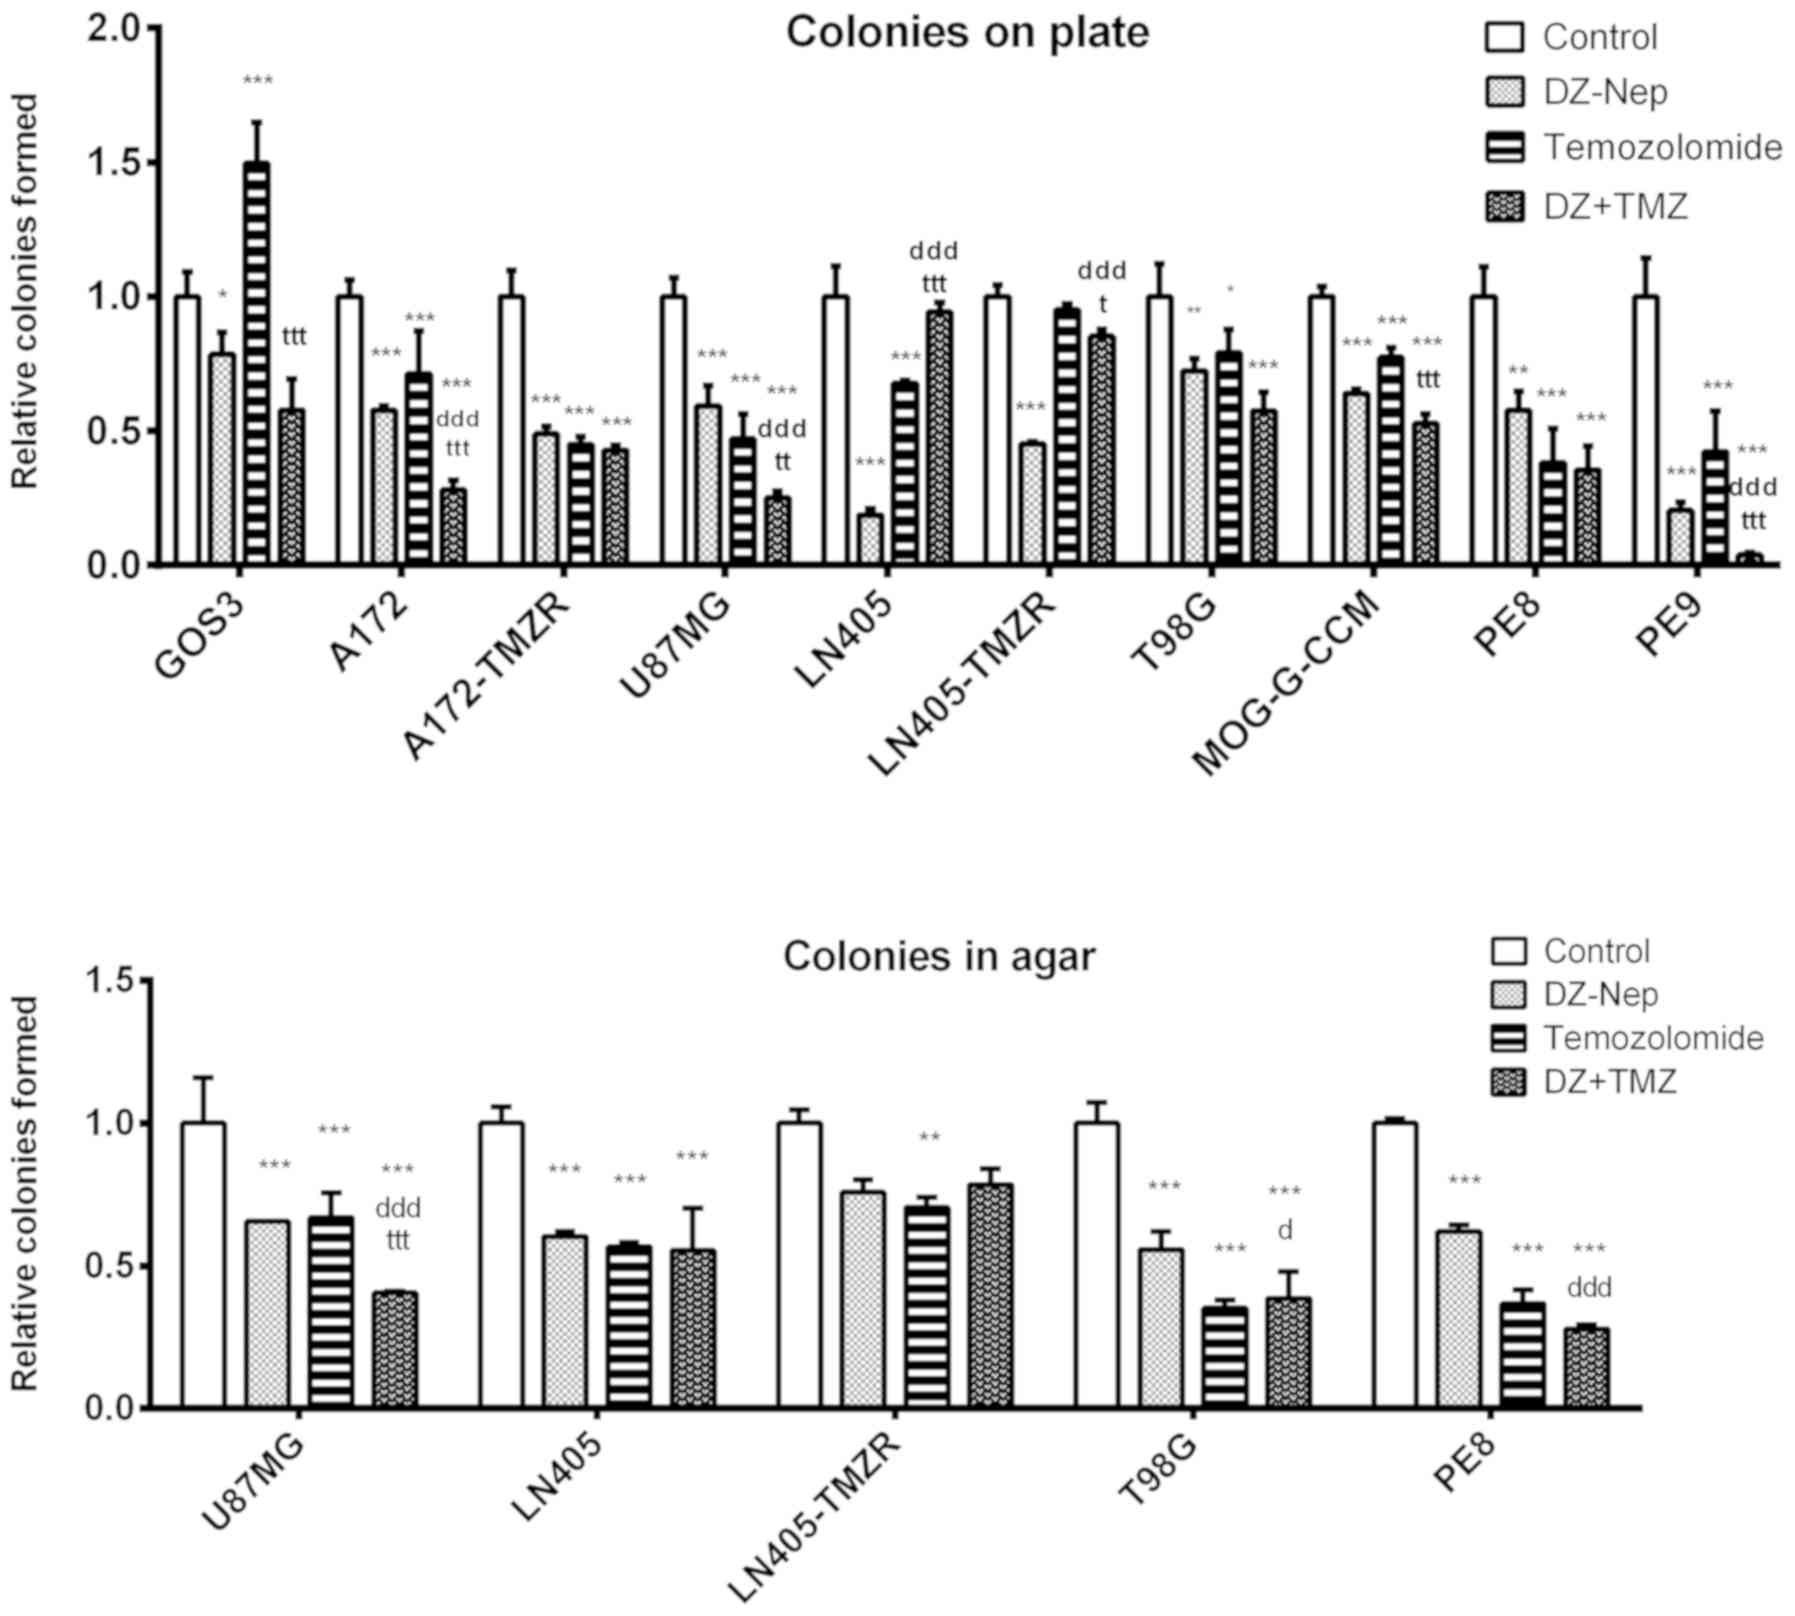
(P<0.001; Fig. 5) in A172,
A172-TMZR, U87MG, T98G, MOG-G-CCM, PE8 and PE9 cells. This
treatment did not show significant changes with respect to the
control treatment in GOS-3, LN405 and LN405-TMZR cells.
The double treatment of DZ-Nep + temozolomide
induced significantly greater inhibition compared with that
produced by the two individual treatments in A172, U87MG, and PE9
cells, which exhibited lower resistance to temozolomide than the
rest of the cells in the present study (Fig. 5).
These findings were further validated using the
clonogenicity experiment in anchoring independent conditions
(Fig. S5) when seeding the
treated cells in soft agar. Only the U87MG line showed
significantly greater inhibition induced by the double treatment of
DZ-Nep + temozolomide compared with that caused by the two
individual treatments (P<0.001). In LN405 and LN405-TMZR cells,
which are more resistant to temozolomide, no differences were
observed between the double treatment and the individual treatments
of DZ-Nep and temozolomide (Fig.
5). In addition, T98G showed a significant difference
(P<0.001) between the combined treatment and individual
treatment of DZ-NEP only.
DZ-Nep + temozolomide combined
treatment partially increases apoptosis of glioblastoma cells
The levels of caspase activation in A172, A172-TMZR,
and LN405 cells was studied after 2 h of individual treatment with
DZ-Nep or temozolomide, and simultaneous double treatment of DZ-Nep
+ temozolomide (Fig. 6). Double
treatment produced a significant activation of caspases in A172
cells compared with the control treatment (P<0.0001) and DZ-Nep
individual treatment (P<0.05). The double treatment did not
produce a significant increase in caspase activation in A172-TMZR
and LN405 cells.
DZ-Nep + temozolomide combined treatment
significantly increased BAX expression (Fig. 7) in A172, LN405, LN405-TMZR,
MOG-G-CCM and PE8 cells (P<0.01). It also produced a significant
increase of NOXA expression (Fig.
7) in these cell lines (P<0.01 for LN405-TMZR; P<0.001
for all other cells). In MOG-G-CCM, LN405-TMZR and T98G cells,
however, double treatment did not produce a significantly greater
increase in NOXA expression than that produced by the individual
treatment of DZ-Nep. Double treatment did not significantly
increase the levels of BAX or NOXA in T98G cells compared with
control.
Simultaneous double treatment of DZ-Nep +
temozolomide significantly increased the expression of BCL-2
antiapoptotic gene in LN405 (P<0.01), LN405-TMZR (P<0.05) and
MOG-G-CCM (P<0.001) cells compared with the control. A172, T98G
and PE8 cells did not show significant differences in BCL-2
expression levels after this treatment (Fig. 8).
Double treatment of DZ-Nep + temozolomide strongly
significantly decreased the expression of the antiapoptotic gene
BCL-XL in T98G cells (P<0.001). However, a highly significant
increase in BCL-XL was detected in the remaining the cell lines
studied (P<0.001; Fig. 8).
Panobinostat + temozolomide combined
treatment
Panobinostat + temozolomide combined
treatment shows a synergistic effect
The CI values obtained mostly showed antagonism for
the smallest Fa values, and synergy for the highest Fa (Table SV). In particular, U87MG cells
showed higher CI indexes in the simultaneous 72-h (P72T72) double
treatment and in the pre-treatment of temozolomide followed by
panobinostat. Temozolomide pre-treatment/panobinostat
post-treatment (T24P48) was also generally effective against GOS-3
cells, and only at the highest concentrations in MOG-G-CCM, LN405
and LN405-TMZR cells.
LN405 cells revealed a synergistic or additive
effect following double treatment, whereas its
temozolomide-resistant variant, the LN405-TMZR line, showed lower
synergy and Fa at low concentrations, although synergy and the Fa
increased at higher concentrations of treatment. Synergistic
estimates predicted by Compusyn revealed a clear synergy of T24P48
treatment in all cell lines, and a clear synergy in the P72T72
treatment in almost all cell lines, with the exception of LN405.
Synergy was only predicted for the pre-treatment of panobinostat
followed by a post-treatment of temozolomide in GOS-3, LN405 and
LN405-TMZR cells. The logarithms of the CIs were represented in
Fig. S7.
Panobinostat + temozolomide combined
treatment effectively inhibits the clonogenic potential of cell
lines
The double treatment of panobinostat + temozolomide
significantly decreased the number of colonies on plate in all cell
lines studied (P<0.001). Significant differences were observed
between the inhibition caused by the double treatment and by the
individual treatments of panobinostat or temozolomide in GOS-3,
A172-TMZR, LN405 and LN405-TMZR cells (Fig. 9). In addition, the inhibition of
clonogenicity observed in LN405-TMZR following double treatment of
panobinostat + temozolomide appeared to be markedly greater than
that in LN405.
A soft agar clonogenicity experiment (Fig. S5) confirmed this result. The
double treatment of panobinostat + temozolomide showed a
significantly higher inhibition of clonogenicity than the two
individual treatments of panobinostat or temozolomide in U87MG and
LN405 cells (P<0.001). No differences were found between the
double treatment and the individual treatment of temozolomide in
T98G and PE8 cells. Finally, the double treatment showed an
antagonistic effect, with a significant increase in the number of
colonies formed in agar, in LN405-TMZR cells (P<0.05; Fig. 9).
Panobinostat + temozolomide combined
treatment increases the apoptosis of glioblastoma cells
The levels of caspase activation in A172, A172-TMZR
and LN405 cells were studied after 2 h of individual treatment with
panobinostat or temozolomide, and simultaneous double treatment of
panobinostat + temozolomide (Fig.
10). Double treatment significantly increased caspase activity
in A172 and A172-TMZR cells compared with the control treatment
(P<0.0001), or individual treatment with temozolomide
(P<0.0001). The levels of activated caspases induced by double
treatment was significantly greater than those induced by
individual treatment with panobinostat in A172 cells (P<0.0001).
No treatment produced a significant increase of activated caspases
in LN405 cells.
Double treatment of panobinostat + temozolomide
significantly increased the expression of BAX and NOXA (Fig. 11) in LN405, MOG-G-CCM and PE8
cells compared with the control (P<0.001). A significant
increase of BAX in A172 cells (P<0.001) and of NOXA in T98G
cells (P<0.001) was detected in the other cell types. LN405-TMZR
cells exhibited no significant changes in the expression of either
proapoptotic gene.
Panobinostat + temozolomide combined treatment
significantly decreased the expression of BCL-2 in A172 and PE8
cells compared with the control (P<0.001). In LN405, LN405-TMZR
and T98G cells, however, double treatment increased BCL-2
expression (Fig. 12).
Combined panobinostat + temozolomide treatment
strongly significantly decreased the expression of the
anti-apoptotic gene BCL-XL in T98G cells (P<0.001). Conversely,
the expression of BCL-XL was significantly upregulated in LN405 and
MOG-G-CCM cells (P<0.001; Fig.
12).
DZ-Nep + panobinostat + temozolomide
triple combination
The triple combination of DZ-Nep + panobinostat +
temozolomide resulted in high synergistic CI indexes in all cell
lines (Table SVI and Fig.
S8).
Although GOS-3 and LN405-TMZR cells showed
antagonism when working with drug concentrations that produced a
small Fa, these drugs showed a synergistic effect at the
concentrations corresponding to bigger Fa values, data confirmed by
the Compusyn predictions. Although a greater effect was observed in
LN405 compared withLN405-TMZR cells, Compusyn predicted higher
synergistic results at the highest Fa for LN405-TMZR cells than for
LN405 cells.
Discussion
In response to combined DZ-Nep and panobinostat
treatment, Compusyn predicted a synergistic response in the cell
lines used, with the exception of LN405 and LN405-TMZR cells, where
additive and antagonistic responses were obtained, respectively.
Consistent with these predictions, significant increases in BAX and
NOXA expression levels were not observed in LN405-TMZR cells, in
contrast to the other cell lines. DZ-Nep + panobinostat combined
treatment effectively inhibited the formation of colonies on agar
in the analyzed cell lines. As two agents that inhibit gene
expression at different epigenetic levels (DZ-Nep affects EZH2,
panobinostat affects HDACs), it is not surprising that their
combination is highly effective, as previously described (52-54).
Therefore, DZ-Nep + panobinostat may represent a promising drug
combination in the treatment of brain tumors. It is probable that
the inhibition of EZH2 induced by DZ-Nep facilitates demethylation
of H2K27me3. The absence of methylation would favor subsequent
histone acetylation by histone acetyl-transferases (55) following the H3K27me3 to H3K27Ac
switch on chromatin. Panobinostat, by inhibiting the deacetylation
induced by several HDACs, would help to maintain histone
acetylation. All this would facilitate the apoptosis of malignant
cells through multiple signaling pathways.
The studied combinations of DZ-Nep + temozolomide
did not result in a very high Fa in the studied cell lines,
although the predictions made by Compusyn for higher Fa values
generally indicated a synergistic behavior, except in U87MG and
LN405-TMZR cells, where antagonistic behavior was predicted. DZ-Nep
and temozolomide are not compounds that induce rapid apoptotic
responses in cells. DZ-Nep typically requires long incubation
times, and temozolomide usually causes cell cycle arrest (56) or cell senescence (57). These reasons complicate the
analysis of the synergistic effect according to the CI method used
in this study. Although the results obtained suggest the existence
of synergy between these two compounds, it is necessary to use
longer incubation times to establish whether these combined drugs
behave according to an additive, synergistic or antagonistic
model.
The combination of these two drugs only produced
greater inhibition of agar colony formation than treatment with the
individual drugs in U87MG cells. In parallel, there was a greater
inhibition in the formation of colonies on plates in A172, U87MG
and PE9 cells. The cells presenting the highest resistance to
temozolomide (GOS-3, LN405, LN405-TMZR, T98G and MOG-G-CCM) did not
appear to be more sensitive to the combination of drugs compared
with the two individual drugs. All these lines carry p53 mutations
(Table I). It is possible that the
dose of temozolomide used was not high enough to induce significant
effects in these cell lines, and synergy was not achieved when
working with low drug concentrations in these types of experiments.
Conversely, the expression of the proapoptotic genes BAX and NOXA
was increased in all cell lines. The increase observed in
LN405-TMZR cells was lower compared with that in LN405 cells. This
increase in apoptosis may encourage future studies into this
therapeutic combination.
For panobinostat + temozolomide co-treatment,
Compusyn again predicted a highly synergistic response with high Fa
values, except in LN405 cells. Of note, LN405-TMZR cells appeared
to be more sensitive to this combination than LN405 cells, with
larger Fa values and a more synergistic response predicted by
Compusyn. The accumulated DNA damage tolerated by LN405-TMZR cells
may reduce the threshold of response to damage induced by combined
treatment with panobinostat + temozolomide, explaining its greater
sensitivity to this therapeutic combination compared with LN405
cells.
This combination of drugs produced the greatest
inhibition in the formation of colonies on plates in all cell
lines, and also the greatest inhibition in the formation of soft
agar colonies in all cell lines except in LN405-TMZR. A similar
increase in the expression levels of proapoptotic genes was
observed in almost all cell lines, which makes the combintion of
panobinostat + temozolomide a potential candidate for future
research into the development of novel therapies against
glioblastoma.
Combinatorial studies were also conducted to
evaluate the synergy of the DZ-Nep + temozolomide + panobinostat
triple combination. When evaluating the synergy of a group of ≥3
drugs, it should be understood that an increase in cellular effects
is not necessarily dependent upon the synergistic behavior of all
the compounds present in the therapeutic mixture; rather it is
enough that two of these compounds are synergistic to observe a
greater effect. To avoid these potential confusions, it was decided
to use the drugs at very low concentrations, corresponding to one
third of the concentrations used in the combinatorial experiments
of drug pairs. In this range of concentrations, no drug pair should
produce a high Fa. Therefore, if a high Fa is produced by a triple
combination of drugs, it can be concluded that the synergy was
generated by the three drugs.
The combination of DZ-Nep + panobinostat +
temozolomide was found to be highly synergistic, particularly at
the highest concentrations. As a combination that includes DZ-Nep +
temozolomide (the pair of drugs whose synergy is more
questionable), this therapy showed high Fa values and very low CI
indexes.
These triple combinations of drugs may be used as a
therapeutic cocktail against glioblastoma with clinically relevant
efficacy in future. It is necessary to conduct further in
vivo experiments, however, to support any firmer conclusions
regarding the clinical use of this therapeutic regimen.
If deciding which of the combinations of the
different drugs is more effective, it may be hypothesized,
observing the CI indices, that the panobinostat + temozolomide
combination was the most synergistic (36 results of synergy),
followed by the combination of DZ-Nep + panobinostat (20
synergistic results), and then the combination of DZ-Nep +
temozolomide (10 synergistic results). Certainly, the triple
treatment was more synergistic than the double treatments, as it
produced synergy in 25 of the 30 experimental conditions; however,
the experimental conditions for the triple treatment were not as
broad as those used with the combinations of two drugs.
A second question is related to the genotype of the
cell lines. In this sense, the following can be concluded: The
greatest synergistic activity occurred in lines that carried p53
and/or PTEN mutations. When neither p53 nor PTEN were mutated (in
the case of GOS-3), there was limited synergy in any
pharmacological conditions. The DZ-Nep + panobinostat combination
showed the highest synergy in the U87MG (mutated PTEN) and
MOG-G-CCM (mutated p53) cell lines. The combination of panobinostat
+ temozolomide showed the highest synergy in the U87MG (mutated
PTEN) and in LN405 (mutated PTEN and mutated p53) cell lines.
Finally, the combination of DZ-Nep + temozolomide showed the
highest synergy in the LN405 cell line (mutated PTEN and mutated
p53). Conversely, the LN405-TMZR cell line, resistant to
temozolomide, and also carrying PTEN and p53 mutations, did not
exhibit similarly high occurrences of synergy compared with the
aforementioned cell lines. When comparing the response of LN405 and
LN405-TMZR to the different combinations of drugs, it was observed
that the DZ-Nep + temozolomide combination was highly synergistic
in LN405 cells (in five conditions) and less synergistic in
LN405-TMZR (only one condition, with low Fa). The combination of
panobinostat + temozolomide reduced the synergistic activity in the
temozolomide-resistant cells; LN405 produced three synergistic
conditions, and LN405-TMZR produced two synergistic conditions,
although the Fa was higher in one of the conditions in LN405-TMZR.
Finally, the DZ-Nep + panobinostat combination presented only one
synergistic condition in both LN405 and LN405-TMZR, although in the
latter, the Fa was greater.
Resistance to temozolomide, a phenomenon induced in
the present study and a relevant to clinical settings (58), is a novel challenge to be
investigated. Therefore, it appears necessary to conduct further
studies in pharmacological synergy with more cell lines, both
sensitive and resistant to temozolomide. Ideally, the genetic and
epigenetic profiles of these cell lines should be known, in order
to determine any possible association between the genetic and/or
epigenetic status of the cell lines, and tumor resistance to
temozolomide. However, in any case, it should be emphasized that
the present work does not pretend to introduce these compounds into
a clinical setting, so much as test them together to demonstrate
that epigenetic treatments can synergistically combine with
temozolomide treatment. Although multidrug combinations can
theoretically promote increased cancer cell death, it can also
result in more obvious side effects, such as granulocytopenia and
thrombocytopenia, if applied to the chemotherapy of patients with
glioma (59).
Further in vivo experiments would be of great
benefit, but would go beyond the scope of this manuscript. Indeed,
although assuming that not presenting in vivo data in the
present manuscript is a limitation of the study, from the observed
findings, one can at least determine the highest synergistic
combinations for further in vivo studies.
The therapeutic potential of the combination of
these three drugs in glioblastoma is clear, which is of clear
benefit, as current treatments against glioblastoma remain
unsatisfactory. However, the clinical impact of these compounds
should be evaluated with further experiments, including in
vivo testing, cytotoxicity studies and more molecular studies
into the expression of different prognostic markers.
Supplementary Data
Acknowledgments
Not applicable.
Funding
Financial support for this work was provided by a
grant from the Fundación Universidad de Navarra (Pamplona, Spain),
and predoctoral fellowships from the Asociación de Amigos de la
Universidad de Navarra (Pamplona, Spain).
Availability of data and materials
All data generated or analyzed during this study are
included in this published article.
Authors' contributions
JdlR, AU, BM, JAR, MAI and JSC conceived and
designed the experiments. JdlR and AU performed the experiments. IZ
and MVZ contributed to the acquisition of clinical data. JdlR, AU
and JSC analyzed the data and drafted the manuscript. All authors
contributed to revising the final version of the manuscript to be
published.
Ethics approval and consent to
participate
The study was approved by the Ethics Committee of
the University of Navarra (ref. no. CEI0502012). All samples were
fully anonymized prior to accessing.
Patient consent for publication
Not applicable.
Competing interests
The authors declare that they have no competing
interests.
References
|
1
|
Veliz I, Loo Y, Castillo O, Karachaliou N,
Nigro O and Rosell R: Advances and challenges in the molecular
biology and treatment of glioblastoma-is there any hope for the
future? Ann Transl Med. 3:72015.PubMed/NCBI
|
|
2
|
Verhaak RG, Hoadley KA, Purdom E, Wang V,
Qi Y, Wilkerson MD, Miller CR, Ding L, Golub T, Mesirov JP, et al
Cancer Genome Atlas Research Network: Integrated genomic analysis
identifies clinically relevant subtypes of glioblastoma
characterized by abnormalities in PDGFRA, IDH1, EGFR, and NF1.
Cancer Cell. 17:98–110. 2010. View Article : Google Scholar : PubMed/NCBI
|
|
3
|
Fan TY, Wang H, Xiang P, Liu YW, Li HZ,
Lei BX, Yu M and Qi ST: Inhibition of EZH2 reverses
chemotherapeutic drug TMZ chemosensitivity in glioblastoma. Int J
Clin Exp Pathol. 7:6662–6670. 2014.PubMed/NCBI
|
|
4
|
Network CGAR; Cancer Genome Atlas Research
Network: Comprehensive genomic characterization defines human
glioblastoma genes and core pathways. Nature. 455:1061–1068. 2008.
View Article : Google Scholar : PubMed/NCBI
|
|
5
|
Lo HW: EGFR-targeted therapy in malignant
glioma: Novel aspects and mechanisms of drug resistance. Curr Mol
Pharmacol. 3:37–52. 2010. View Article : Google Scholar
|
|
6
|
Quick A, Patel D, Hadziahmetovic M,
Chakravarti A and Mehta M: Current therapeutic paradigms in
glioblastoma. Rev Recent Clin Trials. 5:14–27. 2010. View Article : Google Scholar : PubMed/NCBI
|
|
7
|
Eyüpoglu IY and Savaskan NE: Epigenetics
in Brain Tumors: HDACs Take Center Stage. Curr Neuropharmacol.
14:48–54. 2016. View Article : Google Scholar :
|
|
8
|
Ferreira WA, Pinheiro DR, Costa Junior CA,
Rodrigues-Antunes S, Araújo MD, Leão Barros MB, Teixeira AC, Faro
TA, Burbano RR, Oliveira EH, et al: An update on the epigenetics of
glioblastomas. Epigenomics. 8:1289–1305. 2016. View Article : Google Scholar : PubMed/NCBI
|
|
9
|
Gusyatiner O and Hegi ME: Glioma
epigenetics: From subclassification to novel treatment options.
Semin Cancer Biol. 51:50–58. 2018. View Article : Google Scholar
|
|
10
|
Kreth S, Thon N and Kreth FW: Epigenetics
in human gliomas. Cancer Lett. 342:185–192. 2014. View Article : Google Scholar
|
|
11
|
Yong RL and Tsankova NM: Emerging
interplay of genetics and epigenetics in gliomas: A new hope for
targeted therapy. Semin Pediatr Neurol. 22:14–22. 2015. View Article : Google Scholar : PubMed/NCBI
|
|
12
|
Chen J, Zhang M, Zhang X, Fan L, Liu P, Yu
L, Cao X, Qiu S and Xu Y: EZH2 inhibitor DZNep modulates microglial
activation and protects against ischaemic brain injury after
experimental stroke. Eur J Pharmacol. 857:1724522019. View Article : Google Scholar : PubMed/NCBI
|
|
13
|
Atadja P: Development of the pan-DAC
inhibitor panobinostat (LBH589): Successes and challenges. Cancer
Lett. 280:233–241. 2009. View Article : Google Scholar : PubMed/NCBI
|
|
14
|
Gall Trošelj K, Novak Kujundzic R and
Ugarkovic D: Polycomb repressive complex's evolutionary conserved
function: The role of EZH2 status and cellular background. Clin
Epigenetics. 8:552016. View Article : Google Scholar
|
|
15
|
Rao ZY, Cai MY, Yang GF, He LR, Mai SJ,
Hua WF, Liao YJ, Deng HX, Chen YC, Guan XY, et al: EZH2 supports
ovarian carcinoma cell invasion and/or metastasis via regulation of
TGF-beta1 and is a predictor of outcome in ovarian carcinoma
patients. Carcinogenesis. 31:1576–1583. 2010. View Article : Google Scholar : PubMed/NCBI
|
|
16
|
Li K, Liu C, Zhou B, Bi L, Huang H, Lin T
and Xu K: Role of EZH2 in the growth of prostate cancer stem cells
isolated from LNCaP cells. Int J Mol Sci. 14:11981–11993. 2013.
View Article : Google Scholar : PubMed/NCBI
|
|
17
|
Zhang Y, Yu X, Chen L, Zhang Z and Feng S:
EZH2 overexpression is associated with poor prognosis in patients
with glioma. Oncotarget. 8:565–573. 2017.
|
|
18
|
Crea F, Fornaro L, Bocci G, Sun L, Farrar
WL, Falcone A and Danesi R: EZH2 inhibition: Targeting the
crossroad of tumor invasion and angiogenesis. Cancer Metastasis
Rev. 31:753–761. 2012. View Article : Google Scholar : PubMed/NCBI
|
|
19
|
Hayden A, Johnson PW, Packham G and Crabb
SJ: S-adenosylhomocysteine hydrolase inhibition by
3-deazaneplanocin A analogues induces anti-cancer effects in breast
cancer cell lines and synergy with both histone deacetylase and
HER2 inhibition. Breast Cancer Res Treat. 127:109–119. 2011.
View Article : Google Scholar
|
|
20
|
Kemp CD, Rao M, Xi S, Inchauste S, Mani H,
Fetsch P, Filie A, Zhang M, Hong JA, Walker RL, et al: Polycomb
repressor complex-2 is a novel target for mesothelioma therapy.
Clin Cancer Res. 18:77–90. 2012. View Article : Google Scholar
|
|
21
|
Suvà ML, Riggi N, Janiszewska M,
Radovanovic I, Provero P, Stehle JC, Baumer K, Le Bitoux MA, Marino
D, Cironi L, et al: EZH2 is essential for glioblastoma cancer stem
cell maintenance. Cancer Res. 69:9211–9218. 2009. View Article : Google Scholar : PubMed/NCBI
|
|
22
|
Crea F, Hurt EM, Mathews LA, Cabarcas SM,
Sun L, Marquez VE, Danesi R and Farrar WL: Pharmacologic disruption
of Polycomb Repressive Complex 2 inhibits tumorigenicity and tumor
progression in prostate cancer. Mol Cancer. 10:402011. View Article : Google Scholar : PubMed/NCBI
|
|
23
|
Chiba T, Suzuki E, Negishi M, Saraya A,
Miyagi S, Konuma T, Tanaka S, Tada M, Kanai F, Imazeki F, et al:
3-Deazaneplanocin A is a promising therapeutic agent for the
eradication of tumor-initiating hepatocellular carcinoma cells. Int
J Cancer. 130:2557–2567. 2012. View Article : Google Scholar
|
|
24
|
Smits M, Mir SE, Nilsson RJ, van der Stoop
PM, Niers JM, Marquez VE, Cloos J, Breakefield XO, Krichevsky AM,
Noske DP, et al: Down-regulation of miR-101 in endothelial cells
promotes blood vessel formation through reduced repression of EZH2.
PLoS One. 6:e162822011. View Article : Google Scholar : PubMed/NCBI
|
|
25
|
Yamagishi M and Uchimaru K: Targeting EZH2
in cancer therapy. Curr Opin Oncol. 29:375–381. 2017. View Article : Google Scholar : PubMed/NCBI
|
|
26
|
Yan KS, Lin CY, Liao TW, Peng CM, Lee SC,
Liu YJ, Chan WP and Chou RH: EZH2 in Cancer Progression and
Potential Application in Cancer Therapy: A Friend or Foe? Int J Mol
Sci. 18:182017. View Article : Google Scholar
|
|
27
|
Kim KH and Roberts CW: Targeting EZH2 in
cancer. Nat Med. 22:128–134. 2016. View Article : Google Scholar : PubMed/NCBI
|
|
28
|
Yu C, Friday BB, Yang L, Atadja P, Wigle
D, Sarkaria J and Adjei AA: Mitochondrial Bax translocation
partially mediates synergistic cytotoxicity between histone
deacetylase inhibitors and proteasome inhibitors in glioma cells.
Neuro Oncol. 10:309–319. 2008. View Article : Google Scholar : PubMed/NCBI
|
|
29
|
Berghauser Pont LM, Kleijn A, Kloezeman
JJ, van den Bossche W, Kaufmann JK, de Vrij J, Leenstra S, Dirven
CM and Lamfers ML: The HDAC Inhibitors Scriptaid and LBH589
Combined with the Oncolytic Virus Delta24-RGD Exert Enhanced
Anti-Tumor Efficacy in Patient-Derived Glioblastoma Cells. PLoS
One. 10:e01270582015. View Article : Google Scholar : PubMed/NCBI
|
|
30
|
Lee EQ, Reardon DA, Schiff D, Drappatz J,
Muzikansky A, Grimm SA, Norden AD, Nayak L, Beroukhim R, Rinne ML,
et al: Phase II study of panobinostat in combination with
bevacizumab for recurrent glioblastoma and anaplastic glioma. Neuro
Oncol. 17:862–867. 2015. View Article : Google Scholar : PubMed/NCBI
|
|
31
|
Pont LM, Naipal K, Kloezeman JJ,
Venkatesan S, van den Bent M, van Gent DC, Dirven CM, Kanaar R,
Lamfers ML and Leenstra S: DNA damage response and anti-apoptotic
proteins predict radiosensitization efficacy of HDAC inhibitors
SAHA and LBH589 in patient-derived glioblastoma cells. Cancer Lett.
356(2 Pt B): 525–535. 2015. View Article : Google Scholar
|
|
32
|
Singleton WG, Collins AM, Bienemann AS,
Killick-Cole CL, Haynes HR, Asby DJ, Butts CP, Wyatt MJ, Barua NU
and Gill SS: Convection enhanced delivery of panobinostat
(LBH589)-loaded pluronic nano-micelles prolongs survival in the F98
rat glioma model. Int J Nanomedicine. 12:1385–1399. 2017.
View Article : Google Scholar : PubMed/NCBI
|
|
33
|
Yao ZG, Li WH, Hua F, Cheng HX, Zhao MQ,
Sun XC, Qin YJ and Li JM: LBH589 Inhibits Glioblastoma Growth and
Angiogenesis Through Suppression of HIF-1α Expression. J
Neuropathol Exp Neurol. 76:1000–1007. 2017. View Article : Google Scholar : PubMed/NCBI
|
|
34
|
Li Y and Seto E: HDACs and HDAC Inhibitors
in Cancer Development and Therapy. Cold Spring. Harb Perspect Med.
6:62016.
|
|
35
|
De Souza C and Chatterji BP: HDAC
Inhibitors as Novel Anti-Cancer Therapeutics. Recent Patents
Anticancer Drug Discov. 10:145–162. 2015. View Article : Google Scholar
|
|
36
|
Turtoi A, Peixoto P, Castronovo V and
Bellahcène A: Histone deacetylases and cancer-associated
angiogenesis: Current understanding of the biology and clinical
perspectives. Crit Rev Oncog. 20:119–137. 2015. View Article : Google Scholar : PubMed/NCBI
|
|
37
|
Aum DJ, Kim DH, Beaumont TL, Leuthardt EC,
Dunn GP and Kim AH: Molecular and cellular heterogeneity: The
hallmark of glioblastoma. Neurosurg Focus. 37:E112014. View Article : Google Scholar : PubMed/NCBI
|
|
38
|
Friedmann-Morvinski D: Glioblastoma
heterogeneity and cancer cell plasticity. Crit Rev Oncog.
19:327–336. 2014. View Article : Google Scholar : PubMed/NCBI
|
|
39
|
Greco WR, Bravo G and Parsons JC: The
search for synergy: A critical review from a response surface
perspective. Pharmacol Rev. 47:331–385. 1995.PubMed/NCBI
|
|
40
|
Goldin A and Mantel N: The employment of
combinations of drugs in the chemotherapy of neoplasia: A review.
Cancer Res. 17:635–654. 1957.PubMed/NCBI
|
|
41
|
Chou TC and Talalay P: Quantitative
analysis of dose-effect relationships: The combined effects of
multiple drugs or enzyme inhibitors. Adv Enzyme Regul. 22:27–55.
1984. View Article : Google Scholar : PubMed/NCBI
|
|
42
|
Berenbaum MC: Synergy, additivism and
antagonism in immunosuppression. A critical review Clin Exp
Immunol. 28:1–18. 1977.
|
|
43
|
Loewe S: Marginal notes on the
quantitative pharmacology of combined drugs. Arzneimittelforschung.
9:449–456. 1959.In German. PubMed/NCBI
|
|
44
|
Chou TC: Theoretical basis, experimental
design, and computerized simulation of synergism and antagonism in
drug combination studies. Pharmacol Rev. 58:621–681. 2006.
View Article : Google Scholar : PubMed/NCBI
|
|
45
|
Foucquier J and Guedj M: Analysis of drug
combinations: Current methodological landscape. Pharmacol Res
Perspect. 3:e001492015. View Article : Google Scholar : PubMed/NCBI
|
|
46
|
Chou TC: Drug combination studies and
their synergy quantification using the Chou-Talalay method. Cancer
Res. 70:440–446. 2010. View Article : Google Scholar : PubMed/NCBI
|
|
47
|
Chou T and Martin N: CompuSyn Software for
Drug Combinations and for General Dose Effect Analysis. ComboSyn,
Inc.; Paramus, NJ: 2007
|
|
48
|
Johannessen TC, Hasan-Olive MM, Zhu H,
Denisova O, Grudic A, Latif MA, Saed H, Varughese JK, Røsland GV,
Yang N, et al: Thioridazine inhibits autophagy and sensitizes
glioblastoma cells to temozolomide. Int J Cancer. 144:1735–1745.
2019. View Article : Google Scholar
|
|
49
|
Smits M, Nilsson J, Mir SE, van der Stoop
PM, Hulleman E, Niers JM, de Witt Hamer PC, Marquez VE, Cloos J,
Krichevsky AM, et al: miR-101 is down-regulated in glioblastoma
resulting in EZH2-induced proliferation, migration, and
angiogenesis. Oncotarget. 1:710–720. 2010. View Article : Google Scholar
|
|
50
|
Livak KJ and Schmittgen TD: Analysis of
relative gene expression data using real-time quantitative PCR and
the 2(-Delta Delta C(T)). Method Methods. 25:402–408. 2001.
View Article : Google Scholar
|
|
51
|
Lee SY: Temozolomide resistance in
glioblastoma multiforme. Genes Dis. 3:198–210. 2016. View Article : Google Scholar : PubMed/NCBI
|
|
52
|
Fiskus W, Rao R, Balusu R, Ganguly S, Tao
J, Sotomayor E, Mudunuru U, Smith JE, Hembruff SL, Atadja P, et al:
Superior efficacy of a combined epigenetic therapy against human
mantle cell lymphoma cells. Clin Cancer Res. 18:6227–6238. 2012.
View Article : Google Scholar : PubMed/NCBI
|
|
53
|
Fiskus W, Wang Y, Sreekumar A, Buckley KM,
Shi H, Jillella A, Ustun C, Rao R, Fernandez P, Chen J, et al:
Combined epigenetic therapy with the histone methyltransferase EZH2
inhibitor 3-deazaneplanocin A and the histone deacetylase inhibitor
panobinostat against human AML cells. Blood. 114:2733–2743. 2009.
View Article : Google Scholar : PubMed/NCBI
|
|
54
|
Takashina T, Kinoshita I, Kikuchi J,
Shimizu Y, Sakakibara-Konishi J, Oizumi S, Nishimura M and
Dosaka-Akita H: Combined inhibition of EZH2 and histone
deacetylases as a potential epigenetics therapy for non-small-cell
lung cancer cells. Cancer Sci. 107:955–962. 2016. View Article : Google Scholar : PubMed/NCBI
|
|
55
|
Ding L, Chen S, Liu P, Pan Y, Zhong J,
Regan KM, Wang L, Yu C, Rizzardi A, Cheng L, et al: CBP loss
cooperates with PTEN haploinsufficiency to drive prostate cancer:
Implications for epigenetic therapy. Cancer Res. 74:2050–2061.
2014. View Article : Google Scholar : PubMed/NCBI
|
|
56
|
Çıtışlı V, Dodurga Y, Eroğlu C, Seçme M,
Avcı CB and Şatıroğlu-Tufan NL: Temozolomide may induce cell cycle
arrest by interacting with URG4/URGCP in SH-SY5Y neuroblastoma
cells. Tumour Biol. 36:6765–6772. 2015. View Article : Google Scholar
|
|
57
|
Pawlowska E, Szczepanska J, Szatkowska M
and Blasiak J: An Interplay between Senescence, Apoptosis and
Autophagy in Glioblastoma Multiforme-Role in Pathogenesis and
Therapeutic Perspective. Int J Mol Sci. 19:32018. View Article : Google Scholar
|
|
58
|
Perazzoli G, Prados J, Ortiz R, Caba O,
Cabeza L, Berdasco M, Gónzalez B and Melguizo C: Temozolomide
Resistance in Glioblastoma Cell Lines: Implication of MGMT, MMR,
P-Glycoprotein and CD133 Expression. PLoS One. 10:e01401312015.
View Article : Google Scholar : PubMed/NCBI
|
|
59
|
Dong J, Meng X, Li S, Chen Q, Shi L, Jiang
C and Cai J: Risk of adverse vascular events in patients with
malignant glioma treated with bevacizumab plus irinotecan: A
systematic review and meta-analysis. World Neurosurg.
130:e236–e243. 2019. View Article : Google Scholar : PubMed/NCBI
|
|
60
|
Zhang R, Banik NL and Ray SK: Differential
sensitivity of human glioblastoma LN18 (PTEN-positive) and A172
(PTEN-negative) cells to Taxol for apoptosis. Brain Res.
1239:216–225. 2008. View Article : Google Scholar : PubMed/NCBI
|
|
61
|
Patyka M, Sharifi Z, Petrecca K, Mansure
J, Jean-Claude B and Sabri S: Sensitivity to PRIMA-1MET is
associated with decreased MGMT in human glioblastoma cells and
glioblastoma stem cells irrespective of p53 status. Oncotarget.
7:60245–60269. 2016. View Article : Google Scholar : PubMed/NCBI
|
|
62
|
Koul D, Wang S, Wu S, Saito N, Zheng S,
Gao F, Kaul I, Setoguchi M, Nakayama K, Koyama K, et al:
Preclinical therapeutic efficacy of a novel blood-brain
barrier-penetrant dual PI3K/mTOR inhibitor with preferential
response in PI3K/PTEN mutant glioma. Oncotarget. 8:21741–21753.
2017. View Article : Google Scholar : PubMed/NCBI
|
|
63
|
Hill VK, Kim JS, James CD and Waldman T:
Correction of PTEN mutations in glioblastoma cell lines via
AAV-mediated gene editing. PLoS One. 12:e01766832017. View Article : Google Scholar : PubMed/NCBI
|
|
64
|
Muñoz J, Inda MM, Lázcoz P, Zazpe I, Fan
X, Alfaro J, Tuñón T, Rey JA and Castresana JS: Promoter
Methylation of RASSF1A Associates to Adult Secondary Glioblastomas
and Pediatric Glioblastomas. ISRN Neurol. 2012:5765782012.
View Article : Google Scholar : PubMed/NCBI
|
|
65
|
de la Rosa J, Urdiciain A, Aznar-Morales
JJ, Meléndez B, Rey JA, Idoate MA and Castresana JS: Panobinostat
and its combination with 3-deazaneplanocin-A induce apoptosis and
inhibit In vitro tumorigenesis and metastasis in GOS-3 glioblastoma
cell lines. Cancer Transl Med. 4:39–47. 2018. View Article : Google Scholar
|
|
66
|
Forget KJ, Tremblay G and Roucou X: p53
Aggregates penetrate cells and induce the co-aggregation of
intracellular p53. PLoS One. 8:e692422013. View Article : Google Scholar : PubMed/NCBI
|