Introduction
Endothelial cells of blood vessels are in direct
contact with circulating components; therefore, they are inevitably
exposed to the highest concentrations of drugs during drug
treatment. This is well illustrated by the blood-brain barrier,
where endothelial cells overexpressing the ABC transporter are a
major mechanism underlying drug resistance (1–4).
Previous studies demonstrated that acquired multiple drug
resistance can be induced in endothelial cells, and that this
resistance affects the efficacy of anticancer treatment in
vitro and in vivo (1–4).
Notably, resistance in endothelial cells can be induced by
antiangiogenic drugs targeting tyrosine kinase receptors, including
sunitinib (2,3).
Various factors involved in the process of tumor
angiogenesis and tumor growth are angiogenesis-dependent (5). Therefore therapeutic agents targeting
tumor endothelial cells have been developed for anticancer
treatment, including compounds such as sunitinib, which target
angiogenic growth factor receptors, predominantly tyrosine kinase
receptors (6,7). These inhibitors were initially
expected not to induce clinical resistance; however, after >10
years of clinical use, resistance to antiangiogenic therapies has
been widely reported (7–9). Several mechanisms have now been
described, including alternative angiogenic pathways, selective
pressure of hypoxia, cancer stem cells, recruitment of vascular
progenitors and modulators, and tumor dormancy (9–11).
It is known that lysosomes sequester lipophilic
amine drugs through a non-enzymatic and non-transporter-mediated
process (12–14). As a hydrophobic (logP, 2.93), weak
base (pKa, 9.04) molecule, sunitinib has been reported to
accumulate in acidic lysosomes (15,16).
The extent of lysosomal drug sequestration depends on the pH
gradient between the acidic luminal pH of the lysosome and that of
the cytoplasm. Consequently, drugs are sequestered away from their
intracellular target sites (17).
Notably, certain multidrug resistance transporters of the ABC
superfamily, such as ATP binding cassette subfamily B member 1
(ABCB1; also known as P-gp), are highly expressed on the lysosomal
membrane, and further accelerate ATP-dependent lysosomal drug
sequestration (16–18). A previous in vivo study
detected higher intratumoral concentrations of sunitinib than those
found in plasma, further supporting the clinical relevance of
sunitinib lysosome sequestration (19).
Studies on tumor cells have indicated that lysosome
sequestration of sunitinib may induce autophagy-associated
resistance in these cells (20–23).
Lysosomes are spherical membrane-bound organelle vesicles with a
lumen pH of 4.5–5.0; these vesicles contain a panel of hydrolytic
enzymes that enable biomolecular hydrolysis. Lysosomes are involved
in various cellular processes, including secretion, plasma membrane
repair, cell signaling and energy metabolism (24,25).
Autophagosome biogenesis and lysosome activity are essential for
autophagy, which enables the breakdown and recycling of cellular
components. Autophagy is constitutively expressed in all mammalian
cells, and the overall mechanisms initiating and terminating
autophagy are at present being extensively investigated (24–26).
Currently, the role of autophagic drug flux in sunitinib lysosomal
sequestration in cancer cells is well demonstrated and autophagy
activation is considered a key step in drug sequestration (17). The modulation of autophagy is
expected to be an effective strategy for developing novel
anticancer drugs (27,28).
Our previous study demonstrated the induction of
multiple drug resistance in human microcapillary endothelial HMEC-1
cells following exposure to sunitinib, with upregulated P-gp
expression (2). The present study
investigated the occurrence of lysosome sequestration of sunitinib
in endothelial cells and explored the relevant mechanisms.
Materials and methods
Materials
Anti-microtubule-associated protein 1A/1B-light
chain 3 (LC3; cat. no. 0231-100/LC3-5F10) was obtained from Enzo
Life Sciences, Inc.; anti-lysosomal-associated membrane protein 1
(LAMP-1; H4A3; cat. no. sc-20011) was purchased from Santa Cruz
Biotechnology, Inc.; anti-sequestosome 1 (SQSTM1)/p62 (cat. no.
5114) was obtained from Cell Signaling Technology, Inc.;
horseradish peroxidase-labeled anti-rabbit/mouse IgG antibodies
(cat. no. 31460/31430) were obtained from Invitrogen; Thermo Fisher
Scientific, Inc.; anti-β-actin (cat. no. A5316) was purchased from
Sigma-Aldrich; Merck KGaA; goat anti-mouse IgG and goat anti-rabbit
IgG coupled to Alexa Fluor 594 (cat. no. A-11005/A-11012) were also
obtained from Invitrogen; Thermo Fisher Scientific, Inc.
Bafilomycin A1 (BAF; 10 nM) and chloroquine (CQ; 20 µM) were
purchased from Sigma-Aldrich; Merck KGaA; sunitinib was from
Selleck Chemicals; and Lyso-ER, Lyso-NIR and DAPI were purchased
from Abcam.
Cell culture and drug resistance
induction
The HMEC-1 cell line (ATCC® CRL-3243™)
was cultured in MCDB-131 medium (Gibco; Thermo Fisher Scientific,
Inc.) supplemented with 2 mM L-glutamine, 100 µg/ml
streptomycin, 100 U/ml penicillin and 15% fetal bovine serum
(Gibco; Thermo Fisher Scientific, Inc.), Sunitinib-resistant HMEC-1
cells were obtained in two ways: i) By continuously exposing HMEC-1
cells to escalating concentrations of sunitinib, from 0.01 to 16
µM, over a period of >8 weeks. ii) By continuously
exposing HMEC-1 cells to escalating concentrations of sunitinib,
from 0.01 to 6 µM, then maintaining cells in culture with 6
µM sunitinib over 8–12 weeks (HMEC6
µM). All cells were digested with
trypsin-EDTA once or twice a week and were cultured at 37°C in a
100% humidified atmosphere at 5% CO2. No mutagenic
agents were used in the establishment of these sunitinib-resistant
HMEC-1 cells.
Subcellular colocalization studies
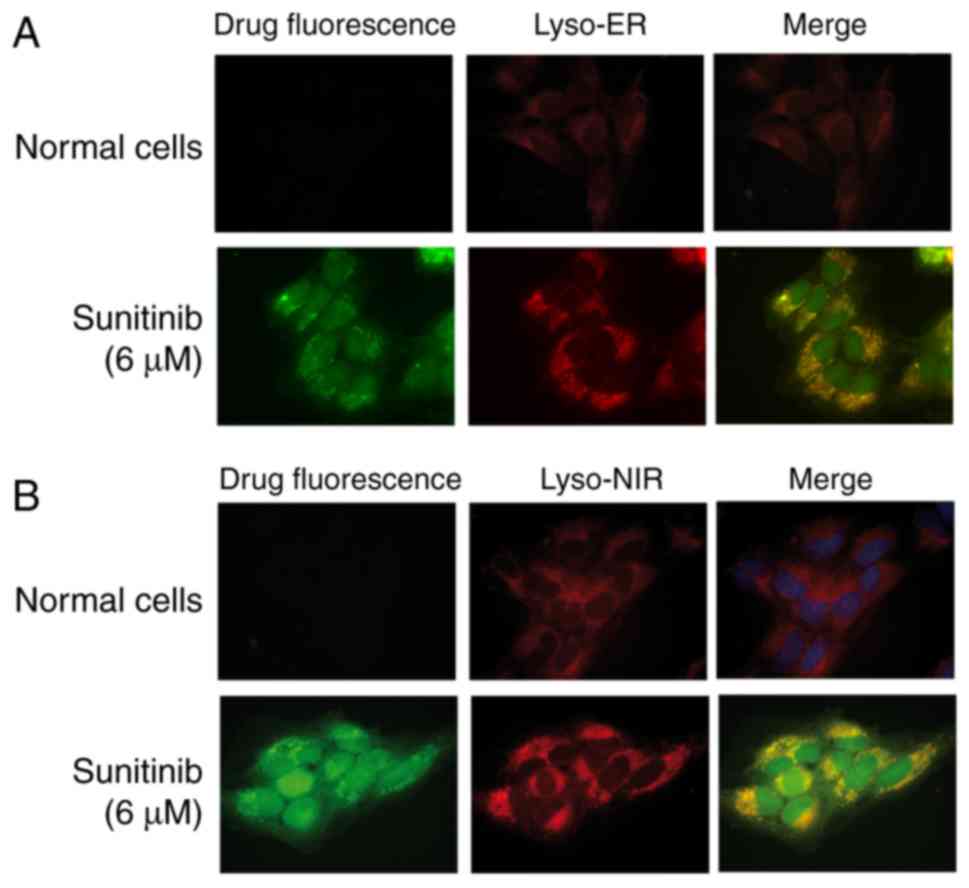
The HMEC-1 cells were incubated with or without
sunitinib 6 µM for 24 h, and then incubated with Lyso-ER or
Lyso-NIR (Abcam) for 30 min at 37°C. Subsequently, those cells were
fixed with 2% para-formaldehyde for 10 min at room temperature
without light. Images of the fixed cells were obtained under a
fluorescence microscope (Carl Zeiss AG).
Immunofluorescence
HMEC-1 and HMEC6
µM cells were seeded on glass
coverslips (5×10⁴ cells) in 24-well dishes with or
without sunitinib 6 µM at 37°C. After 24 or 48 h, the cells
were washed at 37°C, fixed at room temperature for 20 min with 2%
paraformaldehyde, and permeabilized with Tris-buffered saline (TBS)
containing 0.1% Triton X-100 (Sigma-Aldrich; Merck KGaA) for 30 min
at room temperature prior to being exposed to anti-LC3 (1:200) and
anti-LAMP-1 (1:50) antibodies and incubated overnight at 4°C. The
cells were washed three times with TBS and were then incubated in
the dark for 1 h at room temperature with a 1:1,000 dilution of
anti-mouse or anti-rabbit Alexa Fluor 594-labeled secondary
antibody (Invitrogen; Thermo Fisher Scientific, Inc.). The cells
were mounted using DAPI (Abcam). Fluorescence images were collected
under a Microscopy Imaging system (Carl Zeiss AG) and examined.
Sunitinib absorbance is in the range of 340–480 nm and the maximum
absorption is 429 nm. Sunitinib exhibits strong green fluorescence
with a maximum of 540 nm.
Flow cytometry
The HMEC-1 cells were incubated with or without
sunitinib (6 µM) for 24 or 48 h, and the HMEC6
µM cells were treated with sunitinib
(6 µM) for 2 or 3 months at 37°C. Then, cultured cells were
incubated with or without LysoTracker Red DND-99 for 15 min at 37°C
(cat. no. L7528; Invitrogen; Thermo Fisher Scientific, Inc.), then
all those cells were trypsinized and washed with PBS. After fixing
in 2% paraformaldehyde for 20 min at room temperature,
~106 cells were resuspended in PBS and analyzed using a
fluorescence-activated cell sorter (Canton II flow cytometer
FACscan; BD Biosciences), and data were analyzed using FlowJo
v7.6.1 and BD FACSDiva v4.1 (BD Biosciences).
Western blot analysis
The HMEC-1 cells were treated with or without
sunitinib 6 µM for 24 h, or with the autophagy inducer
rapamycin (Sigma-Aldrich; Merck KGaA; cat. no. 553210; 5 µM)
for 8 h, or Hanks' solution (Sigma-Aldrich; Merck KGaA; cat. no.
H6648) for 24 h at 37°C. All cells were collected and incubated for
30 min in radioimmunoprecipitation assay lysis buffer
(Sigma-Aldrich; Merck KGaA) on ice, centrifuged at 15,000 × g for 5
min and the total proteins in the supernatant were recovered. The
amount of extracted protein was determined using the RC-DC™ Protein
Assay kit (Bio-Rad Laboratories, Inc.). The proteins (12.5
µg in 50 µl), in the presence of Laemmli 1X buffer
(diluted from Laemmli 2X buffer; cat. no. 161-0737; Bio-Rad
Laboratories, Inc.) and β-mercaptoethanol, were denatured at 100°C
for 5 min and were then loaded onto an SDS-PAGE gel (4-20%
Mini-Protean® TGX Stain-Free™; Bio-Rad Laboratories,
Inc.). The proteins were transferred to a PVDF membrane
(Trans-Blot® Turbo™ Transfer kit, Mini Format, 0.2
µm PVDF; Bio-Rad Laboratories, Inc.), using the Turbo™
Transfer system (Trans-Blot® Turbo™ Transfer system;
Bio-Rad Laboratories, Inc.). The membrane was blocked with 5%
skimmed milk diluted in PBS-0.1% Tween (PBS-T) for 1 h at room
temperature and the membrane was then incubated with primary
anti-LC3 (1:1,000), anti-SQSTM1/p62 (1:1,000), anti-LAMP1 (1:200)
or anti-β-actin (1:5,000) antibodies in 5% bovine serum albumin
(BSA; Sigma-Aldrich; Merck KGaA) at 4°C overnight. The membrane was
then washed three times with PBS-0.1% Tween-20 for 5 min and
incubated with secondary antibodies. Horseradish
peroxidase-conjugated anti-rabbit or anti-mouse antibodies were
diluted 1:3,500 in 5% BSA and were incubated with the membrane for
1 h at room temperature. After three washes, HRP-ECL reagents
(Santa Cruz Biotechnology, Inc.) were added to the membrane and
chemiluminescence was revealed using a Fuji LAS-3000 system
(Fujifilm). The ratios of blot density signal of specific protein
bands to the control band were determined using ImageJ v1.51
software (National Institutes of Health).
Cell proliferation and cell viability
assays
HMEC-1 or HMEC6
µM cells (5×10⁴ cells/well)
were placed in the presence of sunitinib (0, 3, 6, 12 or 24
µM) for 72 h, or under treatment with 10 nM BAF or 20
µM CQ, with or without sunitinib (6 µM) for 48 h, in
a 24-well plate at 37°C. Then, the cells in each well were washed
twice with PBS, detached with 200 µl trypsin and added to
800 µl medium. Cells were counted using KOVA Slide II (cat.
no. 87118; Kova International, Inc.) or an automated cell-counter
(Z2; Beckman Coulter, Inc.). The cell number in each well was
divided by the initial seeded cell number to obtain the fold
increase in cell number. The cell number of the treated groups was
divided by the cell number of the appropriate control group to
obtain the cell survival rate (%). The replication time was the
average duration for a cell division.
Time-lapse imaging
HMEC-1 cells (2×10⁴/500 µl) with
sunitinib (6 µM) for 72 h or HMEC6
µM cells (2×10⁴/500
µl) without sunitinib (6 µM) for 72 h were incubated
in 4-well Hi-Q4 dishes (Biovalley) at 37°C in an incubator with
100% humidified atmosphere at 5% CO2. The images were
recorded in real time using the BioStation IM-Q Time Lapse Imaging
system (Nikon Corporation). Following the addition of sunitinib,
culture plates were immediately put into the culture chamber of the
time-lapse imaging system. The video recording usually began after
a lapse of 15 min, which was required for the choice of image
fields under microscopy.
Statistical analysis
Data are presented as the mean ± SD or mean ± SEM of
more than three independent experiments carried out in triplicate.
Results were statistically analyzed by one-way ANOVA using GraphPad
Prism 6 (GraphPad Software, Inc.). P<0.05 was considered to
indicate a statistically significant difference.
Results
Influx of sunitinib in HMEC-1 cells, and
its inhibitory and toxic effect
The present study investigated the impact of
different concentrations of sunitinib on the in vitro
culture of HMEC-1 cells. Sunitinib was added to HMEC-1 cells for
24, 48 and 72 h, and the cells were then trypsinized, collected and
counted under microscopy. The results demonstrated that sunitinib
inhibited cell division at low concentrations, and induced cell
death at higher concentrations (Fig.
1A). There were very few floating dead cells observed at
concentrations <12 µM, but much more at higher
concentrations, and few survived following treatment with 24
µM sunitinib. Below 12 µM, cell proliferation was
inhibited; however, cell numbers still increased, indicating that
cell division was still occurring. The IC50 of sunitinib
in normal HMEC-1 cells was 12.8±0.76 µM (Fig. 1B). This indicated that sunitinib
concentrations <12 µM were compatible with the survival
of HMEC-1 cells. During the experiments, it was demonstrated that 6
µM was a good compromise dose, since it satisfied three
essential conditions for further experiments. It enabled the
maintenance of cell culture in the long term; it provided a clear
view of the development of drug resistance; and it enabled clear
observation of sequestration of sunitinib using fluorescence
microscopy. Therefore, 6 µM concentration was selected for
further exploration.
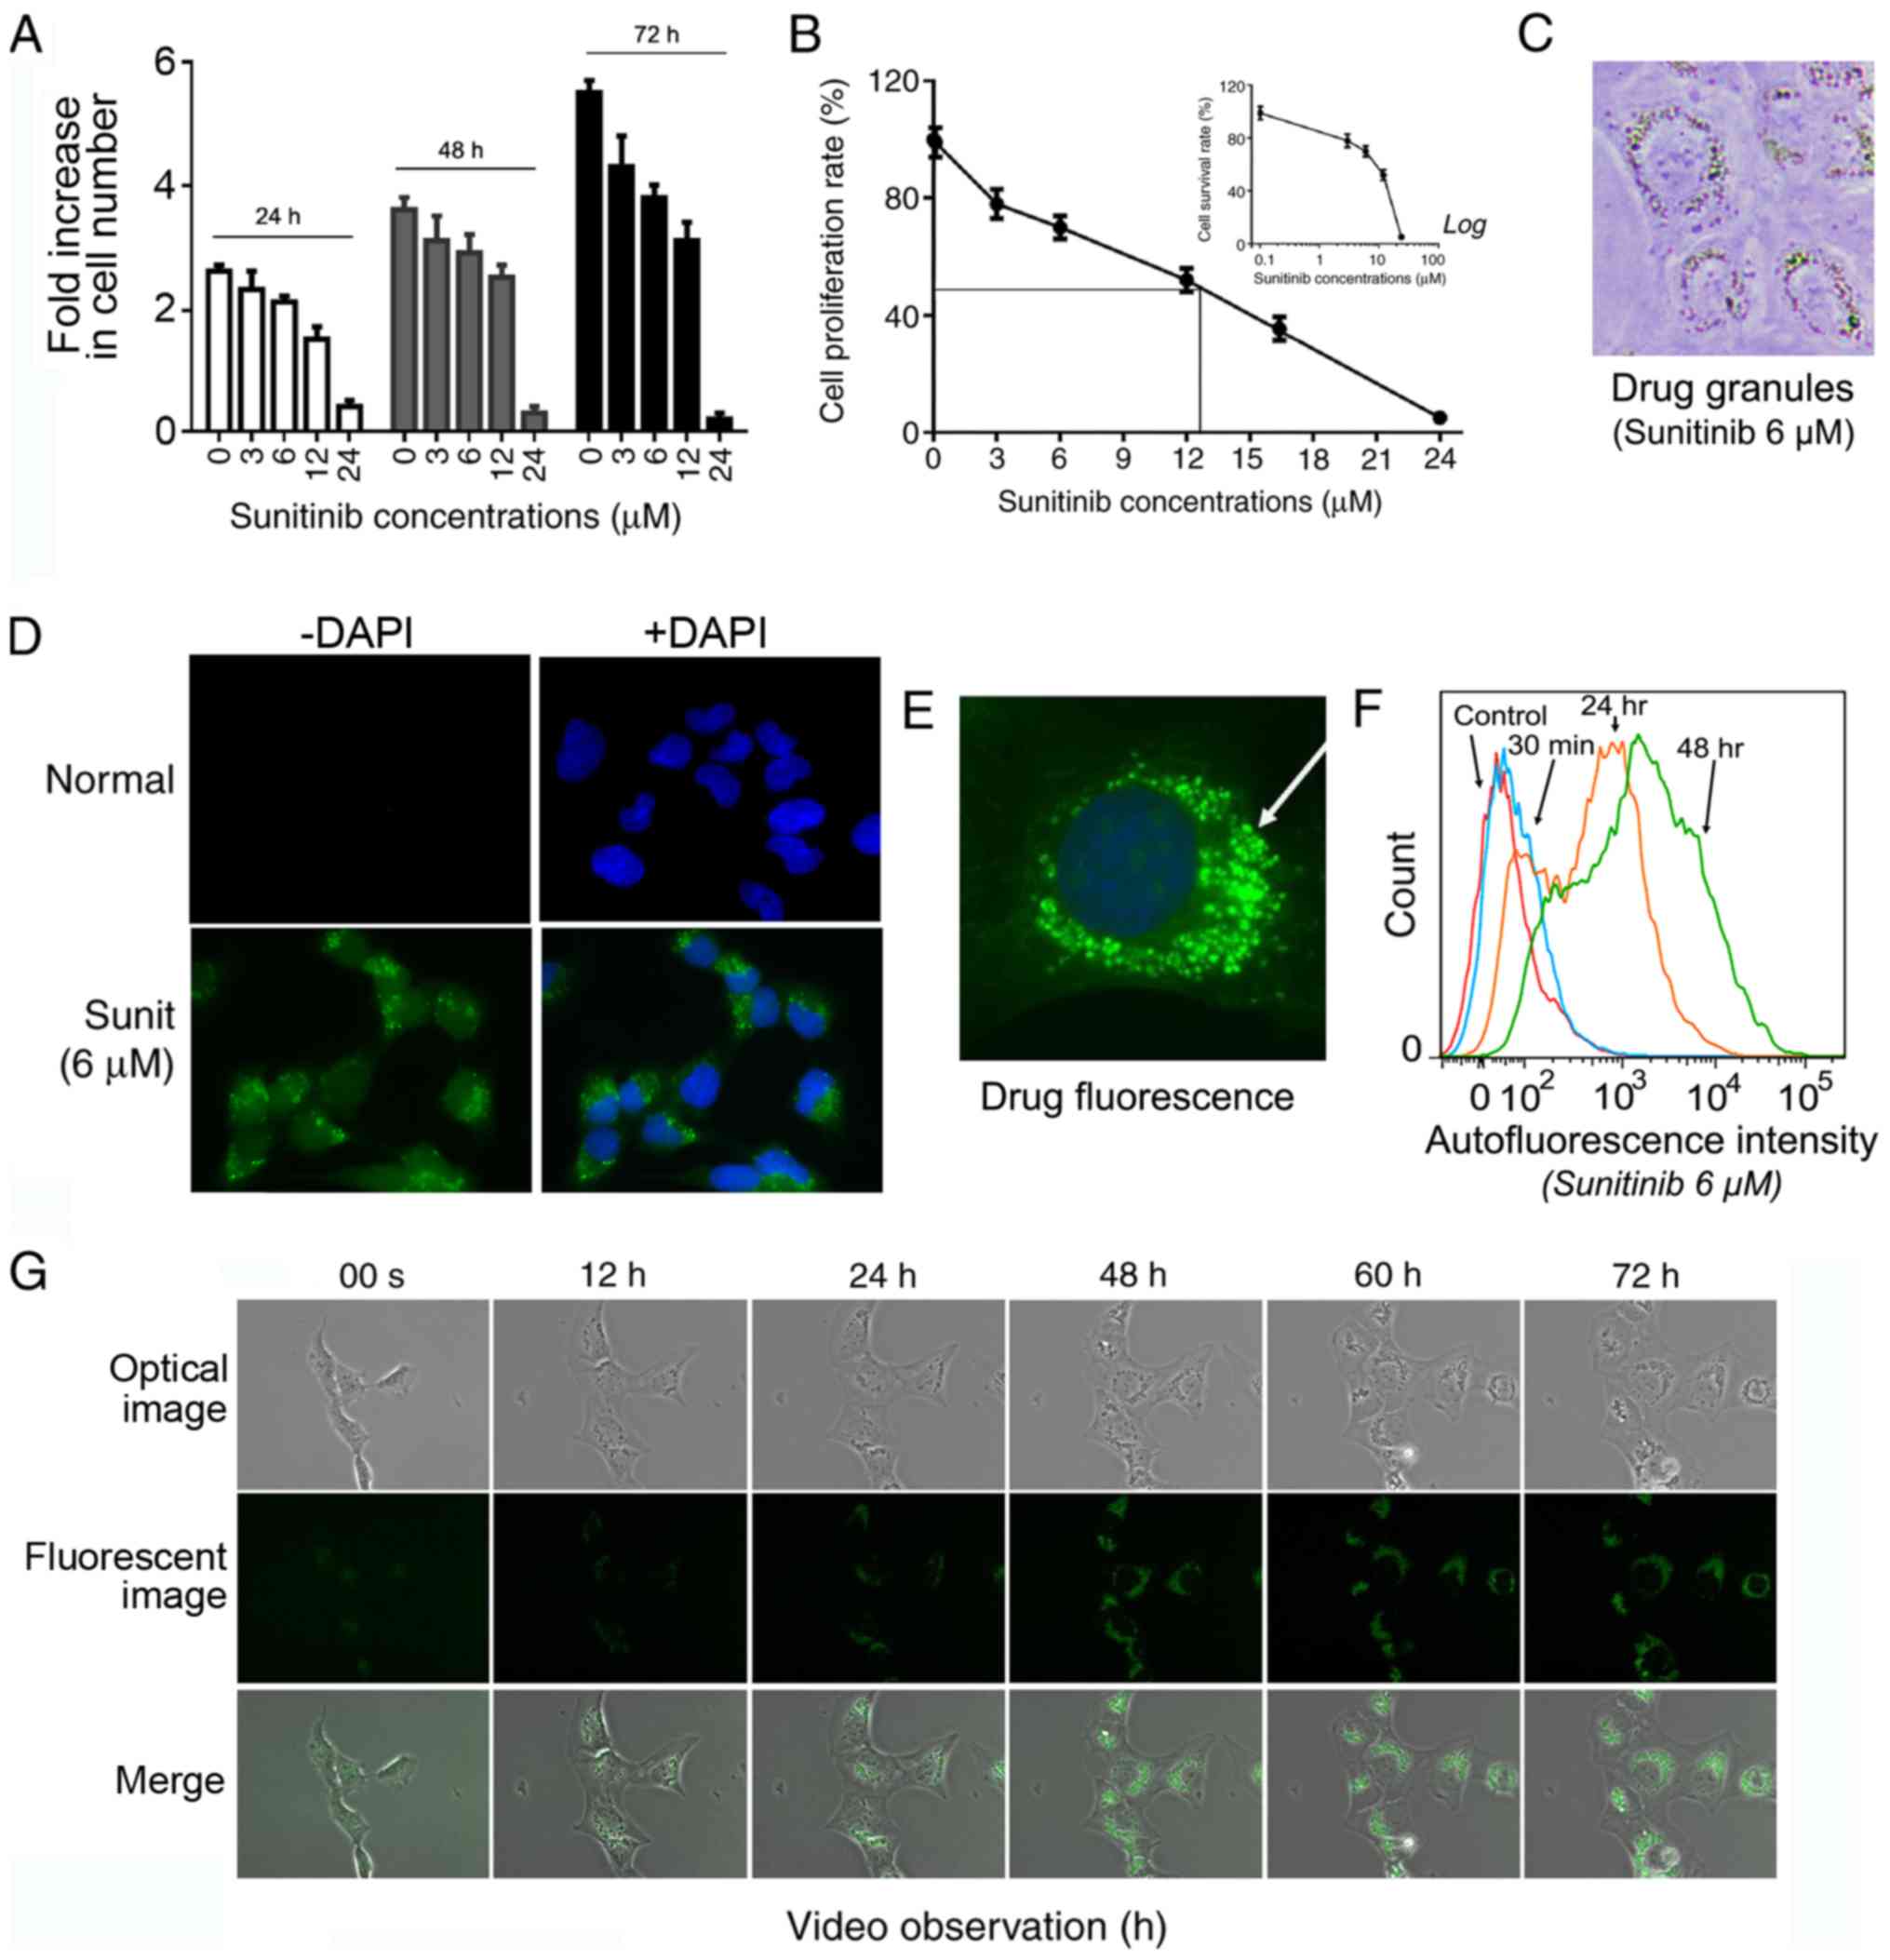 | Figure 1Sunitinib suppresses HMEC-1 cells
growth and penetrates HMEC-1 cells with the formation of
fluorescent perinuclear vesicles. (A) Inhibitory effect of
sunitinib at the indicated concentrations during different time
periods. HMEC-1 cells were treated with 3, 6, 12 and 24 µM
sunitinib for 24, 48 and 72 h. The cells were then washed,
trypsinized and counted. Data are presented as the mean ± SEM. (B)
Cell proliferation rate of HMEC-1 cells following treatment with
sunitinib for 72 h compared with the control cells (100%). The
inset graph shows the percentage of survived cells compared with
the untreated control cells under the indicated sunitinib
concentrations. Data are presented as the mean ± SEM. (C) Typical
microscope image of HMEC-1 cells following treatment with 6
µM sunitinib, exhibiting visible fluorescent granules
(magnification, ×200). (D) Typical fluorescence microscope image of
HMEC-1 cells following treatment with 6 µM sunitinib,
exhibiting fluorescent granules (magnification, ×100). (E)
Amplified picture of a typical image of 6 µM
sunitinib-treated HMEC-1 cells under fluorescence microscopy
(magnification, ×400). (F) Evaluation of intracellular sunitinib
quantity in HMEC-1 cells. The cells ware incubated with 6 µM
sunitinib for 30 min, and 24 and 48 h, washed and immediately
analyzed using flow cytometry. (G) Video images of living HMEC-1
cells following the addition 6 µM sunitinib. After the
addition of sunitinib, culture plates were immediately placed into
the culture chamber of a time-lapse imaging system. After image
zone selection, video recording usually began 15 min after the
addition of the drug. The images were taken every 12 min and images
at the indicated time points are shown (magnification, ×40). Sunit,
sunitinib. |
Under light microscopy, the organelles of normal
flat HMEC-1 cells were not clearly discernible. However, since
solubilized sunitinib displays a bright yellowish color, it was
possible to visualize sunitinib accumulation at sufficient
concentrations >1 µM. The cells were stained yellow after
overnight treatment and a large number of bright yellow vesicles
could be seen within the cells (Fig.
1C). These bright vesicles were concentrated around the
nucleus, with enhanced refraction.
Under fluorescence microscopy, green fluorescent
sunitinib was enclosed within intracellular granules (Fig. 1D). With higher amplification, the
green fluorescent granules were seen clearly around the cell
nucleus (Fig. 1E). Subsequently,
flow cytometry was conducted to follow the dynamic accumulation of
6 µM sunitinib in living cells. The results revealed that 30
min after adding sunitinib, the cells displayed clear green
fluorescence. Much stronger fluorescence was obtained after 24 h
and it appeared to approach its maximum level at 48 h (Fig. 1F).
To more intuitively and dynamically observe the
formation of fluorescent sunitinib granules, a time-lapse imaging
system coupled with fluorescence microscopy was used to record
normal living HMEC-1 cells for 72 h following 6 µM sunitinib
treatment (Fig. 1G and Video S1). The video revealed that
sunitinib influx into the cells was immediate and extremely
efficient. In <20 min, the intracellular fluorescence level was
seen to rise within the cytoplasm and bright fluorescent granules
began to emerge. The majority of the florescent granules emerged in
the juxtanuclear area of the cells and a few of the granules
emerged in the cytoplasm and then moved centripetally toward the
nucleus. During the first 24 h, these moving granules grew in size
and quickly clustered together. Subsequently, they either moved to
one cell pole or continually rotated around the cell nucleus. An
increase in the intensity of the drug fluorescence was observed
during the first 24 h and the brightness then gradually stabilized.
The spatial distribution of these vesicles fully complied with the
characteristic positioning of lysosomes in the perinuclear pool
near the microtubule-organizing center. Sunitinib is a weak base
known to induce cytosol alkalinization, which could also facilitate
the return of lysosomes to their central location (29).
To further verify these results, two lysosomal
tracers, Lyso-ER and Lyso-NIR, were added to the sunitinib-treated
cells and the cells were examined. The results confirmed that the
lysosomal tracers and sunitinib markedly overlapped in HMEC-1 cells
(Fig. 2).
Induction of drug resistance and
activation of autophagy by sunitinib in HMEC-1 cells
HMEC-1 cells were exposed to escalating doses of
sunitinib, up to 24 µM, to induce drug resistance. The
results revealed that the time required for cell division
progressively increased, with more floating dead cells observed
when the concentrations reached >12 µM. To avoid cell
death, cells were incubated with a fixed concentration of 6
µM sunitinib for 3 months to induce drug resistance.
Notably, the cell division cycle was gradually prolonged (Fig. 3A). After 3 months, the
IC50 value of sunitinib in 6 µM sunitinib-induced
HMEC-1 cells had progressively shifted to ~25 µM compared
with 12.8 µM for normal HMEC-1 cells (Fig. 3B and C). These cells were
maintained in long-term culture with 6 µM sunitinib for
subsequent experiments (HMEC6
µM). These data indicated that the
induction of sunitinib resistance in HMEC-1 cells was dose- and
time-dependent.
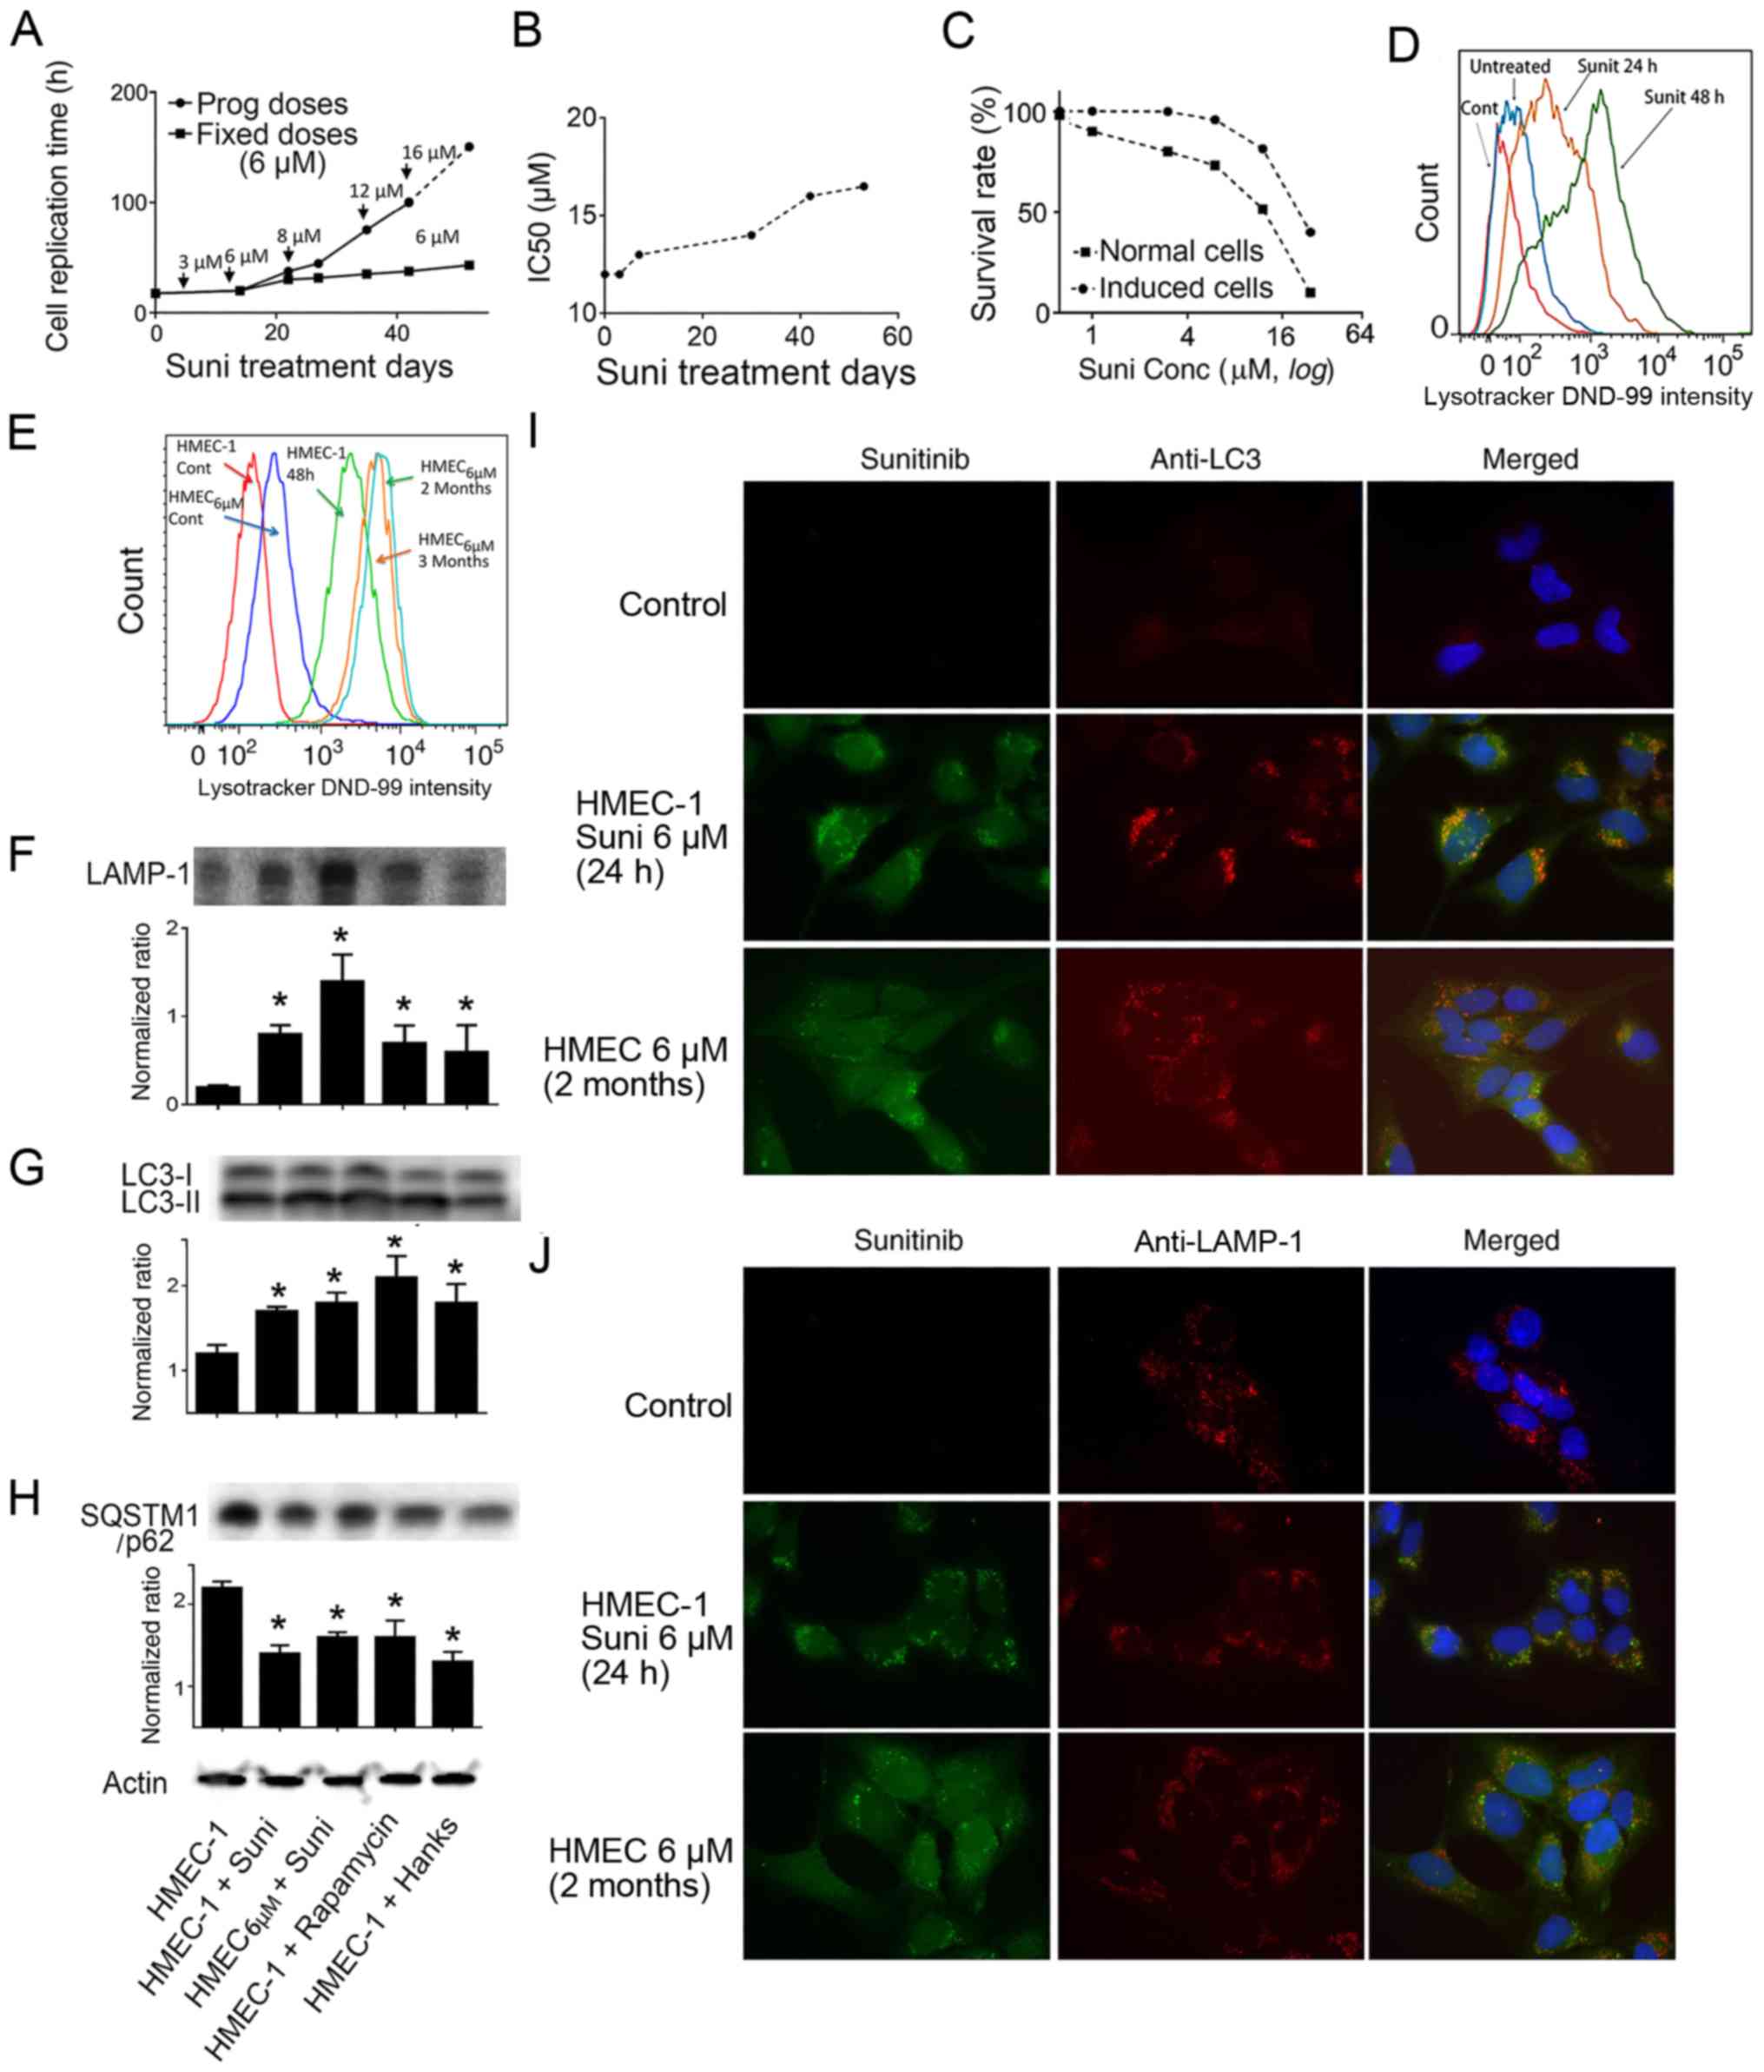 | Figure 3Induction of drug resistance in
HMEC-1 cells and sunitinib-induced activation of autophagy. (A)
Replication times of cultured HMEC-1 cells in the presence of
indicated concentrations of sunitinib. Data were calculated from
more than two repetitions. (B) Evolution of the IC50 of sunitinib
in HMEC-1 cells after treatment with 6 µM sunitinib for
different time periods. (C) Plotted survival rates of HMEC-1 cells
and sunitinib-resistant HMEC6
µM cells. Normal HMEC-1 cells and
sunitinib-resistant HMEC6
µM cells were exposed to the indicated
concentrations of sunitinib for 72 h, and the cells were
trypsinized and counted. Non-treated cells were set as 100%. (A-C)
Curves are derived from the means of more than three experiments.
(D) LysoTracker DND-99 density of HMEC-1 cells following incubation
with 6 µM sunitinib for different time periods. Cells were
treated with sunitinib for 24 or 48 h and LysoTracker DND-99 was
added followed by flow cytometric analysis. (E) LysoTracker DND-99
density of sunitinib-treated HMEC-1 cells and HMEC6
µM cells. The cells were washed five
times and then incubated with LysoTracker DND-99. Fluorescence was
measured with the control cells without LysoTracker DND-99 staining
using flow cytometry. (F-H) Western blot analysis using
anti-LAMP-1, anti-LC3 and anti-p62 antibodies. HMEC-1 and
HMEC6 µM cells were exposed
to 6 µM sunitinib, or autophagy inducer 5 µM
rapamycin, or Hanks' media for 24 h. Subsequently, the cells were
collected and extracted proteins were used for western blotting.
The experiments were repeated at least three times.
*P<0.05 vs. control HMEC-1 cells. (I) Colocalization
of LC3 protein labeling with green sunitinib fluorescence. HMEC-1
and HMEC6 µM cells were
treated with 6 µM sunitinib for 24 h. Subsequently, the
cells were stained with anti-LC3 (red fluorescence) (magnification,
×100). DAPI was added to stain the nuclei. (J) Colocalization of
LAMP-1 protein labeling with green sunitinib fluorescence. HMEC-1
and HMEC6 µM cells were
treated with 6 µM sunitinib for 24 h. Subsequently, the
cells were stained with anti-LAMP-1 (red fluorescence)
(magnification, ×100). DAPI was added to stain the nuclei. LAMP-1,
lysosomal-associated membrane protein 1; LC3,
microtubule-associated protein 1A/1B-light chain 3; SQSTM1,
sequestosome 1; Suni, sunitinib. |
The aforementioned results strongly indicated that
the detected lysosomes were the sunitinib-sequestering vesicles,
and LysoTracker DND-99 was used to quantify the volumetric change
in lysosomes following exposure to sunitinib. The results
demonstrated that together with the increase in the intensity of
sunitinib autofluorescence (Fig.
1F), the intensity of LysoTracker DND-99 in the
sunitinib-treated cells was increased in parallel compared to the
untreated control cells, indicating the expansion of lysosomes and
their fusion with autophagosomes (Fig.
3D). Lysosomal mass was compared between HMEC-1 and
HMEC6 µM cells. The
HMEC6 µM cells exhibited
moderately higher DND-99 fluorescence, suggesting a limited
expansion of the lysosomal mass following long term exposure to
sunitinib (Fig. 3E).
This study investigated the activation of autophagy
in response to sunitinib treatment using autophagy molecular
markers (30). The results of
western blot analysis revealed that the protein expression levels
of LAMP-1 were significantly increased after 24 h of sunitinib
treatment, and a further increase was observed in HMEC6
µM cells (Fig. 3F) (31). In addition, the ratio of
LC3-II/LC3-I was significantly increased in these cells, which
indicated the active formation of autophagosomes (Fig. 3G). Furthermore, the significant
downregulation of SQSTM1/p62 protein in these cells confirmed the
ongoing process of active autophagy (Fig. 3H). These findings suggested that
autophagy was activated in response to sunitinib treatment.
Immunolabelling experiments with sunitinib-treated cells exhibited
colocalization of anti-LC3-II (Fig.
3I) and a similar highly overlapped colocalization of
anti-LAMP-1 (Fig. 3J) with the
fluorescent sunitinib granules. Therefore, it was concluded that
sunitinib was sequestered in autophagosomes and lysosomes in these
cells.
Counterbalancing drug resistance by
inhibiting lysosomal function
The aforementioned results indicated that drug
resistance was associated with sunitinib sequestration in
lysosomes. It is reasonable to postulate that the blockage of
lysosomal sequestration would abolish drug resistance. Therefore,
the effect and the efficiency of two autophagy inhibitors, the
H+-ATPase inhibitor BAF, which blocks acidification of
lysosomes, and CQ, which suppresses the fusion of autophagosomes
with lysosomes, was investigated (32,33).
Fluorescence microscopy revealed that LAMP-1-labeled
lysosomes were not disorganized, but were conserved in BAF- and
CQ-treated cells (Fig. 4A and B).
However, in the BAF-treated cells, green sunitinib granules
disappeared, indicating the cessation of sunitinib sequestration in
the LC3-labeled autophagosomes and lysosomes (Fig. 4A and B). Notably, the green
sunitinib granules in CQ-treated cells had not disappeared or
diminished (Fig. 4A and B). This
observation was verified with lysosome tracers (Lyso-ER and
Lyso-NIR) and the results confirmed the presence of fluorescent
sunitinib granules in the CQ-treated HMEC-1 cells (Fig. 4C and D). These findings indicated
the dependence of suitinib sequestration on intra-lysosomal pH.
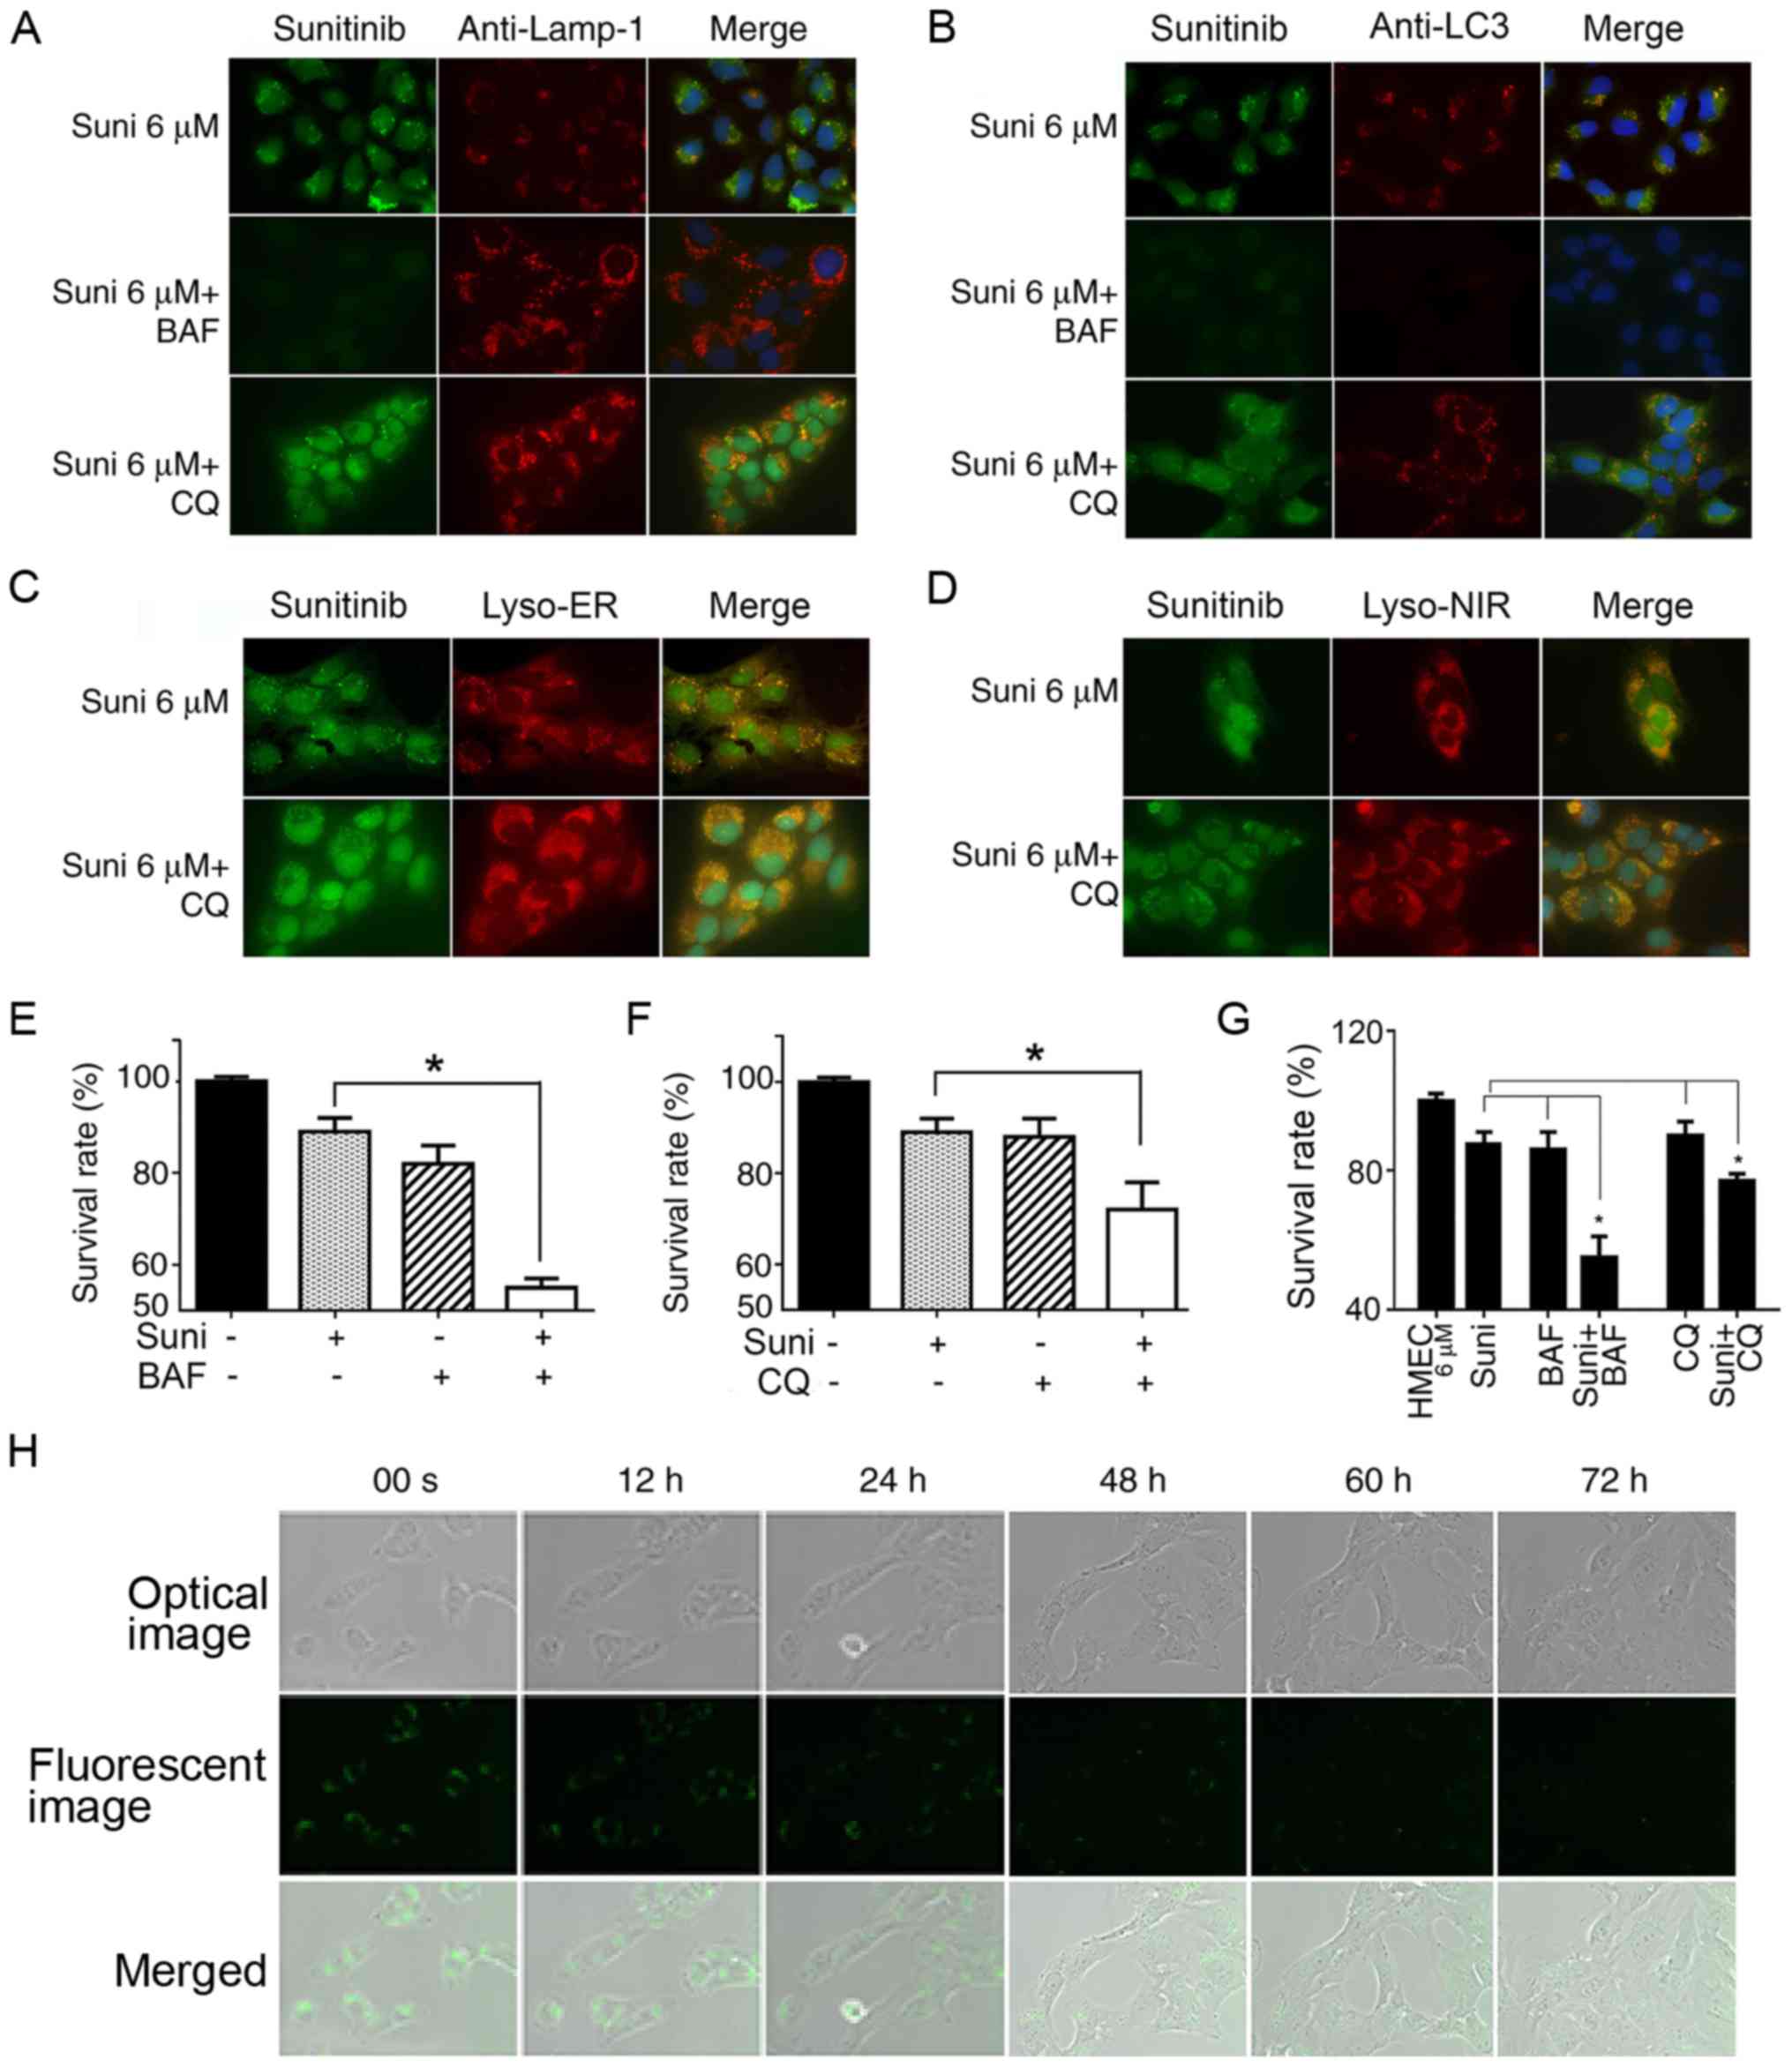 | Figure 4Reversal of resistance to sunitinib
in HMEC-1 cells by autophagy inhibitors. (A-D) HMEC-1 cells were
treated with 6 µM sunitinib for 24 h, either alone or in the
presence of 10 nM BAF or 20 µM CQ for 4 h. DAPI was added to
stain the nuclei. (A) Cells were then stained with anti-LAMP and
observed under fluorescence microscopy. (B) Treated and non-treated
HMEC-1 cells underwent anti-LC3 staining and were observed under
fluorescence microscopy. (C) Treated or non-treated HMEC-1 cells
underwent Lyso-ER staining for 30 min and were observed under
fluorescence microscopy. (D) Treated or non-treated HMEC-1 cells
underwent Lyso-NIR staining for 30 min and were (A-D)
Magnification, ×63. (E) Survival rates of HMEC-1 cells following
treatment with sunitinib with or without BAF. HMEC-1 cells were
incubated with or without 6 µM sunitinib or 10 nM BAF for 48
h. Cells were trypsinized and counted. *P<0.05. (F)
Survival rates for HMEC-1 cells following treatment with sunitinib
with or without CQ. HMEC-1 cells were incubated with or without 6
µM sunitinib or 20 µM CQ for 48 h. Cells were
trypsinized and counted. *P<0.05. (G) Survival rates
for HMEC6 µM cells
following treatment with sunitinib with or without BAF or CQ.
HMEC6 µM cells were
incubated with or without 6 µM sunitinib, 10 nM BAF or 20
µM CQ for 48 h. Cells were trypsinized and counted.
*P<0.05. The results in e, f and g are presented as
the mean ± SEM. (H) Steady decrease in sunitinib fluorescent
density in cell vesicles following the withdrawal of sunitinib from
culture media. HMEC6 µM
cells were washed and cultured in normal culture medium. The cells
were immediately placed into the culture chamber of a time-lapse
imaging system. After image zone selection, image recording usually
began after 15 min. The images were taken every 12 min and the
images at indicated time points are shown. The upper row shows
optic microscope images, the middle row shows green fluorescent
microscope images and the lower row shows merged photos
(magnification, ×40). BAF, bafilomycin A1; CQ, chloroquine; LAMP-1,
lysosomal-associated membrane protein 1; LC3,
microtubule-associated protein 1A/1B-light chain 3; Suni,
sunitinib. |
Cell resistance to sunitinib was evaluated following
the addition of BAF and CQ. The addition of BAF or CQ significantly
sensitized HMEC-1 cells to sunitinib and increased the toxic effect
of sunitinib (Fig. 4E and F;
P<0.05). The cytotoxicity experiments were repeated with
HMEC6 µM cells, which have
a higher resistance capacity. The results were similar; both
autophagy inhibitors significantly increased the sensitivity of
HMEC6 µM cells to sunitinib
(Fig. 4G). These findings
suggested that inhibition of lysosomal autophagy function
counterbalanced HMEC-1 cell resistance to sunitinib.
Reversible resistance to Sunitinib
To analyze the reversibility of this drug
resistance, HMEC6 µM cells
were cultured normally after the withdrawal of sunitinib from the
culture media, and their IC50 values were regularly
checked. It was revealed that the cells had regained their
sensitivity to sunitinib after 2 weeks of culture without
sunitinib, with an IC50 equivalent to normal HMEC-1
(data not shown). The video-recorded images with the time-lapse
imaging system coupled with fluorescence microscopy revealed that
the fluorescence density of sunitinib granules in recovered
HMEC6 µM cells had
decreased by approximately half in the first 12 h and continued to
recede. This indicated that once the extracellular concentration of
sunitinib had decreased, the efflux of sunitinib sequestered in
lysosomes began immediately. The decrease in fluorescence resulted
from both decreases in fluorescent vesicle volume and reduction in
the number of fluorescent vesicles (Fig. 4H).
Discussion
Our previous studies reported the induction of drug
resistance by doxorubicin and sunitinib in endothelial cells in
vitro and in vivo (1–3).
Previous studies have demonstrated lysosomal sequestration in renal
and colorectal cancer cells, which is an important mechanism
implicated in the development of sunitinib resistance (15,17).
These results prompted the study of sunitinib lysosomal
sequestration in endothelial HMEC-1 cells and its relationship with
multiple drug resistance.
Since sunitinib is an autofluorescent molecule in
culture medium, a time-lapse imaging system was used to monitor the
influx of 6 µM sunitinib into HMEC-1 cells. This
concentration was chosen because it was sufficient to induce drug
resistance and avoided highly injurious toxicity in long-term
culture. When viewing the video of time-lapse fluorescence
microscopy, an instant influx was systematically noted as sunitinib
was added to the culture medium. This suggests a very effective
diffusion of sunitinib across the cell membrane. A rapid emergence
of green fluorescent granules was detected a few minutes later,
particularly in the juxtanuclear zone where the lysosomes were
concentrated. The sharp contrast of the bright fluorescence of the
vesicles compared to that of the cytosol background strongly
indicated that drug accumulation in the vesicles was driven by an
active transport of sunitinib from the cytosol to the vesicles,
most probably by ABC family molecules highly expressed in
endothelial cells (1–3,18).
The video images also revealed that intracellular fluorescent
particles were in permanent movement, and they either rotated
around the nucleus or concentrated markedly at one cell pole. These
features were indeed significant for lysosomes because normal
cytosol acidification should cause dispersal of the perinuclear
lysosome population, whereas sunitinib-induced alkalinization could
return them to their central location (29,34).
The formation of autophagosomes and their fusion
with pre-existing lysosomes is a well-known natural process of
autophagic flux. Western blotting with anti-LAMP-1, anti-LC3 and
anti-p62 antibodies was used to evaluate autophagy activation. The
results revealed that sunitinib treatment for 24 h activated
autophagy, as determined by a significant increase in LC3-II/I
ratio and LAMP-1 expression, and a decrease in p62. Experiments
with HMEC6 µM cells
exhibited similar results, indicating that autophagy remained
active (30). These results may
explain the increase in size and numbers of green fluorescent
granules in the video following sunitinib treatment. Immunostaining
of sunitinib-treated HMEC-1 and HMEC6
µM cells with anti-LAMP-1 and anti-LC3
antibodies revealed colocalization of these two autophagy-lysosome
markers with sunitinib green fluorescence. In addition, the
staining of the cells with two fluorescent lysosome tracers,
Lyso-ER and Lyso-NIR, revealed colocalization with sunitinib green
fluorescence. Flow cytometry using LysoTracker DND-99 staining
indicated an expansion of vacuole compartments under sunitinib
treatment. These results confirmed that the vesicles in the
juxtanuclear zones enclosing sunitinib and isolating the drug from
the cytosol were indeed lysosomes/autophagosomes. However, further
work is required to clarify the mechanisms underlying
sunitinib-associated autophagic flux in endothelial cells.
This study also revealed that the development of
sunitinib resistance in HMEC-1 cells was dose- and time-dependent,
and resistance remained as long as the sunitinib was present in the
culture medium. HMEC-1 cells tolerated sunitinib well until the
concentration reached >12 µM. This implied that
therapeutic doses of sunitinib may not massively damage the
endothelium, because in vivo concentrations were estimated
to be <10 µM (6,19). The decrease in the proliferation
rate of HMEC-1 cells at low concentrations may be attributed to the
blockage of endothelial cell growth factor receptors; however, it
is also reasonable to suppose that the interruption of lysosome
hydrolytic activity by sunitinib-induced basification also affects
HMEC-1 metabolism and proliferation. This study evaluated the
effect of two autophagy inhibitors on sunitinib-induced drug
resistance. The results of fluorescence microscopy revealed that
the H+-ATPase inhibitor BAF halted sunitinib
sequestration, although the LAMP-1-positive lysosomal structure was
still intact. Another autophagy inhibitor, CQ, is known to inhibit
autophagosome-lysosome fusion and to induce an accumulation of
autophagosomes (33). The present
results demonstrated that CQ did not affect the sequestration of
sunitinib in lysosomes, which is consistent with a previous result
(33). Therefore, the difference
in the observed effect could be adequately explained by differences
in mechanism, in particular because sunitinib sequestration is
highly dependent on the H+-ATPase-associated acidic
environment, but much less dependent on the fusion of
autophagosomes with lysosomes. Likewise, although both inhibitors
suppressed cell resistance to sunitinib, BAF appeared more
efficient than CQ. These results are in agreement with other
reports using BAF and CQ in vitro (21-23,27).
Overall, these data support the notions that inhibition of
autophagic flux sensitizes cells to sunitinib and other drugs, and
that lysosomal drug sequestration is one of the important
underlying mechanisms (12–15,20–23,35).
Notably, the anti-autophagy mechanism of CQ has not yet been fully
understood, whereas its pharmaceutical potential has attracted much
attention because it affects tumor cells and endothelial cells
through complex mechanisms, including overcoming drug resistance
(27,35–37).
Finally, this study evaluated the reversibility of
HMEC6 µM resistance. The
results revealed that resistance gradually disappeared after
sunitinib had been removed from the culture media for ~2 weeks.
This is in line with the 3-day observations in the video, which
illustrate a slow decrease in sunitinib fluorescence during
culture.
Antiangiogenic sunitinib was designed to target
endothelial cells (4,38). Lysosomal sequestration of drugs,
and its associated toxicity and drug resistance in endothelial
cells, are of particular importance. Endothelial cells are exposed
to the highest peak levels of sunitinib (10 µM,
t1⁄2>40 h) following absorption by the digestive
system and its penetration into the blood circulation (6,19).
Therefore, the present results obtained with 6 µM sunitinib
are relevant for clinical dosage, and sunitinib lysosomal
sequestration can reasonably be supposed to occur in patients.
These results raised several clinically relevant questions. For
example, sunitinib neutralizes the acidic environment of lysosomes,
which can lead to the impairment or cessation of normal
intracellular metabolism, but at present little is known about the
significance of a defective lysosome system of this sort in a
clinical setting. Furthermore, the overall clinical interpretation
of lysosomal sequestration of sunitinib also appears complex. It
could be considered beneficial if it prevents the massive
destruction of the endothelium by reducing toxicity, or on the
contrary, it could be considered harmful if it reduces therapeutic
efficacy by causing drug resistance. Further study is potentially
required to clarify and understand this delicate balance, in order
to improve daily clinical practice by better management of the
dosage of sunitinib treatment, particularly in patients with
cardiovascular comorbidity (39,40).
Sequestration-associated drug resistance is not
restricted to sunitinib, as many drug compounds share similar
physico-chemical properties (12–14).
The present study indicated that the sensitizing effect of
H+-ATPase blockers, such as BAF, appears to be a more
attractive means for the development of novel drugs reversing
sunitinib resistance. It is clear that tumors are able to develop
drug resistance through adaptive mechanisms under chemotherapy. In
particular, the upregulation of ABC transporter molecules
simultaneously contributes to the development of drug resistance in
endothelial cells and tumor cells (1–3). The
blocking of ABCB1 and ATP binding cassette subfamily G member 2 by
elacridar has demonstrated therapeutic efficacy (23). Notably, each anticancer drug has
specific targets, specific physicochemical properties and distinct
mechanisms, although they are often used interchangeably in
clinical settings. Clinically, drug resistance is closely
associated with drug efficacy and drug toxicity (7,8,11,39).
In addition, there is growing interest in reviewing the role of
stromal cells, including in blood vessels, in the development of
resistance to anticancer drugs (9). The present study may be helpful in
providing a better understanding of the pharmacological mechanisms
of anticancer drugs, and may improve the clinical management of
drug resistance and toxicity during therapy.
Supplementary Data
Funding
This study was supported by the China Scholarship
Council. LH is supported by the Science and Technology Department
of Guizhou Province (grant nos. J-2015-2088 and
Qian-P-Ren-2017-5611), the Guiyang Municipal Science and Technology
Bureau (grant nos. 20141001-62 and Zhukehetong-2017-5-1) and the
National Natural Science Foundation of China (grant nos. 81660451,
31860325 and 31460312).
Availability of data and materials
The datasets used and/or analyzed during the
current study are available from the corresponding author on
reasonable request.
Authors' contributions
SW, LH, ZH, HoL and HeL designed the study. SW, RS,
MBC, PZ and CH participated in the experiments. MDB, AJ and GB
participated in the analysis of the data. SW, LH and HL prepared
the manuscript.
Ethics approval and consent to
participate
Not applicable.
Patient consent for publication
Not applicable.
Competing interests
The authors declare that they have no competing
interests.
Authors' information
Currently, RS works at the Department of Hematology
of Ruijin Hospital School of Medicine, Shanghai Jiao Tong
University. PZ works at North China University of Water Resources
and Electric Power. CH works at The First Affiliated Hospital of
Guizhou Medical University.
Acknowledgments
Not applicable.
Abbreviations:
|
CQ
|
chloroquine
|
|
BAF
|
bafilomycin A1
|
|
LAMP-1
|
lysosomal-associated membrane protein
1
|
|
LC3
|
microtubule-associated protein
1A/1B-light chain 3
|
|
SQSTM1
|
sequestosome 1
|
References
|
1
|
Huang L, Perrault C, Coelho-Martins J, Hu
C, Dulong C, Varna M, Liu J, Jin J, Soria C, Cazin L, et al:
Induction of acquired drug resistance in endothelial cells and its
involvement in anticancer therapy. J Hematol Oncol. 6:492013.
View Article : Google Scholar : PubMed/NCBI
|
|
2
|
Huang L, Hu C, Di Benedetto M, Varin R,
Liu J, Wang L, Vannier JP, Jin J, Janin A, Lu H and Li H: Induction
of multiple drug resistance in HMEC-1 endothelial cells after
long-term exposure to sunitinib. Onco Targets Ther. 7:2249–2255.
2014.
|
|
3
|
Huang L, Hu C, Di Benedetto M, Varin R,
Liu J, Jin J, Wang L, Vannier JP, Janin A, Lu H and Li H:
Cross-drug resistance to sunitinib induced by doxorubicin in
endothelial cells. Oncol Lett. 9:1287–1292. 2015. View Article : Google Scholar : PubMed/NCBI
|
|
4
|
Naito H, Wakabayashi T, Kidoya H,
Muramatsu F, Takara K, Eino D, Yamane K, Iba T and Takakura N:
Endothelial side population cells contribute to tumor angiogenesis
and antiangiogenic drug resistance. Cancer Res. 76:3200–3210. 2016.
View Article : Google Scholar : PubMed/NCBI
|
|
5
|
Weis SM and Cheresh DA: Tumor
angiogenesis: Molecular pathways and therapeutic targets. Nat Med.
17:1359–1370. 2011. View Article : Google Scholar : PubMed/NCBI
|
|
6
|
Mendel DB, Laird AD, Xin X, Louie SG,
Christensen JG, Li G, Schreck RE, Abrams TJ, Ngai TJ, Lee LB, et
al: In vivo antitumor activity of SU11248, a novel tyrosine kinase
inhibitor targeting vascular endothelial growth factor and
platelet-derived growth factor receptors: Determination of a
pharmacokinetic/pharmaco-dynamic relationship. Clin Cancer Res.
9:327–337. 2003.PubMed/NCBI
|
|
7
|
Jayson GC, Kerbel R, Ellis LM and Harris
AL: Antiangiogenic therapy in oncology: Current status and future
directions. Lancet. 388:518–529. 2016. View Article : Google Scholar : PubMed/NCBI
|
|
8
|
Housman G, Byler S, Heerboth S, Lapinska
K, Longacre M, Snyder N and Sarkar S: Drug resistance in cancer: An
overview. Cancers (Basel). 6:1769–1792. 2014. View Article : Google Scholar
|
|
9
|
Huijbers EJ, van Beijnum JR, Thijssen VL,
Sabrkhany S, Nowak-Sliwinska P and Griffioen AW: Role of the tumor
stroma in resistance to anti-angiogenic therapy. Drug Resist Updat.
25:26–37. 2016. View Article : Google Scholar : PubMed/NCBI
|
|
10
|
Gu Y, Lu H, Boisson-Vidal C, Li H,
Bousquet G, Janin A and Di Benedetto M: Resistance to
anti-angiogenic therapy: A clinical and scientific current issue.
Med Sci (Paris). 32:370–377. 2016.In French. View Article : Google Scholar
|
|
11
|
Nunes T, Hamdan D, Leboeuf C, El
Bouchtaoui M, Gapihan G, Nguyen TT, Meles S, Angeli E, Ratajczak P,
Lu H, et al: Targeting cancer stem cells to overcome
chemoresistance. Int J Mol Sci. 19:E40362018. View Article : Google Scholar : PubMed/NCBI
|
|
12
|
MacIntyre AC and Cutler DJ: The potential
role of lysosomes in tissue distribution of weak bases. Biopharm
Drug Dispos. 9:513–526. 1988. View Article : Google Scholar : PubMed/NCBI
|
|
13
|
Duvvuri M and Krise JP: Intracellular drug
sequestration events associated with the emergence of multidrug
resistance: A mechanistic review. Front Biosci. 10:1499–1509. 2005.
View Article : Google Scholar : PubMed/NCBI
|
|
14
|
Kazmi F, Hensley T, Pope C, Funk RS,
Loewen GJ, Buckley DB and Parkinson A: Lysosomal sequestration
(trapping) of lipophilic amine (cationic amphiphilic) drugs in
immortalized human hepatocytes (Fa2N-4 cells). Drug Metab Dispos.
41:897–905. 2013. View Article : Google Scholar : PubMed/NCBI
|
|
15
|
Gotink KJ, Broxterman HJ, Labots M, de
Haas RR, Dekker H, Honeywell RJ, Rudek MA, Beerepoot LV, Musters
RJ, Jansen G, et al: Lysosomal sequestration of sunitinib: A novel
mechanism of drug resistance. Clin Cancer Res. 17:7337–7346. 2011.
View Article : Google Scholar : PubMed/NCBI
|
|
16
|
Yamagishi T, Sahni S, Sharp DM, Arvind A,
Jansson PJ and Richardson DR: P-glycoprotein mediates drug
resistance via a novel mechanism involving lysosomal sequestration.
J Biol Chem. 288:31761–31771. 2013. View Article : Google Scholar : PubMed/NCBI
|
|
17
|
Zhitomirsky B and Assaraf YG: Lysosomal
sequestration of hydrophobic weak base chemotherapeutics triggers
lysosomal biogenesis and lysosome-dependent cancer multidrug
resistance. Oncotarget. 6:1143–1156. 2015. View Article : Google Scholar :
|
|
18
|
Chapuy B, Koch R, Radunski U, Corsham S,
Cheong N, Inagaki N, Ban N, Wenzel D, Reinhardt D, Zapf A, et al:
Intracellular ABC transporter A3 confers multidrug resistance in
leukemia cells by lysosomal drug sequestration. Leukemia.
22:1576–1586. 2008. View Article : Google Scholar : PubMed/NCBI
|
|
19
|
Gotink KJ, Broxterman HJ, Honeywell RJ,
Dekker H, de Haas RR, Miles KM, Adelaiye R, Griffioen AW, Peters
GJ, Pili R and Verheul HM: Acquired tumor cell resistance to
sunitinib causes resistance in a HT-29 human colon cancer xenograft
mouse model without affecting sunitinib biodistribution or the
tumor microvasculature. Oncoscience. 1:844–853. 2014. View Article : Google Scholar
|
|
20
|
Santoni M, Amantini C, Morelli MB,
Liberati S, Farfariello V, Nabissi M, Bonfili L, Eleuteri AM,
Mozzicafreddo M, Burattini L, et al: Pazopanib and sunitinib
trigger autophagic and non-autophagic death of bladder tumour
cells. Br J Cancer. 109:1040–1050. 2013. View Article : Google Scholar : PubMed/NCBI
|
|
21
|
Ikeda T, Ishii KA, Saito Y, Miura M,
Otagiri A, Kawakami Y, Shimano H, Hara H and Takekoshi K:
Inhibition of autophagy enhances sunitinib-induced cytotoxicity in
rat pheochromocytoma PC12 cells. J Pharmacol Sci. 121:67–73. 2013.
View Article : Google Scholar
|
|
22
|
Abdel-Aziz AK, Shouman S, El-Demerdash E,
Elgendy M and Abdel-Naim AB: Chloroquine synergizes sunitinib
cytotoxicity via modulating autophagic, apoptotic and angiogenic
machineries. Chem Biol Interact. 217:28–40. 2014. View Article : Google Scholar : PubMed/NCBI
|
|
23
|
Giuliano S, Cormerais Y, Dufies M, Grépin
R, Colosetti P, Belaid A, Parola J, Martin A, Lacas-Gervais S,
Mazure NM, et al: Resistance to sunitinib in renal clear cell
carcinoma results from sequestration in lysosomes and inhibition of
the autophagic flux. Autophagy. 11:1891–1904. 2015. View Article : Google Scholar : PubMed/NCBI
|
|
24
|
Maiuri MC, Zalckvar E, Kimchi A and
Kroemer G: Self-eating and self-killing: Crosstalk between
autophagy and apoptosis. Nat Rev Mol Cell Biol. 8:741–752. 2007.
View Article : Google Scholar : PubMed/NCBI
|
|
25
|
Turco E and Martens S: Insights into
autophagosome biogenesis from in vitro reconstitutions. J Struct
Biol. 196:29–36. 2016. View Article : Google Scholar : PubMed/NCBI
|
|
26
|
Antonioli M, Di Rienzo M, Piacentini M and
Fimia GM: Emerging mechanisms in initiating and terminating
autophagy. Trends Biochem Sci. 42:28–41. 2017. View Article : Google Scholar
|
|
27
|
Rubinsztein DC, Codogno P and Levine B:
Autophagy modulation as a potential therapeutic target for diverse
diseases. Nat Rev Drug Discov. 11:709–730. 2012. View Article : Google Scholar : PubMed/NCBI
|
|
28
|
Yoshida GJ: Therapeutic strategies of drug
repositioning targeting autophagy to induce cancer cell death: From
pathophysiology to treatment. J Hematol Oncol. 10:672017.
View Article : Google Scholar : PubMed/NCBI
|
|
29
|
Pu J, Guardia CM, Keren-Kaplan T and
Bonifacino JS: Mechanisms and functions of lysosome positioning. J
Cell Sci. 129:4329–4339. 2016. View Article : Google Scholar : PubMed/NCBI
|
|
30
|
Yoshii SR and Mizushima N: Monitoring and
measuring autophagy. Int J Mol Sci. 18:E18652017. View Article : Google Scholar : PubMed/NCBI
|
|
31
|
Eskelinen EL: Roles of LAMP-1 and LAMP-2
in lysosome biogenesis and autophagy. Mol Aspects Med. 27:495–502.
2006. View Article : Google Scholar : PubMed/NCBI
|
|
32
|
Gagliardi S, Rees M and Farina C:
Chemistry and structure activity relationships of bafilomycin A1, a
potent and selective inhibitor of the vacuolar H+-ATPase. Curr Med
Chem. 6:1197–1212. 1999.PubMed/NCBI
|
|
33
|
Mauthe M, Orhon I, Rocchi C, Zhou X, Luhr
M, Hijlkema KJ, Coppes RP, Engedal N, Mari M and Reggiori F:
Chloroquine inhibits autophagic flux by decreasing
autophagosome-lysosome fusion. Autophagy. 14:1435–1455. 2018.
View Article : Google Scholar : PubMed/NCBI
|
|
34
|
Heuser J: Changes in lysosome shape and
distribution correlated with changes in cytoplasmic pH. J Cell
Biol. 108:855–864. 1989. View Article : Google Scholar : PubMed/NCBI
|
|
35
|
Galluzzi L, Baehrecke EH, Ballabio A, Boya
P, Bravo-San Pedro JM, Cecconi F, Choi AM, Chu CT, Codogno P,
Colombo MI, et al: Molecular definitions of autophagy and related
processes. EMBO J. 36:1811–1836. 2017. View Article : Google Scholar : PubMed/NCBI
|
|
36
|
Maes H, Rubio N, Garg AD and Agostinis P:
Autophagy: Shaping the tumor microenvironment and therapeutic
response. Trends Mol Med. 19:428–446. 2013. View Article : Google Scholar : PubMed/NCBI
|
|
37
|
Maes H, Kuchnio A, Peric A, Moens S, Nys
K, De Bock K, Quaegebeur A, Schoors S, Georgiadou M, Wouters J, et
al: Tumor vessel normalization by chloroquine independent of
autophagy. Cancer Cell. 26:190–206. 2014. View Article : Google Scholar : PubMed/NCBI
|
|
38
|
Huang D, Ding Y, Li Y, Luo WM, Zhang ZF,
Snider J, Vandenbeldt K, Qian CN and Teh BT: Sunitinib acts
primarily on tumor endothelium rather than tumor cells to inhibit
the growth of renal cell carcinoma. Cancer Res. 70:1053–1062. 2010.
View Article : Google Scholar : PubMed/NCBI
|
|
39
|
Moslehi JJ: Cardiovascular toxic effects
of targeted cancer therapies. N Engl J Med. 375:1457–1467. 2016.
View Article : Google Scholar : PubMed/NCBI
|
|
40
|
Bretagne M, Boudou-Rouquette P, Huillard
O, Thomas-Schoemann A, Chahwakilian A, Orvoen G, Arrondeau J,
Tlemsani C, Cessot A, Cabanes L, et al: Tyrosine kinase inhibiting
the VEGF pathway and elderly people: Tolerance, pre-treatment
assessment and side effects management. Bull Cancer. 103:259–272.
2016.In French. View Article : Google Scholar : PubMed/NCBI
|