Introduction
Chronic myeloid leukemia (CML) is a clonal
myeloproliferative disease characterized by reciprocal
translocation between chromosomes 9 and 22, t(9;22). This
translocation results in the formation of the Philadelphia (Ph)
chromosome, which encodes the fusion BCR-ABL1 oncogene coding a
constitutively active Bcr-Abl tyrosine kinase (1-3). The
approval of the Bcr-Abl inhibitor, imatinib (Glivec®)
for clinical use in 2001 led to a significant improvement in the
survival rate and prognosis of patients with CML (4). However, 10-15% of patients develop
resistance to imatinib or to new-generation Bcr-Abl inhibitors
(5). The resistance to TKIs is
primarily caused by point mutations in the Bcr-Abl kinase domain,
although other mechanisms that have been proposed include
amplification of the BCR-ABL1 gene, overexpression of the Bcr-Abl
protein or the presence of additional chromosomal aberrations and
mutations (5-8).
An increasing number of studies have suggested that
drug resistance in cancer, including leukemia, could be mediated by
exosomes (9,10). Exosomes are small (30-150 nm)
extracellular membrane vesicles, that are released by cells into
the microenvironment upon fusion of multivesicular bodies with the
plasma membrane (11). Exosomes
contain proteins, lipids, mRNA, microRNAs (miRNAs) and DNA
(12,13) and may fuse with other cells
(14). They affect numerous
physiological and pathological processes, including cancer
(15). Exosomes derived from CML
cells have been shown to modulate leukemia progression either
directly via stimulation of leukemia cells (16), or indirectly through stimulation of
other cells involved in leukemia biology, such as macrophages, bone
marrow stromal cells and endothelial cells (17-21).
Notably, exosomes derived from imatinib-resistant CML cells have
recently been shown to fuse with imatinib-sensitive CML cells,
thereby increasing their survival in the presence of imatinib
(22).
The aims of the present study were: i) To confirm
the previously observed pro-survival effect of exosomes derived
from imatinib-resistant K562 cells (K562IR); ii) to
characterize the protein cargo of the exosomes; and iii) to
identify potential specific cell surface markers of imatinib
resistance in CML cells.
Materials and methods
Materials
All chemicals, unless otherwise stated, were
purchased from Merck KGaA.
Cell lines
The human K562 chronic myeloid leukemia cell line
was purchased from the German Collection of Microorganisms and Cell
Cultures, GmbH and cultured in RPMI medium (Thermo Fisher
Scientific, Inc.) supplemented with 10% fetal bovine serum (FBS;
Gibco; Thermo Fisher Scientific, Inc.), 100 U/ml penicillin G, 100
µg/ml streptomycin and 7.5% sodium bicarbonate at 37°C in an
humidified incubator with 5% CO2. The K562IR
cells were derived from original imatinib-sensitive K562 cells,
that had been cultured in gradually increasing concentrations of
imatinib in the culture medium (from 0.1 to 2 µM) for 9
months, as previously described (23). The concentration of imatinib was
increased by 0.1 µM at each step and was maintained for
15-30 days, depending on the proportion of surviving cells. The
resulting K562IR cell line was resistant to 2 µM
imatinib.
Cell viability assay
The K562 and K562IR cell lines were
cultured in the presence of different concentrations (0 to 2
µM) of imatinib for 3 days. Imatinib toxicity was determined
by measuring cell viability using a Vybrant™ MTT cell proliferation
assay kit (Thermo Fisher Scientific, Inc.), following the
manufacturer's instructions. Proprietary solvent B containing SDS
(from the kit) diluted with 0.01 M HCl was used to solubilize the
purple formazan. Absorbance was detected at 570 nm using a
microplate reader (Chameleon; Hidex Oy). Data was analyzed using
MikroWin 2000 software, v4.0 (Mikrotek Laborsysteme GmbH).
Mutational analysis
The K562 and K562IR cell lines were
analyzed using a next-generation sequencing (NGS) method, as
previously described (24).
Briefly, the amplicon library was prepared using a two-step
selective amplification of cDNA, including the BCR-ABL1 kinase
domain. At the first step, BCR-ABL1 cDNA was amplified, then
primers, from the IRON II study (25), were used to prepare four 350 bp
amplicons of the kinase domain. Sequencing was subsequently
performed on a GS Junior 454 System, and the data was analyzed
using the Amplicon Variant Analyzer software (both from Roche
Diagnostics). The raw NGS data are freely available via NCBI
Sequence Read Archive (https://www.ncbi.nlm.nih.gov/sra) under the project
accession number, PRJNA664680, while the imatinib sensitive K562
and the imatinib resistant K562 cells have the accession numbers,
SRX9210642 and SRX9210641, respectively.
BCR-ABL1 gene copy number analysis
The number of BCR-ABL1 gene copies was determined
using the quantitative droplet digital PCR (ddPCR) method and a
K562 specific assay based on the break-point sequence of the
BCR-ABL1 gene (26). ddPCR was
performed using a QX200 Droplet Digital PCR system and an Auto
Droplet Generator (Bio-Rad Laboratories, Inc.) according to the
manufacturer's instructions. The albumin gene was used as a control
for the DNA reaction load. QuantaSoft™ v1.7.4.0917 software
(Bio-Rad Laboratories, Inc.) was used for data analysis, and
samples were analyzed in quadruplicate.
Measurement of BCR-ABL1 transcript
levels
Total RNA was isolated from cells using
TRIzol® (Thermo Fisher Scientific, Inc.) according to
the manufacturer's instructions. cDNA was synthesized using 200 U
M-MLV reverse transcriptase (Promega Corporation) and random
hexamer primers (Jena Bioscience GmbH) according to the
manufacturer's instructions, with incubation at 37°C for 1 h and
denaturation at 95°C for 5 min. β-Glucuronidase (GUSB) was used as
the control gene (27,28). The primers and probes for BCR-ABL1
and GUSB were designed, and the measurement of the expression
levels were performed, according to the Europe Against Cancer
protocol (29). The method has
been standardized in the project of European Leukemia Net (30). The following primers and probes
were used: GUSB forward, 5′-GAA AAT ATG TGG TTG GAG AGC TCA TT-3,
reverse 5-CCG AGT GAA GAT CCC CTT TTT A-3 and
fluorescein-containing probe, 5′-FAM-CCA GCA CTC TCG TCG GTG ACT
GTT CA-BHQ1-3′; BCR-ABL1 forward, 5′-TCC GCT GAC CAT CAA TAA
GGA-3′, reverse 5′-CAC TCA GAC CCT GAG GCT CAA-3′
fluorescein-containing probe, 5′-FAM-CCC TTC AGC GGC CAG TAG CAT
CTG A-BHQ1-3′ (Integrated DNA Technologies, Inc.). The following
thermocycling conditions were used: Initial denaturation at 95°C
for 10 min and 45 cycles of 95°C for 15 sec and 60°C for 1 min. For
RT-qPCR gene expression analysis, the ERM-AD623 reference material
(Join Research Centre, Belgium) (31,32)
was used to create the calibration curve for the determination of
the number of copies of BCR-ABL1 and GUS gene.
Exosome isolation
The K562 and K562IR cell lines were
cultured for 5 days in RPMI medium with 10% exosome-depleted FBS.
Exosomes were isolated from 200 ml cell culture media, as
previously described (33).
Briefly, conditioned medium was obtained as the supernatant from
the centrifugation of live cells (300 × g for 10 min at 4°C).
Subsequently, dead cells were removed using a further round of
centrifugation (2,000 × g for 10 min at 4°C). The supernatant was
filtered [using a Filtropur S syringe filter (0.22-µm
membrane); Sarstedt AG & Co. KG] to remove larger vesicles and
cell debris. The resultant suspension was then ultracentrifuged
(100,000 × g for 70 min at 4°C) using a Sorvall™ WX+
ultracentrifuge and a T647.5 fixed angle rotor (Thermo Fischer
Scientific, Inc.). Exosome pellets were resuspended in PBS, and
sedimented again (100,000 × g for 70 min at 4°C).
Exosome visualization using transmission
electron micros- copy/negative staining
Isolated exosomes were resuspended in Trump's 4F:1G
fixative, comprising 86 ml distilled water, 10 ml 40% formaldehyde
(Merck KGaA), 4 ml 25% glutaraldehyde (Polysciences, Inc.), 1.16 g
monosodium phosphate and 0.27 g sodium hydroxide (34), and adsorbed on Formvar/carbon
coated grids conditioned with 1% Alcian blue in 1% acetic acid. The
adsorbed particles were embedded in a layer of 2% phosphotungstic
acid. Grids were viewed at 100 kV using a JEM 2000 CX microscope
(JEOL, Ltd.) equipped with an Olympus MegaviewTM II digital camera
(Olympus Corporation).
Particle size and concentration
measurement using tunable-resistive pulse sensing (TRPS)
An aliquot of exosomes resuspended in PBS was placed
in the nanopore NP150 (qNano; Izon Science). All samples were
measured at defined membrane stretch and with the same applied
voltage at two different pressure levels (5 and 11 mbar).
Calibration particles were measured directly after the sample
measurement, and under identical conditions.
Exosome preparation for tandem mass
spectrometry (MS/MS) analysis
A total of 5 independent isolations of exosomes,
from both the K562 and K562IR cell lines, were subjected
to MS/MS analysis. The filter-aided sample preparation method was
used, with some modifications (35). Exosomes in PBS were resuspended in
100 mM ammonium bicarbonate, transferred to spin columns (Amicon
Ultra 0.5 ml 10 kDa MWCO centrifugal filters; Merck KGaA) and
centrifuged at 26,000 × g for 20 min at 4°C. The samples were then
washed twice with 400 µl 100 mM ammonium bicarbonate and
centrifuged again (26,000 × g for 20 min at 4°C). RapiGest™ (0.1%;
Waters Corporation) dissolved in 100 µl 50 mM Tris/HCl, (pH
7.5) was subsequently added to the samples in the spin columns,
then the samples were incubated at 95°C 10 min. After allowing the
samples to cool down, 200 µl 0.1% RapiGest™ in 50 mM
Tris/HCl, (pH 7.5) with 8 M guanidinium chloride was added, and the
samples were subsequently incubated for 20 min at room temperature.
The samples were then centrifuged at 18,000 × g for 25 min at 25°C.
Aliquots of the samples (10 µl) were taken, and the protein
concentration was quantified using a QuantiPro™ BCA Assay kit
(Sigma-Aldrich; Merck KGaA). Subsequently, the samples were reduced
with 100 µl 100 mM (Tris)2-carboxyethyl phosphine
hydrochloride for 30 min at 55°C in a thermoshaker (Biosan, Ltd.)
set at 600 rpm, alkyl-ated with 100 µl 300 mM iodoacetamide
at 37°C for 30 min in the dark, then centrifuged at 12,000 × g for
35 min at 25°C. Next, the samples were digested overnight at 37°C
using 2 µg sequencing-grade trypsin (Promega Corporation).
The digested samples were then transferred into a new microtube for
subsequent centrifugation (12,000 × g for 35 min at room
temperature). Empore™ Solid Phase Extraction cartridges (C18;
standard density, bed I.D., 4 mm) (3M Company) were used to desalt
the peptide mixtures. Peptides were eluted in 60% acetonitrile
(ACN)/0.1% trifluoroacetic acid (TFA), then dried in a SpeedVac.
Prior to MS analysis, the samples were resuspended in 30 µl
2% ACN/0.1% TFA.
Liquid chromatography (LC) MS/MS
(LC-MS/MS)
LC-MS/MS analysis
An UltiMate™ 3000 RSLCnano system controlled by
Chromeleon software (Dionex; Thermo Fisher Scientific, Inc.) was
used for LC separation. Aliquots (1 µl) of each sample (10X
diluted) were loaded onto a PepMap100 C18, 3 µm, 100 Å,
0.075×20 mm trap column (Dionex; Thermo Fisher Scientific, Inc.) at
5 µl/min for 5 min. Peptides were then separated on a PepMap
RSLC C18, 2 µm, 100 Å, 0.075×150 mm analytical column
(Dionex; Thermo Fisher Scientific, Inc.) using a gradient formed by
the mobile phase A [0.1% formic acid (FA)] and mobile phase B (80%
ACN/0.1% FA), running from 4-34% in 68 min, and from 34-55% of
mobile phase B in 21 min, at a flow rate of 0.3 µl/min at
40°C. Eluted peptides were on-line electrosprayed into a
Q-Exactive™ mass spectrometer using a Nanospray Flex ion source
(Thermo Fisher Scientific, Inc.). Positive ion full-scan MS spectra
(350-1,650 m/z) were acquired using a 1×10⁶ automatic
gain control (AGC) target in the Orbitrap at 70,000 resolution. The
top 12 precursors with charge state ≥2 and threshold intensity of
5×10⁴ counts were selected for higher-energy collisional
dissociation fragmentation, with a dynamic exclusion window of 30
sec. The isolation window of 1.6 Da and normalized collision energy
27% was used. Each MS/MS spectrum was acquired at a resolution of
17,500, with a 1×10⁵ AGC target and a maximum 100 msec
injection time.
Label-free quantification (LFQ): Raw data
processing
The raw files were further analyzed using MaxQuant
software, v1.5.3.30 (36) [with
Andromeda as the search engine (37)] against the Homo sapiens
subset of the SwissProt database (downloaded on 4th July 2019;
26,468 sequences). Only tryptic peptides, that were at least 7
amino acids in length, with up to two missed cleavages were
considered. Mass tolerance was set to 4.5 ppm at the MS level, and
0.5 Da at the MS/MS level. The oxidation of methionine was set as a
variable modification, and the carbamidomethylation of cysteine was
set as a fixed modification. A false discovery rate (FDR) of 1% was
used for peptide spectrum matches and protein identification using
a target decoy approach. Relative quantification was performed
using the default parameters of the MaxLFQ algorithm (38), with the minimum ratio count set to
2.
LFQ: Data analysis
The 'proteinGroups.txt' MaxQuant output file was
uploaded into Perseus (39)
v1.5.2.6. Decoy hits, proteins only identified by site, and
potential contaminants were removed. Protein groups quantified in
at least four replicates out of five were considered for further
log2 transformation of the LFQ intensities. Missing
values were imputed from a normal distribution [Gaussian
distribution width, 0.3 standard deviation (SD) and downshift 1.8
SD of the original data]. Data was normalized using the open source
tool, Normalyzer (http://quantitativeproteomics.org/normalyzerde) and
the variance stabilization normalization method (40). A Student's t-test (permutation
based FDR 0.05, S0=0.1) was used for statistical analysis. Finally,
proteins from this group with a fold change at least 1.5 were
considered as being significantly different (P<0.05). Pearson's
correlation test was performed to evaluate the inter-run
reproducibility of individual LC-MS analyses. Proteins with known
or expected cell-surface localization were selected using
GenieScore, an algorithm for the prediction of surface localization
(41). The Exocarta database
(www.exocarta.org) was used to compare the
proteins identified with those already found in exosomes.
Western blot analysis
The exosome pellets were lysed in 150 µl
lysis buffer containing 140 mM sodium chloride, 10 mM HEPES, 0.15%
Triton X100 and a protease inhibitor cocktail (1 tablet/10 ml;
Roche Diagnostics), and subsequently incubated on ice for 20 min.
The exosome samples were pooled and concentrated in an Amicon Ultra
0.5 ml 3 kDa MWCO centrifugal filter (Amicon Ultra; Merck KGaA)
from 3 or 4 individual isolations. The protein concentration was
determined using a Micro BCA™ protein assay kit (Pierce; Thermo
Fisher Scientific, Inc.) according to the manufacturer's
instructions, and protein samples were immediately frozen and
stored at −80°C.
The cell pellets were lysed in CelLytic™ M lysis
buffer containing protease inhibitor cocktail (1 tablet/10 ml;
Roche Diagnostics) on ice for 20 min. The cleared cell lysates were
collected by centrifugation at 15,000 × g for 20 min at 4°C, and
the protein concentration was then determined using the Bradford
method (Bio-Rad Laboratories, Inc.).
The lysate samples (30-60 µg) were mixed with
Laemmli sample buffer (Bio-Rad Laboratories, Inc.) containing
2-mercaptoethanol and separated on 4-15% or 7.5% (in the case of
Bcr-Abl separation) precast gels (Mini PROTEAN® TGX™;
Bio-Rad Laboratories, Inc.). The separated proteins were
transferred onto polyvinylidene fluoride membranes using the iBlot
system, according to manufacturer's instructions (Thermo Fisher
Scientific, Inc.). The membranes were blocked for 1 h in
SuperBlock™ blocking buffer (Thermo Fisher Scientific, Inc.) and
incubated overnight at 4°C with primary antibodies diluted to
1:1,000 in PBST (PBS, 0.1% Tween-20). The following primary
antibodies were used: Anti-c-Abl rabbit polyclonal antibody (cat.
no. 2862S; Cell Signaling Technology, Inc.), anti-Bcr-Abl mouse
monoclonal antibody (7C6) (cat. no. ab187831; Abcam), anti-GAPDH
rabbit monoclonal antibody (cat. no. SAB5600208; Merck KGaA),
anti-IFITM3 (cat. no. 59212; Cell Signaling Technology, Inc.),
anti-CD146 mouse monoclonal antibody (cat. no. 563619; BD
Biosciences), anti-CD36 rabbit monoclonal antibody (cat no. 14347S;
Cell Signaling Technology, Inc.) and EXOAB antibody kit 1 (Systems
Biosciences, LLC) containing rabbit polyclonal antibodies against
CD63, CD81, anti-CD9 and HSP70. After extensive washing in PBST,
the membranes were incubated with secondary horseradish
peroxidase-conjugated anti-rabbit antibody (cat. no. 7074P2) or
anti-mouse antibody (cat. no. 7076P2) (both at 1:20,000 and from
Cell Signaling Technology, Inc.) for 90 min at room temperature.
Protein bands were detected with an enhanced chemiluminescence
detection reagent (Cytiva) using a G:BOX imager (Syngene Europe),
and quantified using ImageJ software, v1.8.0 (National Institutes
of Health).
Exosome fluorescent labeling and uptake
monitoring
Fresh exosomes were washed and resuspended in PBS at
room temperature. A 10 mM stock solution of carboxyfluorescein
succinimidyl ester (CFSE) (Invitrogen; Thermo Fisher Scientific,
Inc.) was diluted to a final concentration of 20 µM and
added to the exosomes. The suspension was subsequently mixed and
incubated for 25-30 min at room temperature in the dark. The
labeling process was stopped by adding 4 ml of cold complete media,
containing 10% FBS on ice for 5 min. CFSE-labeled exosomes were
diluted in 60 ml PBS, collected by ultracentrifugation (100,000 × g
for 70 min at 4°C) and resuspended in 1.5 ml cell culture media
with K562 cells (500,000 cells/ml). CFSE-positive cells were
observed under a FluoView FV1000 confocal laser scanning microscope
(Olympus Corporation) using an UPlanSAPO 60× NA1.35 oil immersion
objective (magnification, ×60). A 488 nm laser was used for CFSE
excitation, and fluorescence emission was detected with a high
sensitivity GaAsP detector at 500-600 nm. Fluorescent images were
processed using the FluoView software|(FV10 ASW v3.1; Olympus
Corporation).
Exosomes and cell co-cultivation
The K562 cells were co-cultured with either
K562IR-derived or K562-derived exosomes for 4 h, and
then treated with 2 µM imatinib for 48 h. Cell viability was
measured using a Vybrant® Cell Proliferation Assay kit
(Thermo Fisher Scientific, Inc.); proprietary solvent B containing
SDS was mixed with 0.01 M HCl and used to solubilize the purple
formazan. The absorbance was measured at 570 nm using a microplate
reader (Chameleon; Hidex Oy).
FACS analysis
The K562 and K562IR cells
(1.5×10⁶ cells) were washed in washing buffer (PBS
supplemented with 0.1% BSA and 2 mM EDTA), centrifuged at 300 × g
for 10 min at room temperature, then resuspended in washing buffer.
Aliquots (50 µl) of the cell suspension (100,000 cells/tube)
were transferred to FACS tubes and 1 µl anti-IFITM3 AF405
(cat. no. ITA8095; 1:50; G-Biosciences; Geno Technology, Inc.), 1
µl anti-CD146 (cat. no. 563619; 1:50; BD Biosciences) and 2
µl anti-Hu CD36 FITC (cat. no. 1F-451-T100; 1:25; EXBIO
Praha, a.s.) were added. The samples were incubated in the dark for
30 min at room temperature, then washed again with 1 ml of washing
buffer, prior to centrifugation (300 × g for 5 min at 25°C).
Washing buffer (250 µl) was added to the cell pellet, and
the samples were analyzed using flow cytometry, in triplicate,
using BD FACSCanto™ II Cell Analyzer (BD Biosciences). The data was
analyzed using BD FACSDiva software (v6.1.3; BD Biosciences). MFI
was determined for the whole sample, and the fraction of positively
stained cells (P2) was determined as the percentage of the parent
population.
Statistical analysis
The data are expressed as the mean ± SD, from at
least three replicates. Statistical analysis was performed using
GraphPad Prism v8.0 software (GraphPad Software, Inc.). Relative
resistance of K562 and K562IR cells to imatinib was
evaluated using an unpaired Student's t-test. For the investigation
of cell survival following exosome exposure, one-way ANOVA with
Tukey's post hoc test was used to determine the statistical
significance. P<0.05 was considered to indicate a statistically
significant difference.
Results
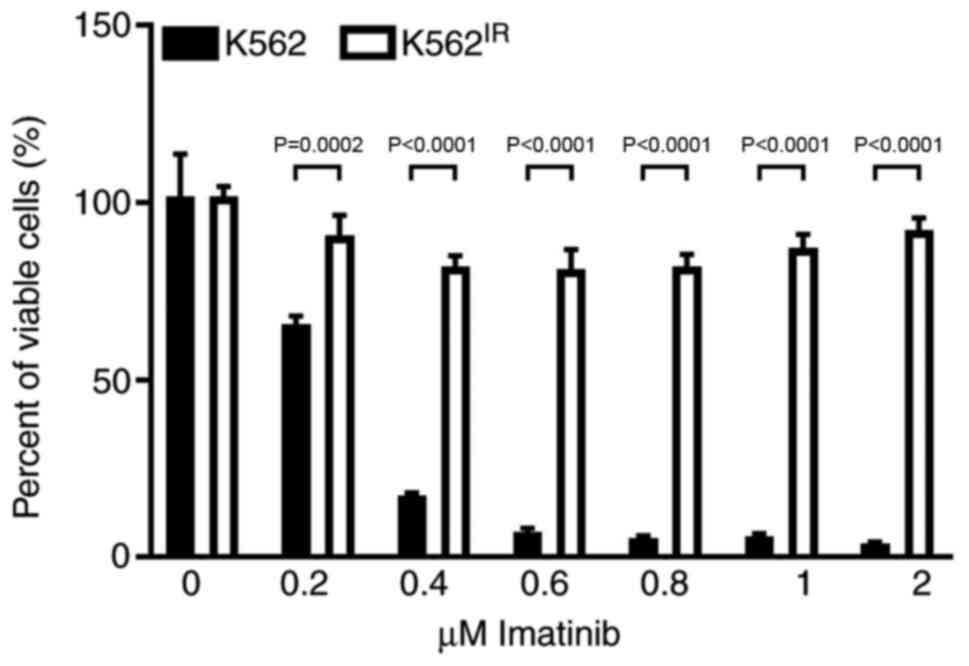
Development of imatinib resistant K562
cells
Imatinib-resistant K562IR cells were
derived from the originally imatinib-sensitive K562 cells
[half-maximal inhibitory concentration (IC50), 0.25-0.35
µM]. The K562IR cells proliferated in imatinib
concentrations exceeding 2 µM (Fig. 1).
Characterization of the K562IR
cells: Mutation analysis and BCR-ABL1 gene expression
A mutation in the kinase domain of BCR-ABL1 is the
most common mechanism by which imatinib (and other TKIs) resistance
develops in patients with CML (7).
To investigate the mutational status of the BCR-ABL1 kinase domain
in the K562IR cells, NGS sequencing was performed;
however, no mutations in the kinase domain, with variant allele
frequency >1% were found. In patients with TKI resistance but
without a kinase domain mutation, an amplification of the BCR-ABL1
gene is typically found (7).
Therefore, ddPCR was used to identify the number of BCR-ABL1 gene
copies, and it was revealed that the K562IR cells
harbored a 2-fold higher number of BCR-ABL1 gene copies compared
with that in imatinib sensitive K562 cells (data not shown).
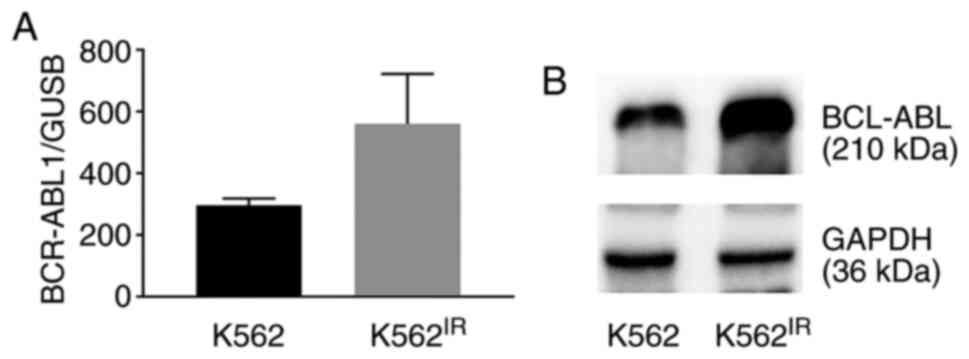
As the BCR-ABL1 gene amplification may result in
overexpression of the BCR-ABL1 gene and increase the levels of the
Bcr-Abl protein, the mRNA and protein expression levels were
compared between the K562 and K562IR cell lines. The
results revealed increased expression levels of BCR-ABL1 mRNA
(Fig. 2A) and of the Bcr-Abl
protein (Fig. 2B).
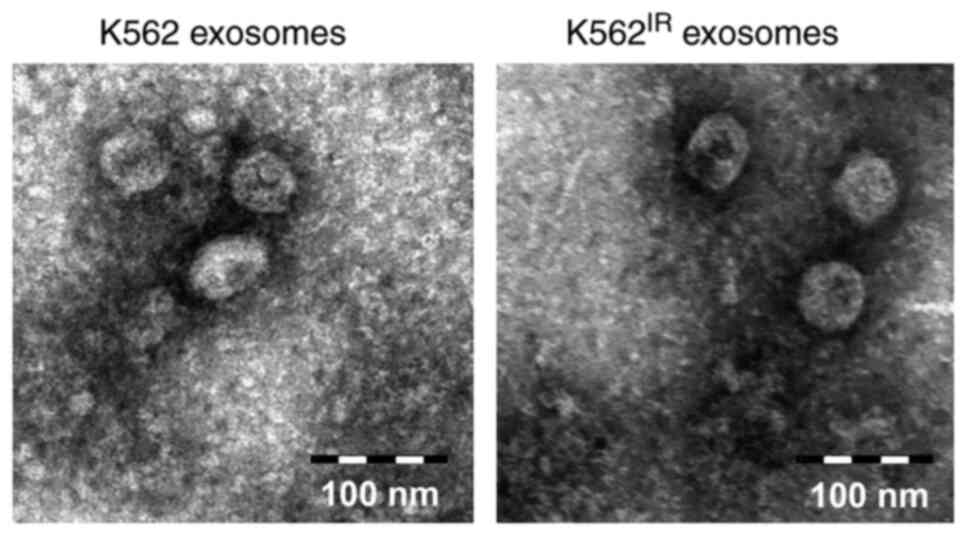
Exosome characterization
The exosomes were isolated from the K562 and
K562IR cell culture supernatants using
ultracentrifugation. The exosome purity was verified using
transmission electron microscopy, revealing round or cup-shaped
vesicles, ranging between 50-150 nm in diameter (Fig. 3). The qNano/TRPS analysis of the
exosomes confirmed comparable size distributions of the vesicles,
with the highest peak occurring at 100-110 nm. The number of
exosomes isolated from the cell media of the K562IR
cells (1.67×10¹¹ particles/ml) was ~2 times higher
compared with that in the K562 cells (8.14×10¹⁰
particles/ml) (Fig. S1).
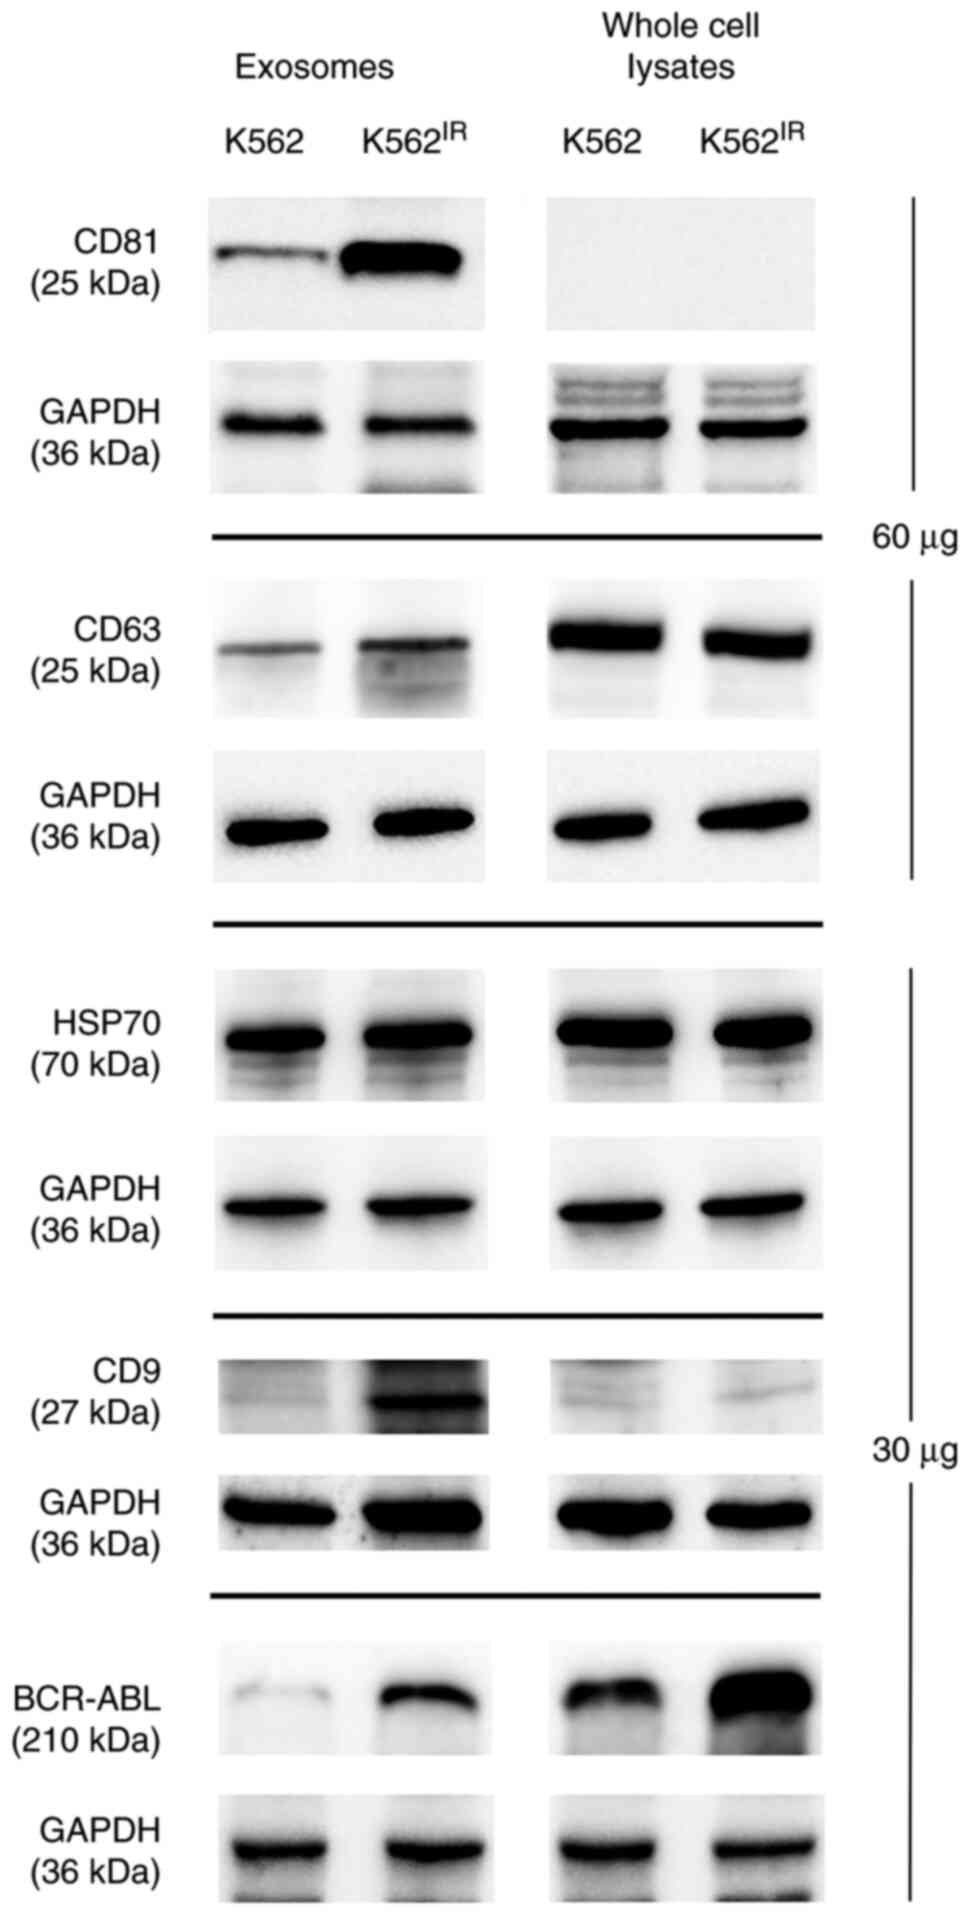
To further confirm that the pelleted material
represented exosomes, the presence of 'exosomal markers' i.e.
proteins commonly found in exosomes (CD63, CD9, CD81, HSP70 and
GAPDH) (42), was confirmed using
western blot analysis (Fig. 4). As
the CML landmark fusion protein, Bcr-Abl was overexpressed in the
K562IR cells, it was also possible to show the presence
of the Bcr-Abl protein in the corresponding exosomes.
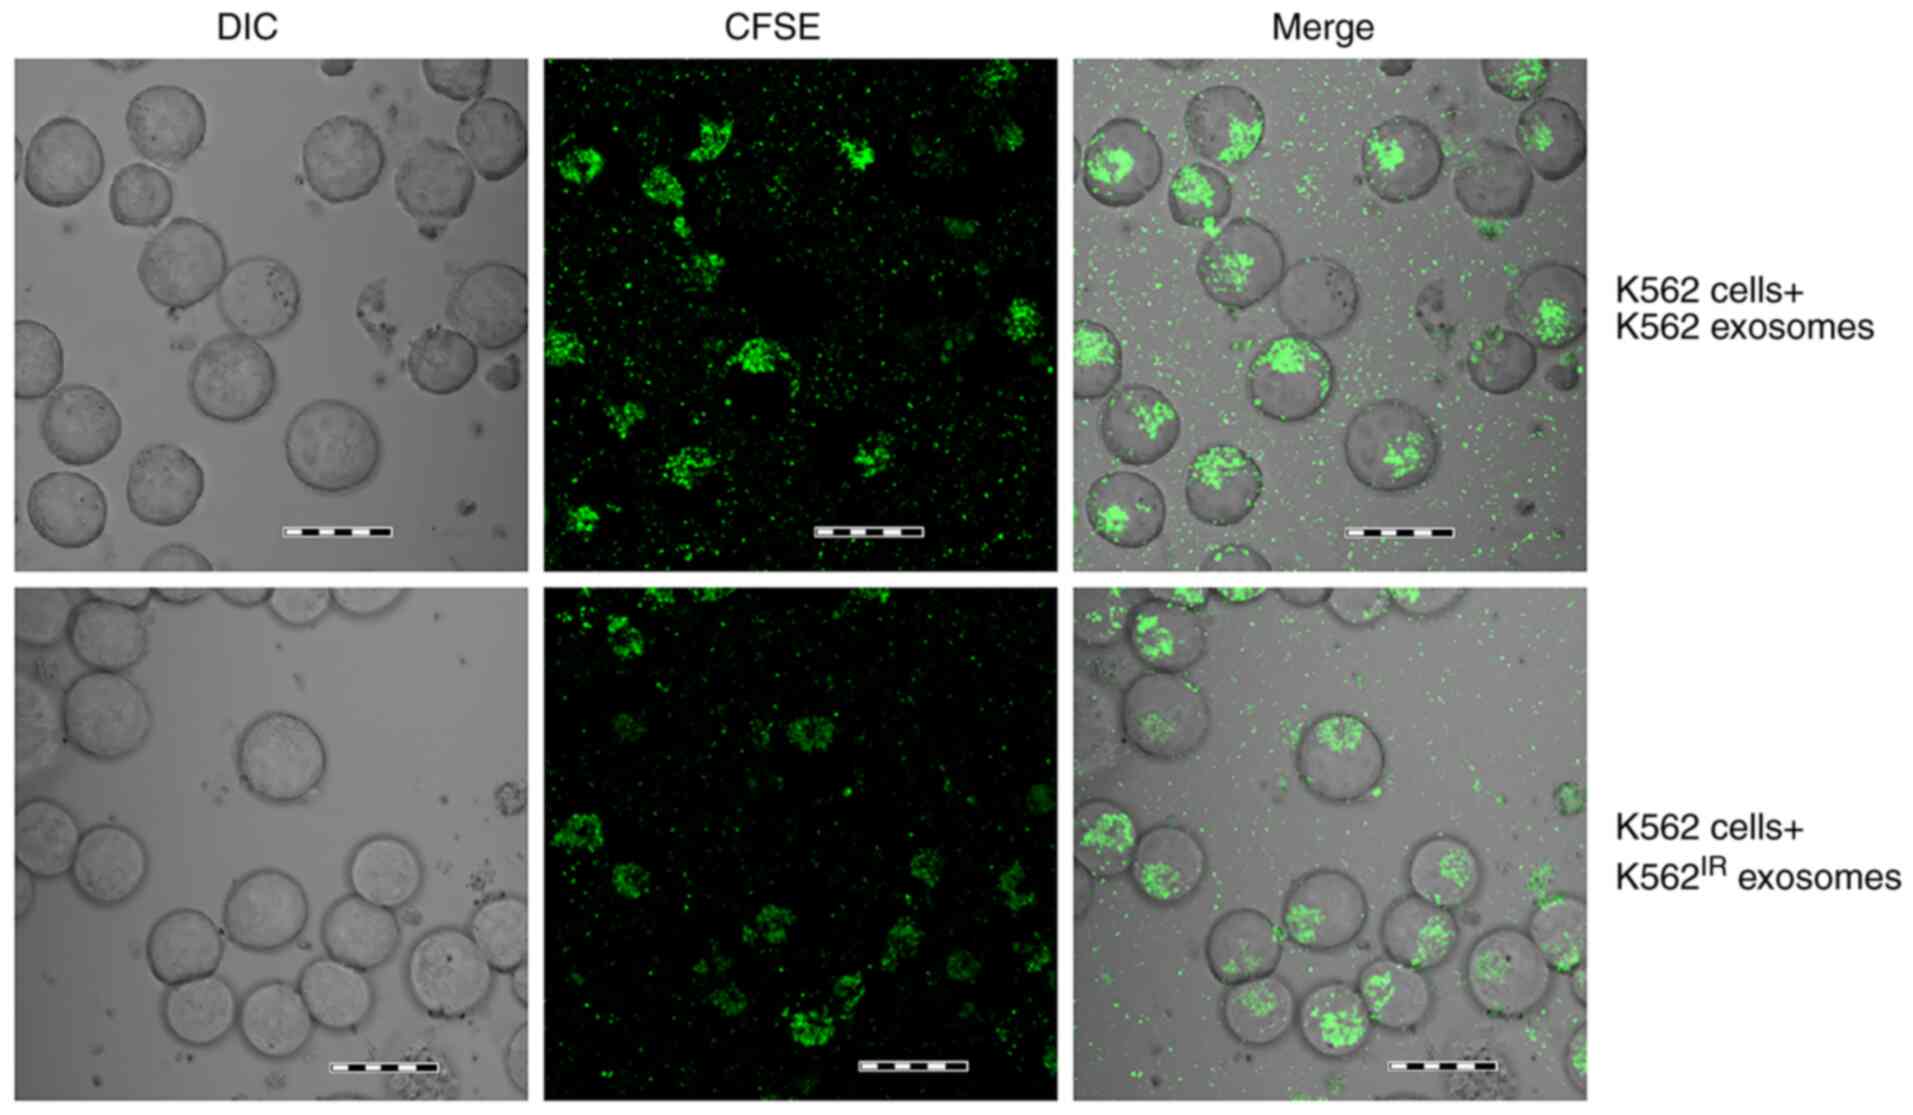
Uptake of K562IR-derived
exosomes by the K562 cells
K562-derived exosomes have been previously shown to
be taken up by various cell types, such as bone marrow stromal
cells, macrophages, endothelial cells and leukemic cells (16,17,19-21,43).
Notably, exosomes derived from imatinib-resistant CML cells have
been recently shown to fuse with, and confer drug resistance traits
to, imatinib-sensitive CML cells (22). In the present study, the fusion of
K562IR-derived exosomes (labelled with fluorescent CFSE)
with K562 cells, and the fusion of K562-derived exosomes with K562
cells, was confirmed following a 4-h incubation (Fig. 5). CFSE-positive K562 cells were
detected using confocal microscopy, as soon as 1 h after the
addition of the labelled exosomes, with the maximum uptake
occurring after 4 h, as determined in a pilot time-course
experiment (data not shown).
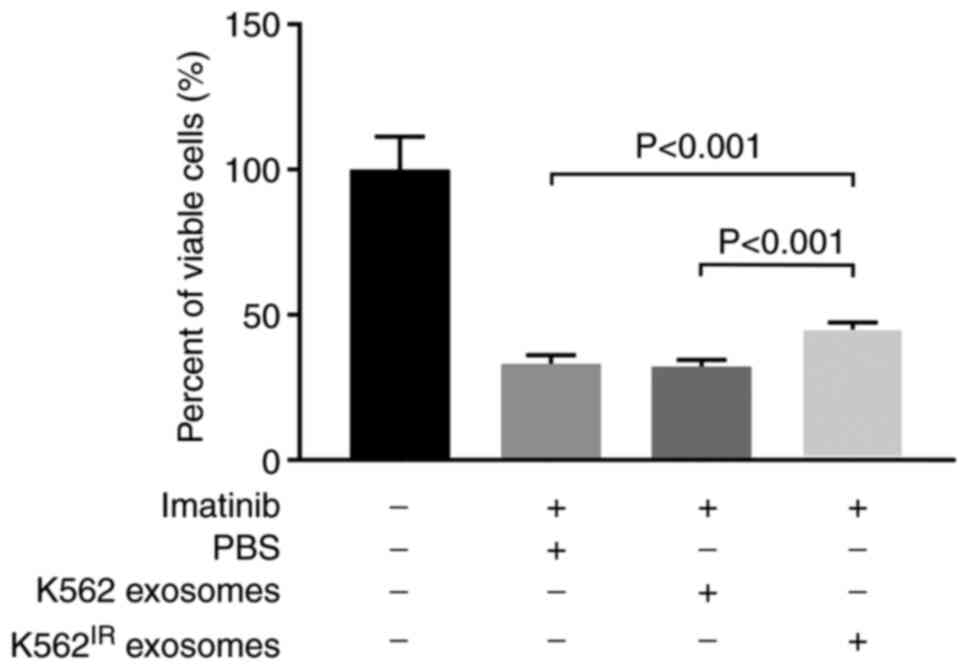
Exosomes from K562IR cells
increase survival of K562 cells in the presence of imatinib
Min et al (22) demonstrated that exosomes released
from imatinib-resistant K562 cells were able to transfer
drug-resistant traits to imatinib-sensitive K562 cells. To confirm
this observation, K562IR- or K562-derived exosomes were
isolated and incubated with K562 cells for 4 h, prior to the
addition of imatinib (2 µM) for 2 days. As shown in Fig. 6, exosomes derived from the
K562IR cells significantly increased the survival rate
of imatinib-sensitive K562 cells in the presence of imatinib,
compared with the K562 cells incubated with exosomes derived from
K562 cells, and also compared with the K562 cells treated with no
exosomes. The control exosomes derived from the K562 cells;
however, had no measurable effect on cell viability (Fig. 6).
Therefore, it could be hypothesized that the
specific composition of the K562IR-derived exosomes was
responsible for the enhanced survival of the K562 cells. To
characterize the unique protein content of the exosomes and to
identify their specific (preferably surface) markers, a detailed
proteomic analysis was subsequently performed.
LFQ proteomic analysis of the
exosomes
Exosomes derived from the K562 and K562IR
cells were subjected to LFQ proteomic analysis. A total of 10
samples of the respective exosomes, obtained from five independent
isolations of both the K562IR and K562 cells, were
analyzed using LC-MS/MS (Q-Exactive). With the FDR set to 0.01,
between 1,072 and 1,751 exosomal proteins were identified in each
sample; in total, 3,218 unique exosomal proteins were identified.
Of those, 2,693 proteins were listed in the Exocarta database of
exosomal proteomes (www.exocarta.org); therefore, the present study
identified 525 novel exosomal proteins.
To determine the quantitative robustness of the
label-free analysis, the quantitative similarity of all the
LC-MS/MS runs was examined. Correlation analysis revealed good
inter-sample reproducibility, with Pearson's correlation
coefficients in the range of 0.723-0.971 (Fig. S2). The LFQ analysis provided
semi-quantitative data for 1,241 proteins (Table SI).
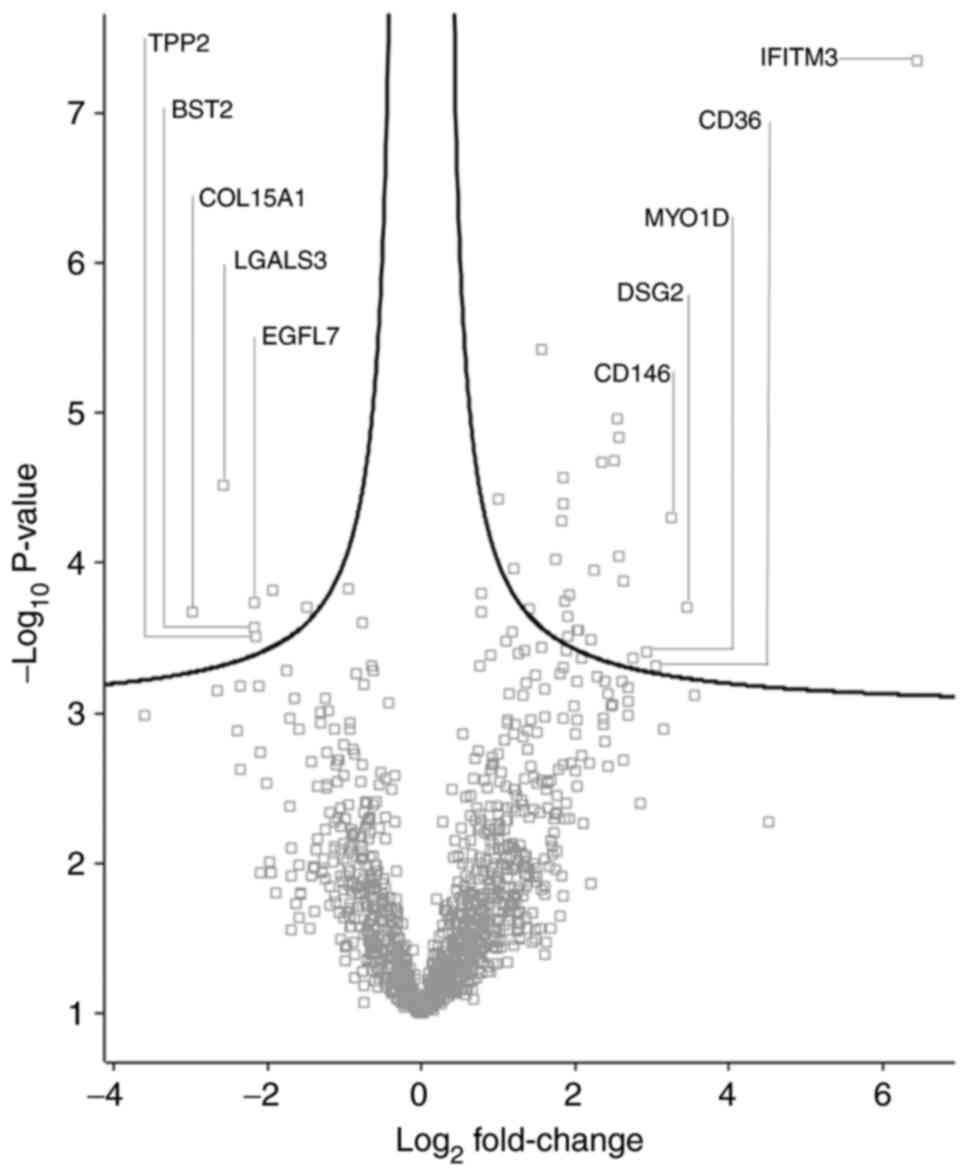
Differentially abundant proteins
A total of 35 proteins with significantly different
quantities were identified in the K562IR-derived
exosomes compared with the K562-derived exosomes (fold change
>1.5) (Fig. 7 and Table I). Of these 35 proteins, 28 were
found to be upregulated, while 7 were downregulated, in the
K562IR exosomes. The most upregulated proteins in the
K562IR exosomes included interferon-induced
transmembrane protein 3 (IFITM3), desmoglein-2 (DSG2), cell-surface
glycoprotein MUC18 (CD146) and platelet glycoprotein 4 (CD36).
Among the most downregulated were collagen α-1 (XV) chain,
galectin-3-binding protein (LGALS3BP), laminin subunit β-1 (LAMB1),
bone marrow stromal antigen 2 (BST2) and epidermal growth
factor-like protein 7 (EGFL7).
 | Table IDifferentially abundant proteins in
the K562IR-derived exosomes, as compared with that in
the K562-derived exosomes. |
Table I
Differentially abundant proteins in
the K562IR-derived exosomes, as compared with that in
the K562-derived exosomes.
A, Upregulated
protein in K562IR exosomes
|
|---|
| Protein names | Protein IDs | Gene names | Fold change | Unique
peptides | MS/MS | Permutation-based
FDR |
|---|
| Interferon-induced
transmembrane protein 3 | Q01628 | IFITM3 | 87.5 | 1 | 24 | <0.001 |
| Desmoglein-2 | Q14126 | DSG2 | 10.9 | 10 | 33 | 0.002 |
| Cell surface
glycoprotein MUC18 | P43121 | MCAM | 9.6 | 11 | 28 | <0.001 |
| Platelet
glycoprotein 4 | P16671 | CD36 | 8.4 | 7 | 18 | 0.005 |
| Unconventional
myosin-Id | O94832 | MYO1D | 7.6 | 21 | 41 | 0.004 |
| CD2-associated
protein | Q9Y5K6 | CD2AP | 6.7 | 29 | 105 | 0.004 |
| Multivesicular body
subunit 12A | Q96EY5 | MVB12A | 6.2 | 2 | 19 | 0.001 |
| Golgi integral
membrane protein 4 | O00461 | GOLIM4 | 6.0 | 18 | 37 | <0.001 |
| Protein TFG | Q92734 | TFG | 5.9 | 3 | 9 | <0.001 |
| Melanoma-associated
antigen 4 | P43358 | MAGEA4 | 5.8 | 9 | 20 | <0.001 |
| Spastin | Q9UBP0 | SPAST | 5.7 | 9 | 19 | <0.001 |
|
Melanotransferrin | P08582 | MFI2 | 5.1 | 10 | 19 | <0.001 |
| Charged
multivesicular body protein 4a | Q9BY43 | CHMP4A | 4.8 | 9 | 35 | 0.001 |
| Tetraspanin-18 | Q96SJ8 | TSPAN18 | 4.6 | 3 | 13 | 0.003 |
| Rab11
family-interacting protein 1 | Q6WKZ4 | RAB11FIP1 | 4.1 | 16 | 37 | 0.003 |
| STAM-binding
protein | O95630 | STAMBP | 4.1 | 9 | 16 | 0.003 |
| Rac
GTPase-activating protein 1 | Q9H0H5 | RACGAP1 | 3.8 | 10 | 18 | 0.002 |
| Hepatocyte growth
factor-regulated tyrosine kinase substrate | O14964 | HGS | 3.8 | 15 | 45 | 0.003 |
| Protein tweety
homolog 2 | Q9BSA4 | TTYH2 | 3.7 | 3 | 13 | 0.002 |
| Toll-interacting
protein | Q9H0E2 | TOLLIP | 3.7 | 4 | 24 | 0.002 |
| Vacuolar protein
sorting-associated protein 4A | Q9UN37 | VPS4A | 3.5 | 11 | 76 | <0.001 |
| Syntenin-1 | O00560 | SDCBP | 3.6 | 22 | 207 | <0.001 |
| Hemoglobin subunit
ε | P02100 | HBE1 | 3.6 | 11 | 56 | <0.001 |
| Charged
multivesicular body protein 4b | Q9H444 | CHMP4B | 3.3 | 15 | 86 | <0.001 |
| Crk-like
protein | P46109 | CRKL | 3.0 | 12 | 56 | <0.001 |
|
L-aminoadipate-semialdehyde
dehydrogenase-phosphopantetheinyl transferase | Q9NRN7 | AASDHPPT | 2.6 | 6 | 10 | 0.002 |
| Hemoglobin subunit
ζ | P02008 | HBZ | 2.3 | 13 | 217 | 0.001 |
| Heat shock protein
105 kDa | Q92598 | HSPH1 | 2.0 | 19 | 79 | <0.001 |
|
B, Downregulated
proteins in K562IR exosomes
|
| Protein names | Protein IDs | Gene names | Fold change | Unique
peptides | MS/MS | Permutation-based
FDR |
|
| DNA topoisomerase
2-β | Q02880 | TOP2B | −2.8 | 7 | 23 | 0.002 |
| Tyrosine-protein
kinase receptor UFO | P30530 | AXL | −3.8 | 7 | 21 | 0.002 |
|
Tripeptidyl-peptidase 2 | P29144 | TPP2 | −4.4 | 57 | 211 | 0.003 |
| Epidermal growth
factor-like protein 7 | Q9UHF1 | EGFL7 | −4.5 | 4 | 10 | 0.002 |
| Bone marrow stromal
antigen 2 | Q10589 | BST2 | −4.5 | 6 | 17 | 0.003 |
| Galectin-3-binding
protein | Q08380 | LGALS3BP | −5.9 | 6 | 17 | 0.001 |
| Collagen α-1(XV)
chain | P39059 | COL15A1 | −7.9 | 15 | 102 | 0.002 |
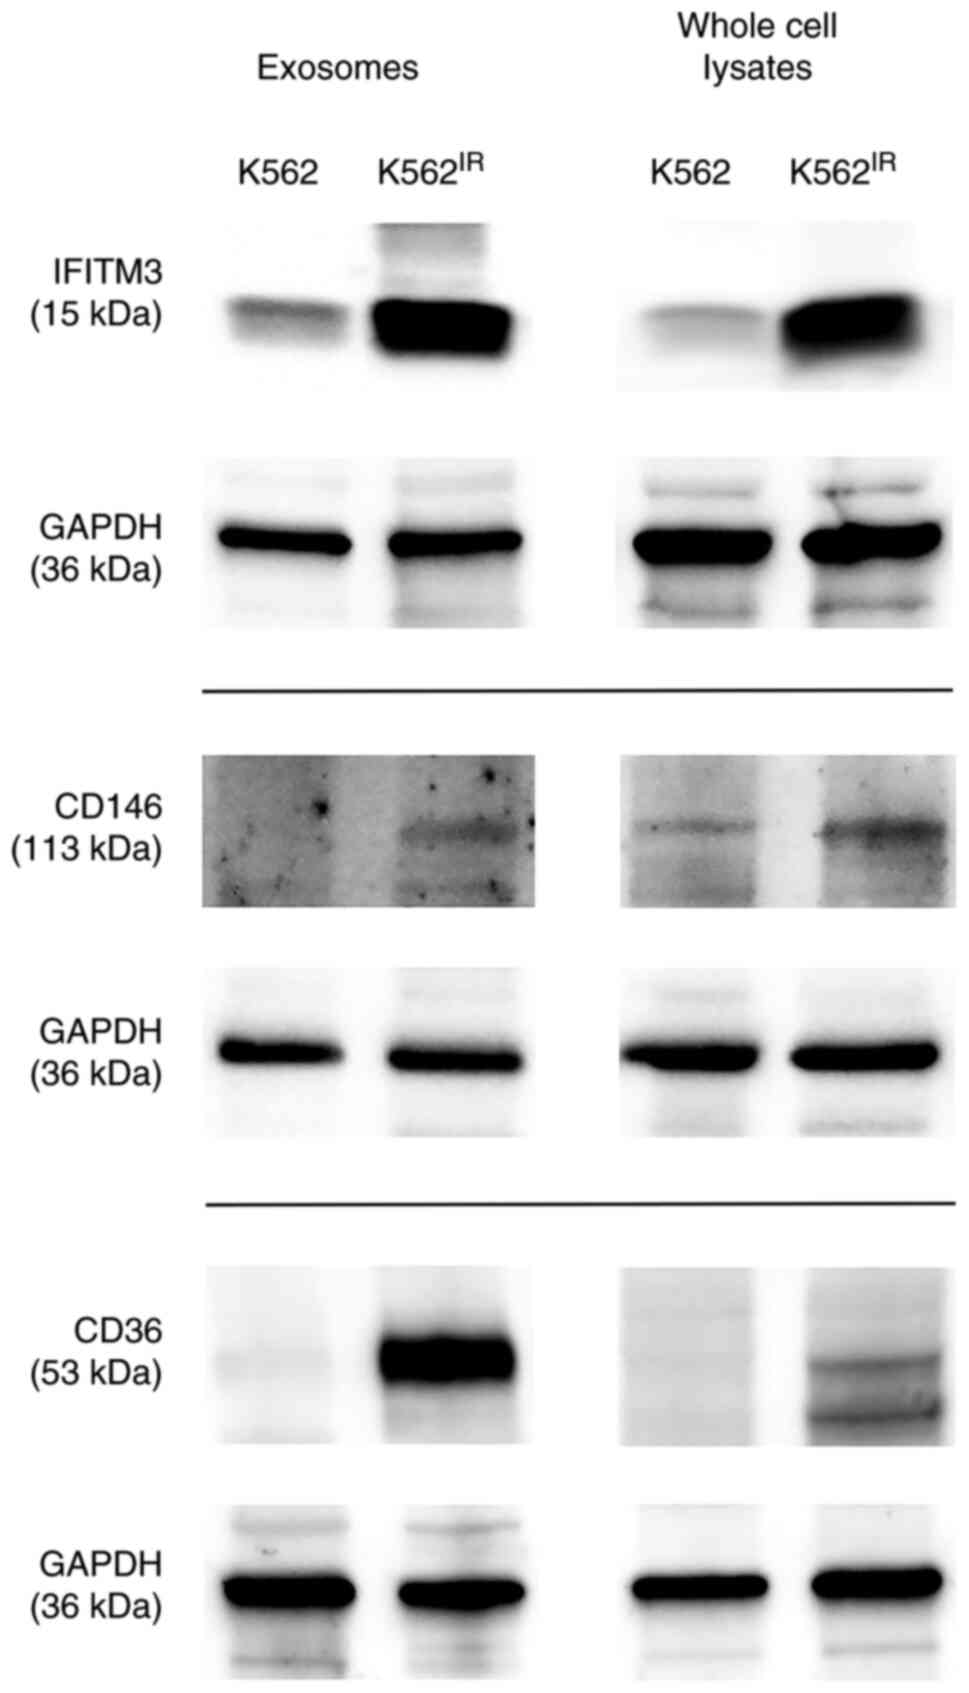
The most highly upregulated proteins (at least
5-fold) were further investigated with special focus on proteins
localized on the cell or exosomal membrane. Among the candidates
selected by the LFQ proteomic analysis, three such proteins were
identified using GenieScore, an algorithm for the prediction of
surface localization (41):
IFITM3, CD146 (MUC18) and CD36. The presence of these proteins was
confirmed in the exosomes and also in the cells of their origin
using western blot analysis with specific antibodies (Fig. 8).
The western blot data confirmed the upregulation of
all three proteins in the K562IR-derived exosomes, as
well as in the 'source' K562IR cells. Therefore, the
upregulated surface membrane proteins could potentially serve, not
only as exosomal markers, but also as cell-surface markers specific
for a resistant population of the K562 cells.
IFITM3 and CD146 as specific surface
markers of imatinib-resistant K562 cells
To determine the potential of the identified
proteins as cell-surface markers of imatinib resistance, flow
cytometric analysis of the K562 and K562IR cells was
performed using antibodies against IFITM3, CD146 and CD36. Live
cells were used to determine the cell-surface expression of the
putative markers.
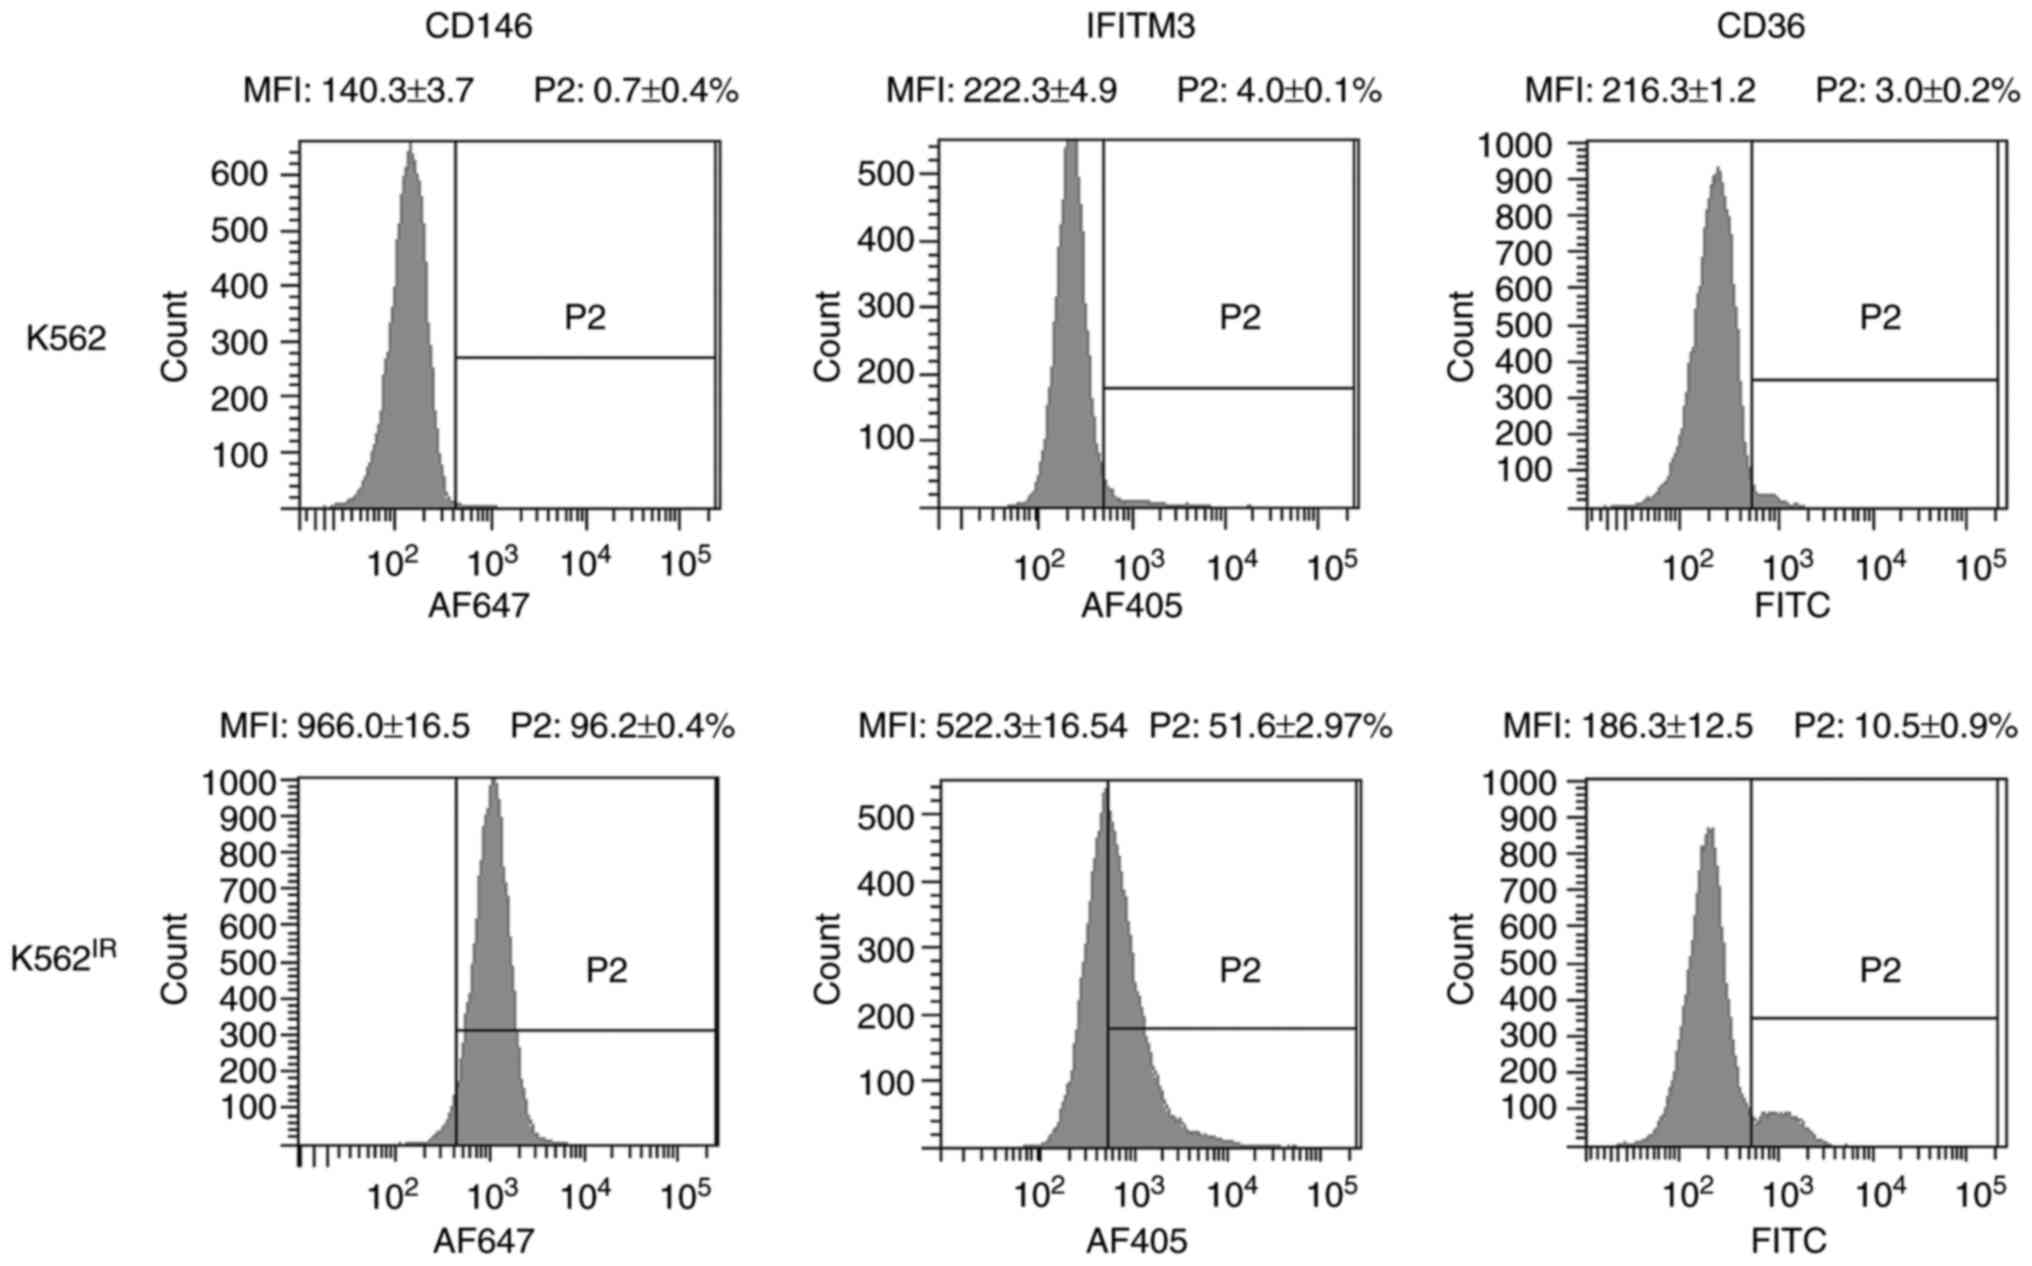
Flow cytometry revealed markedly increased surface
expression levels of IFITM3 and CD146, and to a lesser extent also
of CD36, in K562IR cells compared with the K562 cells
(Fig. 9). CD146 was detected in
96.2% of the K562IR cells compared with 0.7% of the K562
cells, while IFITM3 was detected in 51.6% of the K562IR
cells compared with 4% of the K562 cells. Anti-CD36 antibody
stained 10.5% of the K562IR compared with 3% of the K562
cells. The analysis demonstrated that CD146 expression, in
particular, clearly distinguishes K562 from K562IR
cells, and therefore it may be used as a reliable cell-surface
marker of imatinib resistance in these cells. In addition,
promising results were also obtained with IFITM3.
Discussion
Incubation of isolated and carefully characterized
K562IR-derived exosomes with K562 cells, prior to
exposure to imatinib, slightly, but significantly, increased the
survival of the K562 cells in toxic doses of imatinib (2
µM). Thus, the results confirmed the observation Min et
al (22) made in the same cell
line, providing further evidence for the role of exosomes in the
horizontal transfer of information among cancer cells, including
pro-survival signals or a drug-resistance trait.
To what extent an exosome-mediated survival plays in
the development of resistance to imatinib in patients with CML
remains to be determined. A complex interaction between the
resistant cells, exosomes and target cells can be hypothesized. The
whole process can be spatially separated between the bone marrow
and peripheral blood, and may include other than leukemic cells,
for example, stromal cells in bone marrow, macrophages or
endothelial cells (17,19-21).
In addition, it could also be hypothesized that time may also play
its role, namely with respect to potentially continuous production
of exosomes in vivo. Furthermore, considering that several
distinct molecular mechanisms of resistance to imatinib have been
described (7,8), the role of exosome-mediated survival
may differ among patients with CML. We propose that each individual
mechanism of imatinib resistance may manifest with a different
phenotype of the resistant cell population, affecting protein
expression, cellular proliferation rate and other cellular
properties, including exosomal content and the rate of exosome
shedding. Mutations in the BCR-ABL1 kinase domain, which prevent
interaction of imatinib with the Bcr-Abl protein, are the most
common cause of resistance to imatinib in patients with CML
(7). However, the
K562IR cells in the present study did not possess any
mutations in the kinase domain; instead, BCR-ABL1 amplification
resulted in overexpression at the mRNA and protein levels, which is
another mechanism of resistance that has previously been described
in specific patients with CML (6,44).
This may suggest that the observations in the present study may be
specific for the underlying mechanism of resistance in the model
used, i.e. the overexpression of BCR-ABL1.
The role of exosomes in cancer progression and drug
resistance establishes their potential as a source of biomarkers
for monitoring the progression of the disease, the emergence of
drug resistance, or the effects of a therapeutic intervention
(9,15). A detailed characterization of the
specific protein cargo of the exosomes and identification of
resistance-associated markers on the surface of K562IR
exosomes and K562IR cells was, therefore, performed. The
LFQ proteome analysis identified over 3,000 exosomal proteins and
provided relative quantitation for 1,241 of them. These datasets
represent, to the best of our knowledge, the largest set of
exosomal proteins derived from leukemic cells. Among the proteins
with significantly different abundance in the K562IR
exosomes, the focus was directed to molecules known (or expected)
to be localized on the surface of the cells and exosomes. Surface
localization ensures proteins are easily accessible as markers or
drug targets. A total of 3 significantly upregulated (i.e.,
>7-fold according the LFQ data) membrane proteins with predicted
surface localization were identified in the K562IR
exosomes: IFITM3, CD146 and CD36. Notably, all three putative
marker proteins have been previously associated with cancer
progression (45-57).
IFITM3 is a member of the interferon-induced
trans-membrane protein family (58), that is known for its antiviral
activity, and has been associated with multiple viruses, including
Middle East respiratory syndrome coronavirus (MERS-CoV) and severe
acute respiratory syndrome corona-virus (SARS-CoV) (59). IFITM3 has also been found to be
overexpressed in patients with AML and in human cell lines derived
from gastric, lung, oral and breast tumors (45-49)
and has been implicated in cancer progression (45,46),
with either pro-proliferative and/or pro-migratory roles (47,48).
High expression levels of IFITM3 protein have been associated with
poor prognosis in acute myeloid leukemia (49).
CD146 is a transmembrane glycoprotein, that was
first identified in malignant melanoma, where it contributed to
metastasis (50). CD146 protein
overexpression in various types of malignancies, such as melanoma,
ovarian and breast cancer, and lung tumors, has been associated
with tumor progression, angiogenesis and metastasis (51-53),
and its expression has also been associated with drug resistance
(54,55).
CD36 is a hematopoietic marker of a subpopulation
of primitive (i.e., less differentiated) and blast crisis CML cells
(56). Notably, these cell types
are known to be less sensitive to imatinib (57). An increase in the protein
expression level of CD36 could, therefore, potentially mark a
sub-population of K562IR cells with a less
differentiated myeloid phenotype.
Using specific antibodies, it was possible to
confirm the increase of all three putative marker proteins in both
the K562IR exosomes and the K562IR cells.
Finally, to confirm the differential expression of IFITM3, CD146
and CD36 proteins on the surface of the K562IR cells and
to validate their utility as potential marker of imatinib
resistance, flow cytometric analysis of live K562 and
K562IR cells was performed using specific antibodies.
The results confirmed that CD146 could be a reliable positive
marker of imatinib resistance in the K562 cells, which could be
used to distinguish and separate populations of K562IR
cells using flow cytometry. IFITM3 and CD36 displayed lower
differences in expression levels, comparing between the K562 and
K562IR cells, and, therefore, have a lower level of
accuracy in terms of distinguishing between the resistant and the
sensitive cell populations.
Due to their resistance-specific overexpression on
the cell surface, CD146 and IFITM3 could be, at least
theoretically, exploited as drug targets for molecular therapy in
imatinib-resistant CML. In agreement with this, CD146 has been
considered to be a promising therapeutic target in CD146-positive
cancers, such as melanoma (60).
The therapeutic potential of anti-CD146 antibodies for cancer
therapy is already being evaluated (61). Similarly, IFITM3 inactivation
(knockdown) studies (49,50) have also provided strong support for
its future anti-cancer pharmacological potential.
The present study did not address the mechanism of
exosome-mediated survival. However, several possible mechanisms may
be proposed or envisioned. For example, we hypothesize that
exosomes carrying the molecular target of the drug could shift the
drug/target ratio in the recipient cells upon fusion. In the
present study, BCR-ABL1 fusion gene amplification and
overexpression were identified in the K562IR cells,
which resulted in upregulation of the fusion kinase in the
K562IR exosomes. The process of the causative kinase
being delivered by K562IR exosomes to the recipient K562
cells may, thus, hypothetically shift the imatinib/Bcr-Abl ratio
and increase the survival rate of the K562 cells.
Alternatively, and additionally, exosomes may
transfer other pro-survival molecules or their precursors, namely
proteins, RNAs or DNAs. In their original study, Min et al
(22) identified miR-365 as a
molecule partly responsible for the pro-survival effect of exosomes
derived from imatinib-resistant K562 cells. However, the beneficial
effect of miR-365 alone was lower compared with the administration
of the whole exosomes (22),
suggesting that other molecules are involved in the process. It is,
therefore, possible to hypothesize that IFITM3 could be a potential
pro-survival candidate molecule, as it regulates STAT3
phosphorylation (62) and
signaling, leading to cell proliferation, angiogenesis and drug
resistance (63). Similarly, CD146
could theoretically contribute to survival of the target cells, as
it mediates chemoresistance in small-cell lung cancer and in breast
cancer through the activation of AKT kinase (54,55).
However, whether the CD146 and/or IFITM3 molecules contained within
the 'resistant' exosomes are able to actually exert their signaling
function in the recipient cells, thereby stimulating their survival
in the presence of imatinib, remains to be determined.
It is well-known that the K562 cells represent a
single cellular model of CML, which may differ significantly from
the complex and heterogeneous situation in CML in vivo.
Whether the markers identified in the K562IR model are
also overexpressed in the leukemic cells of patients with imatinib
resistant CML remains to be verified. Unfortunately, such a
confirmatory study will be complicated by several factors. The
therapy of patients with limited response to imatinib is promptly
changed to a newer TKI (64),
typically without bone marrow sampling. Therefore, leukemia cells
from patients with CML that are truly resistant to imatinib are
very rare. The future study would be required to include a large
number of bone marrow samples obtained from patients with different
degrees of response to imatinib. Secondly, the mechanisms of
imatinib resistance may differ between patients, with and without
mutations in the Bcr-Abl kinase domain, and the study must include
both types of patients. Thirdly, the necessary isolation of
Ph-positive leukemia cells from the complex bone marrow samples may
severely limit the cellular material available for the verification
of the candidate protein expression. Nevertheless, performing the
verification study would be essential before proposing CD146 and
IFITM3 as novel and clinically relevant markers of imatinib
resistance, or potential drug targets for imatinib resistant
CML.
Supplementary Data
Funding
This study was supported by the Ministry of
Education, Youth and Sports of the Czech Republic (grant nos.
Progress Q26, SVV 260 521, UNCE/MED/016), the Ministry of Health of
the Czech Republic (grant nos. NC19-01-00083 and NC19-02-00130) and
by the Project for Conceptual Development of Research Organizations
(grant no. 00023736) of the Ministry of Health of the Czech
Republic. The authors also acknowledge support from the projects
CZ.1.05/2.1.00/19.0400 and CZ.1.05/1.1.00/02.0109 from the Research
and Development for Innovations Operational Program co-financed by
the European Regional Development Fund and the state budget of the
Czech Republic. The LFQ MS work was supported by the Ministry of
Interior, Czech Republic (grant no. VH20172020012) and by the
Ministry of Defense of the Czech Republic through a long-term
organization development plan (grant no. 907930101413). A grant was
also provided from the Czech Academy of Sciences (grant no.
L200521953).
Availability of data and materials
The datasets generated and analyzed during the
current study have been deposited to the ProteomeXchange Consortium
via the PRIDE (65) partner
repository with the dataset identifier PXD019283.
Authors' contributions
TH, OT, DV and JP conceived the study and designed
the experiments. TH, OT, JD, JK and PP were responsible for the
LC-MS/MS data acquisition and interpretation. JL derived the
resistant K562IR cells. VP performed BCR-ABL1
mutational, amplification and transcript analysis. KMP supervised
the establishment of the resistant K562IR, BCR-ABL1 NGS
and ddPCR analyses and interpreted the data. HK performed the
electron microscopy experiments. BB performed confocal microscopy.
TH, BS and OB performed statistical analyses of the LFQ proteomic
data. TH, MK and JZ performed the FACS analysis. JP and TK wrote
the manuscript. All authors critically evaluated and approved the
final version of the manuscript.
Ethics approval and consent to
participate
Not applicable.
Patient consent for publication
Not applicable.
Competing interests
The authors declare that they have no competing
interests.
Acknowledgments
Not applicable.
Abbreviations:
|
CML
|
chronic myeloid leukemia
|
|
TKI
|
tyrosine kinase inhibitor
|
|
K562IR
|
K562 imatinib-resistant
|
|
NGS
|
next-generation sequencing
|
|
ddPCR
|
droplet digital PCR
|
|
LFQ
|
label-free quantification
|
|
CFSE
|
carboxyfluorescein succinimidyl
ester
|
|
FACS
|
fluorescent-activated cell
sorting
|
|
TRPS
|
tunable-resistive pulse sensing
|
|
LC-MS/MS
|
liquid chromatography coupled with
tandem mass spectrometry
|
|
AGC
|
automatic gain control
|
|
FDR
|
false discovery rate
|
|
MFI
|
mean fluorescence intensity
|
References
|
1
|
Nowell PC and Hungerford DA: A minute
chromosome in human chronic granulocytic leukemia. Science.
132:14971960.
|
|
2
|
Rowley JD: Letter: A new consistent
chromosomal abnormality in chronic myelogenous leukemia identified
by quinacrine fluorescence and Giemsa staining. Nature.
243:290–293. 1973. View Article : Google Scholar : PubMed/NCBI
|
|
3
|
Heisterkamp N, Stephenson JR, Groffen J,
Hansen PF, de Klein A, Bartram CR and Grosveld G: Localization of
the c-ab1 oncogene adjacent to a translocation break point in
chronic myelocytic leukaemia. Nature. 306:239–242. 1983. View Article : Google Scholar : PubMed/NCBI
|
|
4
|
Druker BJ, Talpaz M, Resta DJ, Peng B,
Buchdunger E, Ford JM, Lydon NB, Kantarjian H, Capdeville R,
Ohno-Jones S and Sawyers CL: Efficacy and safety of a specific
inhibitor of the BCR-ABL tyrosine kinase in chronic myeloid
leukemia. N Engl J Med. 344:1031–1037. 2001. View Article : Google Scholar : PubMed/NCBI
|
|
5
|
Lahaye T, Riehm B, Berger U, Paschka P,
Müller MC, Kreil S, Merx K, Schwindel U, Schoch C, Hehlmann R and
Hochhaus A: Response and resistance in 300 patients with
BCR-ABL-positive leukemias treated with imatinib in a single
center: A 4.5-year follow-up. Cancer. 103:1659–1669. 2005.
View Article : Google Scholar : PubMed/NCBI
|
|
6
|
Gadzicki D, von Neuhoff N, Steinemann D,
Just M, Büsche G, Kreipe H, Wilkens L and Schlegelberger B: BCR-ABL
gene amplifi-cation and overexpression in a patient with chronic
myeloid leukemia treated with imatinib. Cancer Genet Cytogenet.
159:164–167. 2005. View Article : Google Scholar : PubMed/NCBI
|
|
7
|
Gorre ME, Mohammed M, Ellwood K, Hsu N,
Paquette R, Rao PN and Sawyers CL: Clinical resistance to STI-571
cancer therapy caused by BCR-ABL gene mutation or amplification.
Science. 293:876–880. 2001. View Article : Google Scholar : PubMed/NCBI
|
|
8
|
Mahon FX, Deininger MW, Schultheis B,
Chabrol J, Reiffers J, Goldman JM and Melo JV: Selection and
characterization of BCR-ABL positive cell lines with differential
sensitivity to the tyrosine kinase inhibitor STI571: Diverse
mechanisms of resistance. Blood. 96:1070–1079. 2000. View Article : Google Scholar : PubMed/NCBI
|
|
9
|
Steinbichler TB, Dudas J, Skvortsov S,
Ganswindt U, Riechelmann H and Skvortsova II: Therapy resistance
mediated by exosomes. Mol Cancer. 18:582019. View Article : Google Scholar : PubMed/NCBI
|
|
10
|
Nehrbas J, Butler JT, Chen DW and Kurre P:
Extracellular vesicles and chemotherapy resistance in the AML
microenvironment. Front Oncol. 10:902020. View Article : Google Scholar : PubMed/NCBI
|
|
11
|
Johnstone RM, Adam M, Hammond JR, Orr L
and Turbide C: Vesicle formation during reticulocyte maturation.
Association of plasma membrane activities with released vesicles
(exosomes). J Biol Chem. 262:9412–9420. 1987. View Article : Google Scholar : PubMed/NCBI
|
|
12
|
Valadi H, Ekstrom K, Bossios A, Sjostrand
M, Lee JJ and Lotvall JO: Exosome-mediated transfer of mRNAs and
microRNAs is a novel mechanism of genetic exchange between cells.
Nat Cell Biol. 9:654–659. 2007. View Article : Google Scholar : PubMed/NCBI
|
|
13
|
Thakur BK, Zhang H, Becker A, Matei I,
Huang Y, Costa-Silva B, Zheng Y, Hoshino A, Brazier H, Xiang J, et
al: Double-stranded DNA in exosomes: A novel biomarker in cancer
detection. Cell Res. 24:766–769. 2014. View Article : Google Scholar : PubMed/NCBI
|
|
14
|
Prada I and Meldolesi J: Binding and
Fusion of Extracellular vesicles to the plasma membrane of their
cell targets. Int J Mol Sci. 17:12962016. View Article : Google Scholar :
|
|
15
|
Maacha S, Bhat AA, Jimenez L, Raza A,
Haris M, Uddin S and Grivel JC: Extracellular vesicles-mediated
intercellular communication: Roles in the tumor microenvironment
and anti-cancer drug resistance. Mol Cancer. 18:552019. View Article : Google Scholar : PubMed/NCBI
|
|
16
|
Raimondo S, Saieva L, Corrado C, Fontana
S, Flugy A, Rizzo A, De Leo G and Alessandro R: Chronic myeloid
leukemia-derived exosomes promote tumor growth through an autocrine
mechanism. Cell Commun Signal. 13:82015. View Article : Google Scholar : PubMed/NCBI
|
|
17
|
Corrado C, Raimondo S, Saieva L, Flugy AM,
De Leo G and Alessandro R: Exosome-mediated crosstalk between
chronic myelogenous leukemia cells and human bone marrow stromal
cells triggers an interleukin 8-dependent survival of leukemia
cells. Cancer Lett. 348:71–76. 2014. View Article : Google Scholar : PubMed/NCBI
|
|
18
|
Cai J, Wu G, Tan X, Han Y, Chen C, Li C,
Wang N, Zou X, Chen X, Zhou F, et al: Transferred BCR/ABL DNA from
K562 extracellular vesicles causes chronic myeloid leukemia in
immu-nodeficient mice. PLoS One. 9:e1052002014. View Article : Google Scholar
|
|
19
|
Jafarzadeh N, Safari Z, Pornour M,
Amirizadeh N, Forouzandeh Moghadam M and Sadeghizadeh M: Alteration
of cellular and immune-related properties of bone marrow
mesenchymal stem cells and macrophages by K562 chronic myeloid
leukemia cell derived exosomes. J Cell Physiol. 234:3697–3710.
2019. View Article : Google Scholar
|
|
20
|
Taverna S, Flugy A, Saieva L, Kohn EC,
Santoro A, Meraviglia S, De Leo G and Alessandro R: Role of
exosomes released by chronic myelogenous leukemia cells in
angiogenesis. Int J cancer. 130:2033–2043. 2012. View Article : Google Scholar
|
|
21
|
Mineo M, Garfield SH, Taverna S, Flugy A,
De Leo G, Alessandro R and Kohn EC: Exosomes released by K562
chronic myeloid leukemia cells promote angiogenesis in a
Src-dependent fashion. Angiogenesis. 15:33–45. 2012. View Article : Google Scholar
|
|
22
|
Min QH, Wang XZ, Zhang J, Chen QG, Li SQ,
Liu XQ, Li J, Liu J, Yang WM, Jiang YH, et al: Exosomes derived
from imatinib-resistant chronic myeloid leukemia cells mediate a
horizontal transfer of drug-resistant trait by delivering miR365.
Exp Cell Res. 362:386–393. 2018. View Article : Google Scholar
|
|
23
|
Toman O, Kabickova T, Vit O, Fiser R,
Polakova KM, Zach J, Linhartova J, Vyoral D and Petrak J: Proteomic
analysis of imatinib-resistant CML-T1 cells reveals calcium
homeostasis as a potential therapeutic target. Oncol Rep.
36:1258–1268. 2016. View Article : Google Scholar : PubMed/NCBI
|
|
24
|
Machova Polakova K, Kulvait V, Benesova A,
Linhartova J, Klamova H, Jaruskova M, de Benedittis C, Haferlach T,
Baccarani M, Martinelli G, et al: Next-generation deep sequencing
improves detection of BCR-ABL1 kinase domain mutations emerging
under tyrosine kinase inhibitor treatment of chronic myeloid
leukemia patients in chronic phase. J Cancer Res Clin Oncol.
141:887–899. 2015. View Article : Google Scholar
|
|
25
|
Kohlmann A, Grossmann V, Nadarajah N and
Haferlach T: Next-generation sequencing-feasibility and
practicality in haematology. Br J Haematol. 160:736–753. 2013.
View Article : Google Scholar : PubMed/NCBI
|
|
26
|
Linhartova J, Hovorkova L, Soverini S,
Benesova A, Jaruskova M, Klamova H, Zuna J and Machova Polakova K:
Characterization of 46 patient-specific BCR-ABL1 fusions and
detection of SNPs upstream and downstream the breakpoints in
chronic myeloid leukemia using next generation sequencing. Mol
Cancer. 14:892015. View Article : Google Scholar : PubMed/NCBI
|
|
27
|
Moravcova J, Rulcova J, Polaková KM and
Klamova H: Control genes in international standardization of
real-time RT-PCR for BCR-ABL. Leuk Res. 33:582–584. 2009.
View Article : Google Scholar
|
|
28
|
Rulcova J, Zmekova V, Zemanova Z, Klamova
H and Moravcova J: The effect of total-ABL, GUS and B2M control
genes on BCR-ABL monitoring by real-time RT-PCR. Leuk Res.
31:483–491. 2007. View Article : Google Scholar
|
|
29
|
Gabert J, Beillard E, van der Velden VH,
Bi W, Grimwade D, Pallisgaard N, Barbany G, Cazzaniga G, Cayuela
JM, Cavé H, et al: Standardization and quality control studies of
'real-time' quantitative reverse transcriptase polymerase chain
reaction of fusion gene transcripts for residual disease detection
in leukemia-a Europe Against Cancer program. Leukemia.
17:2318–2357. 2003. View Article : Google Scholar : PubMed/NCBI
|
|
30
|
Müller MC, Cross NCP, Erben P, Schenk P,
Hanfstein B, Ernst T, Hehlmann R, Branford S, Saglio G and Hochhaus
A: Harmonization of molecular monitoring of CML therapy in Europe.
Leukemia. 23:1957–1963. 2009. View Article : Google Scholar : PubMed/NCBI
|
|
31
|
Deprez L, Mazoua S, Corbisier P, Trapmann
S, Schimmel H, White H, Cross N and Emons H: The certification of
the copy number concentration of solutions of plasmid DNA
containing a BCR- ABL b3a2 transcript fragment. Certified reference
material: ERM-AD623a, ERM-AD623b, ERM-AD623c, ERM-AD623d,
ERM-AD623e ERM-AD623f. Luxembourg: Publications Office of the
European Union; 2012. Report number EUR 25248. ISBN:
978-92-79-23343-22012
|
|
32
|
White H, Deprez L, Corbisier P, Hall V,
Lin F, Mazoua S, Trapmann S, Aggerholm A, Andrikovics H, Akiki S,
et al: A certified plasmid reference material for the
standardisation of BCR-ABL1 mRNA quantification by real-time
quantitative PCR. Leukemia. 29:369–376. 2015. View Article : Google Scholar
|
|
33
|
Thery C, Amigorena S, Raposo G and Clayton
A: Isolation and characterization of exosomes from cell culture
supernatants and biological fluids. Curr Protoc Cell Biol Chapter.
3:Unit 3.22. 2006.
|
|
34
|
McDowell EM and Trump BF: Histologic
fixatives suitable for diagnostic light and electron microscopy.
Arch Pathol Lab Med. 100:405–414. 1976.PubMed/NCBI
|
|
35
|
Wisniewski JR, Zougman A and Mann M:
Combination of FASP and StageTip-based fractionation allows
in-depth analysis of the hippocampal membrane proteome. J Proteome
Res. 8:5674–5678. 2009. View Article : Google Scholar : PubMed/NCBI
|
|
36
|
Cox J and Mann M: MaxQuant enables high
peptide iden-tification rates, individualized p.p.b-range mass
accuracies and proteome-wide protein quantification. Nat
Biotechnol. 26:1367–1372. 2008. View Article : Google Scholar : PubMed/NCBI
|
|
37
|
Cox J, Neuhauser N, Michalski A, Scheltema
RA, Olsen JV and Mann M: Andromeda: A peptide search engine
integrated into the MaxQuant environment. J Proteome Res.
10:1794–1805. 2011. View Article : Google Scholar : PubMed/NCBI
|
|
38
|
Cox J, Hein MY, Luber CA, Paron I, Nagaraj
N and Mann M: Accurate proteome-wide label-free quantification by
delayed normalization and maximal peptide ratio extraction, termed
MaxLFQ. Mol Cell Proteomics. 13:2513–2526. 2014. View Article : Google Scholar : PubMed/NCBI
|
|
39
|
Tyanova S, Temu T, Sinitcyn P, Carlson A,
Hein MY, Geiger T, Mann M and Cox J: The Perseus computational
platform for comprehensive analysis of (prote)omics data. Nat
Methods. 13:731–740. 2016. View Article : Google Scholar : PubMed/NCBI
|
|
40
|
Chawade A, Alexandersson E and Levander F:
Normalyzer: A tool for rapid evaluation of normalization methods
for omics data sets. J Proteome Res. 13:3114–3120. 2014. View Article : Google Scholar : PubMed/NCBI
|
|
41
|
Waas M, Snarrenberg ST, Littrell J, Jones
Lipinski RA, Hansen PA, Corbett JA and Gundry RL: SurfaceGenie: A
web-based application for prioritizing cell-type specific marker
candidates. Bioinformatics. 36:3447–3456. 2020. View Article : Google Scholar : PubMed/NCBI
|
|
42
|
Kowal J, Arras G, Colombo M, Jouve M,
Morath JP, Primdal-Bengtson B, Dingli F, Loew D, Tkach M and Théry
C: Proteomic comparison defines novel markers to characterize
heterogeneous populations of extracellular vesicle subtypes. Proc
Natl Acad Sci USA. 113:E968–E977. 2016. View Article : Google Scholar : PubMed/NCBI
|
|
43
|
Tadokoro H, Umezu T, Ohyashiki K, Hirano T
and Ohyashiki JH: Exosomes derived from hypoxic leukemia cells
enhance tube formation in endothelial cells. J Biol Chem.
288:34343–34351. 2013. View Article : Google Scholar : PubMed/NCBI
|
|
44
|
Chandran RK, Geetha N, Sakthivel KM,
Aswathy CG, Gopinath P, Raj TVA, Priya G, Nair JKKM and Sreedharan
H: Genomic amplification of BCR-ABL1 fusion gene and its impact on
the disease progression mechanism in patients with chronic
myelogenous leukemia. Gene. 686:85–91. 2019. View Article : Google Scholar
|
|
45
|
Hu J, Wang S, Zhao Y, Guo Q, Zhang D, Chen
J, Li J, Fei Q and Sun Y: Mechanism and biological significance of
the overexpression of IFITM3 in gastric cancer. Oncol Rep.
32:2648–2656. 2014. View Article : Google Scholar : PubMed/NCBI
|
|
46
|
Zhang D, Wang H, He H, Niu H and Li Y:
Interferon induced transmembrane protein 3 regulates the growth and
invasion of human lung adenocarcinoma. Thorac Cancer. 8:337–343.
2017. View Article : Google Scholar : PubMed/NCBI
|
|
47
|
Yang M, Gao H, Chen P, Jia J and Wu S:
Knockdown of interferon-induced transmembrane protein 3 expression
suppresses breast cancer cell growth and colony formation and
affects the cell cycle. Oncol Rep. 30:171–178. 2013. View Article : Google Scholar : PubMed/NCBI
|
|
48
|
Gan CP, Sam KK, Yee PS, Zainal NS, Lee
BKB, Abdul Rahman ZA, Patel V, Tan AC, Zain RB and Cheong SC:
IFITM3 knockdown reduces the expression of CCND1 and CDK4 and
suppresses the growth of oral squamous cell carcinoma cells. Cell
Oncol (Dordr). 42:477–490. 2019. View Article : Google Scholar
|
|
49
|
Liu Y, Lu R, Cui W, Pang Y, Liu C, Cui L,
Qian T, Quan L, Dai Y, Jiao Y, et al: High IFITM3 expression
predicts adverse prognosis in acute myeloid leukemia. Cancer Gene
Ther. 27:38–44. 2019. View Article : Google Scholar : PubMed/NCBI
|
|
50
|
Lehmann JM, Riethmuller G and Johnson JP:
MUC18, a marker of tumor progression in human melanoma, shows
sequence similarity to the neural cell adhesion molecules of the
immuno-globulin superfamily. Proc Natl Acad Sci USA. 86:9891–9895.
1989. View Article : Google Scholar
|
|
51
|
Lei X, Guan CW, Song Y and Wang H: The
multifaceted role of CD146/MCAM in the promotion of melanoma
progression. Cancer Cell Int. 15:32015. View Article : Google Scholar : PubMed/NCBI
|
|
52
|
Wu GJ and Dickerson EB: Frequent and
increased expression of human METCAM/MUC18 in cancer tissues and
metastatic lesions is associated with the clinical progression of
human ovarian carcinoma. Taiwan J Obstet Gynecol. 53:509–517. 2014.
View Article : Google Scholar : PubMed/NCBI
|
|
53
|
Watson-Hurst K and Becker D: The role of
N-cadherin, MCAM and beta3 integrin in melanoma progression,
proliferation, migration and invasion. Cancer Biol Ther.
5:1375–1382. 2006. View Article : Google Scholar : PubMed/NCBI
|
|
54
|
Tripathi SC, Fahrmann JF, Celiktas M,
Aguilar M, Marini KD, Jolly MK, Katayama H, Wang H, Murage EN,
Dennison JB, et al: MCAM Mediates Chemoresistance in Small-Cell
Lung Cancer via the PI3K/AKT/SOX2 signaling pathway. Cancer Res.
77:4414–4425. 2017. View Article : Google Scholar : PubMed/NCBI
|
|
55
|
Liang YK, Zeng D, Xiao YS, Wu Y, Ouyang
YX, Chen M, Li YC, Lin HY, Wei XL, Zhang YQ, et al: MCAM/CD146
promotes tamoxifen resistance in breast cancer cells through
induction of epithelial-mesenchymal transition, decreased ERα
expression and AKT activation. Cancer Lett. 386:65–76. 2017.
View Article : Google Scholar
|
|
56
|
Ye H, Adane B, Khan N, Sullivan T,
Minhajuddin M, Gasparetto M, Stevens B, Pei S, Balys M, Ashton JM,
et al: Leukemic stem cells evade chemotherapy by metabolic
adaptation to an adipose tissue niche. Cell Stem Cell. 19:23–37.
2016. View Article : Google Scholar : PubMed/NCBI
|
|
57
|
Landberg N, von Palffy S, Askmyr M,
Lilljebjörn H, Sandén C, Rissler M, Mustjoki S, Hjorth-Hansen H,
Richter J, Ågerstam H, et al: CD36 defines primitive chronic
myeloid leukemia cells less responsive to imatinib but vulnerable
to anti-body-based therapeutic targeting. Haematologica.
103:447–455. 2018. View Article : Google Scholar :
|
|
58
|
Bailey CC, Zhong G, Huang IC and Farzan M:
IFITM-Family Proteins: The Cell's First Line of Antiviral Defense.
Annu Rev Virol. 1:261–283. 2014. View Article : Google Scholar
|
|
59
|
Wrensch F, Winkler M and Pöhlmann S: IFITM
proteins inhibit entry driven by the MERS-coronavirus spike
protein: Evidence for cholesterol-independent mechanisms. Viruses.
6:3683–3698. 2014. View Article : Google Scholar : PubMed/NCBI
|
|
60
|
Nollet M, Stalin J, Moyon A, Traboulsi W,
Essaadi A, Robert S, Malissen N, Bachelier R, Daniel L,
Foucault-Bertaud A, et al: A novel anti-CD146 antibody specifically
targets cancer cells by internalizing the molecule. Oncotarget.
8:112283–112296. 2017. View Article : Google Scholar
|
|
61
|
Stalin J, Nollet M, Dignat-George F,
Bardin N and Blot-Chabaud M: Therapeutic and Diagnostic Antibodies
to CD146: Thirty Years of Research on Its Potential for Detection
and Treatment of Tumors. Antibodies (Basel). 6:172017. View Article : Google Scholar
|
|
62
|
Wang H, Tang F, Bian E, Zhang Y, Ji X,
Yang Z and Zhao B: IFITM3/STAT3 axis promotes glioma cells invasion
and is modulated by TGF-β. Mol Biol Rep. 47:433–441. 2020.
View Article : Google Scholar
|
|
63
|
Johnston PA and Grandis JR: STAT3
signaling: Anticancer strategies and challenges. Mol Interv.
11:18–26. 2011. View Article : Google Scholar : PubMed/NCBI
|
|
64
|
Hochhaus A, Baccarani M, Silver RT,
Schiffer C, Apperley JF, Cervantes F, Clark RE, Cortes JE,
Deininger MW, Guilhot F, et al: European LeukemiaNet 2020
recommendations for treating chronic myeloid leukemia. Leukemia.
34:966–984. 2020. View Article : Google Scholar : PubMed/NCBI
|
|
65
|
Perez-Riverol Y, Csordas A, Bai J,
Bernal-Llinares M, Hewapathirana S, Kundu DJ, Inuganti A, Griss J,
Mayer G, Eisenacher M, et al: The PRIDE database and related tools
and resources in 2019: Improving support for quantification data.
Nucleic Acids Res. 47:D442–D450. 2019. View Article : Google Scholar :
|