Introduction
Osteosarcoma (OS) is the most common primary
malignant bone tumor in children and adolescents, and it is
characterized by malignant spindle stromal cells (1). Great progress has been made in the
treatment of OS. Currently, the main treatment methods include
surgical resection, neoadjuvant chemotherapy, radiotherapy, and
immunotherapy, but the prognosis of patients has not significantly
improved (2). According to the
literature, the 5-year survival rate for patients with OS is
between 37.5 and 77.6%; however, the average survival time of
patients with recurrence or pulmonary metastasis is generally less
than one year, and the 5-year survival rate is often less than 20%
(3). Therefore, it is crucial to
elucidate the molecular mechanisms underlying the occurrence and
development of OS and to search for new molecular markers and
therapeutic targets.
Long non-coding RNAs (lncRNAs) play an important
role in OS and can significantly regulate pathophysiological
processes and phenotypes, including gene expression, chromatin
remodeling, and post-transcriptional regulation (4). LncRNAs can play an important role by
targeting microRNAs (miRNAs or miRs), signaling pathways,
cytokines, and genes (5).
Previous studies by our group have shown that lncRNAs, as
competitive endogenous RNAs or 'molecular baits' regulate the
expression of miRNAs and are involved in the occurrence,
development, and metastasis of OS (6,7).
With the advancement of research, a variety of lncRNAs can be used
as potential prognostic indicators, biomarkers, and therapeutic
targets for OS (6,7). LncRNA AFAP1-AS1 is overexpressed in
osteosarcoma and plays an oncogenic role in OS through the
RhoC/ROCK1/p38MAPK/Twist1 signaling pathway, these findings
indicated a novel molecular mechanism underlying the tumorigenesis
and progression of OS. AFAP1-AS1 could serve as a promising
therapeutic target in OS treatment (7).
Cancer cells use glycolysis for energy supply
regardless of whether they are in an anoxic environment, which is
also known as aerobic glycolysis or the Warburg effect (8). Pyruvate kinase M2 (PKM2) is a key
enzyme involved in glycolysis (9). In recent years, studies have found
that PKM2 is overexpressed in cancer tissues and, in addition to
regulating metabolism, PKM2 can also enter the nucleus and
participate in gene transcription regulation (10-12). The overexpression of PKM2 predicts
a poor prognosis for patients with OS, and PKM2 may serve as a
novel target for treatment (13).
Another study confirmed that metformin increased the sensitivity of
OS stem cells to cisplatin by inhibiting the expression of PKM2
(14). The miR-1294/PKM2
signaling cascade plays important roles in the regulation of OS
progression (15).
Through direct binding to specific sequence
element(s), RNA binding proteins (RBPs) play a pivotal role in co-
and post-transcriptional RNA regulatory events (16). Acquisition of a drug-resistant
(DR) phenotype relies on the upregulation of the polypyrimidine
tract binding protein 1 (PTBP1), which in turn is recruited to the
pyruvate kinase pre-mRNA and favors splicing of the oncogenic PKM2
variant (17). Although the
association between PKM2 and OS has been previously reported
(18), the function and mechanism
of PKM2 as an RBP in OS, have not been studied. The targeted
regulation of PKM2 by multiple pathways to inhibit the
proliferation, migration, and invasion of cancer cells and promote
their apoptosis has become a new direction in the treatment of
cancers (19).
To study the potential function of PKM2 in OS,
PKM2-bound RNAs in HeLa cells were obtained. Peak calling analysis
revealed that PKM2 binds to lncRNAs associated with cancer
pathogenesis and development. The PKM2-lncRNA interaction in the
human OS cell line was then validated, showing that the lncRNA
colon cancer associated transcript-1 (lncCCAT1) regulated the
proliferation of OS through PKM2 and promoted the Warburg effect.
The specific mechanism of action was as follows: lncCCAT1 promoted
the dephosphorylation of PKM2 in the nucleus by recruiting Cdc25A,
which in turn promoted glycolysis. LncCCAT1 promoted fat synthesis
in OS, and PKM2 phosphorylated sterol regulatory element-binding
protein 2 (SREBP2) at T610 without impairing kinase activity. These
findings support the hypothesis that PKM2 is a key regulatory gene
in OS as an RBP. PKM2 could function in OS by binding to lncCCAT1,
further extending the biological functions of PKM2 in tumorigenesis
and thereby, making it a novel potential therapeutic for OS.
Materials and methods
Cell culture
All cell lines, including HeLa (cat. no. TCHu187),
hFOB 1.19 (cat. no. GNHu14), HOS (cat. no. TCHu167), and U2OS (cat.
no. SCSP-5030) were purchased from the Cell Bank of the Typical
Culture Preservation Committee of the Chinese Academy of Sciences
[National Center of Authenticated Cell Cultures (NCACC)]. KHOS-240S
(cat. no. CRL-1545) was obtained from the American Type Culture
Collection. These cells were routinely cultured in RPMI-1640 medium
(HyClone; Cytiva) and supplemented with 10% (v/v) FBS (HyClone;
Cytiva) and 1% penicillin-streptomycin (Gibco; Thermo Fisher
Scientific, Inc.). All the cells were cultured in 5% CO2
at 37°C. Protein expression and reconstitution experiments were
conducted using the established stable cell lines. All cell lines
were routinely tested for mycoplasma infection and confirmed to be
negative.
Plasmid overexpression
Primer pairs used for hot fusion were designed using
CE Design V1.04 (Vazyme Biotech Co., Ltd.). Each primer comprised a
fragment of a gene-specific sequence and a 17-30 bp sequence of the
pIRES-hrGFP-1a vector (forward primer, agc ccg ggc gga tcc gaa ttc
ATG TCG AAG CCC CAT AGT GAA G and reverse primer, gtc atc ctt gta
gtc ctc gag CGG CAC AGG AAC AAC ACG C). The pIRES-hrGFP-1a vector
was digested with EcoRI and XhoI (New England
BioLabs, Inc.) at 37°C for ~2-3 h. The enzyme-digested vector was
then run on a 1.0% agarose gel and purified using a QIAGEN GmbH
column kit (cat. no. 12123; QIAGEN GmbH) according to the
manufacturer's instructions. Total RNA was isolated from HeLa cells
using TRIzol (cat. no. 15596-018; Invitrogen; Thermo Fisher
Scientific, Inc.). Purified RNA was transcribed for cDNA using
oligodT primers. The insert fragment was then synthesized by PCR
amplification. A linearized vector digested by EcoRI and
XhoI and the PCR insert were added to a PCR microtube for
ligation with ClonExpress® II One Step Cloning Kit
(Vazyme Biotech Co., Ltd.). Plasmids were introduced into the
Escherichia coli strain (cat. no. EC11303; Sigma-Aldrich;
Merck KGaA) by chemical transformation. A total of 5×10⁵
cells were plated onto LB agar plates containing 1 µl/ml
ampicillin (cat. no. A6920; Beijing Solarbio Science &
Technology Co., Ltd.), and incubated overnight at 37°C. Colonies
were screened by colony PCR (28 cycles) using universal primers
(located on the backbone vector). The insert sequence was verified
by Sanger sequencing. GAPDH was used as the control gene to assess
the effects of PKM2 or SREBP2 overexpression via reverse
transcription-quantitative PCR (RT-qPCR) and western blotting.
Comparisons were performed using the paired Student's t-test using
GraphPad Prism software v9.2.0 (GraphPad Software, Inc.).
Short hairpin RNA (shRNA)
transfection
To stably knockdown lncCCAT1 or PKM2, specific
shRNAs as well as corresponding controls (sh-NC) were synthesized
by Sangon Biotech Co., Ltd. The shRNA sequences were then were
subcloned into pSUPER vectors (OligoEngine) as previously described
(20). For stable transfection,
OS cells reaching 80% confluency were transfected with pSUPER
plasmids containing indicated shRNAs (2.5 µg/ml) by the use
of Lipofectamine 2000 (Invitrogen; Thermo Fisher Scientific, Inc.)
at 25°C for 15 min, followed by treatment with 600 µg/ml
G418 (1 mg/ml; Stratagene; Agilent Technologies, Inc.) for 2 weeks.
Thereafter, the stably transfected cells were selected from the
remaining colonies. The selected cells were further kept for two
weeks before following application. The transfection efficiency was
verified using RT-qPCR. The sequences of shRNAs used are provided
in Table SI.
Immunoprecipitation (IP)
HeLa cells (5×10⁶) were first lysed in
ice-cold lysis buffer (1X PBS, 0.5% sodium deoxycholate, 0.1% SDS
and 0.5% NP40) with RNase inhibitor (Takara Bio, Inc.) and a
protease inhibitor (Beijing Solarbio Science & Technology Co.,
Ltd.) on ice for 5 min. The mixture was then vigorously vibrated
and centrifuged at 13,000 × g at 4°C for 20 min to remove cell
debris. The supernatant was incubated with DynaBeads protein A/G
(Thermo Fisher Scientific, Inc.) conjugated with anti-FLAG antibody
(MDL no. MFCD02262912) or normal IgG (MDL no. MFCD00212351; both
from Sigma Aldrich; Merck KGaA) at 4°C overnight. The beads were
washed with low-salt wash buffer, high-salt wash buffer, and 1X PNK
buffer (product no. SAB4200134; Sigma Aldrich; Merck KGaA). The
beads were resuspended in elution buffer and then divided into two
groups, one for RNA isolation from PKM2-RNA complexes and the other
for the western blotting assay for PKM2.
Improved RNA immunoprecipitation
sequencing (iRIP-seq) library preparation and sequencing
Cells were cross-linked on ice with UV irradiation
type C (254 nm) at 400 mJ per cm2 in the presence of
cold PBS (4 ml per 15-cm dish). Cells were scraped off and pelleted
at 1,000 × g at 4°C and stored at -80°C until further use. Cells
lysis was performed in cold wash buffer (1X PBS, 0.1% SDS, 0.5%
NP-40 and 0.5% sodium deoxycholate) supplemented with a 200 U/ml
RNase inhibitor (Takara Biotechnology Co., Ltd.) and protease
inhibitor cocktail (Roche Diagnostics) and incubated on ice for 30
min. The clear cells were lysed by centrifugation at 13,200 × g for
10 min at 4°C followed by the addition of RQ I (1 U/µl;
Promega Corporation) to a final concentration of 1 U/µl and
incubation in a water bath for 3 min at 37°C. A cooling reaction
was subsequently performed for 5 min on ice before proceeding, and
the reaction was terminated with the addition of EDTA. For
immunoprecipitation, the supernatant was incubated overnight at 4°C
with 10 µg Flag-antibody and control IgG-antibody. The
immunoprecipitation was further incubated with protein A/G
Dynabeads for 2 h at 4°C. After applying a magnet and removing the
supernatants, the beads were sequentially washed with lysis buffer,
high-salt buffer (250 mM Tris 7.4, 750 mM NaCl, 10 mM EDTA, 0.1%
SDS, 0.5% NP-40 and 0.5 deoxycholate), and PNK buffer (50 mM Tris,
20 mM EGTA and 0.5% NP-40) two times, respectively. The beads were
resuspended in Elution buffer (50 nM Tris 8.0, 10 mM EDTA and 1%
SDS), and the suspension was incubated for 20 min in a heat block
at 70°C to release the immunoprecipitated RBP with crosslinked RNA
and vortex. The magnetic beads were removed on the separator. The
supernatant was transferred to a clean 1.5-ml microfuge tube.
Proteinase K (Roche Diagnostics) was added into the 1% input
(without immunoprecipitated) and immunoprecipitated RBP with
crosslinked RNA, with a final concentration of 1.2 mg/ml and
incubated for 120 min at 55°C. The RNA was purified with TRIzol
reagent. The Illumina ScriptSeq™ v2 RNA-Seq Library Preparation Kit
(Epicentre; Illumina Inc.) was used for the cDNA libraries. The
cDNAs were purified and amplified; PCR products corresponding to
200-500 bps were purified, quantified and stored at −80°C until
used for sequencing. PKM2-bound RNAs were isolated by IP of
anti-FLAG using TRIzol. cDNA libraries were prepared with the KAPA
RNA Hyper Prep Kit (kit code KK8541; KAPA Biosystems, Inc.; Roche
Diagnostics) according to the manufacturer's protocol. The quality
of samples was identified by FastQC v0.11.6 (http://www.bioinformatics.babraham.ac.uk/projects/fastqc/),
and high-throughput sequencing of the cDNA libraries was performed
on the Illumina X10 platform (Illumina, Inc.) for 150 bp paired-end
sequencing. The series record GSE184327 (https://www.ncbi.nlm.nih.gov/geo/query/acc.cgi?acc=GSE184327)
provides access to all of our data and is the accession no. that
should be quoted in any manuscript referring to the data. For
high-throughput sequencing, the libraries were prepared following
the manufacturer's instructions and applied to an Illumina
Nextseq500 system for 150 nt paired-end sequencing by ABlife
(Wuhan), Inc.
RT-qPCR
Total RNA was isolated from the cells using the
E.Z.N.A® Total RNA Kit I R6834 (Omega Bio-Tek, Inc.),
and the RNA was measured using NanoDrop ND-1000 (Thermo Fisher
Scientific, Inc.). Purified RNA was reverse-transcribed into cDNA
(25°C, 5 min; 42°C, 1 h; and 70°C, 5 min) using the HiScript III RT
SuperMix (Vazyme Biotech Co., Ltd.). RT-qPCR (95°C for 5 min and 30
cycles at 95°C for 10 sec, 57°C for 30 sec and 72°C for 30 sec, and
finally 72°C for 10 min) was then performed using the Step One
system (Applied Biosystems™; Thermo Fisher Scientific, Inc.) and
AceQ Universal SYBR qPCR Master Mix (Vazyme Biotech Co., Ltd.).
Gene expression was calculated using the 2−ΔΔCq method
(21) and normalized to the
reference gene GAPDH. Primer sequences are presented in Table SI.
Data analysis of iRIP-seq
After reads were aligned onto the genome, only
uniquely mapped reads were used for subsequent analysis. The ABLIRC
strategy was used to identify the binding regions of PKM2 on the
genome (22). Reads with an
overlap of at least 1 bp were clustered as peaks. For each gene, a
computational simulation was used to randomly generate reads with
the same number and length as the reads in the peaks. The output
reads were further mapped to the same genes to generate a random
maximum peak height from the overlapping reads. The entire process
was repeated 500 times. All the observed peaks with heights higher
than those of the random max peaks (P<0.05) were selected. The
IP and input samples were independently analyzed by the simulation,
and the IP peaks that overlapped with the input peaks were removed.
The target genes of IP were finally determined by the peaks, and
the binding motifs of the IP protein were revealed using the HOMER
software (http://bio.informatics.iupui.edu/homer). The fuzznuc
software (EMBOSS; http://embossgui.sourceforge.net/demo/fuzznuc.html)
was used to obtain the specific positions of the two motifs on
lncRNANEAT1, lncRNAPVT1, and lncCCAT1 combined with the peak.
Functional enrichment analysis
To sort out functional categories of peak-associated
genes (target genes), Gene Ontology (GO) terms and Kyoto
Encyclopedia of Genes and Genomes (KEGG) pathways were identified
using KOBAS 2.0 (http://kobas.cbi.pku.edu.cn) (23). The hypergeometric test and
Benjamini-Hochberg false discovery rate control procedure were used
to define the enrichment of each term.
Western blotting
The sample of cells was resuspended in 40 liters
elution buffer [50 mM Tris-Cl (pH 8.0), 10 mM EDTA (pH 8.0), and 1%
SDS], and incubated at 70°C for 20 min with shaking (13,200 × g).
The sample was then pulse-centrifuged at 13,200 × g and the
supernatant was transferred to a new Eppendorf tube placed on a
magnetic separator. The complexed samples were eluted after boiling
in water with 1X SDS buffer for 10 min. The protein concentration
was evaluated using BCA Pierce Protein Assay Kit (Pierce
Biotechnology, Inc.; Thermo Fisher Scientific, Inc.). Subsequently,
20 µg of proteins was loaded and separated by 10% SDS-PAGE,
followed by transferring to polyvinylidene fluoride (PVDF)
membranes (Roche Diagnostics). TBST buffer (20 mM Tris-buffered
saline and 0.1% Tween-20) containing 5% non-fat milk powder was
used for incubating the membranes for 1 h at room temperature. The
membranes were then processed with primary antibodies for 1 h at
room temperature, and then with HRP-conjugated secondary antibody
(product code ab288151; 1:10,000; Abcam) at room temperature for 1
h. Finally, the bands were visualized using the enhanced
chemiluminescence (ECL) reagent (EMD Millipore) and quantified via
the ImageJ2X version 1.8.0 software (National Institutes of
Health). The primary antibodies were as follow: PKM2 (product code
ab85555; 1:500), hexokinase 2 (HK2; product code ab209847;
1:1,000), 6-phosphofructo-2-kinase/fructose-2,6-bisphosphatase-3
(PFKFB3; product code ab181861; 1:2,000), lactate dehydrogenase
(LDHA; product code ab52488; 1:10,000); pyruvate dehydrogenase
kinase 1 (PDK1; product code ab202468; 1:2,000; all from Abcam),
p-PKM2S37 (cat. no. 11456; 1:1,000; Signalway Antibody
LLC), Cdc25A (cat. no. 21145; 1:1,000; Signalway Antibody LLC),
acetyl-coenzyme A carboxylase 1 (ACC1; product code ab45174;
1:2,000; Abcam), ATP citrate lyase (ACLY; product code ab40793;
1:10,000; Abcam), fatty acyl-CoA elongase 6 (ELOVL6; cat. no.
24672; 1:500; Signalway Antibody LLC), fatty acid synthase (FASN;
product code ab128870; 1:10,000; Abcam), stearoyl-CoA desaturase 1
(SCD1; product no. 2794; 1:1,000; Cell Signaling Technology, Inc.),
stearoyl-CoA desaturase 5 (SCD5; cat. no. 27911; 1:2,000; Signalway
Antibody LLC), SREBP2 (product code ab30682; 1:1,000), α-Actinin
(product code ab68194; 1:1,000), and Histone-H3 (product code
ab1791, 1:5,000; all from Abcam).
Fluorescence in situ hybridization (FISH)
analysis
HOS and U2OS cells grown on slides were washed with
PBS and fixed with 4% paraformaldehyde for 10 min at 72°C.
Following treatment with the protease reagent, the slides were
incubated with pre-hybridization buffer at 40°C for 4 h, and then
hybridized overnight with a digoxin-labeled probe at 40°C. After
washing by PBS, the slides were incubated with a HRP-conjugated
anti-digoxin antibody (cat. no. NEF832001EA; PerkinElmer, Inc.).
The slides were then incubated with SABC-FITC at 37°C for 30 min
after washing, followed by processing with 0.2 µmol/l
4′,6-diamidino-2-phenylindole (cat. no. D9542; Sigma Aldrich; Merck
KGaA) containing antifade mounting solution. The images were
obtained under a fluorescence microscope (Leica, SP8 laser confocal
microscope). The lncCCAT1 FISH probe sequence is presented in
Table SI.
Cell viability assay
Cell viability was measured using Cell Counting
Kit-8 (CCK-8) (Sigma Aldrich; Merck KGaA) in accordance with the
manufacturer's instructions. According to the experimental grouping
design, 2,000 HOS and U2OS cells were seeded in each of the 96
wells of the plates overnight at 37°C, and then further cultured
for 0, 24 48, or 72 h. CCK-8 solution (10 µl; Dojindo
Molecular Technologies, Inc.) was then added, and the absorbance at
450 nm was measured using a SpectraMax microtitration plate reader
(Molecular Devices, LLC).
5-Ethynyl-20-deoxyuridine (EdU)
assay
EdU staining was performed according to the
instructions of the EdU kit (Guangzhou RiboBio Co., Ltd.). In
short, 4×10³ HOS and U2OS cells were cultured in DMEM
containing EdU for 2 h at 37°C. The cells were fixed in 4%
formaldehyde for 30 min. After staining with DAPI for 10 min at
37°C, EdU-positive cells were observed and counted under a
fluorescence microscope (Nikon Corporation).
Colony formation assay
A total of 800 HOS and U2OS cells were seeded into
12-well plates and incubated at 37°C for 2 weeks. OS cells were
fixed with 4% paraformaldehyde at 37°C for 60 min and stained with
2% crystal violet at 37°C for 20 min. Colonies with >50 cells
were counted. Images were obtained using a camera (Nikon
Corporation).
Glucose uptake assay
The glucose uptake capacity of HOS and U2OS cells
was measured using a glucose assay kit (cat. no. N13195; Thermo
Fisher Scientific, Inc.) according to the manufacturer's
instructions. First, cells were seeded in 96-well plates
(5×10⁴ cells/well) and cultured in DMEM without glucose.
The cells were then rinsed with PBS and incubated with 2-NBDG at
37°C for 30 min. When the cells were rewashed with HBSS, the
fluorescence intensity of the cells was detected.
Lactate content measurement
The L-Lactate Assay Kit (cat. no. 700510; Cayman
Chemical Company) was used to assess both the intracellular and
extracellular lactate content of HOS and U2OS cells. OS cells
(5×10⁴) were first cultured at 4°C in DMEM basic medium
containing 10% FBS and then in DMEM basic medium containing 0.5%
FBS for 4 h. After collecting the cells, the lactate content was
measured according to the manufacturer's instructions.
Extracellular acidification rate (ECAR)
and oxygen consumption rate (OCR) analyses
According to the manufacturer instructions (Seahorse
Bioscience, Inc.; Agilent Technologies, Inc.), the ECAR and OCR of
HOS and U2OS cells were measured in a 96-well plate
(5×10⁴ cells/well) using Seahorse XF Analyzers. One day
prior to the experiment, the cells were placed on cell culture
microplates. When ECAR was measured, 10 mM glucose, 1 µM
oligomycin, and 100 mM 2-deoxyglucose were added first. When OCR
was detected, 1 µM oligomycin, 1 µM FCCP, and 1
µM rotenone were added to the microplates. The ECAR and OCR
values were calculated according to methods reported in the
literature (24).
NADPH/NADP+ assay
According to the experimental methods reported in
the literature (25), HOS and
U2OS cells (1×10⁵ cells/well) were cultured in 6-well
plates for 48 h and then in glucose-free medium. The cells were
extracted with an extraction buffer, and the supernatant containing
NADPH/NADP+ was extracted after centrifugation (10,000 ×
g at 37°C for 10 min). The supernatant was heated at 60°C for 30
min to decompose NADP+, then cooled on ice, and quickly
spun to remove the sediment. Part of the supernatant was reacted
with NADP+ circulation buffer and enzyme mixture for 5
min at room temperature to convert NADP+ to NADPH. OS
cells were analyzed using the NADPH assay kit (product code
ab65349; Abcam) according to the manufacturer's instructions and
the NADP+/NADPH quantification kit (cat. no. S0179;
Beyotime Institute of Biotechnology) according to the
manufacturer's instructions.
NAD+ assay
Complex I, also known as NADH dehydrogenase,
catalyzes the dehydrogenation of NADH to NAD+. The
activity of this enzyme was calculated by measuring the oxidation
rate of NADH at 340 nm. According to the operation method reported
in the literature (26),
NAD+ was detected using the Micro Mitochondrial
Respiratory Chain Complex I Activity Assay Kit (cat. no. BC0515;
Beijing Solarbio Science & Technology Co., Ltd.) according to
the manufacturer's instructions.
Glutathione (GSH) measurement
GSH levels were determined using the GSH-Glo™ assay
(cat. no. V6912, Promega Corporation). Fluorescein derivatives were
converted to fluorescein in the presence of GSH. According to the
manufacturer's instructions, the cells were incubated with 2.1 mM
GSH-Glo™ reagent for 30 min at 25°C. Luminescence was detected
using a BioTek Synergy H1 Hybrid plate reader (BioTek Instruments,
Inc.).
ATP measurement
HOS and U2OS cells were inoculated onto 96-well
plates at ~8,000 cells/well, after interference with lncCCAT1,
following the manufacturer's instructions to carry out the
experiment (ATPlite; PerkinElmer, Inc.). The BMG (Thermo Fisher
Scientific, Inc.) reader was used to screen all the plates to
obtain the luminescence signal, and the ATP concentration was
normalized to the protein concentration.
Glucose 6-phosphate production
analysis
HOS and U2OS cells were incubated with L-arginine
(cat. no. A0013; Beijing Solarbio Science & Technology Co.,
Ltd.) and glucose-free F-12K (cat. no. 21127022, Gibco; Thermo
Fisher Scientific, Inc.) medium for 30 min at 37°C and then
incubated with 7 mM L-glucose (cat. no. 20829; Cayman Chemical
Company), 1 mM L-arginine, or 1 mM D-arginine (cat. no. A769515;
Toronto Research Chemicals) for another 30 min at 37°C. Cell
lysates were then collected and glucose 6-phosphate content was
determined using a Glucose-6-Phosphate Fluorometric Assay kit (cat.
no. 700750-96 wells; Cayman Chemical Company). Finally, the
concentration of glucose 6-phosphate in cells was determined
according to the methods reported in the literature (27).
3-Phosphoglycerate (3-PG) production
analysis
The production of 3-PG was determined according to
the methods reported in the literature (28). The reaction buffer consisted of
200 mM HEPES, 100 mM KCl, 5 mM Na2HPO4, 0.5
mM EDTA, and 5 mM MgCl2 at pH 7.4. Subsequently, 50
µl supernatant, 2 mM ATP, 0.1 mM NADH, 1 U/ml PGK, and 1
U/ml GAPDH were added to the reaction buffer.
RIP assay
According to the literature (29), the association between lncCCAT1
and PKM2 was determined using the Magna RIP RBP IP kit (cat. no.
17-700; Millipore; Merck KGaA) according to the manufacturer's
instructions. PKM2 antibodies (cat. no. 11456; 1:1,000; Signalway
Antibody LLC) were used for the RIP assay at 4°C overnight with
gentle rotation and co-precipitated RNA was used for cDNA synthesis
and evaluated by RT-qPCR.
RNA pulldown assay
A DNA fragment containing the full-length lncCCAT1
sequence or a negative control sequence was PCR-amplified using T7
RNA polymerase (cat. no. 10881767001; Roche Diagnostics). The
lncCCAT1 was labeled with biotin and the biotinylated RNA was
incubated with cell lysate overnight. Then, streptavidin magnetic
beads (cat. no. 072001; IPHASE) were added and incubated for 48 h
at 37°C. The products were treated with RNase-free DNase I (Roche
Diagnostics) and purified with an RNeasy Mini Kit (cat. no.
DXT-74134, Qiagen, Inc.), with the resulting RNA used for RT-qPCR
assays.
Co-IP
Co-IP was performed as reported previously (29), and western blotting analysis was
performed on input samples and IP samples. Co-IP verified the
effect of lncCCAT1 on the interaction between Cdc25A and PKM2 using
PhosphoSitePlus (https://www.phosphosite.org/homeAction) and
NetPhos-3.1 (https://services.healthtech.dtu.dk/service.php?NetPhos-3.1).
To further demonstrate that PKM2 acted as a phosphokinase at T610
of SREBP2, PKM2 in the cell line 293T (cat. no. SCSP-502; NCACC)
was overexpressed. The phosphorylation of PKM2 at T610 of SREBP2
was demonstrated by adding the 0.5 mM PKM2 phosphorylation
substrate phosphoenolpyruvate (PEP; product code ab34793; Abcam) at
30°C for 3 h.
GST pulldown assay
The codon-optimized sequence of PKM2 was cloned into
the expression GEX-4T-1 vector (EcoRI/XhoI, GE
Healthcare; Cytiva). Approximately 100 µg of GST and
GST-PKM2 fusion protein were immobilized in 50 µl of GSH
agarose and equilibrated before incubation at 4°C for 1 h to
capture the GST fusion proteins. Then, 1 µg GST-core fusion
protein was added and incubated at 4°C overnight. After washing
with a cracking buffer solution (cat. no. P001; Caisson Labs, Inc.)
four times at room temperature for 5 min, the proteins were eluted
in Laemmli buffer and analyzed by 10% SDS-PAGE at 95°C for 15 min
(cat. no. S1051-100; Beijing Solarbio Science & Technology Co.,
Ltd.).
IP coupled with western blotting
(IP-WB)
According to a previous study (30), OS cells were lysed with RIPA lysis
buffer, and then proteins were diluted with NET-gelatin buffer.
Subsequently, the samples were incubated with anti-bodies. After
incubation with agarose-A/G (cat. no. sc-2001; Santa Cruz
Biotechnology, Inc.) on a 40°C shaker overnight, the precipitates
were collected and washed. After adding 2X loading buffer, thermal
denaturation was performed, and the proteins were separated by 10%
SDS-PAGE at 95°C for 15 min.
Lipid synthesis assay
OS cells were inoculated in 12-well plates
(5×10⁴ cells/well) following the methods reported in the
literature (31). After 24 h, the
cells were placed in FBS-free medium containing glucose and
glutamine, and then incubated with 14C-glucose for 2 h
at 37°C. After washing OS cells with PBS, lipids were extracted
with hexane/isopropanol at room temperature. Finally, the lipids
were dissolved in chloroform and determined using a scintillation
counter (Beckman Coulter, Inc.).
Cholesterol synthesis assay
As previously reported in the literature (32), OS cells were cultured in 6-well
plates (1×10⁵ cells/well), then LPDS,
β-methylcyclodextrin, and 13C2-sodium acetate
were added and cultured for 24 h at 37°C. The cells were washed
with ice-cold PBS followed by 0.9% NaCl, and ice-cold methanol was
added. The cells were collected, centrifuged, and methanol was
added. The analysis was performed using an ultra-high-pressure
liquid chromatography system (Thermo Fisher Scientific, Inc.).
Ethical approval
The procedures were approved (approval no. S2019009)
by the Ethics Committee for Laboratory Animals of Huazhong
University of Science and Technology (Wuhan, China). The animals
were handled in strict compliance with the Guiding Principles for
the Care and Use of Animals of the American Physiological Society
(33).
Tumor xenografts
The in vivo study was approved by the Ethics
Committee for Laboratory Animals of Huazhong University of Science
and Technology (Wuhan, China). In brief, 5×10⁶ HOS cells
transfected with sh-lncCCAT1 or sh-NC (control) were suspended in
200 µl PBS and injected subcutaneously into the backs of
8-week-old BALB/C nude female mice (mean weight, 23 g; Laboratory
Animal Center, Huazhong University of Science and Technology,
Wuhan, China). A total 6 mice (n=3/group) were involved in this
experiment. No animals succumbed during this experiment. Each mouse
was housed in a separate cage in a specific pathogen-free (SPF)
laboratory (temperature, 28°C; humidity, 50%; light/dark cycle,
10/14 h cycle), with free access to food and water. Animal health
and behavior were monitored 3 times a week. The tumor size was
measured with a caliper at 7, 10, 14, 17, 21, 24 and 28 days after
inoculation (while the corresponding curves were drawn from the
results tested at 7, 14, 21 and 28 days), and the volume was
determined according to the formula of length × width2 ×
1/2. When the tumor volume reached 1,000 mm3, the mice
were euthanized via cervical dislocation. Mice were considered
sacrificed when they had no response to stimulation via tweezers.
Subsequently, the tumors were collected and weighed.
Immunohistochemical (IHC) analysis
IHC was performed as described in the literature
(34). Tumors obtained from in
vivo assays were paraffin-embedded and cut into 4-µm
thick slices, followed by transferring to glass slides. After
deparaffinization and hydration, the slides were placed in citrate
buffer (pH 6.0) and heated in a microwave oven (high fire mode, 5
min) to retrieve antigen. Following cooling at 25°C and endogenous
peroxidase removal via 3% H2O2 (10 min),
sections were stained overnight at 4°C with HK-2 (product code
ab209847; 1:500; Abcam;), LDHA (product code ab52488; 1:2,000;
Abcam), FASN (product code ab128870; 1:450; Abcam), and SCD1 (cat.
no. 2794S; 1:400; Cell Signaling Technology, Inc.). After
processing with HRP-conjugated secondary antibody (product code
ab97080; 1:2,000; Abcam) at 4°C overnight, the sections were rinsed
three times using TBST with 0.1% Tween-20 for 5 min, visualized via
3,3-diaminobenzidine (DAB) for 5 min at room temperature, and
counterstained using hematoxylin for 1 min at room temperature.
Scans were performed using an Aperio scanoscope (Leica Biosystems)
and analyzed using the Aperio Imagescope software v6.0 (Leica
Biosystems).
Statistical analyses
Three independent experiments were performed, and
data from three repeated experiments were presented as the mean ±
standard deviation (SD) and analyzed using IBM SPSS Statistics 22.0
(IBM Corp.). Student's t-test was used for the comparison between
two groups. For comparisons between three or more groups, one-way
ANOVA was performed followed by Dunnett's or Tukey's multiple
comparison test. For comparison between two or more variables,
two-way ANOVA was applied. P<0.05 was considered to indicate a
statistically significant difference.
Results
iRIP-seq of PKM2 exhibits its binding
preference on RNAs
As revealed in Fig.
S1A and B, RT-qPCR and western blotting verified PKM2
overexpression in HeLa cells, a most popular cancer cell model
widely used in the study of molecular function and mechanism.
Western blotting results revealed successful IP of PKM2 in HeLa
cells (Fig. S1C). The
hierarchically clustered Pearson correlation matrix was obtained by
comparing the transcript expression values for the input and PKM2
IP samples (Fig. S1D). The
scatter plot of read abundance across the reference genome in
paired samples showed an enriched preference for PKM2 IP samples
(Fig. S1E). The enriched reads
were distributed across the reference genome (Fig. S1F).
Peak analysis reveals the RNA binding
features of PKM2
The peak distribution across the reference genome is
presented in Fig. S2A, and the
Venn diagram revealed the overlapped peaks in two replicate
iRIP-seq samples (Fig. S2B). The
HOMER software was used for motif analysis of the top ten preferred
bound motifs of PKM2 (Fig. S2C).
The top ten enriched GO biological processes and KEGG pathways of
the PKM2-bound genes are presented in Fig. S2D.
PKM2 specifically binds to several
lncRNAs
The peak sequence of bound lncRNAs in the overlap
peak was used, and then HOMER was used to identify motifs on these
sequences. After the motif comparison of the two results, it was
determined that the two motifs AGAGAGA and UGGGU appeared
relatively consistent, and thus the fuzznuc software was used to
obtain the specific positions of the two motifs on lncRNANEAT1,
lncRNAPVT1, and lncCCAT1 combined with the peak. The number of
mRNAs, lncRNAs, small RNAS (sRNAs), and other types of RNAs bound
by PKM2 in our iRIP-seq data were also obtained (Fig. 1A). The enriched abundance of RNAs
bound by PKM2 in the IP sample and three PKM2-bound lncRNAs (PVT1,
CCAT1, and NEAT1) are highlighted (Fig. 1B). Motif presentation revealed
motif searching results for PKM2-bound lncRNAs and three specific
PKM2-bound lncRNAs (Fig. 1C). The
read density plot revealed the binding density distribution and
motif regions of these three lncRNAs (Fig. 1D).
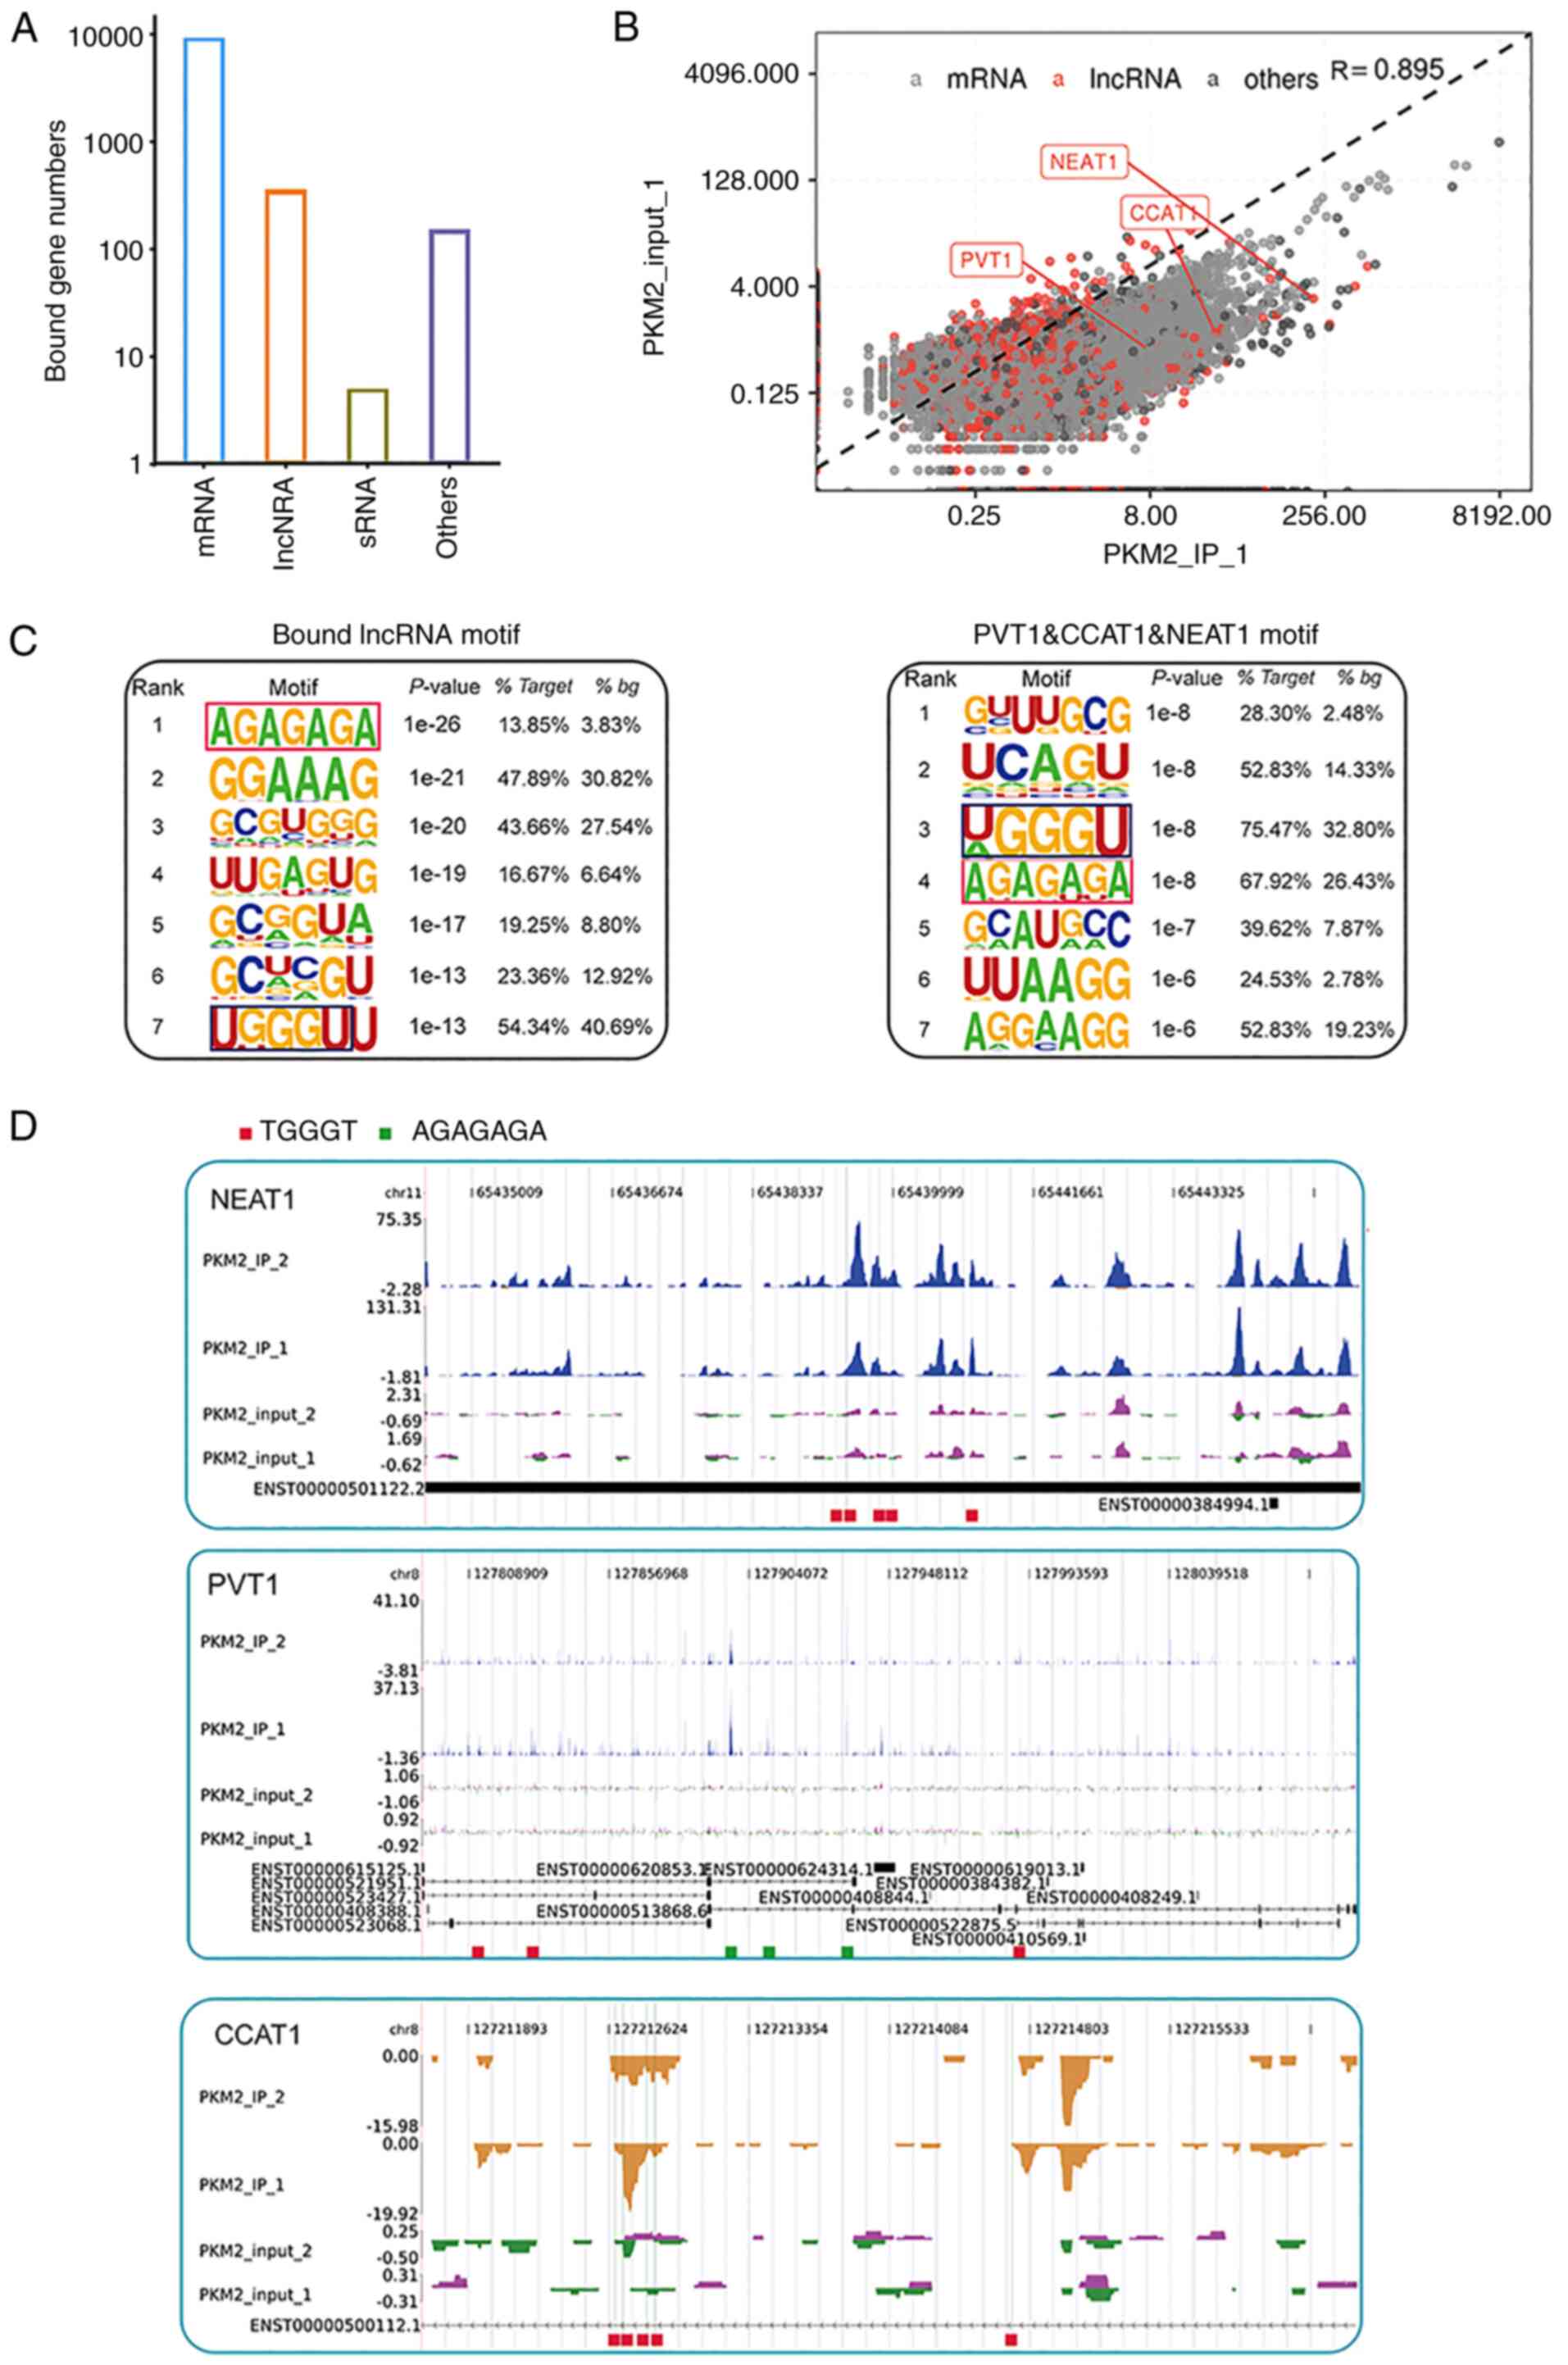 | Figure 1PKM2 specifically binds to several
lncRNAs. (A) The number of mRNAs, lncRNAs, sRNAs, and other types
of RNAs bound by PKM2 in iRIP-seq data. (B) The enriched abundance
of RNAs bound by PKM2 in the IP sample and three PKM2-bound lncRNAs
(PVT1, CCAT1, and NEAT1) are highlighted. (C) Motif presentation
revealed motif searching results for PKM2-bound lncRNAs and three
specific PKM2-bound lncRNAs. (D) The read density plot showed the
binding density distribution and motif regions of these three
lncRNAs. PMK2, pyruvate kinase M2; lncRNAs, long non-coding RNAs;
iRIP-seq, improved RNA immunoprecipitation sequencing; IP,
immunoprecipitation; sh-, short hairpin; NC, negative control. |
LncCCAT1 promotes the proliferation of OS
cells
RT-qPCR was used to detect the expression of
lncCCAT1 in human normal osteoblasts (HFOB 1.19) and OS cells (HOS,
KHOS-240S, and U2OS). The results revealed that lncCCAT1 was highly
expressed in OS cells, especially in the HOS and U2OS cell lines,
for which subsequent experiments were conducted (Fig. 2A). The distribution of lncCCAT1 in
HOS and U2OS cells after FISH was detected by fluorescence
microscopy, and the results showed that lncCCAT1 was distributed in
both the nucleus and cytoplasm (Fig.
2B), consistent with a previous study (35). The lncCCAT1 interference vector
was constructed, and the interference groups with the optimal
interference effect were selected for subsequent experiments
(Fig. S3A). The CCK-8 assay
revealed that the proliferation of HOS and U2OS cells was reduced
after interference with lncCCAT1 (Fig. 2C), and the decreased number of
positive cells in OS cells was detected by EdU (Fig. 2D). The clonal formation assay
revealed that interference with lncCCAT1 reduced the number of OS
cell clones (Fig. 2E).
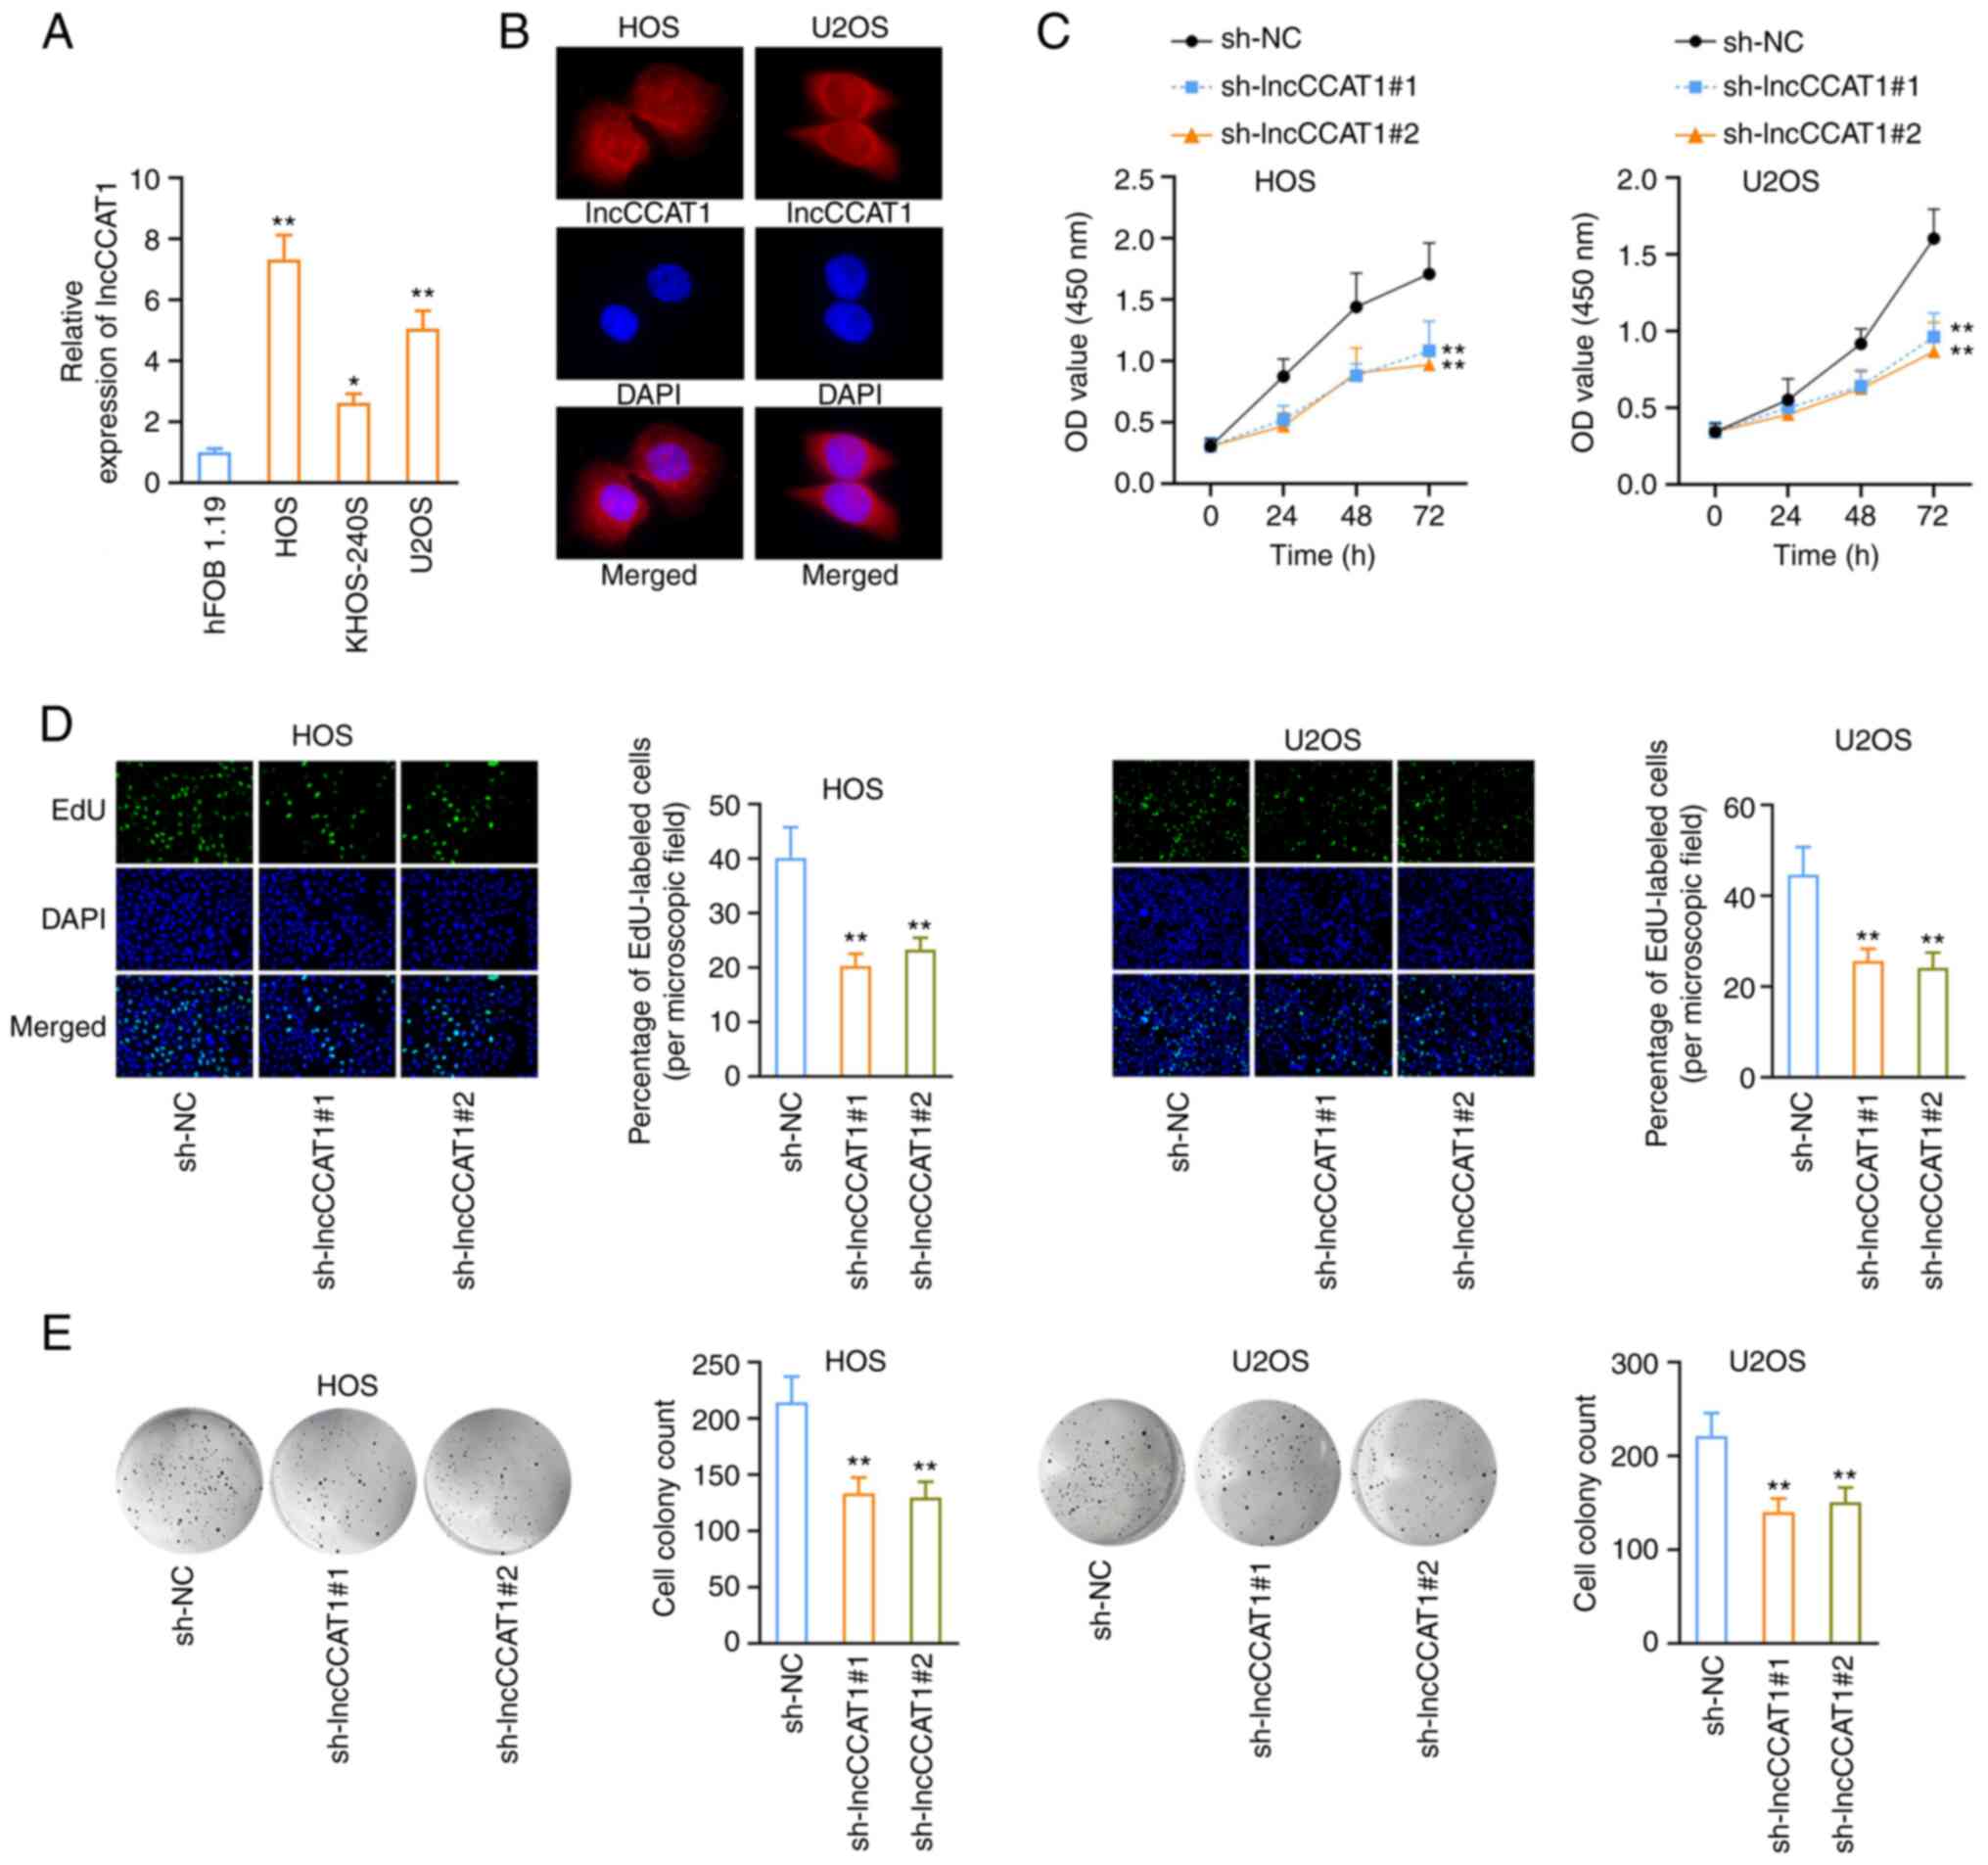 | Figure 2LncCCAT1 promotes the proliferation
of OS cells. (A) LncCCAT1 was highly expressed in OS cells,
particularly in the HOS and U2OS cell lines. (B) LncCCAT1 was
distributed in both the nucleus and cytoplasm as determined in the
FISH assay. (C and D) After interference with lncCCAT1, CCK-8 assay
revealed that the proliferation of OS cells was reduced, and the
number of positive cells was decreased as determined by EdU assay.
(E) The clonal formation assay revealed that interference with
lncCCAT1 reduced the number of OS cell clones.
*P<0.05 and **P<0.01 vs. hFOB1.19 or
sh-NC. lncCCAT1, lncRNA colon cancer associated transcript-1; OS,
osteosarcoma; FISH, fluorescence in situ hybridization;
CCK-8, Cell Counting Kit-8; EdU, 5-ethynyl-20-deoxyuridine; sh-,
short hairpin; NC, negative control. |
LncCCAT1 promotes the Warburg effect in
OS cells
Following interference with lncCCAT1, the amounts of
glucose and lactic acid in the culture medium of HOS and U2OS cells
were decreased (Fig. 3A and B).
After detecting interference with lncCCAT1 with Seahorse XF
Extracellular Flux Analyzers, the ECAR of HOS and U2OS cells was
decreased (Figs. 3C and S4A), the OCR was increased (Figs. 3D and S4B), and the relative glycolysis rate
(ECAR/OCR) was decreased (Fig.
3E). The results of the NAPDH/NAPD+ assay revealed
that the level of NAPDH/NAPD+ in OS cells decreased
after interference with lncCCAT1 (Figs. 3F and S4C). The GSH GSH-Glo™ assay revealed
that intracellular GSH levels decreased after interference with
lncCCAT1 (Fig. 3G). Following
interference with lncCCAT1, the levels of ATP (Fig. 3H) were increased, and the levels
of glucose 6-phosphate (Fig. 3I),
and 3-PG (Fig. 3J) in HOS and
U2OS cells were decreased.
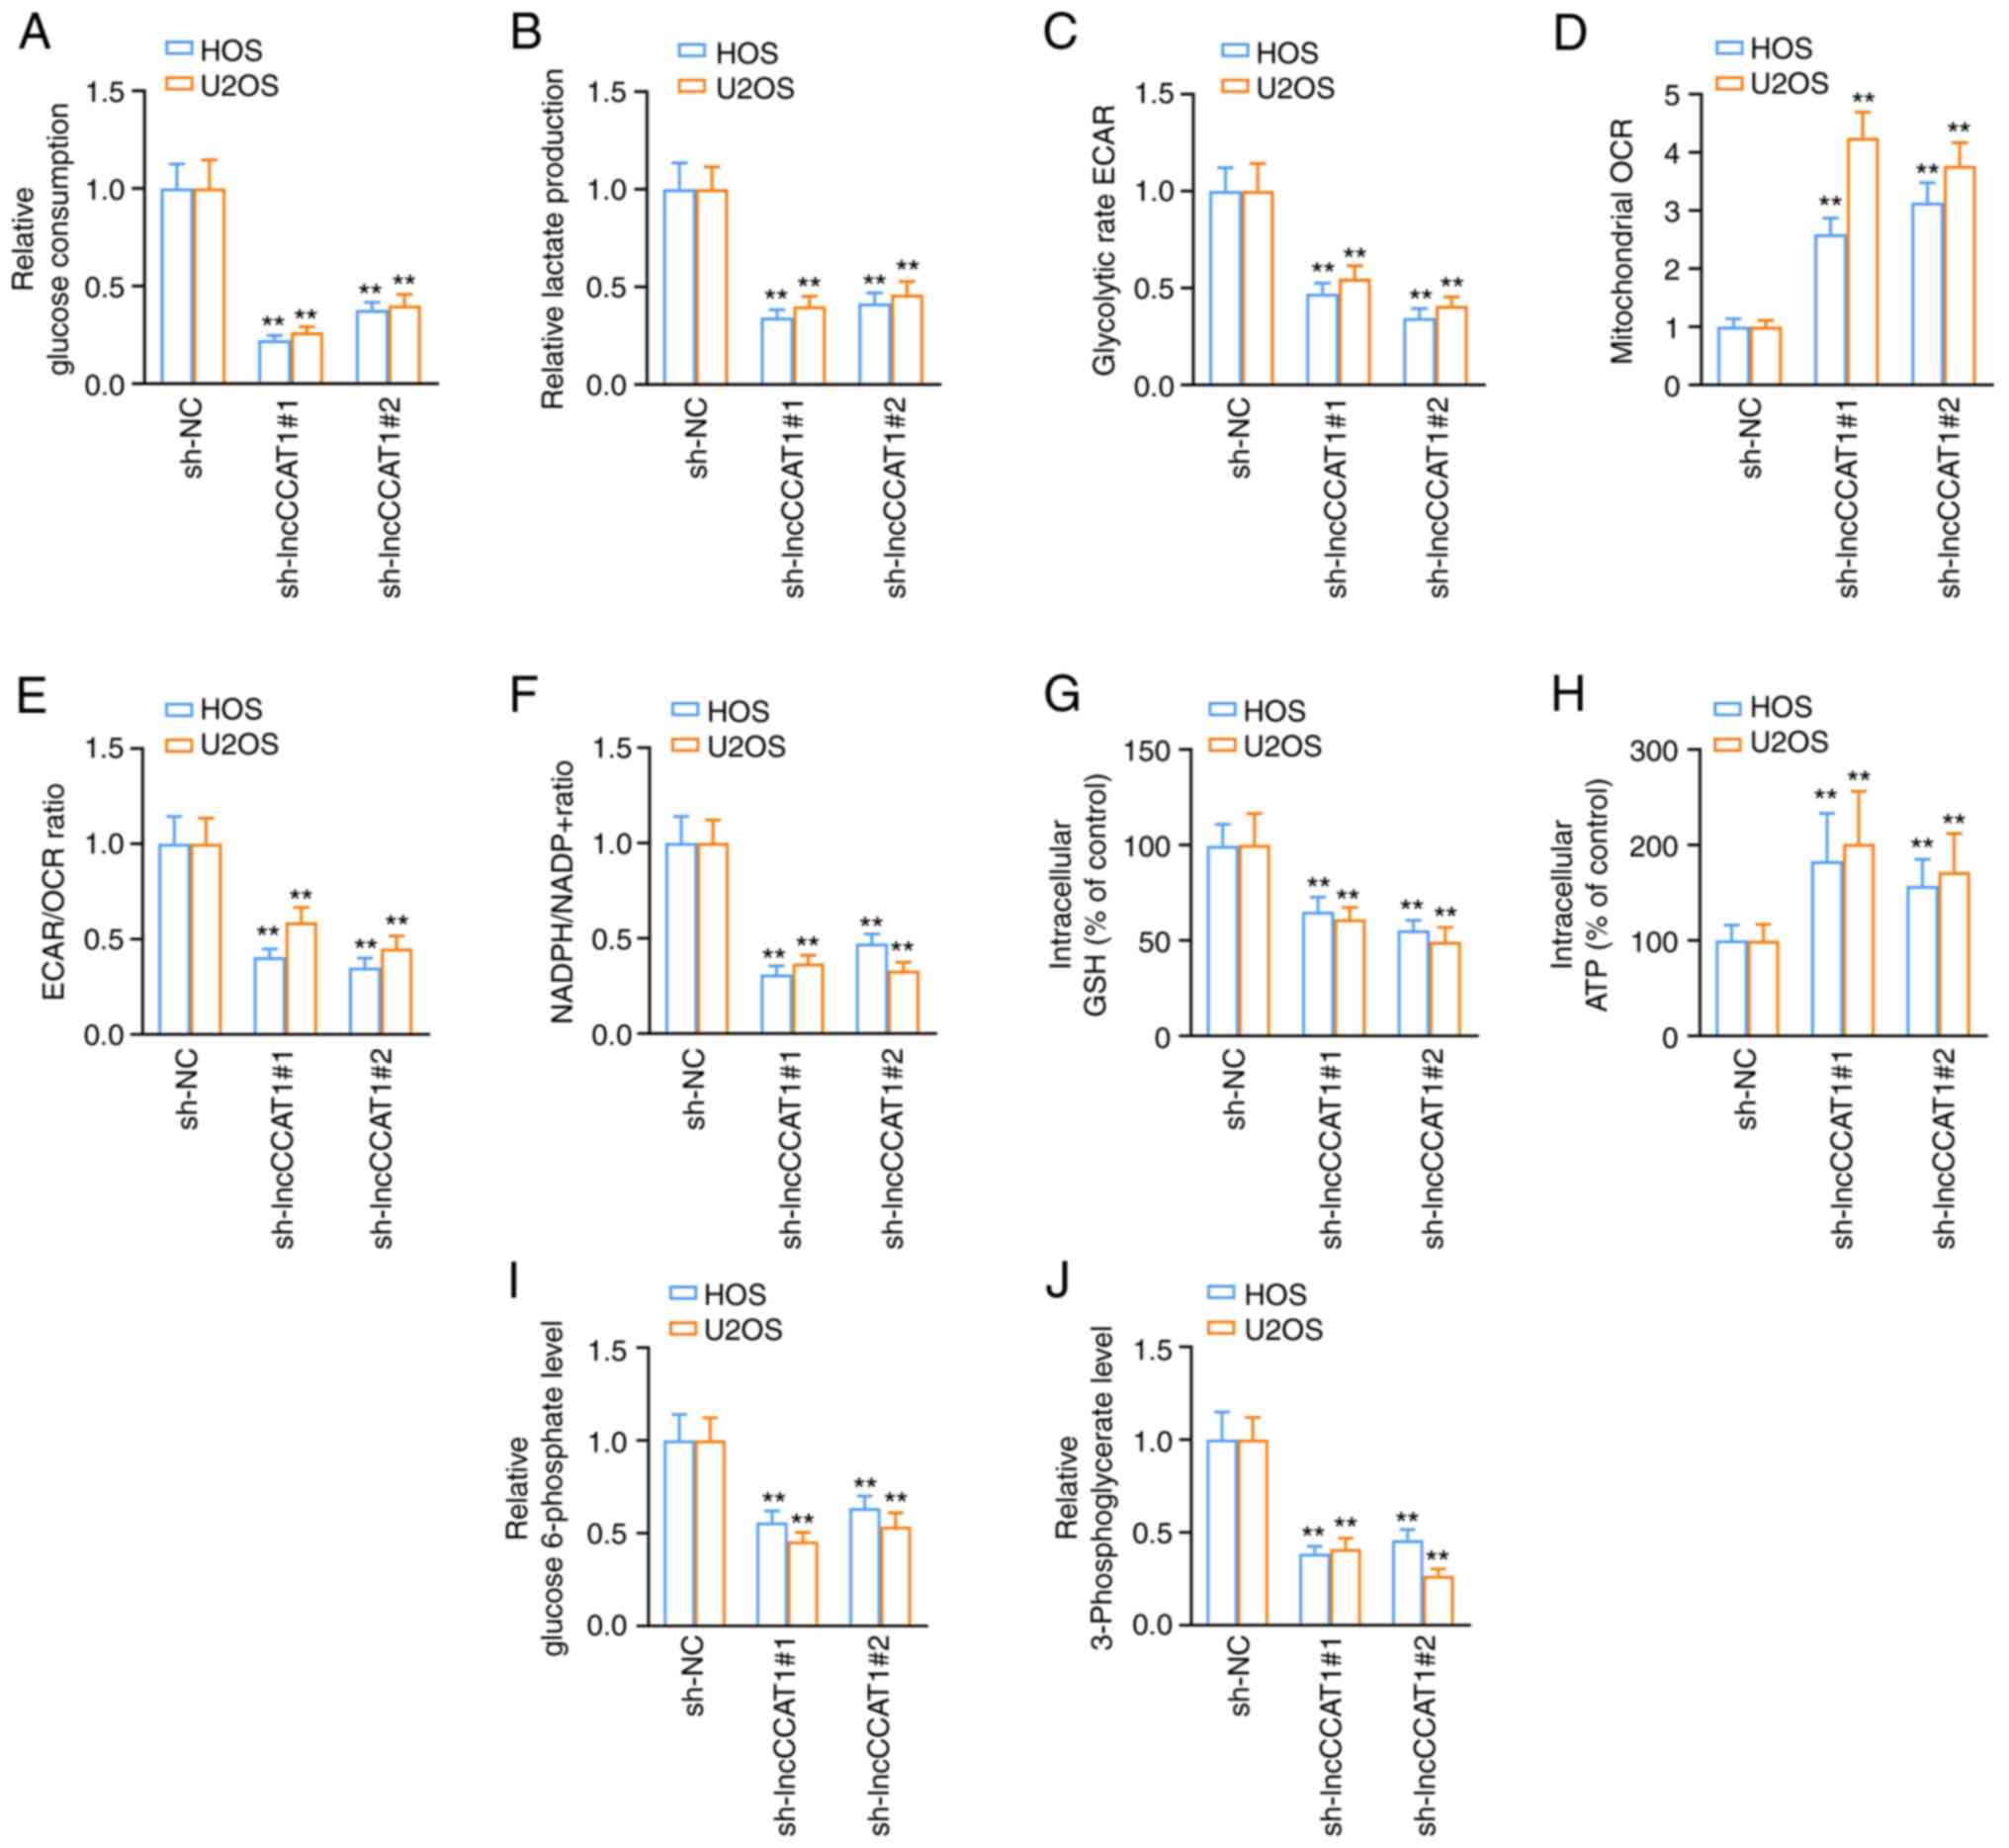 | Figure 3LncCCAT1 promotes the Warburg effect
in OS cells. (A and B) Following interference with lncCCAT1, the
amounts of glucose and lactic acid in the culture medium of HOS and
U2OS cells was decreased. (C) After detecting interference with
lncCCAT1 using Seahorse XF Extracellular Flux Analyzers, the ECAR
of OS cells was decreased, (D) the OCR was increased, (E) the
ECAR/OCR was decreased, (F) the level of NAPDH/NAPD+ was decreased,
and (G) the intracellular GSH levels were decreased. After
interference with lncCCAT1, (H) the levels of ATP, (I) glucose
6-phosphate, and (J) 3-phosphoglycerate in OS cells were decreased.
**P<0.01 vs. sh-NC. lncCCAT1, lncRNA colon cancer
associated transcript-1; OS, osteosarcoma; ECAR, extracellular
acidification rate; OCR, oxygen consumption rate; GSH, glutathione;
sh-, short hairpin; NC, negative control. |
LncCCAT1 promotes the proliferation of OS
cells through PKM2
First, the binding effect of lncCCAT1 and PKM2 was
verified. LncCCAT1 was enriched in PKM2 precipitation in HOS and
U2OS cells, and the binding effect of lncCCAT1 and PKM2 was
verified by the RIP assay (Fig.
S5A). The binding effect of lncCCAT1 and PKM2 was verified by
the RNA pulldown assay, and the results showed that lncCCAT1 could
pulldown PKM2 (Fig. S5B). To
investigate the regulation of lncCCAT1 on OS cell proliferation
through PKM2, an interference vector of PKM2 (Fig. S3B) and an overexpression vector
of lncCCAT1 were constructed (Fig.
S3C) which were used in a rescue experiment. Overexpression of
lncCCAT1 promoted the proliferation of OS cells, and after the
interference with PKM2, reduced proliferation of OS cells as
detected by CCK-8 (Fig. S5C), a
reduced number of positive cells in OS cells as detected by EdU
(Fig. S5D), and decreased OS
cell clones as detected by the clonal formation assay (Fig. S5E) were revealed.
LncCCAT1 promotes the Warburg effect of
OS cells through PKM2
The glucose assay kit was used to detect the glucose
content in the culture medium of HOS and U2OS cells under different
treatment conditions, and the results revealed that after
overexpression of lnCCCAT1, the glucose content in cells increased;
then, after interference with PKM2, glucose (Fig. S6A) and lactic acid (Fig. S6B) in the cells decreased. After
overexpression of lncCCAT1, the Seahorse XF Extracellular Flux
Analyzer detected that the ECAR was increased (Fig. S6C), the OCR was decreased
(Fig. S6D), and therefore the
ECAR/OCR was increased (Fig.
S6E). On this basis, PKM2 was disrupted, and it was revealed
that ECAR was decreased (Fig.
S6C), the OCR was increased (Fig. S6D), and therefore the ECAR/OCR
was decreased (Fig. S6E).
Following overexpression of lncCCAT1, intra-cellular levels of
NAPDH/NAPD+ (Fig.
S6F) and GSH (Fig. S6G) were
increased, the intracellular levels of ATP were decreased (Fig. S6H), and the intracellular levels
of glucose 6-phosphate (Fig.
S6I) and 3-PG were increased (Fig. S6J). Following the aforementioned
treatment, PKM2 was disrupted again, and the results revealed that
the intra-cellular levels of NAPDH/NAPD+ (Fig. S6F and K) and GSH (Fig. S6G) were decreased, the
intracellular levels of ATP were increased (Fig. S6H), and the intracellular levels
of glucose 6-phosphate (Fig.
S6I) and 3-PG were decreased (Fig. S6J).
LncCCAT1 recruits Cdc25A to promote PKM2
dephosphorylation in the nucleus
The effect of lncCCAT1 on PKM2 nuclear localization
in HOS and U2OS cells was observed by fluorescence microscopy. The
results revealed that lncCCAT1 promoted the expression of PKM2 in
the nucleus, however this expression was decreased after the
interference of lncCCAT1 (Fig.
4A). Western blotting results revealed that the expression of
PKM2 in the nucleus decreased after interference with lncCCAT1
(Fig. 4B), and studies have shown
that nuclear PKM2 promotes the transcriptional activity of the
myelocytomatosis oncogene (MYC) and thus, promotes glycolysis
(36,37). Therefore, the transcriptional
activity of MYC was examined. The transcription activity kit
detected a decrease in MYC transcription activity after
interference with lncCCAT1 (Fig.
4C), and the expression of the MYC-related genes were reduced
(Fig. 4D). These results
indicated that lncCCAT1 promoted the expression of PKM2 in the
nucleus, activated the transcription activity of MYC, and promoted
glycolysis.
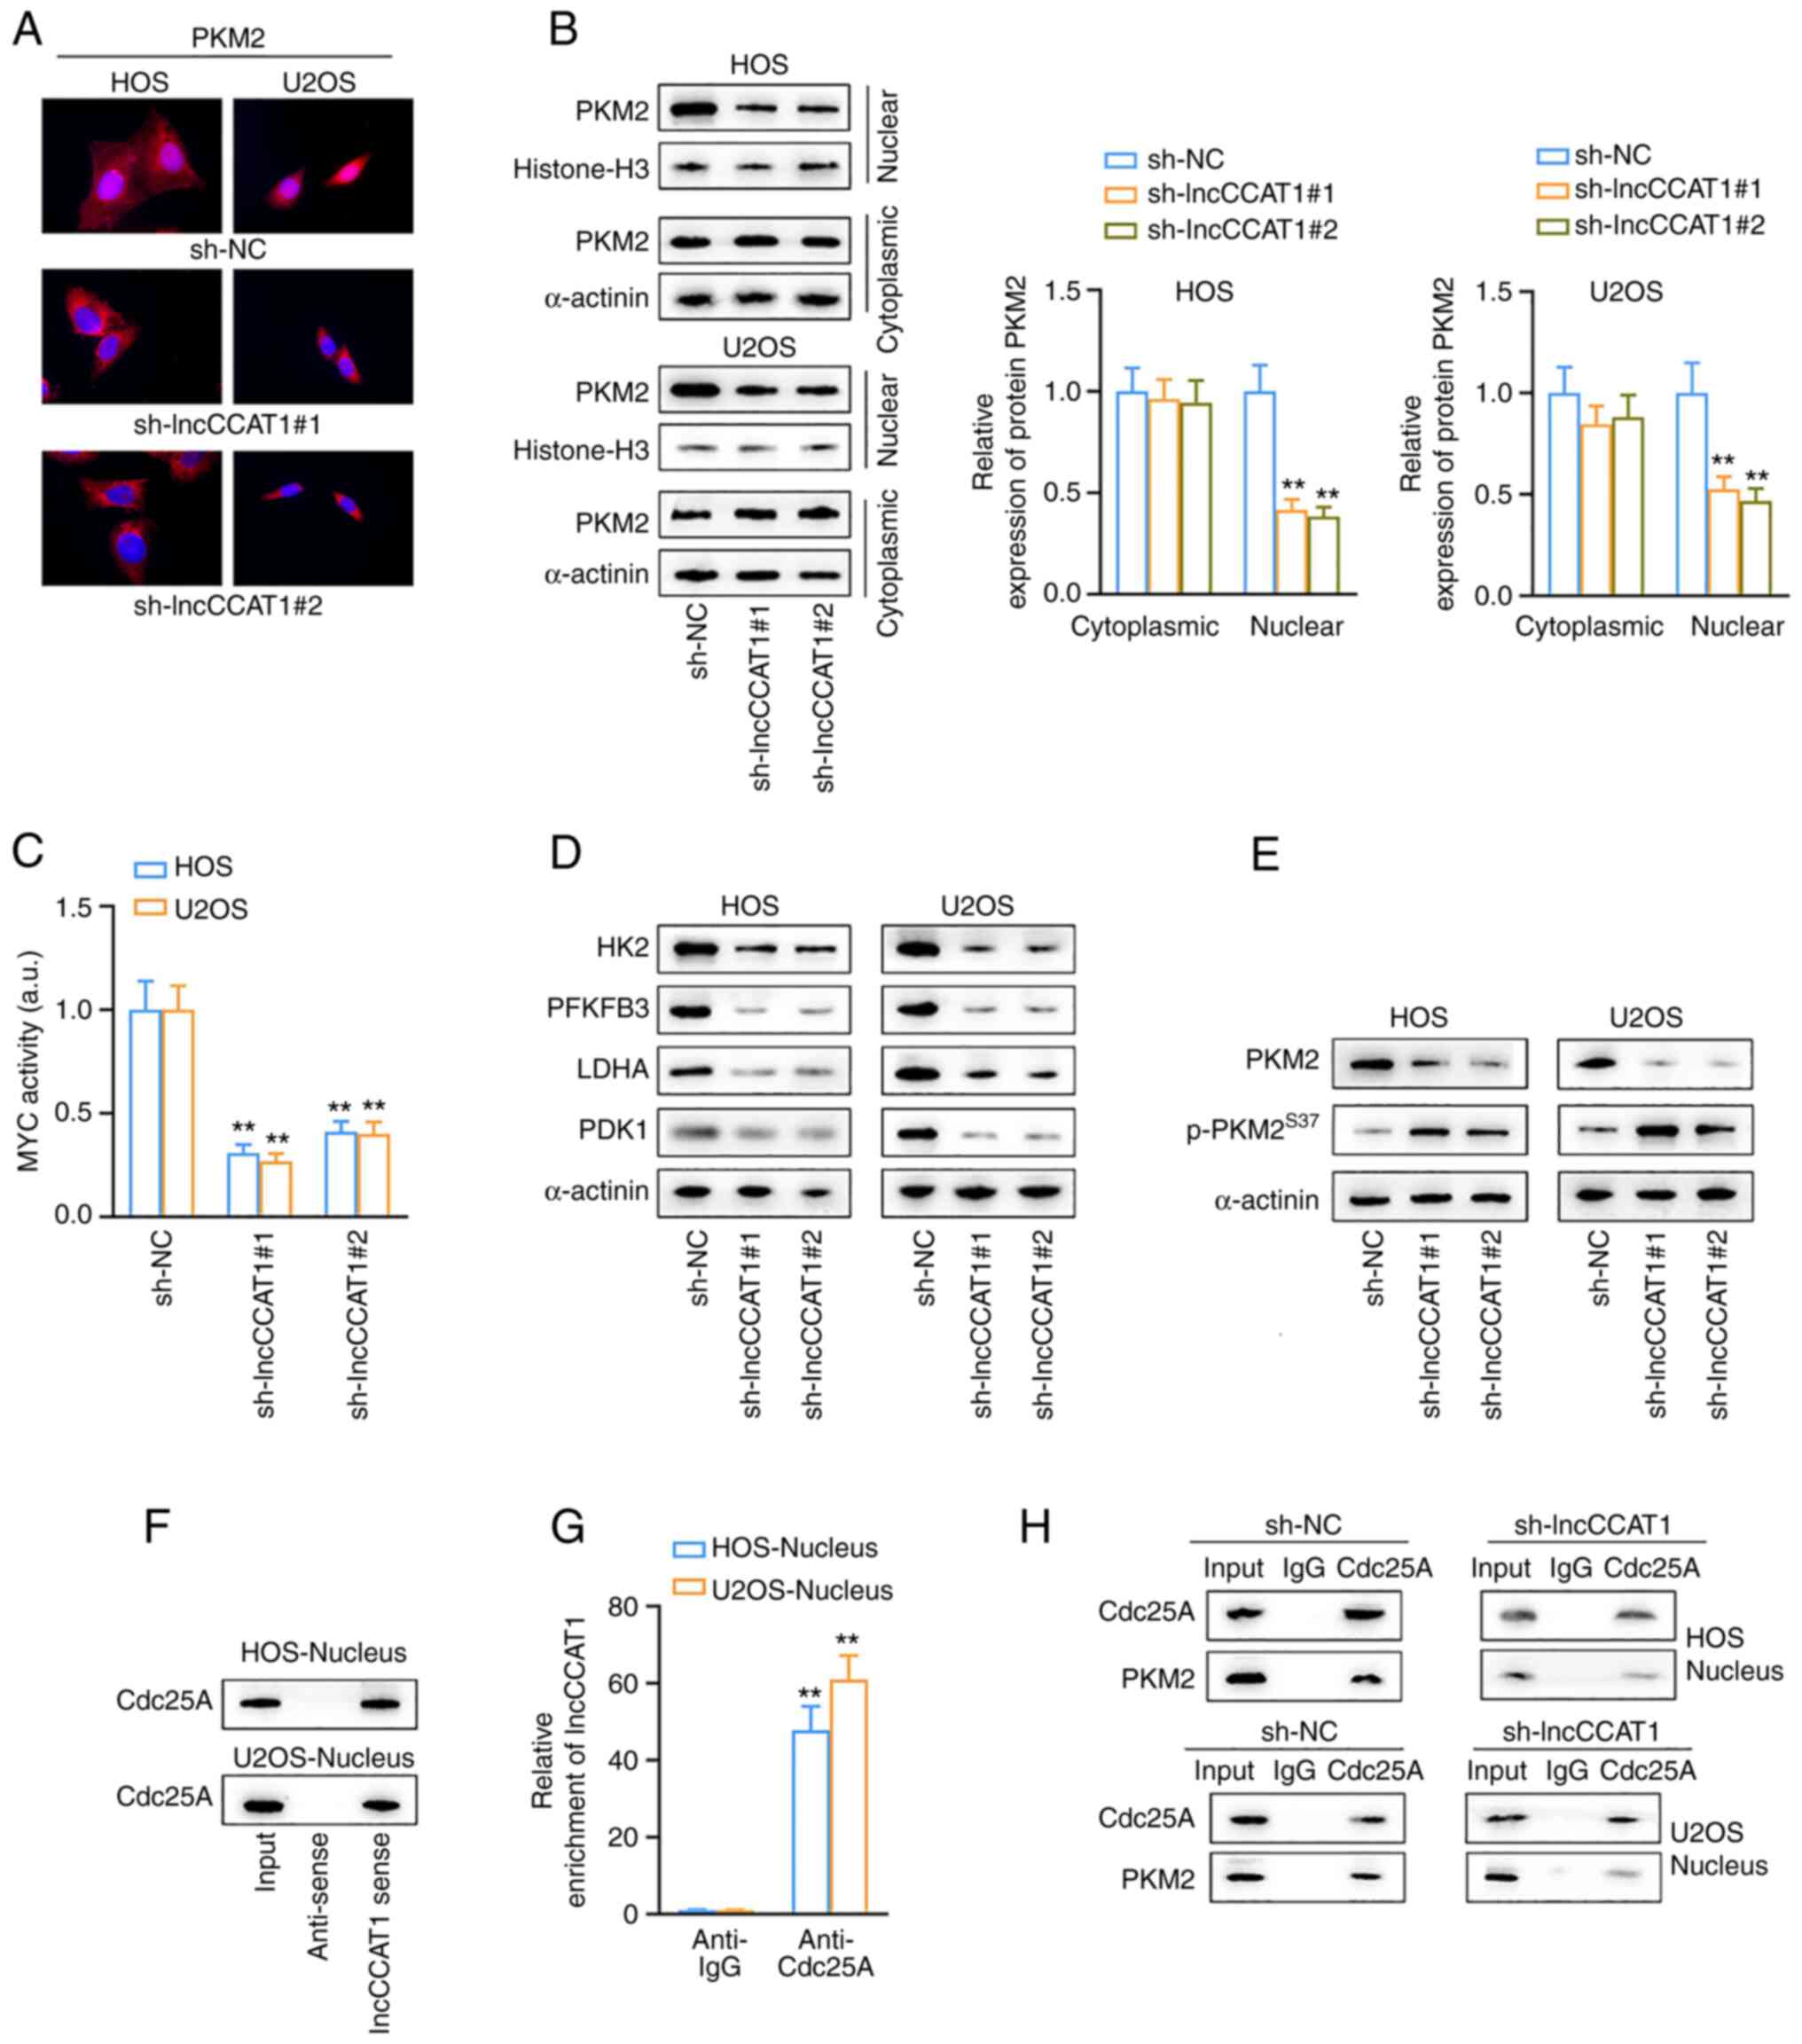 | Figure 4LncCCAT1 promotes the Warburg effect
in OS cells. (A) The effect of lncCCAT1 on PKM2 nuclear
localization in HOS and U2OS cells was observed by fluorescence
microscopy. (B) Western blotting results showed that the expression
of PKM2 in the nucleus decreased after interference with lncCCAT1.
(C and D) The transcription activity kit detected a decrease in MYC
transcription activity after interference with lncCCAT1, and the
expression of the MYC-related genes were reduced. (E) LncCCAT1
inhibited the phosphorylation of serine 37 in PKM2. (F) LncCCAT1 in
the nucleus could be pulled down to Cdc25A after biotinization. (G)
After the RIP assay, RT-qPCR detected the expression of lncCCAT1,
and lncCCAT1 could recruit Cdc25A. (H) Co-IP verified that lncCCAT1
promoted the interaction between Cdc25A and PKM2 when lncCCAT1
interfered. **P<0.01 vs. sh-NC. lncCCAT1, lncRNA
colon cancer associated transcript-1; OS, osteosarcoma; PMK2,
pyruvate kinase M2; MYC, myelocytomatosis oncogene; RIP, RNA
immunoprecipitation; RT-qPCR, reverse transcription-quantitative
PCR; sh-, short hairpin; NC, negative control. |
Next, how lncCCAT1 regulates PKM2 nuclear
translocation was explored. In HOS and U2OS cells, western blotting
detected the expression of PKM2 and p-PKM2 after interference with
lncCCAT1. The results revealed that lncCCAT1 could inhibit the
phosphorylation of serine 37 in PKM2, suggesting that lncCCAT1
could recruit some phosphatases to act on PKM2 (Fig. 4E). Phosphatase Cdc25A has been
reported to act on PKM2 in the nucleus (38). In HOS and U2OS cells, lncCCAT1 in
the nucleus and cytoplasm were biotinized by RNA pulldown, and
Cdc25A expression was detected by western blotting. The results
showed that lncCCAT1 in the nucleus could be pulled down to Cdc25A
after biotinization (Fig. 4F).
Following the RIP assay, RT-qPCR was used to detect the expression
of lncCCAT1, and the results confirmed that lncCCAT1 could recruit
Cdc25A (Fig. 4G). Co-IP verified
the effect of lncCCAT1 on the interaction between Cdc25A and PKM2,
and the results revealed that lncCCAT1 promoted the interaction
between Cdc25A and PKM2 when lncCCAT1 interfered (Fig. 4H). The aforementioned experimental
results demonstrated that lncCCAT1 promoted the dephosphorylation
of PKM2 in the nucleus by recruiting Cdc25A, thus promoting
glycolysis.
In order to further explore whether PKM2 as an RBP
of lncCCAT1, could play a role in lncCCAT1, it has been reported
that RBP can stabilize RNA structure and lncCCAT1 plays a role in
linking transcriptional complexes in the nucleus (39,40). Therefore, it was hypothesized that
PKM2 could stabilize the structure of lncCCAT1. Following PKM2
interference, HOS and U2OS cells were treated with α-amanitin, and
the expression levels of lncCCAT1 and GAPDH in the nucleus were
detected by RT-qPCR. The results showed that PKM2 could stabilize
lncCCAT1 (Fig. S7).
Phosphorylation of PKM2 at T610 of
SREBP2
In HOS cells, the interaction protein of PKM2 was
screened by GST pulldown combined mass spectrometry, and SREBP2 was
revealed to interact with PKM2 (Fig.
5A). The Co-IP experiment also confirmed the interaction
between SREBP2 and PKM2 (Fig.
5B). To predict the phosphorylation sites of SREBP2 on which
PKM2 could act, an overexpression vector (pcDNA3.1) that inserted
different fragments of SREBP2 was constructed; then, the GST
pulldown assay was used to analyze the fragments that could bind to
PKM2. Different overexpression vectors with GST tags were inserted
into HOS cells, and the results of the GST pulldown experiment
indicated that PKM2 may act on the phosphorylation sites of SREBP2
between 600 and 630 (Fig. 5C). A
Co-IP assay was used to detect the effect of lncCCAT1 on the
interaction between PKM2 and SREBP2, and the results revealed that
interfering lncCCAT1 did not affect the interaction between PKM2
and SREBP2 (Fig. S8A). The
PhosphoSitePlus and NetPhos-3.1 were used to predict the
phosphorylation sites of SREBP2, and the two most likely
phosphorylation sites in the range of 600-630 were T610 and S627
(Fig. S8B).
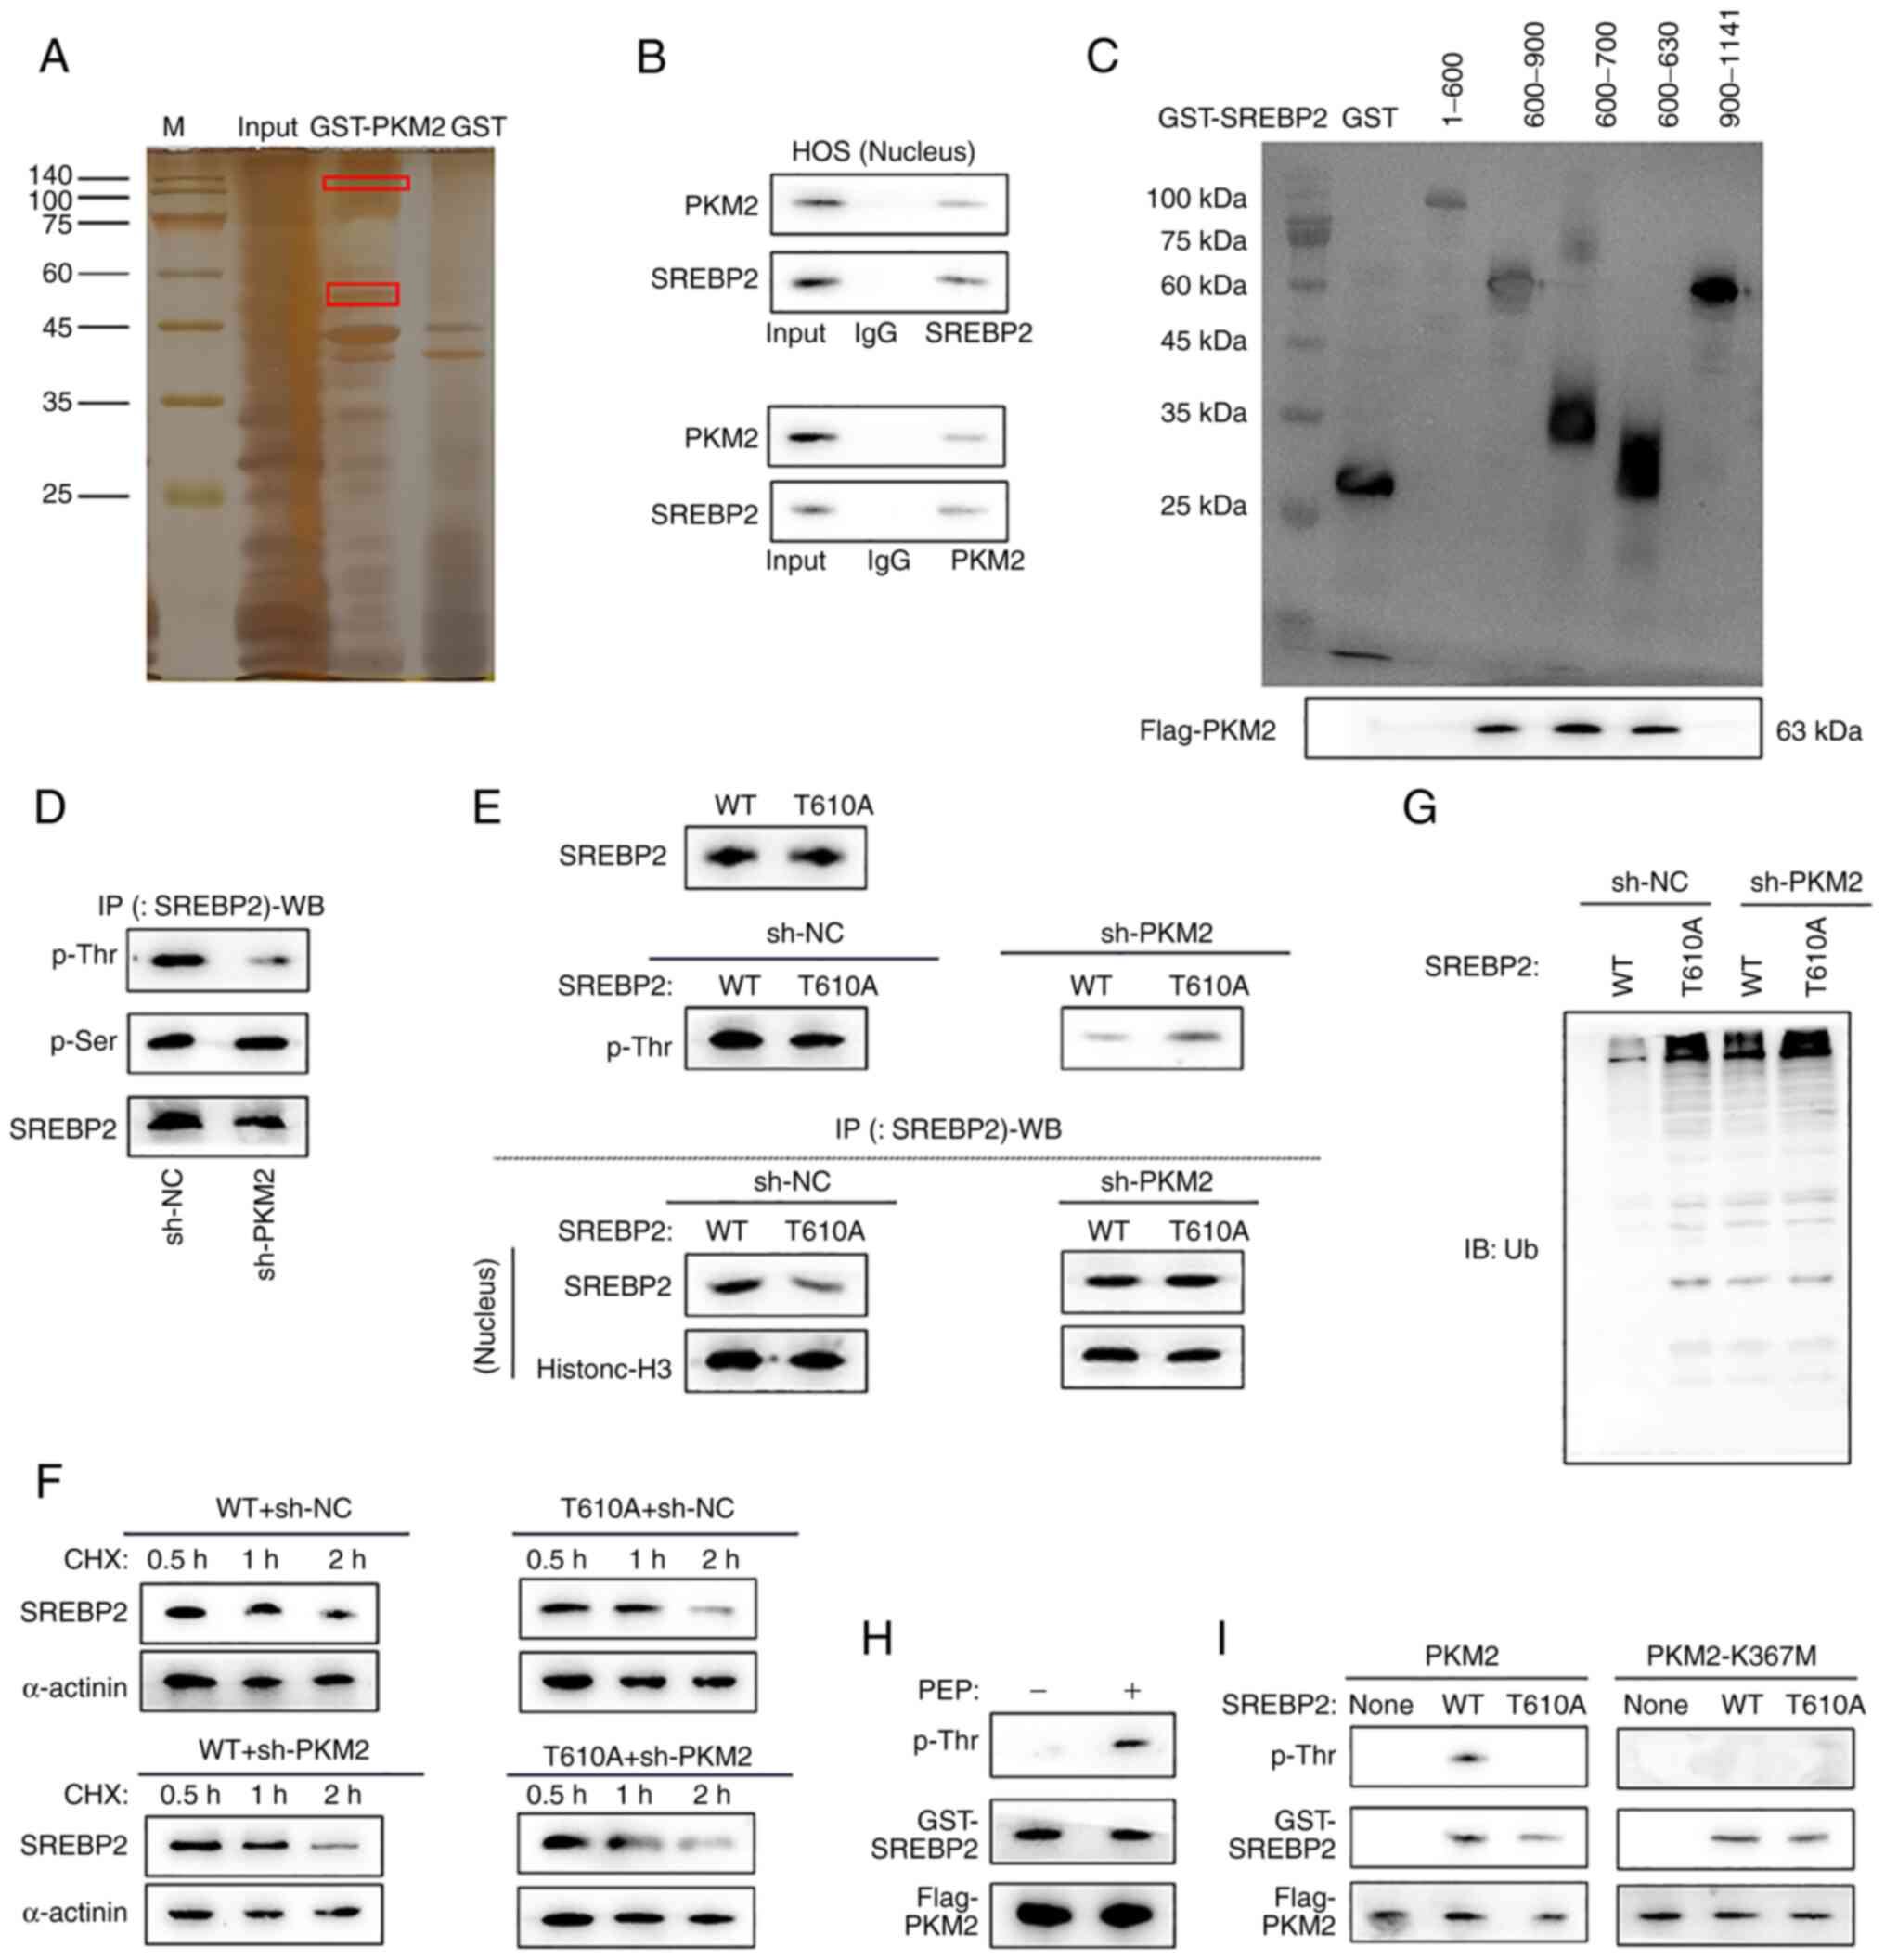 | Figure 5Phosphorylation of PKM2 at T610 of
SREBP2. (A) SREBP2 was found to interact with PKM2 screened by GST
pulldown combined mass spectrometry. (B) The Co-IP experiment
confirmed the interaction between SREBP2 and PKM2. (C) GST pulldown
experiment indicated that PKM2 may act on the phosphorylation sites
of SREBP2 between 600 and 630. (D) The phosphorylation site of PKM2
on SREBP2 was identified as T610, and the molecular weight of
SREBP2 protein was 123.72 kDa. (E) In HOS-SREBP2 (wild-type, WT)
and HOS-SREBP2T610M (T610M) cells, the total protein
content of SREBP2 was not affected by the T610 site, and the
phosphorylation of SREBP2 T610 greatly affected protein expression
in the nucleus. (F) PKM2-mediated phosphorylation of T610 did not
affect the protein synthesis of SREBP2. (G) IP-WB detected the
ubiquitination of SREBP2 in the nucleus after PKM2 interference,
and PKM2-mediated phosphorylation of SREBP2 at T610 affected the
stability of SREBP2. (H) The phosphorylation of SREBP2 serine site
was detected after the GST pulldown test, and PKM2 could
phosphorylate T620 of SREBP2 only in the presence of PEP. (I) GST
pulldown assay detected PKM2 could phosphorylate SREBP2 at T610.
PMK2, pyruvate kinase M2; SREBP2, sterol regulatory element-binding
protein 2; IP-WB, IP coupled with western blotting; sh-, short
hairpin; NC, negative control. |
A stable cell line, HOS-SREBP2, overexpressing
SREBP2 (Fig. S3D) was
successfully constructed. In HOS-SREBP2 cells, IP-WB detected the
effect of interference with PKM2 on the phosphorylation of SREBP2
in the nucleus; results showed that PKM2 affected phosphorylation
at threonine (T) but not at serine. Therefore, the phosphorylation
site of PKM2 on SREBP2 was identified as T610, and the molecular
weight of SREBP2 protein was 123.72 kDa (Fig. 5D). A stable cell line
HOS-SREBP2T610M overexpressing the threonine mutant at
site 610 of SREBP2 was constructed (Fig. S3E). In HOS-SREBP2 (wild-type, WT)
and HOS-SREBP2T610M (T610M) cells, the total protein
content of SREBP2 was not affected by the T610 site, and the
phosphorylation of SREBP2 T610 greatly affected protein expression
in the nucleus (Fig. 5E). Further
studies revealed that PKM2-mediated phosphorylation of T610 did not
affect the protein synthesis of SREBP2 (Fig. 5F). Therefore, it was hypothesized
that T610 affects the protein ubiquitination degradation process of
SREBP2, rather than the synthesis process. IP-WB detected the
ubiquitination of SREBP2 in the nucleus after PKM2 interference,
indicating that PKM2-mediated phosphorylation of SREBP2 at T610
affected the stability of SREBP2 (Fig. 5G).
In 293T-PKM2 cells, the phosphorylation of SREBP2
serine site was detected after the GST pulldown assay. The results
revealed that PKM2 could phosphorylate T620 of SREBP2 only in the
presence of PEP (Fig. 5H). It has
been reported that phosphorylation of PKM2 at lysine (K) 367 plays
a decisive role in PKM2 phosphokinase activity (41). Therefore, the mutant vector
PKM2K367 was transferred into 293T cells to purify the
PKM2-K367M protein, and a GST pulldown test was
performed to verify the interaction between PKM2 and SREBP2 in
vitro. In HOS-SREBP2 (WT) and HOS-SREBP2T610M
(T610M) cell culture media, and after exogenously adding PKM2 or
PKM2-K367M, phosphorylation of SREBP2 was detected after GST
pulldown assay. The results revealed that when kinase activity was
not impaired, PKM2 could phosphorylate SREBP2 at T610 (Fig. 5I).
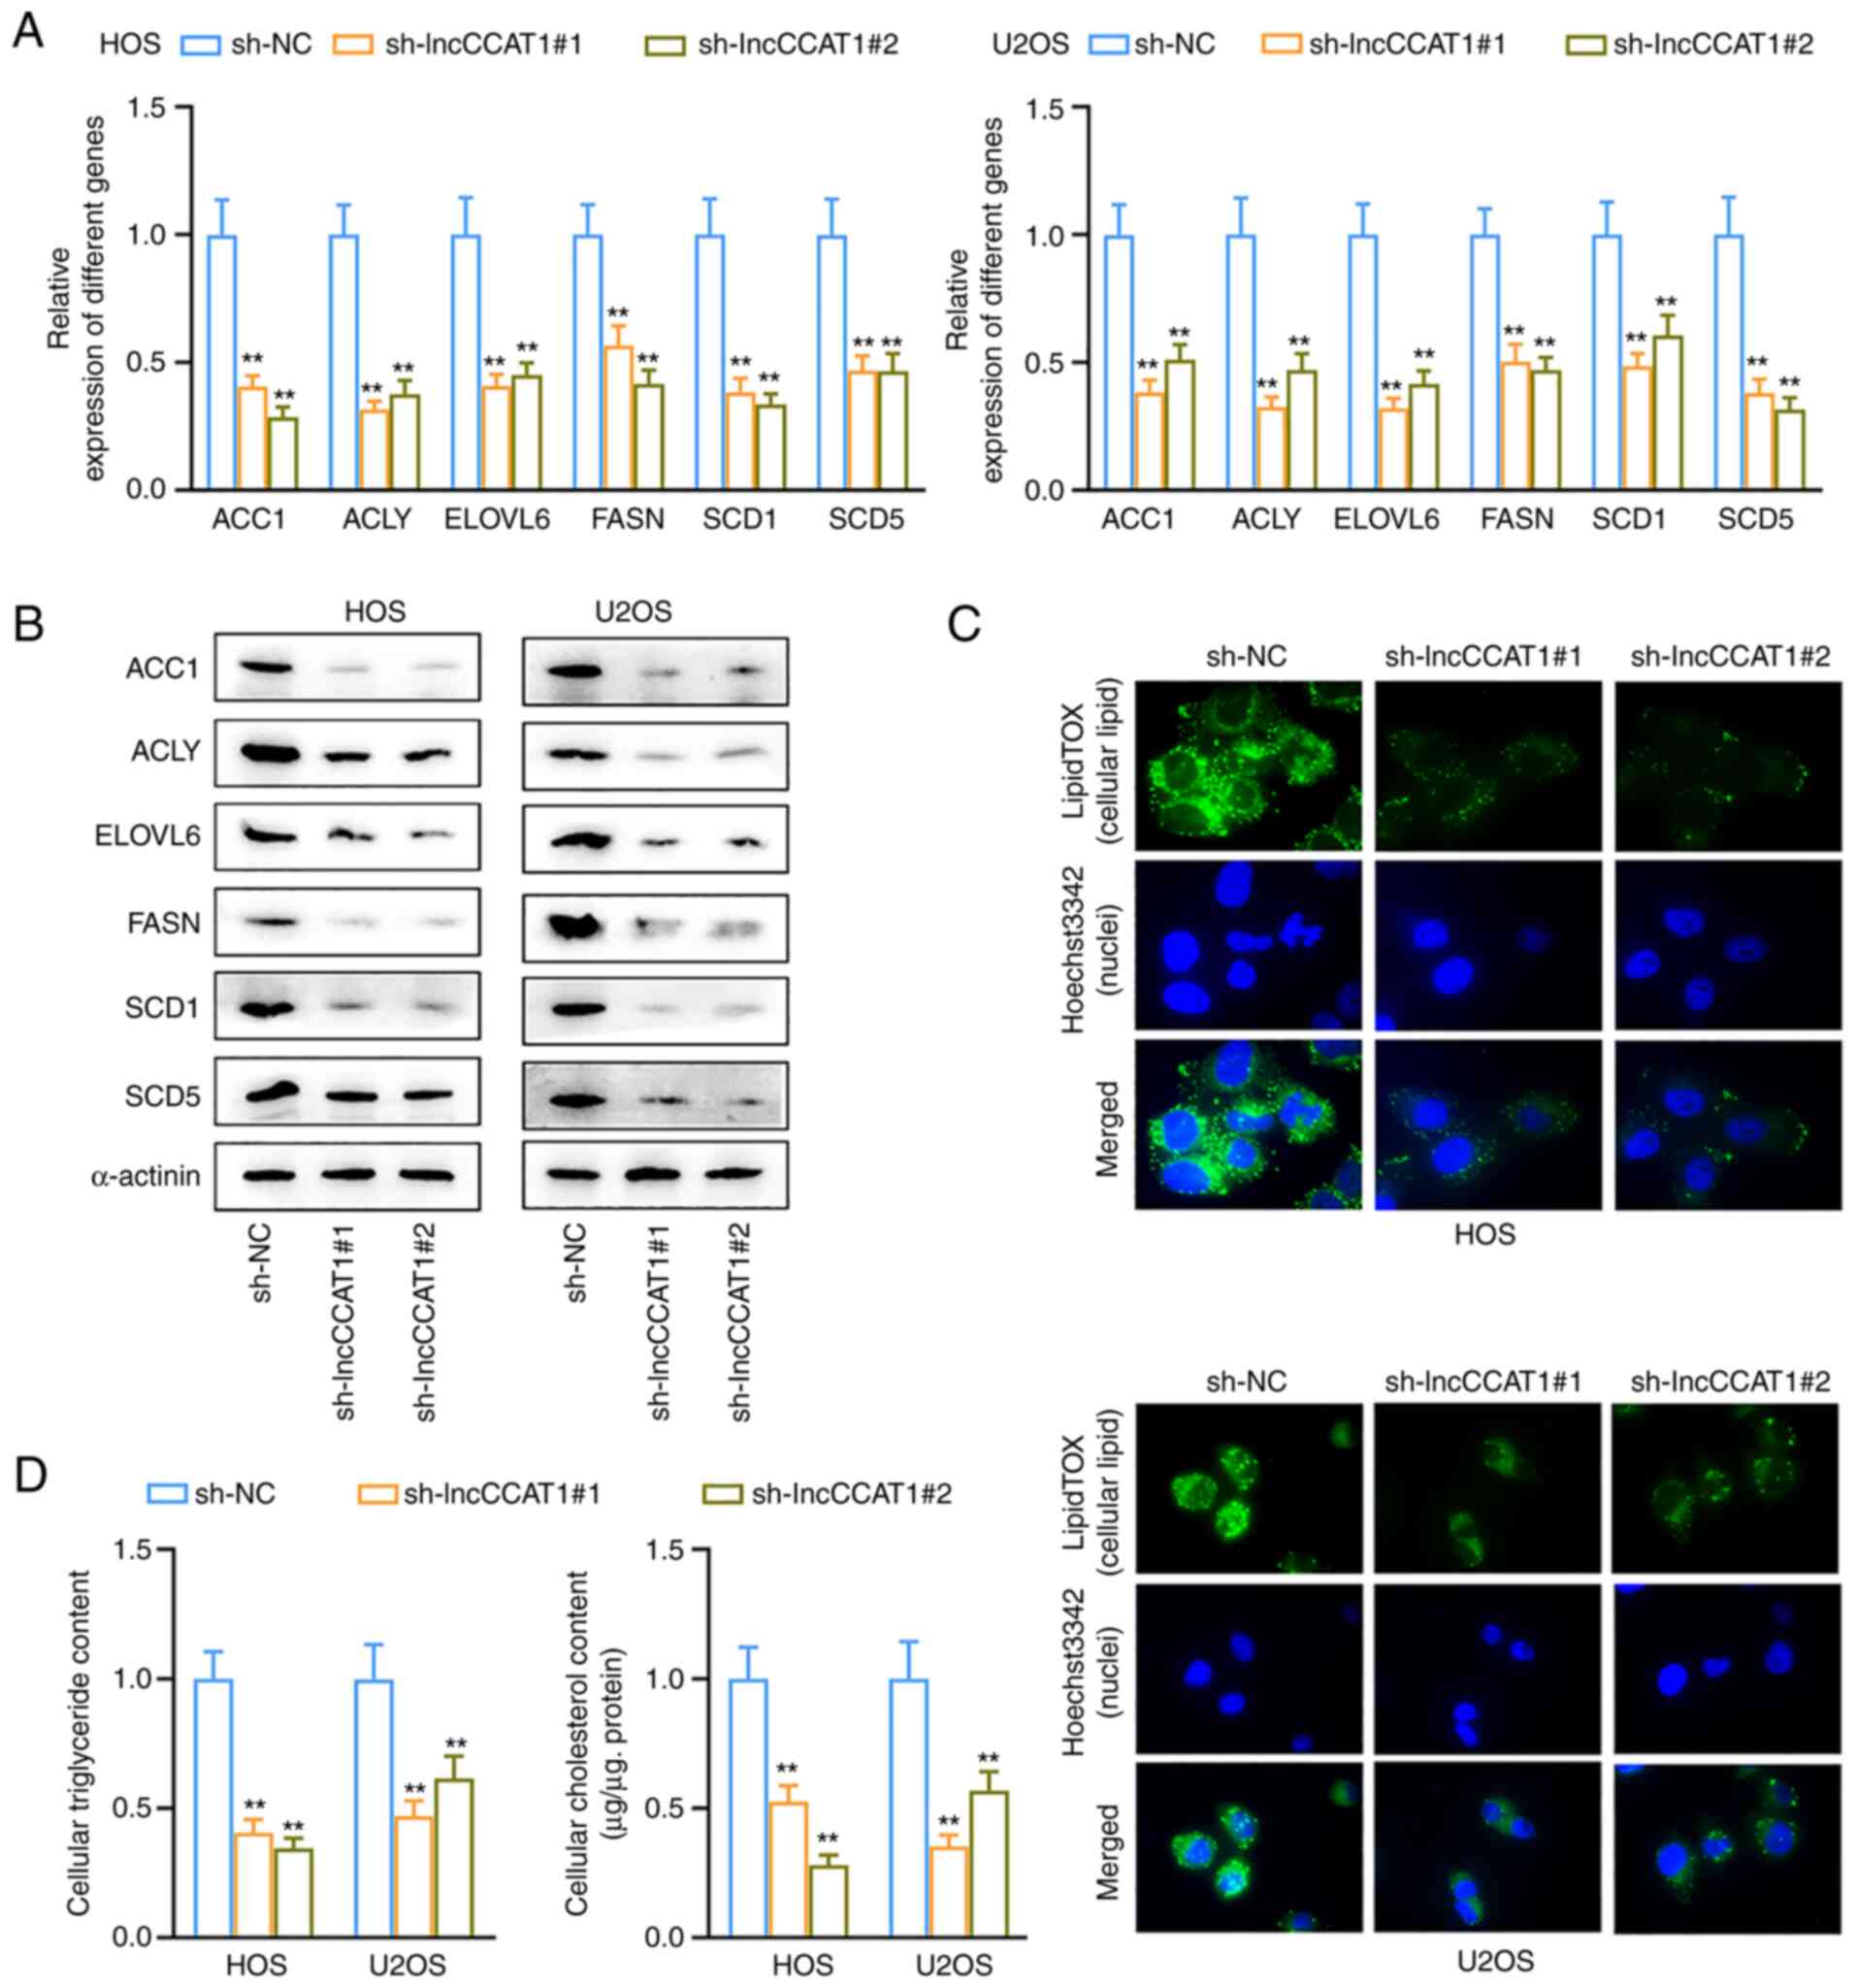
LncCCAT1 promotes lipogenesis in OS
cells
In HOS and U2OS cells, the expression of several
key genes that regulate lipogenesis were detected after
interference with lncCCAT1. The RT-qPCR and western blotting
results showed that the expression of key genes in lipogenesis
decreased after interference with lncCCAT1 (Fig. 6A and B). Fluorescence microscopy
revealed that interference with lnCCCAT1 reduced the lipid content
of OS cells (Fig. 6C). In HOS and
U2OS cells, the triglyceride and cholesterol contents decreased
after interference with lncCCAT1 (Fig. 6D). These results indicated that
lncCCAT1 promoted lipogenesis in OS cells.
LncCCAT1 promotes tumor growth, the
Warburg effect, and lipogenesis in vivo
In vivo results revealed that HOS cells
interfered with lncCCAT1, which resulted in slower growth of
xenografts (Fig. 7A) and lighter
weight xenografts (Fig. 7B). The
expression of glycolysis-related proteins in the two groups was
detected by IHC, and the results revealed that the positive rates
of HK2 and LDHA were decreased in the sh-lncCCAT1 group (Fig. 7C). Western blotting revealed that
the expression levels of HK2, PFKFB3, LDHA, and PDK1 were decreased
in the sh-lncCCAT1 group (Fig.
7D). The expression of the lipid synthesis-related proteins,
FASN and SCD1, was detected by IHC, and the results revealed that
the positive rates of FASN and SCD1 were decreased in the
transplanted tumor of the sh-lncCCAT1 group (Fig. 7E). Western blotting revealed that
the expression levels of ACC1, ACLY, ELOVL6, and SCD5 were
decreased in the sh-lncCCAT1 group (Fig. 7F).
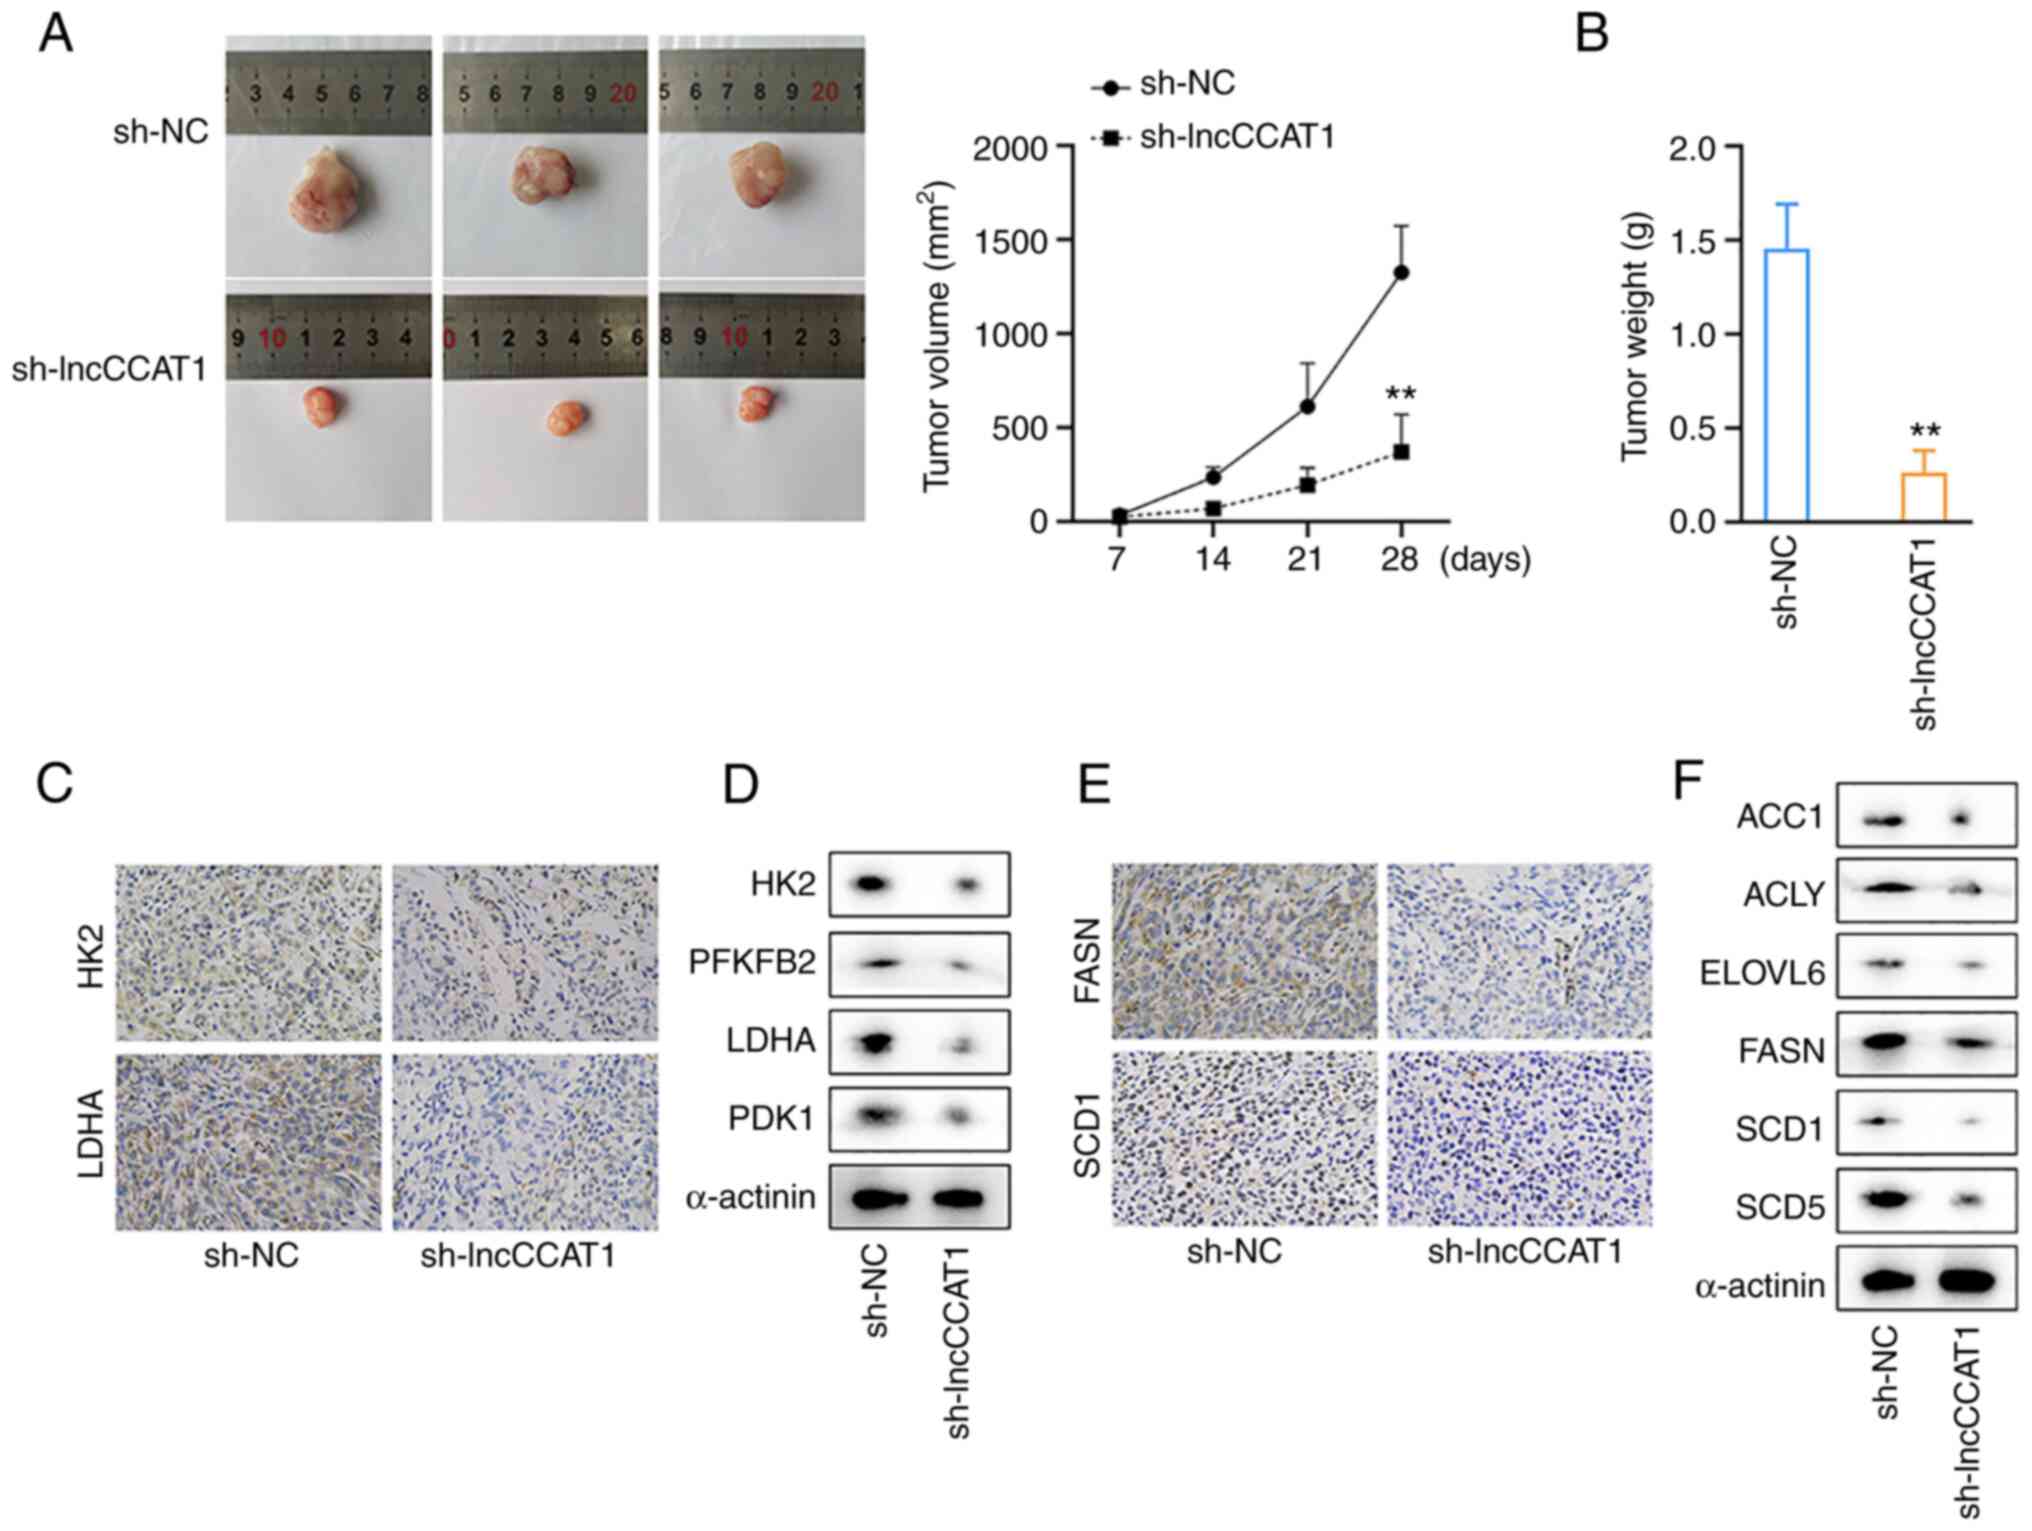 | Figure 7LncCCAT1 promotes tumor growth, the
Warburg effect, and lipogenesis in vivo. (A and B) In
vivo results revealed that HOS cells interfered with lncCCAT1,
which resulted in slower growth of xenografts and lighter weight
xenografts. (C) IHC detected the expression of glycolysis-related
proteins, and the positive rates of HK2 and LDHA were decreased in
the sh-lncCCAT1 group. (D) Western blotting showed that the
expression levels of HK2, PFKFB3, LDHA, and PDK1 were decreased in
the sh-lncCCAT1 group. (E) IHC detected the expression of FASN and
SCD1, and the positive rates of FASN and SCD1 were decreased in the
transplanted tumor of the sh-lncCCAT1 group. (F) Western blotting
detected the expression of ACC1, ACLY, ELOVL6, and SCD5, and these
proteins expression levels were decreased in the sh-lncCCAT1 group.
**P<0.01. lncCCAT1, lncRNA colon cancer associated
transcript-1; IHC, immunohistochemistry; HK2, hexokinase; LDHA,
lactate dehydrogenase; PFKFB3,
6-phosphofructo-2-kinase/fructose-2,6-bisphosphatase-3; PDK1,
pyruvate dehydrogenase kinase 1; FASN, fatty acid synthase; SCD1,
stearoyl-CoA desaturase 1; ACC1, acetyl-coenzyme A carboxylase 1;
ACLY, ATP citrate lyase; ELOVL6, fatty acyl-CoA elongase 6; SCD5,
stearoyl-CoA desaturase 5; sh-, short hairpin; NC, negative
control. |
Discussion
Previous studies have shown that PKM2 is correlated
with the Enneking stage and distant metastasis in OS, and it has
been identified as an independent prognostic factor for lethal
disease (13-15,18,42). These studies revealed that PKM2
may represent a new therapeutic target for OS. In recent years,
cancer metabolism has attracted increasing attention, and targeting
cancer metabolism may be a promising strategy in cancer treatment
(43). It is widely accepted that
aerobic glycolysis provides the energy and phosphorus metabolites
that tumor cells need to proliferate. As a glycolytic enzyme, PKM2
plays an important role in tumor glucose metabolism and cancer
progression (44). Genetic
alteration and epigenetic modification of PKM2 lead to
dysregulation of tumor-associated genes, which finally results in
tumor progression (45). Previous
studies have reported that PKM2 can be translocated into the
nucleus of tumor cells via a variety of mechanisms, which
subsequently interact with the molecules responsible for cell
proliferation, invasion, and metastasis (15,18,46).
At present, a variety of functional RNAs have been
discovered, including mRNA for transmitting genetic information,
transfer RNA (tRNA) and rRNA responsible for protein translation,
small nuclear RNA (snRNA), microRNA, and non-coding RNA (ncRNA,
including lncRNA and circular RNA) with special regulatory
functions (47). Therefore, the
function of RNA has gone far beyond its role as a mediator of
genetic information transmission, and the binding of RNA to target
molecules is a key step in the process of RNA function. The
analysis and identification of RNA-protein interactions is key for
exploring the function of RNA. Studying interacting RNA molecules
in terms of proteins is a common approach, using RIP, cross-linking
and immunoprecipitation (CLIP), and various derivative technologies
(such as HiTS-CLIP, PAR-CLIP, iCLIP, and eCLIP) (48). iRIP-seq is a new technology to
study RBPs, which adds UV-crosslinking and micrococcal nuclease
(MNase) digestion in Clip-seq technology to the traditional RIP
technology, and peaks and motif information combined with RBP are
obtained by Clip-seq data analysis (49). iRIP-seq can not only accurately
obtain the binding sites of RNA and protein in Clip-seq, but also
retains the simplicity of RIP-seq (50).
LncRNAs are generally more than 200 bp in length
and lack significant open reading frames, and thus they do not
encode proteins (51). Although
lncRNAs do not have the function of translating into proteins, they
are widely involved in physiological and pathological activities of
the human body, and mediate the occurrence and development of
tumors (52). Studies have shown
that lncRNAs play an important role in a variety of biological
processes, can directly or indirectly interfere with gene
expression in a variety of cancers, and regulate glucose metabolism
in cancer cells (4,5,53).
The most direct way to regulate glucose metabolism is to regulate
the expression or activity of enzymes or kinases that affect its
metabolism, and some signal transduction pathways also play an
important role in glucose metabolism (54,55). The PKM2 target gene is not only
lncCCAT1, but also other RNA and protein molecules. However, the
interaction between lncCCAT1 and PKM2 revealed the regulatory
function of PKM2. LncRNA HULC can directly bind to LDHA and PKM2,
enhance interactions with the intracellular domain of the upstream
kinase FGFR1, elevate phosphorylation, and modulate enzymatic
activities. The elevation of LDHA activity and decrease in PKM2
activity both contribute to higher levels of glycolysis, thereby
promoting cell proliferation (56).
A previous study has confirmed that peroxisome
proliferator-activated receptor (PPAR) supports the transcription
of PKM2 and can promote the occurrence of fatty liver (57). Lipid metabolism disorders play a
key role in foam cell formation, and SREBP-1a regulates lipid
synthesis through transcriptional activation of lipid genes. The
interaction of PKM2 with nuclear SREBP-1a can enhance the
phosphorylation of T106, further promoting the stabilization of
SREBP-1a, and then increase the transcription of lipogenic genes
such as FASN (58). In the
present study, the expression of several key genes regulating
lipogenesis was detected after interference with lncCCAT1,
suggesting that lncCCAT1 could promote lipogenesis in OS.
Therefore, in the occurrence and development of OS, it is theorized
that in addition to the Warburg effect of PKM2, lipid metabolism
also plays an important role.
To study the potential function of PKM2 in OS,
PKM2-bound RNAs in HeLa cells were obtained. Peak calling analysis
revealed that PKM2 binds to lncRNAs associated with cancer
pathogenesis and development. Motif presentation revealed motif
searching results for PKM2-bound lncRNAs and three specific
PKM2-bound lncRNAs. The PKM2-lncRNA interaction in the human OS
cell line was then validated, showing that the lncCCAT1 interaction
protein PKM2 can promote OS tumorigenesis by enhancing the Warburg
effect and lipid synthesis. SREBPs are a class of transcription
factors that regulate lipid homeostasis via modulating the
expression of enzymes required for lipogenesis (59). SREBP2 has been demonstrated to
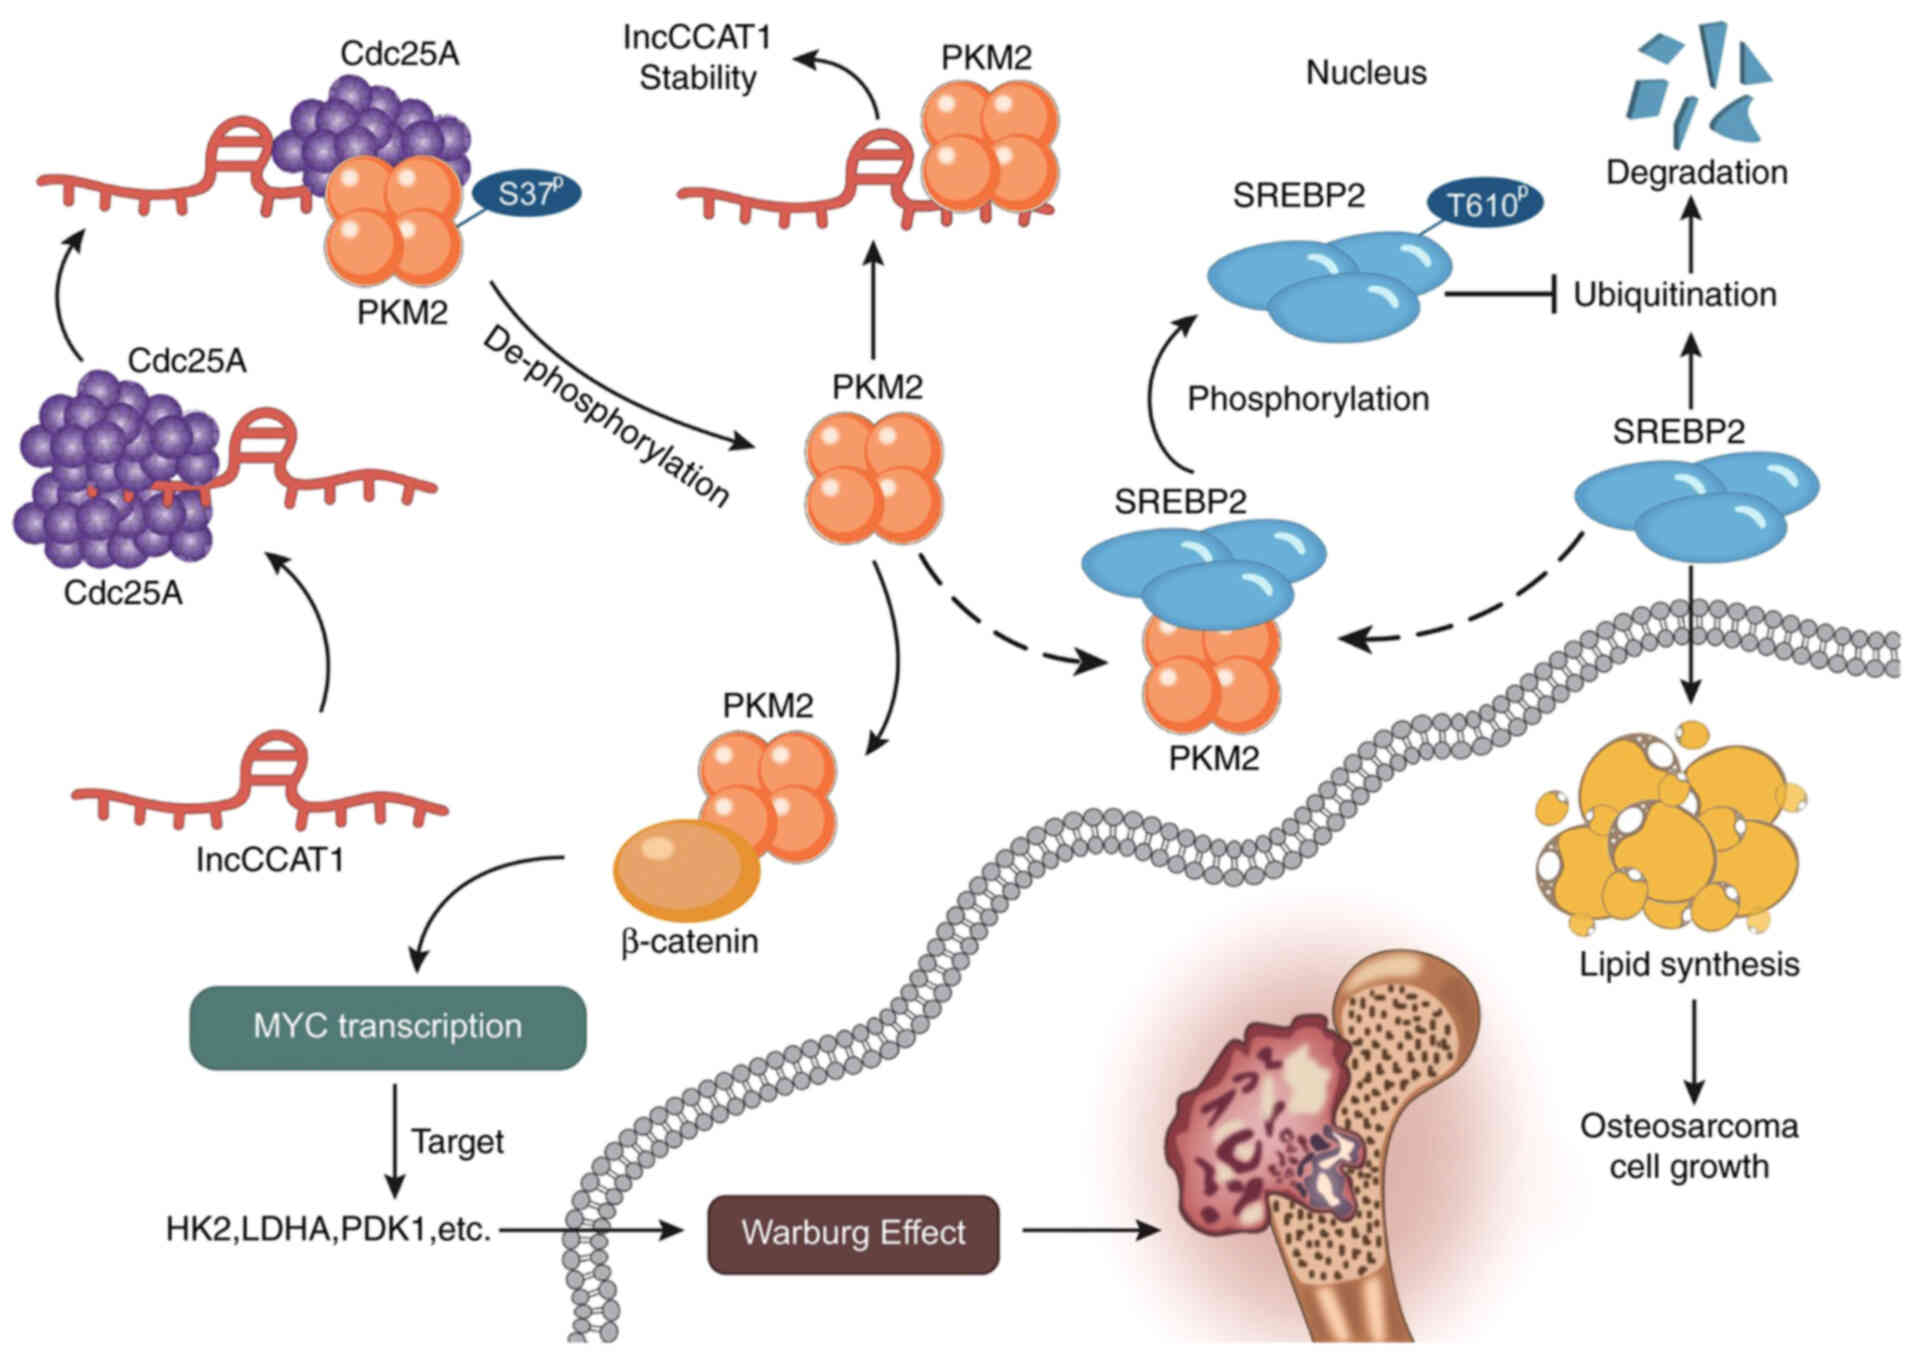
modulate cholesterol synthesis and lipogenesis (60,61). The specific regulatory mechanism
may be that lncCCAT1 promotes the dephosphorylation of PKM2 in the
nucleus by recruiting Cdc25A, and phosphorylates SREBP2 at T610 to
activate MYC transcriptional activity, thereby promoting glycolysis
(Fig. 8). A study revealed that
PKM2 is a novel substrate of Cdc25A, which plays an instrumental
role in the Warburg effect. Cdc25A dephosphorylates PKM2 at S37 and
promotes PKM2-dependent β-catenin transactivation, and c-MYC
upregulated expression of the glycolytic genes PKM2, LDHA and GLUT1
(38).
These findings support the hypothesis that PKM2 is
a key regulatory gene in OS as an RBP. PKM2 could function in OS by
binding to lncCCAT1, further extending the biological functions of
PKM2 in tumorigenesis, thus making it a novel potential therapeutic
for OS.
Supplementary Data
Availability of data and materials
The authors declare that all the data supporting
the findings in this study are available in this study and its
Supplementary materials, or are available from the corresponding
author on reasonable request.
Authors' contributions
FP, JL, DJ, ZhiZ and ZS designed the present study.
FP, JL, DJ, FC, XH, DS, WW, HL, ZL, ZheZ, LX, WB, ZhiZ and SZ
performed the experiments. PF, LJ and JD analyzed and interpreted
the data. FP, JL and DJ wrote the manuscript. ZhiZ and ZS
supervised the study. FP and SZ confirm the authenticity of all the
raw data. All authors read and approved the final version of the
manuscript and agreed to be accountable for all aspects of the
research in ensuring that the accuracy or integrity of any part of
the work are appropriately investigated and resolved.
Ethics approval and consent to
participate
The procedures involving animals were approved
(approval no. S2019009) by the Ethics Committee for Laboratory
Animals of Huazhong University of Science and Technology (Wuhan,
China).
Patient consent for publication
Not applicable.
Competing interests
The authors declare that they have no competing
interests.
Acknowledgments
The authors would like to thank Dr Y. Zhang (Center
for Genome Analysis, ABLife Inc., Wuhan, China) for providing us
with professional technology of iRIP-seq, and Dr J. Chen (Nanjing
Nansi Biological Technology Co., Ltd., Nanjing, China) for the
technical support for CoIP.
Funding
The present study was supported by The National Natural Science
Foundation of China (grant no. 81904231) and the China Postdoctoral
Science Foundation (grant no. 2020M672369).
References
|
1
|
Ritter J and Bielack SS: Osteosarcoma. Ann
Oncol. 21(Suppl 7): vii320–vii325. 2010. View Article : Google Scholar : PubMed/NCBI
|
|
2
|
Isakoff MS, Bielack SS, Meltzer P and
Gorlick R: Osteosarcoma: Current treatment and a collaborative
pathway to success. J Clin Oncol. 33:3029–3035. 2015. View Article : Google Scholar : PubMed/NCBI
|
|
3
|
Bishop MW, Janeway KA and Gorlick R:
Future directions in the treatment of osteosarcoma. Curr Opin
Pediatr. 28:26–33. 2016. View Article : Google Scholar :
|
|
4
|
Jarroux J, Morillon A and Pinskaya M:
History, discovery, and classification of lncRNAs. Adv Exp Med
Biol. 1008:1–46. 2017. View Article : Google Scholar : PubMed/NCBI
|
|
5
|
Zhu J, Fu H, Wu Y and Zheng X: Function of
lncRNAs and approaches to lncRNA-protein interactions. Sci China
Life Sci. 56:876–885. 2013. View Article : Google Scholar : PubMed/NCBI
|
|
6
|
Pu FF, Shi DY, Chen T, Liu YX, Zhong BL,
Zhang ZC, Liu WJ, Wu Q, Wang BC, Shao ZW, et al: SP1-induced long
non-coding RNA SNHG6 facilitates the carcinogenesis of
chondrosarcoma through inhibiting KLF6 by recruiting EZH2. Cell
Death Dis. 12:592021. View Article : Google Scholar : PubMed/NCBI
|
|
7
|
Shi D, Wu F, Mu S, Hu B, Zhong B, Gao F,
Qing X, Liu J, Zhang Z and Shao Z: LncRNA AFAP1-AS1 promotes
tumorigenesis and epithelial-mesenchymal transition of osteosarcoma
through RhoC/ROCK1/p38MAPK/Twist1 signaling pathway. J Exp Clin
Cancer Res. 38:3752019. View Article : Google Scholar : PubMed/NCBI
|
|
8
|
Vaupel P, Schmidberger H and Mayer A: The
Warburg effect: essential part of metabolic reprogramming and
central contributor to cancer progression. Int J Radiat Biol.
95:912–919. 2019. View Article : Google Scholar : PubMed/NCBI
|
|
9
|
Dayton TL, Jacks T and Vander Heiden MG:
PKM2, cancer metabolism, and the road ahead. EMBO Rep.
17:1721–1730. 2016. View Article : Google Scholar : PubMed/NCBI
|
|
10
|
Li YH, Li XF, Liu JT, Wang H, Fan LL, Li J
and Sun GP: PKM2, a potential target for regulating cancer. Gene.
668:48–53. 2018. View Article : Google Scholar : PubMed/NCBI
|
|
11
|
Wong N, Ojo D, Yan J and Tang D: PKM2
contributes to cancer metabolism. Cancer Lett. 356:184–191. 2015.
View Article : Google Scholar
|
|
12
|
Zhu S, Guo Y, Zhang X, Liu H, Yin M, Chen
X and Peng C: Pyruvate kinase M2 (PKM2) in cancer and cancer
therapeutics. Cancer Lett. 503:240–248. 2021. View Article : Google Scholar
|
|
13
|
Liu ZX, Hong L, Fang SQ, Tan GH, Huang PG,
Zeng Z, Xia X and Wang XX: Overexpression of pyruvate kinase M2
predicts a poor prognosis for patients with osteosarcoma. Tumour
Biol. 37:14923–14928. 2016. View Article : Google Scholar : PubMed/NCBI
|
|
14
|
Shang D, Wu J, Guo L, Xu Y, Liu L and Lu
J: Metformin increases sensitivity of osteosarcoma stem cells to
cisplatin by inhibiting expression of PKM2. Int J Oncol.
50:1848–1856. 2017. View Article : Google Scholar : PubMed/NCBI
|
|
15
|
Yuan Q, Yu H, Chen J, Song X and Sun L:
Antitumor effect of miR-1294/Pyruvate Kinase M2 signaling cascade
in osteosarcoma cells. Onco Targets Ther. 13:1637–1647. 2020.
View Article : Google Scholar : PubMed/NCBI
|
|
16
|
Corley M, Burns MC and Yeo GW: How
RNA-binding proteins interact with RNA: Molecules and mechanisms.
Mol Cell. 78:9–29. 2020. View Article : Google Scholar : PubMed/NCBI
|
|
17
|
Bielli P and Sette C: Analysis of in vivo
Interaction between RNA binding proteins and their RNA targets by
UV cross-linking and immunoprecipitation (CLIP) method. Bio Protoc.
7:e22742017. View Article : Google Scholar :
|
|
18
|
Chen T, Li Y, Cao W and Liu Y: miR-491-5p
inhibits osteosarcoma cell proliferation by targeting PKM2. Oncol
Lett. 16:6472–6478. 2018.PubMed/NCBI
|
|
19
|
Chen X, Chen S and Yu D: Protein kinase
function of pyruvate kinase M2 and cancer. Cancer Cell Int.
20:5232020. View Article : Google Scholar : PubMed/NCBI
|
|
20
|
Wyatt CA, Geoghegan JC and Brinckerhoff
CE: Short hairpin RNA-mediated inhibition of matrix
metalloproteinase-1 in MDA-231 cells: Effects on matrix destruction
and tumor growth. Cancer Res. 65:11101–11108. 2005. View Article : Google Scholar : PubMed/NCBI
|
|
21
|
Livak KJ and Schmittgen TD: Analysis of
relative gene expression data using real-time quantitative PCR and
the 2(-Delta Delta C(T)) method. Methods. 25:402–408. 2001.
View Article : Google Scholar
|
|
22
|
Xia H, Chen D, Wu Q, Wu G, Zhou Y, Zhang Y
and Zhang L: CELF1 preferentially binds to exon-intron boundary and
regulates alternative splicing in HeLa cells. Biochim Biophys Acta
Gene Regul Mech. 1860:911–921. 2017. View Article : Google Scholar : PubMed/NCBI
|
|
23
|
Xie C, Mao X, Huang J, Ding Y, Wu J, Dong
S, Kong L, Gao G, Li CY and Wei L: KOBAS 2.0: A web server for
annotation and identification of enriched pathways and diseases.
Nucleic Acids Res. 39:W316–W322. 2011. View Article : Google Scholar : PubMed/NCBI
|
|
24
|
Tang J, Yan T, Bao Y, Shen C, Yu C, Zhu X,
Tian X, Guo F, Liang Q, Liu Q, et al: LncRNA GLCC1 promotes
colorectal carcinogenesis and glucose metabolism by stabilizing
c-Myc. Nat Commun. 10:34992019. View Article : Google Scholar : PubMed/NCBI
|
|
25
|
Zhao Y, Liu Y, Lin L, Huang Q, He W, Zhang
S, Dong S, Wen Z, Rao J, Liao W and Shi M: The lncRNA MACC1-AS1
promotes gastric cancer cell metabolic plasticity via AMPK/Lin28
mediated mRNA stability of MACC1. Mol Cancer. 17:692018. View Article : Google Scholar : PubMed/NCBI
|
|
26
|
He L, Zhang H and Zhou X: Weanling
offspring of dams maintained on serine-deficient diet are
vulnerable to oxidative stress. Oxid Med Cell Longev.
2018:80264962018. View Article : Google Scholar : PubMed/NCBI
|
|
27
|
Soga T, Baran R, Suematsu M, Ueno Y, Ikeda
S, Sakurakawa T, Kakazu Y, Ishikawa T, Robert M, Nishioka T and
Tomita M: Differential metabolomics reveals ophthalmic acid as an
oxidative stress biomarker indicating hepatic glutathione
consumption. J Biol Chem. 281:16768–16776. 2006. View Article : Google Scholar : PubMed/NCBI
|
|
28
|
Jin C, Zhu X, Wu H, Wang Y and Hu X:
Perturbation of phosphoglycerate kinase 1 (PGK1) only marginally
affects glycolysis in cancer cells. J Biol Chem. 295:6425–6446.
2020. View Article : Google Scholar : PubMed/NCBI
|
|
29
|
Liang Y, Song X, Li Y, Chen B, Zhao W,
Wang L, Zhang H, Liu Y, Han D, Zhang N, et al: LncRNA BCRT1
promotes breast cancer progression by targeting miR-1303/PTBP3
axis. Mol Cancer. 19:852020. View Article : Google Scholar : PubMed/NCBI
|
|
30
|
Yang XF, Zhou SY, Wang C, Huang W, Li N,
He F and Li FR: Inhibition of LSD1 promotes the differentiation of
human induced pluripotent stem cells into insulin-producing cells.
Stem Cell Res Ther. 11:1852020. View Article : Google Scholar : PubMed/NCBI
|
|
31
|
Geng F, Cheng X, Wu X, Yoo JY, Cheng C,
Guo JY, Mo X, Ru P, Hurwitz B, Kim SH, et al: Inhibition of SOAT1
suppresses glioblastoma growth via blocking SREBP-1-mediated
lipogenesis. Clin Cancer Res. 22:5337–5348. 2016. View Article : Google Scholar : PubMed/NCBI
|
|
32
|
Loregger A, Raaben M, Nieuwenhuis J, Tan
JM, Jae LT, van Den Hengel LG, Hendrix S, van Den Berg M, Scheij S,
Song JY, et al: Haploid genetic screens identify SPRING/C12ORF49 as
a determinant of SREBP signaling and cholesterol metabolism. Nat
Commun. 11:11282020. View Article : Google Scholar : PubMed/NCBI
|
|
33
|
World Medical Association and American
Physiological Society: Guiding principles for research involving
animals and human beings. Am J Physiol Regul Integr Comp Physiol.
283:R281–R283. 2002. View Article : Google Scholar : PubMed/NCBI
|
|
34
|
Pu F, Chen F, Zhang Z, Qing X, Lin H, Zhao
L, Xia P and Shao Z: TIM-3 expression and its association with
overall survival in primary osteosarcoma. Oncol Lett. 18:5294–5300.
2019.PubMed/NCBI
|
|
35
|
Tang T, Guo C, Xia T, Zhang R, Zen K, Pan
Y and Jin L: LncCCAT1 promotes breast cancer stem cell function
through activating WNT/β-catenin signaling. Theranostics.
9:7384–7402. 2019. View Article : Google Scholar :
|
|
36
|
Yang W, Zheng Y, Xia Y, Ji H, Chen X, Guo
F, Lyssiotis CA, Aldape K, Cantley LC and Lu Z: ERK1/2-dependent
phosphorylation and nuclear translocation of PKM2 promotes the
warburg effect. Nat Cell Biol. 14:1295–1304. 2012. View Article : Google Scholar : PubMed/NCBI
|
|
37
|
Iansante V, Choy PM, Fung SW, Liu Y, Chai
JG, Dyson J, Del Rio A, D'Santos C, Williams R, Chokshi S, et al:
PARP14 promotes the warburg effect in hepatocellular carcinoma by
inhibiting JNK1-dependent PKM2 phosphorylation and activation. Nat
Commun. 6:78822015. View Article : Google Scholar : PubMed/NCBI
|
|
38
|
Liang J, Cao R, Zhang Y, Xia Y, Zheng Y,
Li X, Wang L, Yang W and Lu Z: PKM2 dephosphorylation by Cdc25A
promotes the warburg effect and tumorigenesis. Nat Commun.
7:124312016. View Article : Google Scholar : PubMed/NCBI
|
|
39
|
Herjan T, Hong L, Bubenik J, Bulek K, Qian
W, Liu C, Li X, Chen X, Yang H, Ouyang S, et al:
IL-17-receptor-associated adaptor Act1 directly stabilizes mRNAs to
mediate IL-17 inflammatory signaling. Nat Immunol. 19:354–365.
2018. View Article : Google Scholar : PubMed/NCBI
|
|
40
|
Abedini P, Fattahi A, Agah S, Talebi A,
Beygi AH, Amini SM, Mirzaei A and Akbari A: Expression analysis of
circulating plasma long noncoding RNAs in colorectal cancer: The
relevance of lncRNAs ATB and CCAT1 as potential clinical hallmarks.
J Cell Physiol. 234:22028–22033. 2019. View Article : Google Scholar : PubMed/NCBI
|
|
41
|
Yang W, Xia Y, Ji H, Zheng Y, Liang J,
Huang W, Gao X, Aldape K and Lu Z: Nuclear PKM2 regulates β-catenin
transactivation upon EGFR activation. Nature. 480:118–122. 2011.
View Article : Google Scholar : PubMed/NCBI
|
|
42
|
Zhu H, Luo H and Zhu X, Hu X, Zheng L and
Zhu X: Pyruvate kinase M2 (PKM2) expression correlates with
prognosis in solid cancers: A meta-analysis. Oncotarget.
8:1628–1640. 2017. View Article : Google Scholar :
|
|
43
|
Wiese EK and Hitosugi T: Tyrosine kinase
signaling in cancer metabolism: PKM2 paradox in the warburg effect.
Front Cell Dev Biol. 6:792018. View Article : Google Scholar : PubMed/NCBI
|
|
44
|
Alquraishi M, Puckett DL, Alani DS,
Humidat AS, Frankel VD, Donohoe DR, Whelan J and Bettaieb A:
Pyruvate kinase M2: A simple molecule with complex functions. Free
Radic Biol Med. 143:176–192. 2019. View Article : Google Scholar : PubMed/NCBI
|
|
45
|
Israelsen WJ and Vander Heiden MG:
Pyruvate kinase: Function, regulation and role in cancer. Semin
Cell Dev Biol. 43:43–51. 2015. View Article : Google Scholar : PubMed/NCBI
|
|
46
|
Luo W and Semenza GL: Emerging roles of
PKM2 in cell metabolism and cancer progression. Trends Endocrinol
Metab. 23:560–566. 2012. View Article : Google Scholar : PubMed/NCBI
|
|
47
|
Hombach S and Kretz M: Non-coding RNAs:
Classification, biology and functioning. Adv Exp Med Biol.
937:3–17. 2016. View Article : Google Scholar : PubMed/NCBI
|
|
48
|
Li Q, Uemura Y and Kawahara Y:
Cross-linking and immunoprecipitation of nuclear RNA-binding
proteins. Methods Mol Biol. 1262:247–263. 2015. View Article : Google Scholar : PubMed/NCBI
|
|
49
|
Chen F, Wang Q, Yu X, Yang N, Wang Y, Zeng
Y, Zheng Z, Zhou F and Zhou Y: MCPIP1-mediated NFIC alternative
splicing inhibits proliferation of triple-negative breast cancer
via cyclin D1-Rb-E2F1 axis. Cell Death Dis. 12:3702021. View Article : Google Scholar : PubMed/NCBI
|
|
50
|
Li W, Zhang Z, Liu X, Cheng X, Zhang Y,
Han X, Zhang Y, Liu S, Yang J, Xu B, et al: The FOXN3-NEAT1-SIN3A
repressor complex promotes progression of hormonally responsive
breast cancer. J Clin Invest. 127:3421–3440. 2017. View Article : Google Scholar : PubMed/NCBI
|
|
51
|
Bhan A, Soleimani M and Mandal SS: Long
noncoding RNA and cancer: A new paradigm. Cancer Res. 77:3965–3981.
2017. View Article : Google Scholar : PubMed/NCBI
|
|
52
|
Peng WX, Koirala P and Mo YY:
LncRNA-mediated regulation of cell signaling in cancer. Oncogene.
36:5661–5667. 2017. View Article : Google Scholar : PubMed/NCBI
|
|
53
|
Sanchez Calle A, Kawamura Y, Yamamoto Y,
Takeshita F and Ochiya T: Emerging roles of long non-coding RNA in
cancer. Cancer Sci. 109:2093–2100. 2018. View Article : Google Scholar : PubMed/NCBI
|
|
54
|
Tao T, Wu S, Sun Z, Ma W, Zhou S, Deng J,
Su Q, Peng M, Xu G and Yang X: The molecular mechanisms of
LncRNA-correlated PKM2 in cancer metabolism. Biosci Rep.
39:BSR201924532019. View Article : Google Scholar : PubMed/NCBI
|
|
55
|
Puckett DL, Alquraishi M, Chowanadisai W
and Bettaieb A: The role of PKM2 in metabolic reprogramming:
Insights into the regulatory roles of non-coding RNAs. Int J Mol
Sci. 22:11712021. View Article : Google Scholar : PubMed/NCBI
|
|
56
|
Wang C, Li Y, Yan S, Wang H, Shao X, Xiao
M, Yang B, Qin G, Kong R, Chen R and Zhang N: Interactome analysis
reveals that lncRNA HULC promotes aerobic glycolysis through LDHA
and PKM2. Nat Commun. 11:31622020. View Article : Google Scholar : PubMed/NCBI
|
|
57
|
Panasyuk G, Espeillac C, Chauvin C,
Pradelli LA, Horie Y, Suzuki A, Annicotte JS, Fajas L, Foretz M,
Verdeguer F, et al: PPAR gamma contributes to PKM2 and HK2
expression in fatty liver. Nat Commun. 3:6722012. View Article : Google Scholar
|
|
58
|
Zhao X, Zhao L, Yang H, Li J, Min X, Yang
F, Liu J and Huang G: Pyruvate kinase M2 interacts with nuclear
sterol regulatory element-binding protein 1a and thereby activates
lipogenesis and cell proliferation in hepatocellular carcinoma. J
Biol Chem. 293:6623–6634. 2018. View Article : Google Scholar : PubMed/NCBI
|
|
59
|
Eberle D, Hegarty B, Bossard P, Ferré P
and Foufelle F: SREBP transcription factors: Master regulators of
lipid homeostasis. Biochimie. 86:839–848. 2004. View Article : Google Scholar : PubMed/NCBI
|
|
60
|
Horton JD, Goldstein JL and Brown MS:
SREBPs: Activators of the complete program of cholesterol and fatty
acid synthesis in the liver. J Clin Invest. 109:1125–1131. 2002.
View Article : Google Scholar : PubMed/NCBI
|
|
61
|
Zeng L, Lu M, Mori K, Luo S, Lee AS, Zhu Y
and Shyy JY: ATF6 modulates SREBP2-mediated lipogenesis. EMBO J.
23:950–958. 2004. View Article : Google Scholar : PubMed/NCBI
|