Introduction
Ovarian cancer is the eighth leading cause of
cancer-associated mortality in females and is the third most common
gynecological malignancy worldwide (1). This disease is a major clinical
challenge in gynecological oncology, with the highest mortality
rate of all malignancies of the female reproductive system
(2). Most patients have almost no
symptoms in the early stage of the disease. By contrast,
nonspecific symptoms associated with more frequent benign
conditions occur in the advanced stage of ovarian cancer, delaying
the timely diagnosis of the disease (2,3). The
diagnosis is further complicated because of different histological
subtypes of ovarian cancer with various biological and clinical
features (4).
Serous ovarian carcinomas are the most common form
of ovarian cancer and account for a ~75% of all ovarian epithelial
tumors. High-(HGSC) and low-grade serous ovarian carcinomas (LGSC)
represent ~70% and <5% of all epithelial ovarian cancers,
respectively (5). Although both
are serous in histological type, HGSCs and LGSCs are two different
entities with distinct pathogenesis, molecular and genetic changes,
origin and prognosis (5). The
exact origin of the LGSC and HGSC is still unknown. LGSC most
likely arises from fallopian tube epithelium (FTE) (6), while the origin of HGSC is probably
dual, and it may arise from ovarian surface epithelium (OSE) or FTE
(7).
Aberrant activation of several signaling pathways,
including the Hedgehog (Hh) signaling pathway, has been previously
observed in ovarian cancer (8-10).
The Hh signaling pathway is an evolutionarily conserved signaling
pathway essential for the development of a normal embryo (11). However, in the adult organism, this
signaling pathway is inactive in most organs, therefore its
aberrant activation in adulthood is associated with the development
of various cancer types, such as skin, brain, liver, gallbladder,
pancreas, stomach, colon, breast, lung and prostate cancer, as well
as hematological malignancies (11,12).
The Hh signaling pathway is activated when one of
the three Hh ligands, sonic hedgehog, indian hedgehog or desert
hedgehog, binds to 12-pass transmembrane receptor protein patched
homolog 1 (PTCH1) or protein patched homolog 2 (PTCH2), thus
suppressing its activity. In the absence of Hh ligands, activated
PTCH1 represses Hh signaling (13,14).
PTCH1 is the primary receptor of the Hh signaling pathway. The
human PTCH1 gene encodes a transmembrane glycoprotein of
1,447 amino acids (~161 kDa) (15). PTCH1 receptor contains a
transmembrane domain, two large extracellular domains (ECDs), ECD1
and ECD2 and three large cytoplasmic domains, N-terminal domain
(NTD), middle loop and C-terminal domain (16,17).
Although PTCH1 is a negative regulator of Hh
signaling, this receptor serves as a marker of canonical Hh
signaling activation (18). Since
the PTCH1 gene contains binding sites for GLI transcription
factors, its expression is enhanced when Hh signaling is activated,
creating a negative feedback loop (19,20).
If PTCH1 loses its function, either due to gene mutations or
epimutations, aberrant activation of the Hh signaling will occur
(12). Inactivating mutations and
hypermethylation of the PTCH1 gene have been observed in
various cancer types, such as colorectal, breast, gastric, ovarian
and basal cell carcinoma (21-27).
However, numerous studies have shown that PTCH1 protein, otherwise
known to act as a tumor suppressor, has increased expression in
several cancers, including breast, prostate, lung, colon, brain
cancers and melanoma (28-30). A recent study has shown that the
PTCH1 receptor can also serve as a transporter that releases
chemotherapeutic agents out of the cell and thus contributes to
chemotherapy resistance (30). The
increased expression of PTCH1 protein in the tumor tissue can
attributed to possible changes in the structure and function of
this protein during carcinogenesis. These changes can be triggered
by mutations in the PTCH1 gene, whereby PTCH1 loses its
original tumor suppressor role and gains a novel tumor promoter
role (22).
Increased expression of the PTCH protein has also
been observed in ovarian cancer, where expression of this protein
was increased stepwise in benign, borderline and malignant
neoplasms (31). PTCH protein
expression was associated with increased tumor cell proliferation
and was positively correlated with poor survival of patients with
ovarian cancer (31,32). On the other hand, there are studies
with conflicting results where reduced expression of PTCH1 protein
has been observed in ovarian tumor tissues and ovarian cancer cell
lines (33,34). Patients with ovarian cancer with
decreased expression of PTCH1 protein were found to have a poorer
prognosis than patients with increased expression of this protein
(34).
Although the aforementioned studies have shown that
PTCH1 could be involved in the molecular pathogenesis of ovarian
cancer, its role in ovarian cancer subtypes has not been
sufficiently investigated. Therefore, the present study further
explored the role of PTCH1 protein and its promoter methylation
status in serous ovarian carcinomas and corresponding cell
lines.
Materials and methods
Tissue samples
Formalin-fixed paraffin-embedded (FFPE) samples of
48 serous ovarian carcinomas (LGSC, n=11; HGSC, n=37), 20 samples
of healthy ovarian tissue and 10 samples of healthy fallopian tube
tissue were used for the present study. Other histologic subtypes
of invasive ovarian carcinomas (e.g., mucinous, endometrioid or
clear cell carcinomas), borderline and benign tumors were excluded
from the study. The age ranges were as follows: 37-81 years for the
HGSC group, 48-86 years for the LGSC group, 52-81 years for the
healthy ovarian control group and 50-68 years for the fallopian
tube control group; there were no significant differences among the
groups in terms of age. Board-certified pathologists reviewed the
representative slides (SV and AS) to confirm the diagnosis (LGSC or
HGSC) and selected appropriate healthy and malignant tissues for
immunohistochemical and molecular analyses. Both pathologists were
completely blinded to the clinical and pathological information of
the subjects. They assessed the samples independently and in case
of any discrepancy, a consensus was reached using a double-headed
microscope. The tissue samples used in the current study were a
part of the archival collection of cancer tissue samples, collected
from January 2000 to January 2012, from the School of Medicine,
University of Zagreb, assembled in collaboration with University
Hospital Merkur, both of which are part of the Scientific Center of
Excellence in Reproductive and Regenerative Medicine (Zagreb,
Croatia).
Cell lines and culture
HGSC cell lines, OVCAR8 and OVSAHO, and normal
telomerase reverse transcriptase-immortalized fallopian tube
non-ciliated epithelial cell line FNE1 (serving as normal control)
were used in the current study. OVCAR8 was a kind gift from Dr
Ernst Lengyel (University of Chicago). OVSAHO was obtained from the
Japanese Collection of Research Bioresources Cell Bank and FNE1
from the Live Tumor Culture Core (University of Miami, Sylvester
Comprehensive Cancer Center). OVCAR8 and OVSAHO cell lines were
grown in DMEM with 4.5 g/l D-glucose and L-glutamine (Gibco; Thermo
Fisher Scientific, Inc.) along with 10% FBS (Gibco; Thermo Fisher
Scientific, Inc.), 1 mM sodium pyruvate (Sigma-Aldrich; Merck
KGaA), 1% MEM vitamins (Gibco; Thermo Fisher Scientific, Inc.), 1%
MEM nonessential amino acids (Sigma-Aldrich; Merck KGaA) and 1%
penicillin-streptomycin (Sigma-Aldrich; Merck KGaA). FNE1 cells
were grown in Fallopian Ovary Modified Ince medium (Live Tumor
Culture Core, University of Miami, Sylvester Comprehensive Cancer
Center) supplemented with 25 ng/ml cholera toxin (Sigma-Aldrich;
Merck KGaA) in Corning® Primaria™ cell culture dishes
(Corning, Inc.). All cell lines were cultured at 37°C in a
humidified atmosphere with 5% CO2.
Immunohistochemistry (IHC)
IHC staining was performed using the
biotin-avidin-streptavidin HRP method with the Dako REAL Envision
detection system; cat. no. K0679; Dako; Agilent Technologies, Inc.)
used for visualization according to the manufacturer's instructions
on 4-µm thick FFPE sections that were placed on silanized
glass slides (Dako; Agilent Technologies, Inc.) as previously
described (35). The sections were
counterstained with hematoxylin at room temperature (RT) for 1 min.
The primary antibodies (anti-PTCH1) used in this experiment are
listed in Table I. Healthy
placental tissue (part of a collection of placental tissue samples,
collected from January 2012 to December 2012, belonging to the
University of Zagreb School of Medicine that had been collected in
collaboration with the University Hospital Merkur, both of which
are parts of the Scientific Center of Excellence for Reproductive
and Regenerative Medicine) was used as a positive control (data not
shown). The negative control was treated similarly with the
omission of incubation with the primary antibodies. Tissue sections
were examined using a light microscope (Olympus CX22; Olympus Life
Science).
 | Table IList and specifications of anti-PTCH1
primary antibodies used in IHC, IF and WB. |
Table I
List and specifications of anti-PTCH1
primary antibodies used in IHC, IF and WB.
| Antibody | Antigen | Host and
clonality | Epitope, aa | Dilution | Catalogue number
and manufacturer |
|---|
| Anti-PTCH1a | PTCH1 | Rabbit
polyclonal | 1-50 | IHC, 1:500; IF,
1:100; WB, 1:1,000 | ab129341;
Abcam |
| Anti-PTCH1b | PTCH1 | Rabbit
polyclonal | 1-50 | IHC, 1:300; IF,
1:100; WB, 1:1,000 | ab53715; Abcam |
| Anti-PTCH1c | PTCH1 | Rabbit
polyclonal | 1-80 | IHC, 1:300; IF,
1:100; WB, 1:1,000 | OASG05688; Aviva
Systems Biology, Corp. |
| Anti-PTCH1d | PTCH1 | Mouse
monoclonal | 122-436 | IHC, 1:50; IF,
1:25; WB, 1:500 | NBP1-47945; Novus
Biologicals, LLC |
PTCH1 expression in serous ovarian carcinomas and
healthy tissues was interpreted independently by two pathologists
(SV and AS). The quantification was performed using the H-score
system. The intensity, scored between no staining (0) and strong
staining (3+), and the proportion of the PTCH1 protein in different
cellular compartments (cytoplasm and nucleus) were assessed. The
score was obtained using the following formula: H-score = (% of
weakly stained cytoplasm/nuclei ×1) + (% of moderately stained
cytoplasm/nuclei ×2) + (% of strongly stained cytoplasm/nuclei ×3).
The range of possible scores was between 0 and 300. PTCH1 protein
expression was observed in epithelial and stromal cells. H-score
for total expression of PTCH1 protein was calculated as a sum of
H-scores obtained for the cytoplasmic and nuclear protein
expression, with the range of possibles scores between 0 and 600.
In case of discordant interpretation, the pathologists reviewed
cases together to obtain a complete concordance. Few samples of
HGSC and LGSC tissues were stained for PTCH1 protein using
anti-PTCH1b, anti-PTCH1c, and anti-PTCH1d antibodies to confirm the
subcellular localization of PTCH1 protein.
Immunofluorescence (IF)
Cells (OVCAR8, OVSAHO and FNE1) grown on glass
coverslips (Thermo Fisher Scientific, Inc.) were fixed with 4%
paraformaldehyde solution (Santa Cruz Biotechnology, Inc.) for 15
min at RT. Samples were washed with 1X DPBS buffer (Gibco; Thermo
Fisher Scientific, Inc.) and permeabilized with 0.1% saponin
(Sigma-Aldrich; Merck KGaA) in 1X DPBS (PMS buffer) for 10 min at
RT. After permeabilization, cells were incubated in blocking buffer
(PMS buffer with 5% FBS) for 1 h at RT. Samples were incubated
overnight at 4°C with primary anti-PTCH1 antibodies listed in
Table I. All anti-PTCH1 antibodies
were used for IF staining. Cells were washed and incubated for 1 h
at RT with solution containing anti-rabbit Alexa Fluor 488
(dilution 1:300; cat. no. A-21206; Invitrogen; Thermo Fisher
Scientific, Inc.) or anti-mouse Cy3 antibody (dilution 1:300; cat.
no. 715-165-150; Jackson ImmunoResearch Europe, Ltd.) with Hoechst
33342 stain (NucBlue Live ReadyProbes Reagent; dilution 1:10;
Invitrogen; Thermo Fisher Scientific, Inc.). After incubation with
secondary antibodies, samples were washed and mounted using a
fluorescence mounting medium (Dako; Agilent Technologies, Inc.).
Cells were examined using an inverted Leica SP8-X FLIM confocal
microscope. ImageJ software version 1.51 (function 'measure';
National Institutes of Health) was used to quantify mean
fluorescence intensity.
Western blot analysis
Total proteins were isolated from OVCAR8, OVSAHO,
and FNE1 cell lines using ice-cold RIPA buffer (150 mM NaCl, 50 mM
Tris/HCl pH 8.0, 1% Triton X-100, 0.5% sodium deoxycholate, 0.1%
SDS) containing complete protease inhibitor (Roche Diagnostics) and
1 mM PMSF (Thermo Fisher Scientific, Inc.) as previously described
(36). Protein concentrations were
determined by the BCA assay (Sigma-Aldrich; Merck KGaA) according
to the manufacturer's instructions. The Subcellular Protein
Fractionation Kit for Cultured Cells (cat. no. 78840; Thermo Fisher
Scientific, Inc.) was used to segregate and enrich proteins from
five cellular compartments (cytoplasmic, membrane, nuclear soluble,
chromatin-bound and cytoskeletal proteins). Proteins were enriched
and extracted according to the manufacturer's instructions.
For western blot analysis, 10% polyacrylamide gels
were used to separate 10 µg of total protein samples/lane
and 10 µl of each protein fraction. Western blotting was
performed as previously described (36). The membranes were probed with
rabbit polyclonal anti-GAPDH antibody (dilution, 1:2,000; cat no.
IMG-5143A; IMGENEX), rabbit monoclonal
anti-Na+/K+ ATPase antibody (dilution,
1:50,000; cat no. ab76020; Abcam), goat polyclonal anti-fibrillarin
antibody (dilution, 1:1,000; cat no. sc-11335; Santa Cruz
Biotechnology, Inc.), mouse monoclonal anti-H3K4me2 antibody
(dilution, 1:2,000; clone CMA303; cat. no. 05-1338; Sigma-Aldrich;
Merck KGaA) and rabbit polyclonal anti-β-actin antibody (dilution,
1:2,000; cat. no. ab8227; Abcam) to verify the efficiency of
protein extraction from different cellular compartments. Anti-PTCH1
primary antibodies used in this experiment are listed in Table I. HRP-conjugated secondary
antibodies goat anti-rabbit (dilution, 1:5,000; cat. no. P0448;
Dako; Agilent Technologies, Inc.), donkey anti-goat (dilution,
1:10,000; cat. no. sc-2033; Santa Cruz Biotechnology, Inc.), goat
anti-mouse (dilution, 1:12,500; cat. no. 170-6516; Bio-Rad
Laboratories, Inc.) and SuperSignal™ West Femto Maximum Sensitivity
Substrate (Thermo Fisher Scientific, Inc.) were used to visualize
reactive bands.
Methylation-specific PCR
DNA was isolated from two 10-µm sections of
FFPE tissue as previously described (37). DNA was also extracted from cultured
cells (OVCAR8, OVSAHO and FNE1) using cell lysis buffer (100 mM
NaCl, 10 mM Tris pH 8.0, 25 mM EDTA pH 8.0, 0.5% SDS, 0.1 mg/ml
proteinase K; 1 ml buffer per 108 cells). Samples were
incubated in lysis buffer overnight at 300 revolutions/min and
50°C. An equal volume of ROTI®Phenol/Chloroform/Isoamyl
alcohol (Carl Roth GmbH & Co. Kg) was added to the lysed cell
suspensions. Samples were vortexed vigorously and subsequently
centrifuged at 16,000 × g for 5 min at RT. The aqueous phase
containing the purified DNA was transferred to a clean tube. DNA
was precipitated using ice-cold absolute ethanol. Isolated DNA was
treated with bisulfite using the MethylEdge Bisulfite Conversion
System (Promega Corporation) according to the manufacturer's
instructions. Bisulfite-treated DNA was used for the
methylation-specific PCR. Primers for PTCH1 promoter region
were synthesized according to Peng et al (38): Methylated PTCH1 forward,
5′-AAT TAA GGA GTT GTT GCG GTC-3′ and reverse, 5′-GCT AAA CCA TTC
TAT CCC CGT A-3′ (125 bp); unmethylated PTCH1 forward,
5′-ATT AAG GAG TTG TTG TGG TTG T-3′ and reverse, 5′-ACT AAA CCA TTC
TAT CCC CAT A-3′ (124 bp). All PCRs were performed using TaKaRa
EpiTaq HS (for bisulfite-treated DNA) (Takara Bio, Inc.), including
1X EpiTaq PCR Buffer (Mg2+ free), 2.5 mM
MgCl2, 0.3 mM dNTPs, 20 pmol of each primer
(Sigma-Aldrich; Merck KGaA), 50 ng DNA and 1.5 unit TaKaRa EpiTaq
HS DNA Polymerase in a 50 µl final reaction volume. PCR
cycling conditions for both unmethylated and methylated primers
were as follows: Initial denaturation at 95°C for 30 sec, followed
by 40 cycles of 95°C for 30 sec, 61°C for 30 sec and 72°C for 30
sec, followed by a final extension at 72°C for 7 min. PCR products
were separated on 2% agarose gels, stained with GelStar Nucleic
Acid Gel Stain (Lonza Group, Ltd.) and visualized on a UV
transilluminator. Methylated Human Control DNA (Promega
Corporation) was used as a positive control for the methylated
reaction, unmethylated human EpiTect Control DNA (Qiagen GmbH) was
used as a positive control for the unmethylated reaction, and
nuclease-free water was used as a negative control.
Statistical analysis
The Kolmogorov-Smirnov and Shapiro-Wilk W tests were
employed to assess the distribution of the data. SPSS software v21
(IBM Corp.) was used for the statistical analysis. The difference
in total, cytoplasmic and nuclear expression of PTCH1 protein among
ovarian tumor samples compared with healthy ovarian and fallopian
tube tissue was assessed using Kruskal-Wallis followed by Dunn's
multiple comparisons test, while the difference in the expression
of PTCH1 between the epithelium and stroma of ovarian tumor samples
and normal tissue samples was assessed using the Wilcoxon
signed-rank test. Spearman's correlation was used to examine the
correlation between DNA promoter methylation of the PTCH1
gene and the expression of the corresponding protein. The
difference in mean fluorescence intensity among cancer (OVCAR8 and
OVSAHO) and control (FNE1) cell lines was assessed using
Kruskal-Wallis followed by Dunn's multiple comparisons test. The IF
experiment was repeated three times for each cell line. P<0.05
was considered to indicate a statistically significant
difference.
Results
PTCH1 protein expression in serous
ovarian carcinomas
Analysis of PTCH1 protein expression indicated
increased nuclear expression of this protein in tumor tissues
(Fig. 1A and B). In addition to
nuclear expression, cytoplasmic expression of this protein was also
observed (Fig. 1A-D). The results
of IHC analysis of nuclear, cytoplasmic and total PTCH1 protein
expression in tumor epithelium and its connective stroma and
epithelial and stromal compartments of control samples are shown in
Fig. 1E-J.
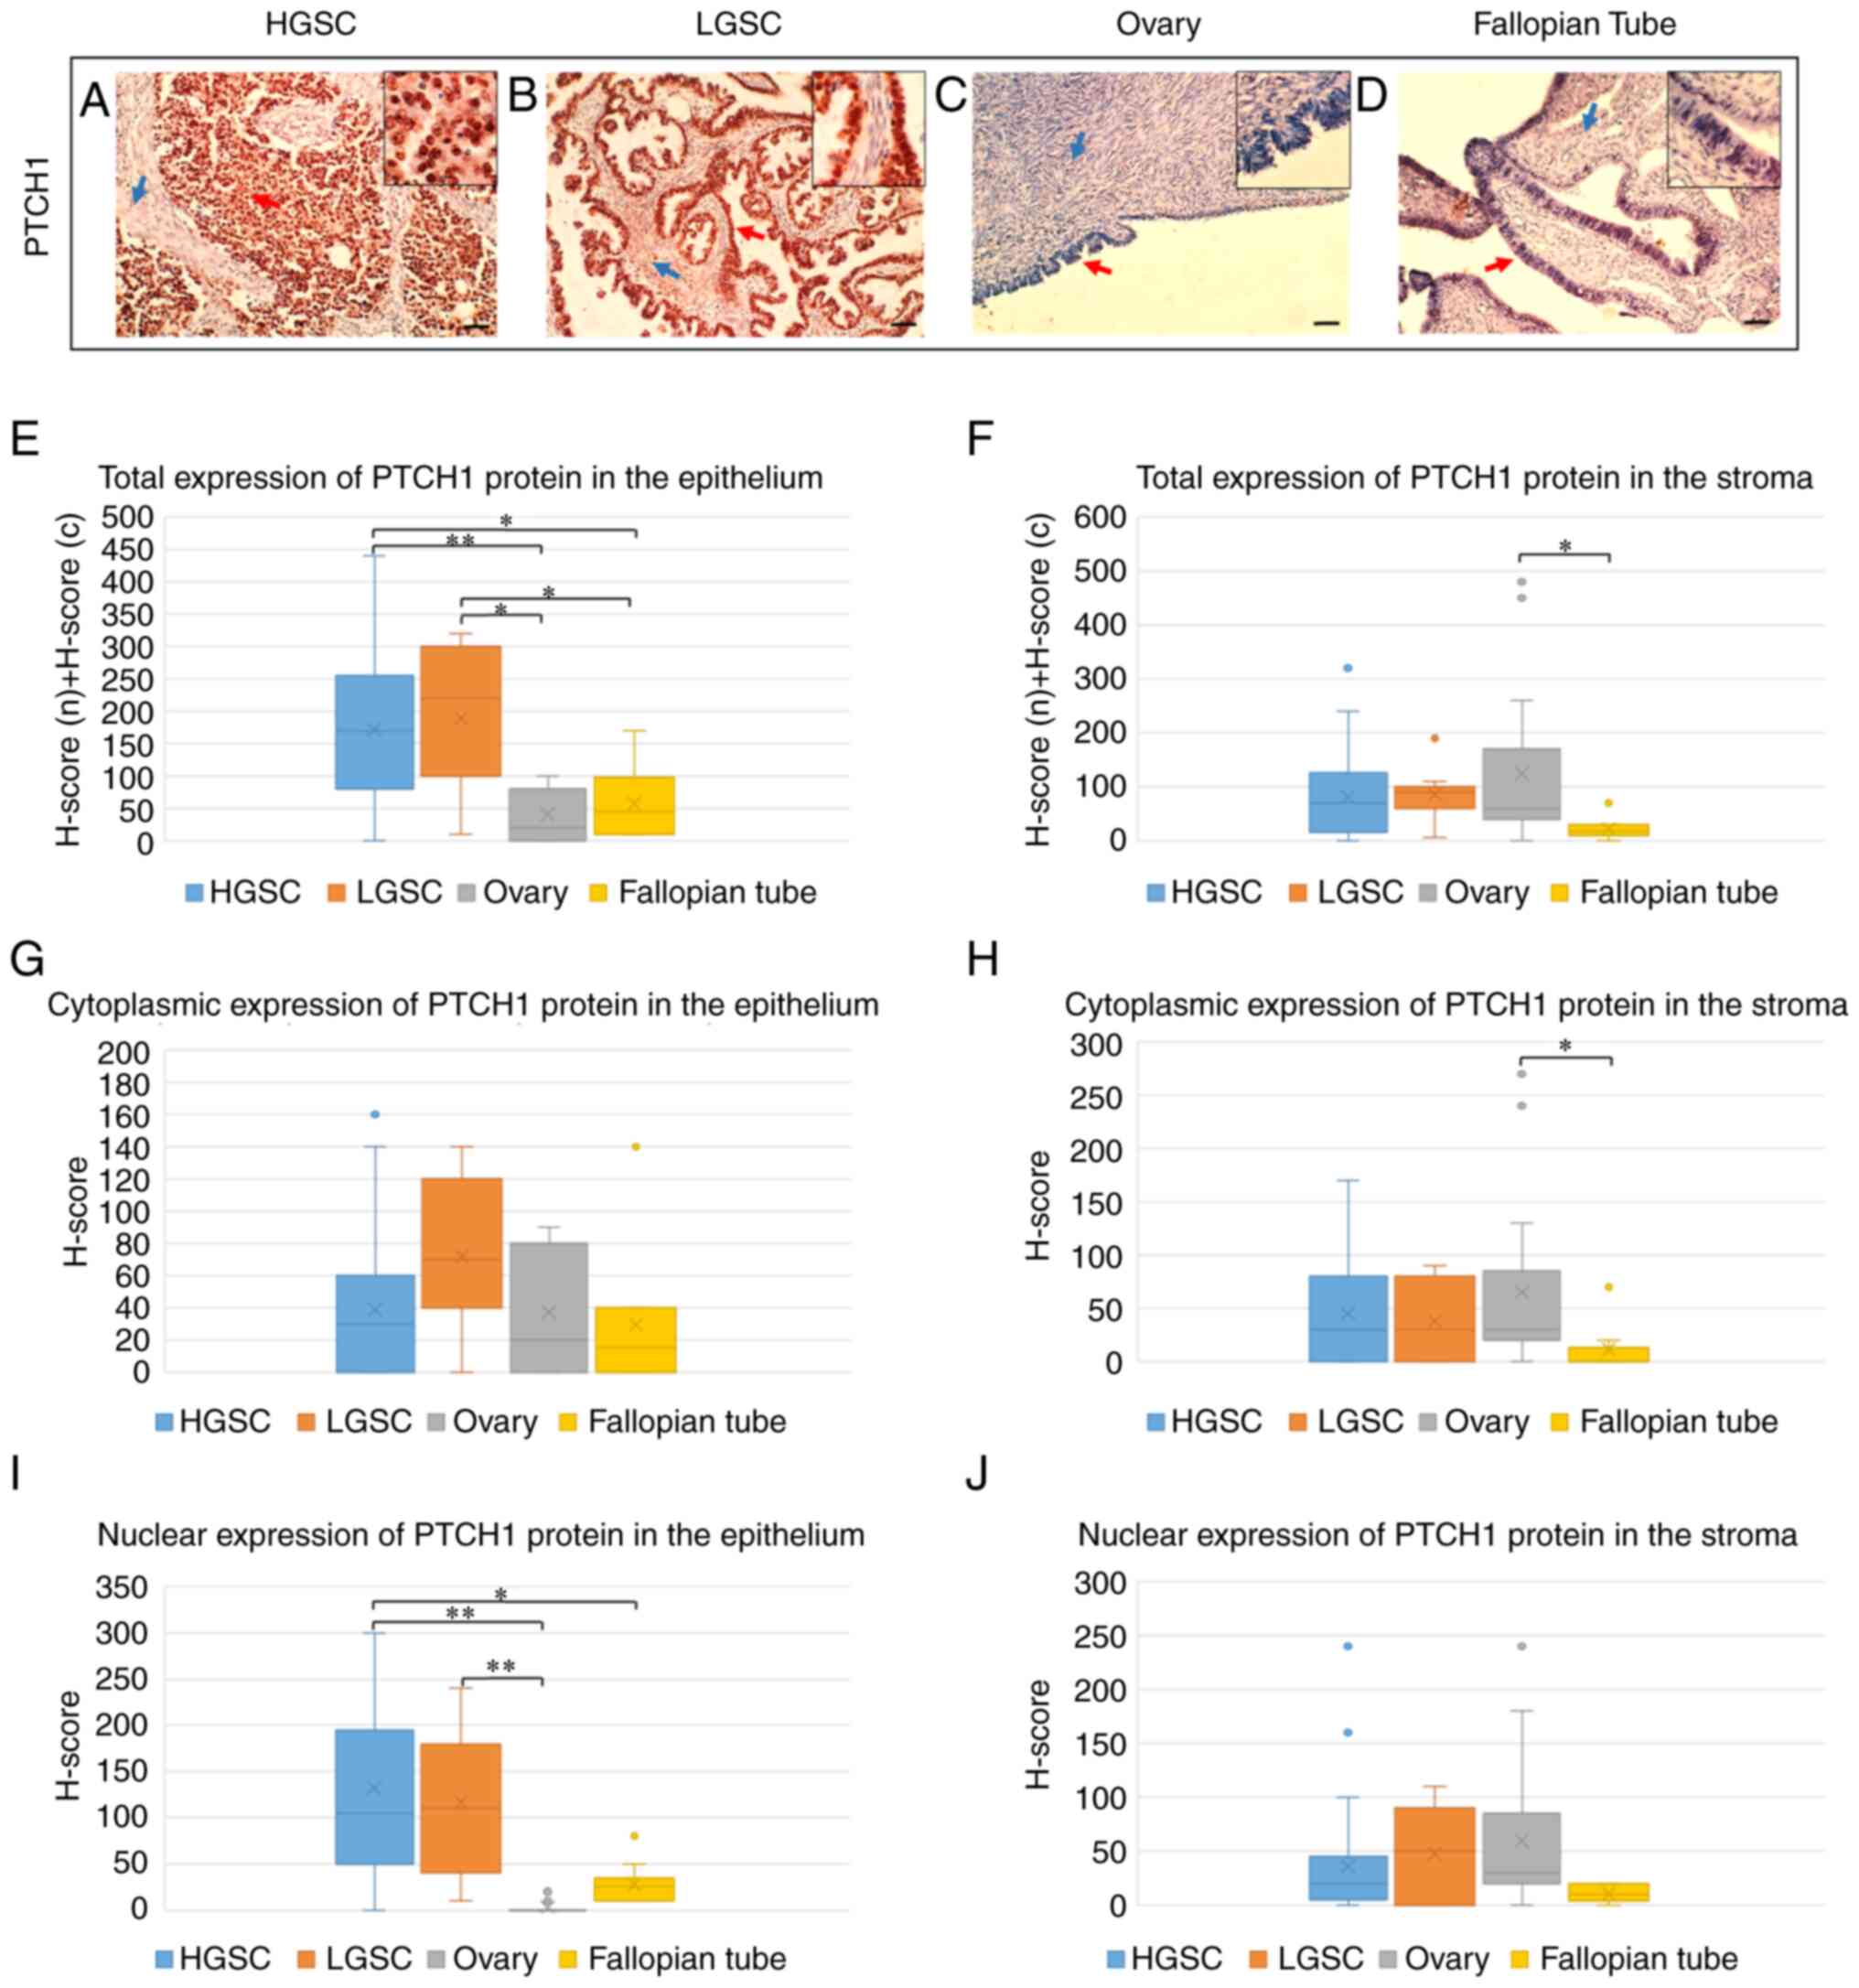 | Figure 1Immunohistochemical staining of PTCH1
protein in (A) HGSC, (B) LGSC, (C) healthy ovarian tissue and (D)
healthy fallopian tube tissue. Red arrows point to the epithelium,
while blue arrows point to the stroma (scale bar, 100 µm;
magnified windows, magnification, ×400). (E) Total, (G) cytoplasmic
and (I) nuclear expression of PTCH1 protein in the tumor epithelium
of HGSCs and LGSCs and epithelium of healthy ovaries and fallopian
tubes, and (F) total, (H) cytoplasmic and (J) nuclear expression of
PTCH1 protein in the connective stroma of HGSCs and LGSCs and
ovarian and fallopian tube stroma, determined by
immunohistochemical analysis (H-score). H score (n) + H score (c)
is a sum of H-scores calculated for the nuclear and cytoplasmic
protein expression. *P<0.05,
**P<0.0001. HGSC, high-grade serous ovarian
carcinoma; LGSC, low-grade serous ovarian carcinoma; PTCH1, protein
patched homolog 1; n, nuclear; c, cytoplasmic. |
Total expression of PTCH1 protein
PTCH1 protein expression was significantly higher in
the tumor epithelium of HGSCs and LGSCs compared with healthy OSE
(P<0.0001 and P=0.001, respectively) and in the tumor epithelium
of HGSCs and LGSCs compared with FTE (P=0.026 and P=0.038,
respectively) (Fig. 1E). There was
no statistically significant difference in PTCH1 protein expression
in tumor epithelium between HGSCs and LGSCs (P=1.000), nor in
healthy epithelium between ovaries and fallopian tubes (P=1.000)
(Fig. 1E).
In the connective stroma, PTCH1 protein expression
was significantly higher in healthy ovaries compared with healthy
fallopian tubes (P=0.019). However, there was no statistically
significant difference in the expression of this protein in the
connective stroma of HGSCs and LGSCs compared with healthy ovarian
(P=1.000 and P=1.000, respectively) and fallopian tube stroma
(P=0.073 and P=0.060, respectively), as well as between HGSCs and
LGSCs (P=1.000) (Fig. 1F).
In contrast to healthy fallopian tubes (P=0.139),
PTCH1 protein expression was significantly higher in the tumor
epithelium compared with the connective stroma of HGSCs
(P<0.0001) and LGSCs (P=0.013), as well as in stromal compared
with epithelial tissue of normal ovaries (P=0.012).
Cytoplasmic expression of PTCH1
protein
There was no statistically significant difference in
the cytoplasmic expression of PTCH1 protein in the tumor epithelium
of HGSCs and LGSCs compared with healthy OSE and FTE, between the
tumor epithelium of HGSCs and LGSCs, as well as between OSE and FTE
(Fig. 1G).
In the stromal compartment, the cytoplasmic
expression of PTCH1 protein was significantly higher in healthy
ovaries compared with healthy fallopian tubes (P=0.015). At the
same time, there was no statistically significant difference in the
cytoplasmic expression of this protein in the connective stroma of
HGSCs and LGSCs compared with healthy ovarian (P=1.000 and P=1.000,
respectively) and fallopian tube stroma (P=0.123 and P=425,
respectively), as well as between the connective stroma of HGSCs
and LGSCs (P=1.000) (Fig. 1H).
Cytoplasmic expression of PTCH1 protein was not
significantly different between tumor epithelial tissue and
connective stroma in HGSCs (P=0.474) and LGSCs (P=0.110), nor
between epithelial and stromal tissue in healthy ovaries (P=0.218)
and fallopian tubes (P=0.268).
Nuclear expression of PTCH1 protein
Nuclear expression of PTCH1 protein was
significantly higher in the tumor epithelium of HGSCs and LGSCs
compared with healthy OSE (P<0.0001 and P<0.0001,
respectively) and in the tumor epithelium of HGSCs compared with
healthy FTE (P=0.020) (Fig. 1I).
There was no statistically significant difference in the nuclear
expression of PTCH1 protein in the tumor epithelium of LGSCs
compared with healthy FTE (P=0.151), in the tumor epithelium
between HGSCs and LGSCs (P=1.000), as well as between healthy OSE
and FTE (P=0.254) (Fig. 1I).
In the stromal compartment, there was no
statistically significant difference in the nuclear expression of
PTCH1 protein in HGSCs and LGSCs compared with healthy ovaries and
fallopian tubes, between HGSCs and LGSCs, as well as between
healthy ovaries and fallopian tubes (Fig. 1J).
Nuclear expression of PTCH1 protein was
significantly higher in the tumor epithelium than in the connective
stroma of HGSCs (P<0.0001) and LGSCs (P=0.016), as well as in
the epithelium of healthy fallopian tubes compared with their
stroma (P=0.040). By contrast, in healthy ovaries, nuclear
expression was significantly higher in stromal than in epithelial
tissue (P<0.0001).
IHC confirmed nuclear localization of PTCH1 protein
in HGSC and LGSC tissue samples using four different anti-PTCH1
antibodies: Anti-PTCH1a, anti-PTCH1b, anti-PTCH1c, and anti-PTCH1d
(Table I and Fig. S1). In addition to nuclear
staining, cytoplasmic localization of this protein was observed
with all four antibodies. In samples treated with anti-PTCH1d
antibody, PTCH1 protein was strongly expressed in the cytoplasm,
while its nuclear expression was weaker than in samples treated
with anti-PTCH1a, anti-PTCH1b, and anti-PTCH1c antibodies (Fig. S1).
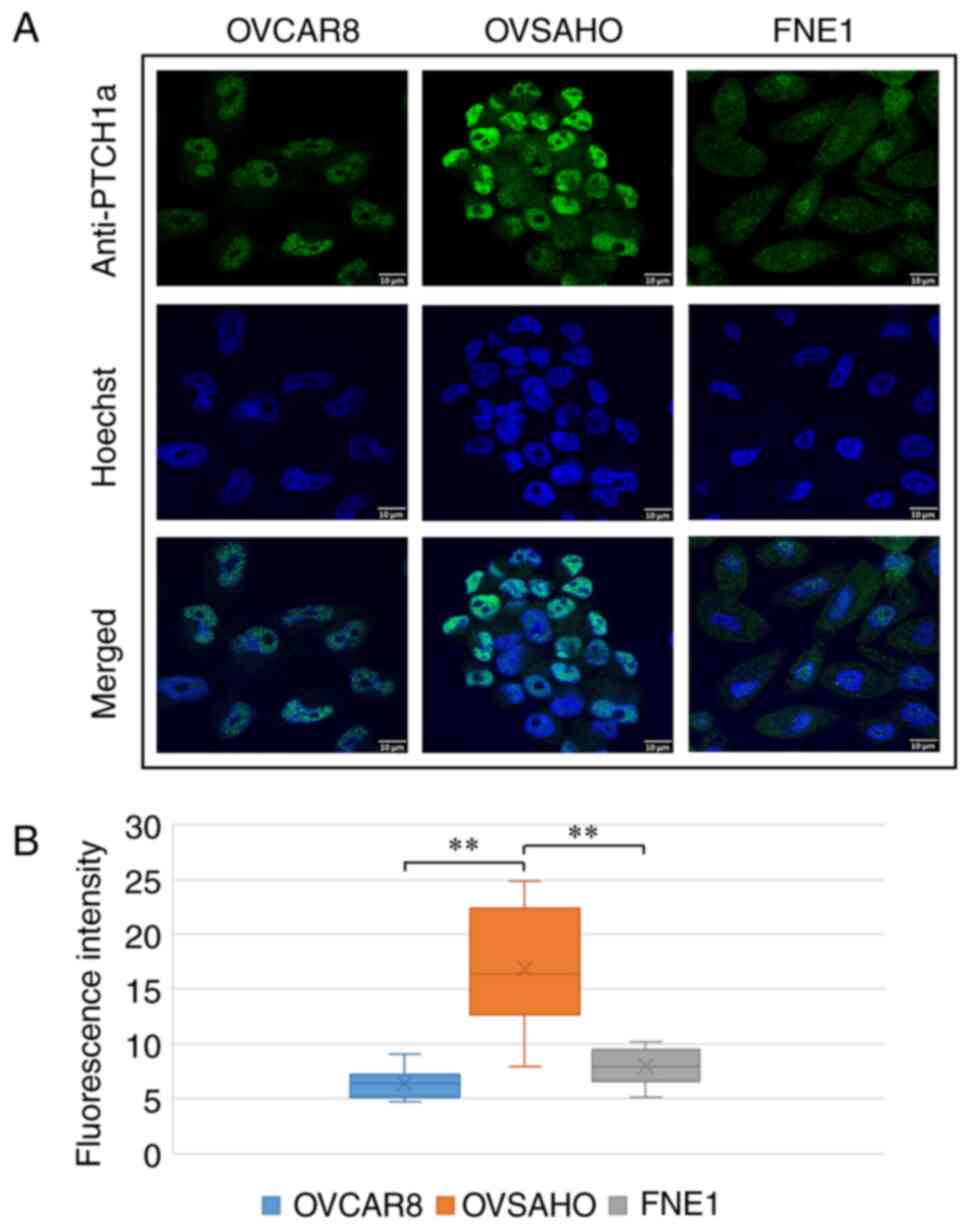
PTCH1 protein expression in HGSC cell
lines
Since nuclear localization of PTCH1 protein has not
been reported in ovarian cancers, PTCH1 expression and subcellular
localization was further investigated using IF analysis in HGSC
cell lines. In OVCAR8, OVSAHO, and FNE1 cell lines, PTCH1 protein
expression was detected using two different antibodies, anti-PTCH1a
and anti-PTCH1d (Table I). PTCH1
protein detected using the anti-PTCH1a antibody was mainly
localized in the nucleus in both cancer cell lines. In this case,
PTCH1 protein expression was significantly higher in the OVSAHO
cell line compared with the OVCAR8 cell line (P<0.0001) and
control cell line FNE1 (P<0.0001) (Fig. 2). In contrast to the anti-PTCH1a
antibody, PTCH1 protein detected by the anti-PTCH1d antibody was
primarily localized in the cytoplasm in cancer cell lines, while
PTCH1 protein expression was significantly higher in both OVCAR8
and OVSAHO cancer cell lines compared with the control cell line
(P=0.006 and P<0.0001, respectively), as well as in OVSAHO
compared with OVCAR8 cancer cell line (P=0.047) (Fig. 3).
PTCH1 protein expression in cell lines was also
detected using the anti-PTCH1b and anti-PTCH1c antibodies (Table I). PTCH1 was predominantly
localized in the nucleus in both cancer cell lines, and its
expression was higher in cancer than in the control cell line
(P<0.0001 for all statistical calculations) (Figs. S2 and S3). When looking at the
cytoplasm, there were punctate signals observed in this cellular
compartment in the case of all four anti-PTCH1 antibodies (Figs. 2, 3, S2 and
S3).
Subcellular localization of PTCH1 protein
in HGSC cell lines
Subcellular localization of PTCH1 protein in OVCAR8,
OVSAHO, and FNE1 cell lines was analyzed by western blotting. The
expression of PTCH1 protein in different cellular compartments
(cytoplasmic, membrane, nuclear soluble, chromatin-bound and
cytoskeletal) was detected using two different antibodies,
anti-PTCH1a and anti-PTCH1d (Table
I). The efficiency of protein isolation from different cellular
compartments was analyzed by checking the presence of GAPDH protein
in the cytoplasmic protein fraction, Na+/K+
ATPase in the membrane fraction, fibrillarin in the nuclear soluble
protein fraction, H3K4me2 protein in the chromatin-bound protein
fraction and β-actin in the cytoskeletal protein fraction (Fig. 4A). In addition to the cytoskeletal
fraction, β-actin may also be found in the cytoplasmic, membrane
and nuclear protein fractions (39,40).
Since extracts from each subcellular compartment generally have
<15% contamination between fractions (that is why it is
considered an enriched fraction of each compartment according to
the manufacturer, which is sufficient purity for most experiments
studying protein localization and redistribution), this protein may
appear in different protein fractions. Analysis of total proteins
confirmed the presence of PTCH1 protein in all cell lines using
both antibodies (Fig. 4B and
C).
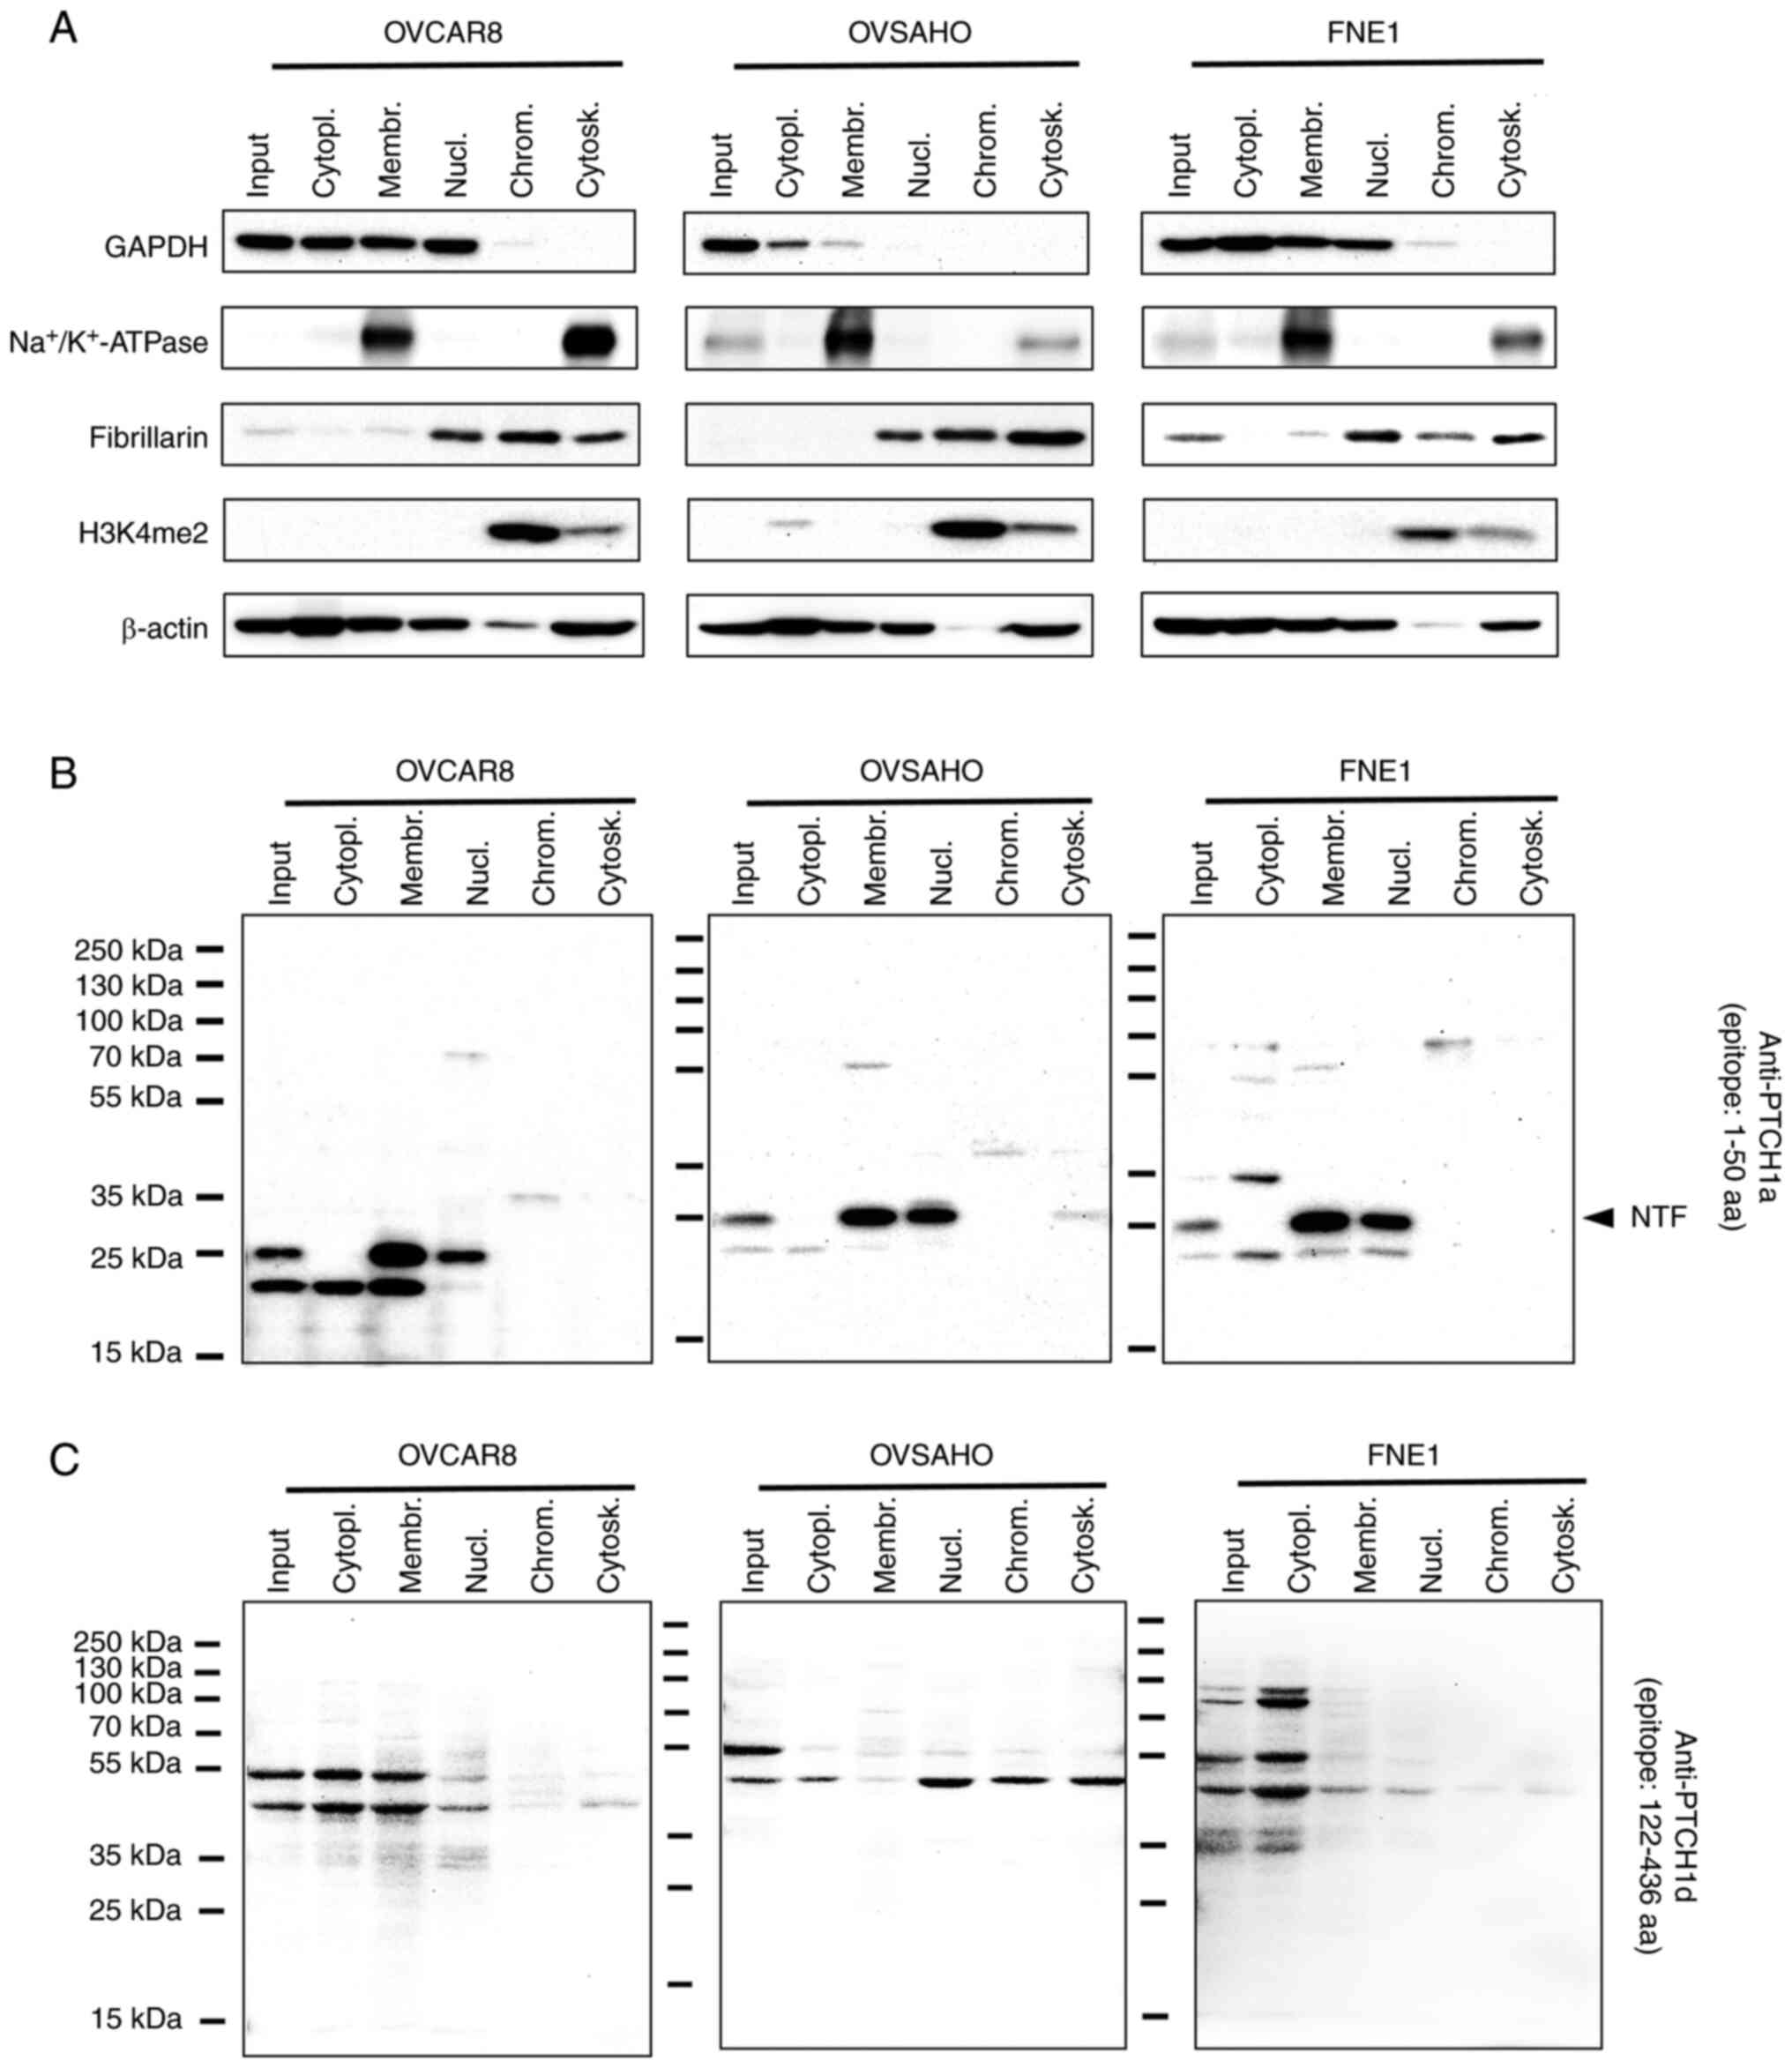 | Figure 4Subcellular localization of PTCH1
protein in high-grade serous ovarian carcinoma cell lines, OVCAR8
and OVSAHO, and normal fallopian tube non-ciliated epithelial cell
line FNE1. (A) Efficiency of protein extraction from different
cellular compartments was verified by examining the expression of
GAPDH protein in the cytoplasmic protein fraction,
Na+/K+ ATPase in the membrane fraction,
fibrillarin in the nuclear soluble protein fraction, H3K4me2
protein in the chromatin-bound protein fraction and β-actin in the
cytoskeletal protein fraction. Western blotting using (B)
anti-PTCH1a and (C) anti-PTCH1d antibodies. PTCH1, protein patched
homolog 1; input, total proteins; cytopl., cytoplasmic proteins;
membr., membrane proteins; nucl., nuclear soluble proteins; chrom.,
chromatin-bound proteins; cytosk., cytoskeletal proteins; NTF;
N-terminal cytoplasmic fragment; aa, amino acids. |
PTCH1 protein detected by the anti-PTCH1a antibody
was primarily present in the membrane and nuclear soluble protein
fractions (Fig. 4B). By contrast,
when anti-PTCH1d antibody was used, this protein was mainly present
in the cytoplasmic fraction (with the exception of the OVSAHO cell
line) (Fig. 4C). PTCH1 protein
expression in different cellular compartments was also detected
using anti-PTCH1b and anti-PTCH1c antibodies. PTCH1 protein was
primarily present in membrane and nuclear soluble fractions
(Fig. S4), as in the case of the
anti-PTCH1a antibody. In all four cases, fragments of PTCH1 protein
of different molecular weights were detected, which indicates the
possibility of proteolytic cleavage of this protein (Figs. 4B and C and S4).
DNA promoter methylation of the PTCH1
gene in serous ovarian carcinomas
DNA promoter methylation of PTCH1 was
exclusively observed in HGSCs (5/37 cases, 13.5%), while no
methylation was detected in any LGSCs and healthy ovarian and
fallopian tube tissues (Fig. 5A).
There was no correlation between DNA promoter methylation of the
PTCH1 gene and total expression of PTCH1 protein in HGSCs
(analyzed in the whole tissue sections) (ρ=0.122; P=0.470). The
PTCH1 gene promoter was unmethylated in OVCAR8, OVSAHO, and
FNE1 cell lines (Fig. 5B).
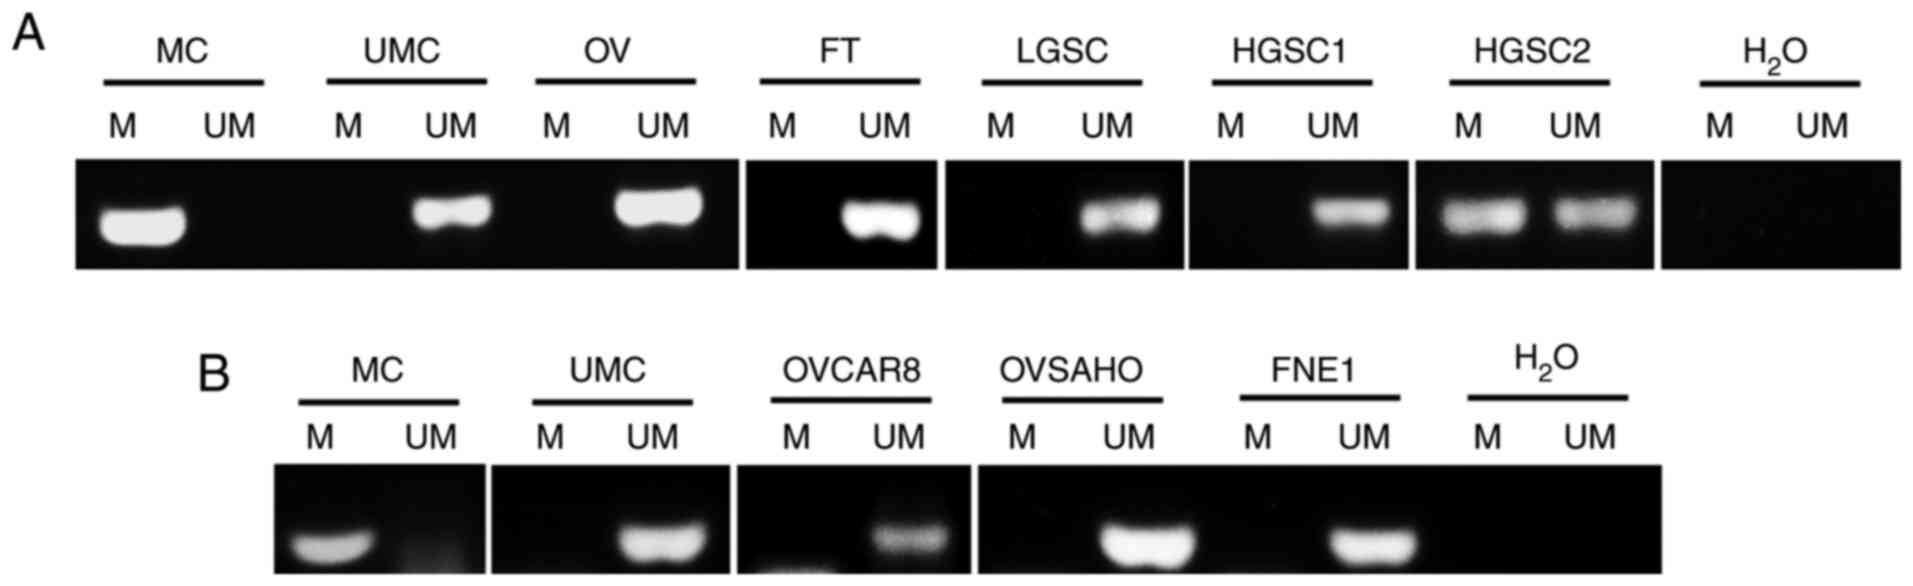 | Figure 5Methylation-specific PCR analysis of
the PTCH1 gene in serous ovarian carcinomas and ovarian
cancer cell lines. (A) Representative images of
methylation-specific PCR analysis for PTCH1 gene promoter in
healthy OV and FT tissues, LGSC and HGSC. (B) DNA promoter
methylation status of the PTCH1 gene in HGSC cell lines,
OVCAR8 and OVSAHO, and normal fallopian tube non-ciliated
epithelial cell line FNE1. M, methylated reaction; UM, unmethylated
reaction; MC, methylated human control; UMC, unmethylated human
control; OV, ovarian; FT, fallopian tube; HGSC, high-grade serous
ovarian carcinoma; LGSC, low-grade serous ovarian carcinoma. |
Discussion
Aberrant expression of PTCH1 protein has been
reported in various cancer types, such as lung, breast, prostate,
ovary, colon and brain cancer, as well as melanoma (28-32).
To the best of our knowledge, this is the first study reporting a
high nuclear expression of PTCH1 protein in a cohort of serous
ovarian carcinomas and cell lines. In the presnet study, the
expression of PTCH1 protein in the tumor epithelium, connective
stroma and whole tissue sections of serous ovarian carcinomas and
the healthy epithelium, stroma and whole tissue sections of ovaries
and fallopian tubes (controls) was analyzed. Although the exact
origin of LGSC and HGSC is still unknown, LGSC most likely arises
from FTE (6). Given that the
origin of HGSC is probably dual (OSE or FTE) (7), both ovarian and fallopian tube
tissues were used as controls in the current study. In addition to
tumor epithelium, PTCH1 protein expression was also analyzed in the
connective stroma of serous ovarian carcinomas to examine its role
in the tumor microenvironment. The connective stroma of the tumor
is not tumor tissue, but it may interact with tumor cells and
promote tumor growth, proliferation, angiogenesis, invasiveness and
metastasis.
The results from the present study showed that total
expression of PTCH1 protein was notably higher in the tumor cells
of HGSCs and LGSCs compared with OSE and FTE, as well as in HGSC
cell lines compared with the control cell line. Increased
expression of this protein in serous ovarian carcinomas suggests
its active involvement in the pathogenesis of these cancers,
consistent with previous studies where increased expression of the
PTCH1 protein was associated with tumor development (28-32).
In this case, PTCH1 protein has a tumor promoter rather than a
tumor suppressor role. It should be noted that a significant
proportion of serous ovarian carcinomas exhibited nuclear PTCH1
protein expression in cancer cells in the present study. This was
further confirmed in HGSC cell lines. Given the lack of information
on nuclear PTCH1 expression in the current literature, the
specificity of PTCH1 nuclear localization was further explored by
IHC on HGSC and LGSC tissue samples and IF on HGSC cell lines,
using four different anti-PTCH1 antibodies. Increased nuclear
expression of PTCH1 protein in serous ovarian carcinoma tissues and
cell lines was confirmed with all four used antibodies, with only
the anti-PTCH1d antibody exhibiting a lower PTCH1 expression. The
observed discrepancies in the antibody sensitivity may be due to
the differences in their clonality (monoclonal vs. polyclonal) and
the epitopes to which they bind (anti-PTCH1d is the only one that
binds to a more distant epitope of the PTCH1 antigen) (41). Polyclonal antibodies recognize the
cytoplasmic NTD, whereas the monoclonal antibody recognizes the
extracellular ECD1 domain of PTCH1 protein.
To examine the subcellular localization of PTCH1 in
more detail, the presence of PTCH1 protein in different cellular
compartments of HGSC cell lines was analyzed by western blotting
using the four aforementioned antibodies. PTCH1 protein was mostly
present in the membrane and nuclear soluble fractions when
polyclonal antibodies were used. By contrast, in the case of the
monoclonal antibody, this protein was mostly present in the
cytoplasmic fraction, which is in line with the IF results.
Although the western blot results indicated the presence of PTCH1
protein in the membrane fraction (in the case of all four
anti-PTCH1 antibodies used in this study), IF analysis suggested
that this protein was not present at the plasma membrane. In
addition to the membrane, PTCH1 protein may also be present in the
endosomes (membrane vesicles) located in the cytoplasm (42). We hypothesize that punctate signals
observed in the cytoplasm may represent endosomes with PTCH1
protein that are extracted within the membrane fraction. IF
analysis shows the main distribution of the protein, which can be
limited by the resolution, antibody efficiency or epitope masking.
In the case of western blotting, the membrane fraction was
enriched. This fraction can contain any intracellular membranes,
such as the endoplasmic reticulum, mitochondria, endosomes and
Golgi apparatus, where the protein can be transiently localized.
This provides an additional evidence that PTCH1 potentially can be
associated with membranes and can be found in different
compartments. Notably, fragments of PTCH1 protein of different
molecular weights were detected by western blotting with all four
antibodies, which indicates the possibility of proteolytic cleavage
of this protein and posttranslational modifications of the
resulting fragments. Although anti-PTCH1a/c and anti-PTCH1b
antibodies recognize the same epitope of the PTCH1 antigen, it is
not clear why they showed a different pattern of PTCH1 fragments in
the same samples. There is a possibility that different binding
affinity to the same epitope result in the observed differences. In
addition, divergence between different batches of antibodies can be
observed, even though the antibodies have the same catalogue
number. N-terminal cytoplasmic fragments (NTFs; not recognized by
the anti-PTCH1d monoclonal antibody), may possibly translocate to
the nucleus after proteolytic cleavage, thereby performing a
hitherto unknown function. At the same time, most of the protein
remains in the cytoplasm. Since nuclear expression of PTCH1 was
observed in HGSCs, LGSCs and HGSC cell lines, we hypothesize that
NTFs most likely modulate the transcriptional activity of cancer
driver genes (namely genes that regulate cell proliferation,
survival or angiogenesis), which may represent a potential
oncogenic mechanism of this protein in serous ovarian carcinoma
cells. Since nuclear localization of PTCH1 protein was also
observed in healthy ovarian/fallopian tube tissues and the FNE1
cell line, there is a possibility that N-cleavage of the PTCH1
protein and its translocation into the nucleus is a process that
can take place in healthy ovarian cells as well; however, this
process may be more common in cancer cells, since nuclear
expression of PTCH1 protein was higher in cancer compared with the
healthy cells.
Translocation of cytoplasmic domain fragments of
transmembrane proteins to the nucleus has already been recognized
as a mechanism of direct signaling between these two cellular
compartments (43,44) and described in the case of PTCH1
protein (45). Kagawa et al
(45) showed that PTCH1 protein
was subjected to proteolytic cleavage at the C-terminus, resulting
in the generation of a soluble C-terminal fragment, ICD7. They
observed that ICD7 fragments accumulate in the cell nucleus of HeLa
cells stably expressing full-length PTCH1, where they modulate the
transcriptional activity of the GLI1 protein. At the same time, the
N-terminal region remained in the cytoplasmic punctuates, which may
correspond to multivesicular bodies and endosomes, and did not
translocate to the nucleus. In addition, nuclear accumulation of
endogenous PTCH1 ICD7 fragments was also observed in mouse
embryonic fibroblasts (C3H10T1/2 cells) and mouse embryonic primary
cells (45). Although Kagawa et
al (45) also found that these
fragments have certain regulatory roles, their biological
importance remains unknown. However, the results of the present
study indicated the possibility of proteolytic cleavage of the
PTCH1 N-terminal cytoplasmic region, resulting in the generation of
soluble NTFs that are translocated to the nucleus. To the best of
our knowledge, this is the first study to indicate the presence of
NTFs of the PTCH1 protein in the nucleus. Since nuclear
localization of these fragments was detected in serous ovarian
carcinoma cells, we hypothesize that they could play an active
tumor promoter role in the nucleus of these malignant cells. This
process is still unknown, therefore further studies are required to
clarify the role of NTFs in the nucleus of both healthy and cancer
cells.
Since PTCH1 protein and gene expression may be
affected by epigenetic changes, such as DNA methylation (25-27),
the methylation status of the PTCH1 gene was also analyzed.
DNA promoter methylation of PTCH1 was exclusively found in
HGSCs (13.5%). However, PTCH1 gene promoter methylation did
not affect the PTCH1 protein expression in HGSCs. Notably, DNA
promoter methylation of the PTCH1 gene has been previously
observed in benign ovarian tumors, such as ovarian dermoids and
fibromas (46), but not in ovarian
carcinomas (47).
The present data indicated that PTCH1 protein may be
actively involved in the pathogenesis of serous ovarian carcinomas.
The current study reported the nuclear localization of PTCH1
protein in serous ovarian cells for the first time, to the best of
our knowledge. Since the results depended on the specificity of the
antibodies used, this may represent a potential limitation of the
present study. To overcome this limitation, expression of an
N-terminally-tagged (such as FLAG or T7) version of PTCH1 protein
in the cell lines would allow independent verification of NTFs in
the nucleus. Nevertheless, the punctate signals in the cytoplasm
require further investigation. The membrane-associated fractions of
PTCH1 could correspond to an internalized pool of PTCH1 protein,
which follows the endosomal pathway either to be recycled back to
the plasma membrane or to be degraded by the lysosomal pathway.
Further co-localization assays using compartment-specific markers
or electron microscopy analysis should be carried out to determine
the exact localization of PTCH1 protein. PTCH1 gene promoter
methylation was exclusively observed in HGSC. Further studyes are
necessary to depict other genomic (such as mutations) and
epigenetic (such as histone modifications) alterations of
PTCH1 that may contribute to its activation.
Supplementary Data
Availability of data and materials
The datasets used and/or analyzed during the current
study are available from the corresponding author on reasonable
request.
Authors' contributions
VKK contributed to conceptualization,
interpretation, data acquisition and analysis, performed
experimental work, wrote and edited the manuscript, and revised the
manuscript for important intellectual content. ACP contributed to
conceptualization, interpretation and design of the experiments,
and revised the manuscript for important intellectual content. AS
contributed to data analysis and interpretation, and revised the
manuscript for important intellectual content. SV contributed to
data analysis and interpretation, and revised the manuscript for
important intellectual content. LS conceived the idea of the
present study, contributed to conceptualization, data collection
and analysis and interpretation of the results, and revised the
manuscript for important intellectual content. VKK and LS confirm
the authenticity of all the raw data. All authors read and approved
the final manuscript.
Ethics approval and consent to
participate
The study was conducted according to the guidelines
of the Declaration of Helsinki and approved by the Ethical
Committee of School of Medicine, University of Zagreb (approval no.
380-59-10106-20-111/130; 7th October 2020; Zagreb, Croatia) and the
Ethical Committee of University Hospital Merkur Zagreb (approval
no. 03/1-11080; 7th December 2017; Zagreb, Croatia; approval no.
30/1-11088; 7th December 2017; Zagreb, Croatia). Written informed
consent was obtained from all participants involved in the
study.
Patient consent for publication
Not applicable.
Competing interests
The authors declare that they have no competing
interests.
Acknowledgments
The authors would like to thank Professor Ivan Đikić
(Institute of Biochemistry II, School of Medicine, Goethe
University, 60590 Frankfurt am Main, Germany) for permitting
conduction of part of the present study in his laboratory, which
has significantly contributed to the realization of this
research.
Funding
This research was co-financed by the European Union through the
Europe Regional Development Fund, Operational Programme
Competitiveness and Cohesion (grant no. KK.01.1.1.01.0008;
Reproductive and Regenerative Medicine-Exploring New Platforms and
Potentials).
References
|
1
|
Bray F, Ferlay J, Soerjomataram I, Siegel
RL, Torre LA and Jemal A: Global cancer statistics 2018: GLOBOCAN
estimates of incidence and mortality worldwide for 36 cancers in
185 countries. CA Cancer J Clin. 68:394–424. 2018. View Article : Google Scholar : PubMed/NCBI
|
|
2
|
Jacobs IJ and Menon U: Progress and
challenges in screening for early detection of ovarian cancer. Mol
Cell Proteomics. 3:355–366. 2004. View Article : Google Scholar : PubMed/NCBI
|
|
3
|
Ebell MH, Culp MB and Radke TJ: A
systematic review of symptoms for the diagnosis of ovarian cancer.
Am J Prev Med. 50:384–394. 2016. View Article : Google Scholar
|
|
4
|
Matulonis UA, Sood AK, Fallowfield L,
Howitt BE, Sehouli J and Karlan BY: Ovarian cancer. Nat Rev Dis
Primers. 2:160612016. View Article : Google Scholar : PubMed/NCBI
|
|
5
|
Prat J, D'Angelo E and Espinosa I: Ovarian
carcinomas: At least five different diseases with distinct
histological features and molecular genetics. Hum Pathol. 80:11–27.
2018. View Article : Google Scholar : PubMed/NCBI
|
|
6
|
Wang Y, Hong S, Mu J, Wang Y, Lea J, Kong
B and Zheng W: Tubal origin of 'ovarian' low-grade serous
carcinoma: A gene expression profile study. J Oncol.
2019:86597542019. View Article : Google Scholar
|
|
7
|
Hao D, Li J, Jia S, Meng Y, Zhang C, Wang
L and Di LJ: Integrated analysis reveals tubaland
ovarian-originated serous ovarian cancer and predicts differential
therapeutic responses. Clin Cancer Res. 23:7400–7411. 2017.
View Article : Google Scholar : PubMed/NCBI
|
|
8
|
Kotsopoulos IC, Papanikolaou A,
Lambropoulos AF, Papazisis KT, Tsolakidis D, Touplikioti P and
Tarlatzis BC: Serous ovarian cancer signaling pathways. Int J
Gynecol Cancer. 24:410–417. 2014. View Article : Google Scholar : PubMed/NCBI
|
|
9
|
Chen Q, Gao G and Luo S: Hedgehog
signaling pathway and ovarian cancer. Chin J Cancer Res.
25:346–353. 2013.PubMed/NCBI
|
|
10
|
Szkandera J, Kiesslich T, Haybaeck J,
Gerger A and Pichler M: Hedgehog signaling pathway in ovarian
cancer. Int J Mol Sci. 14:1179–1196. 2013. View Article : Google Scholar : PubMed/NCBI
|
|
11
|
Jeng KS, Chang CF and Lin SS: Sonic
hedgehog signaling in organogenesis, tumors, and tumor
microenvironments. Int J Mol Sci. 21:7582020. View Article : Google Scholar :
|
|
12
|
Skoda AM, Simovic D, Karin V, Kardum V,
Vranic S and Serman L: The role of the hedgehog signaling pathway
in cancer: A comprehensive review. Bosn J Basic Med Sci. 18:8–20.
2018. View Article : Google Scholar :
|
|
13
|
Ryan KE and Chiang C: Hedgehog secretion
and signal transduction in vertebrates. J Biol Chem.
287:17905–17913. 2012. View Article : Google Scholar : PubMed/NCBI
|
|
14
|
Hanna A and Shevde LA: Hedgehog signaling:
Modulation of cancer properies and tumor mircroenvironment. Mol
Cancer. 15:242016. View Article : Google Scholar : PubMed/NCBI
|
|
15
|
Guo YY, Zhang JY, Li XF, Luo HY, Chen F
and Li TJ: PTCH1 gene mutations in keratocystic odontogenic tumors:
A study of 43 Chinese patients and a systematic review. PLoS One.
8:e773052013. View Article : Google Scholar : PubMed/NCBI
|
|
16
|
Rudolf AF, Kinnebrew M, Kowatsch C, Ansell
TB, El Omari K, Bishop B, Pardon E, Schwab RA, Malinauskas T, Qian
M, et al: The morphogen Sonic hedgehog inhibits its receptor
patched by a pincer grasp mechanism. Nat Chem Biol. 15:975–982.
2019. View Article : Google Scholar : PubMed/NCBI
|
|
17
|
Fleet AJ and Hamel PA: The
protein-specific activities of the transmembrane modules of Ptch1
and Ptch2 are determined by their adjacent protein domains. J Biol
Chem. 293:16583–16595. 2018. View Article : Google Scholar : PubMed/NCBI
|
|
18
|
Riobo-Del Galdo NA, Lara Montero Á and
Wertheimer EV: Role of hedgehog signaling in breast cancer:
Pathogenesis and therapeutics. Cells. 8:3752019. View Article : Google Scholar :
|
|
19
|
Shimokawa T, Svärd J, Heby-Henricson K,
Teglund S, Toftgård R and Zaphiropoulos PG: Distinct roles of first
exon variants of the tumor-suppressor patched1 in hedgehog
signaling. Oncogene. 26:4889–4896. 2007. View Article : Google Scholar : PubMed/NCBI
|
|
20
|
Wils LJ and Bijlsma MF: Epigenetic
regulation of the hedgehog and Wnt pathways in cancer. Crit Rev
Oncol Hematol. 121:23–44. 2018. View Article : Google Scholar
|
|
21
|
Chung JH and Bunz F: A loss-of-function
mutation in PTCH1 suggests a role for autocrine hedgehog signaling
in colorectal tumorigenesis. Oncotarget. 4:2208–2211. 2013.
View Article : Google Scholar : PubMed/NCBI
|
|
22
|
Wang CY, Chang YC, Kuo YL, Lee KT, Chen
PS, Cheung CHA, Chang CP, Phan NN, Shen MR and Hsu HP: Mutation of
the PTCH1 gene predicts recurrence of breast cancer. Sci Rep.
9:163592019. View Article : Google Scholar : PubMed/NCBI
|
|
23
|
Musani V, Sabol M, Car D, Ozretic P,
Oreskovic S, Leovic D and Levanat S: LOH of PTCH1 region in BCC and
ovarian carcinoma: Microsatellite vs HRM analysis. Front Biosci
(Elite Ed). 4:1049–1057. 2012.
|
|
24
|
McGarvey TW, Maruta Y, Tomaszewski JE,
Linnenbach AJ and Malkowicz SB: PTCH gene mutations in invasive
transitional cell carcinoma of the bladder. Oncogene. 17:1167–1172.
1998. View Article : Google Scholar : PubMed/NCBI
|
|
25
|
Heitzer E, Bambach I, Dandachi N, Horn M
and Wolf P: PTCH promoter methylation at low level in sporadic
basal cell carcinoma analysed by three different approaches. Exp
Dermatol. 19:926–928. 2010. View Article : Google Scholar : PubMed/NCBI
|
|
26
|
Sinha S, Singh RK, Alam N, Roy A,
Roychoudhury S and Panda CK: Alterations in candidate genes PHF2,
FANCC, PTCH1 and XPA at chromosomal 9q22.3 region: Pathological
significance in early- and late-onset breast carcinoma. Mol Cancer.
7:842008. View Article : Google Scholar : PubMed/NCBI
|
|
27
|
Zuo Y, Song Y, Zhang M, Xu Z and Qian X:
Role of PTCH1 gene methylation in gastric carcinogenesis. Oncol
Lett. 8:679–682. 2014. View Article : Google Scholar : PubMed/NCBI
|
|
28
|
Im S, Choi HJ, Yoo C, Jung JH, Jeon YW,
Suh YJ and Kang CS: Hedgehog related protein expression in breast
cancer: gli-2 is associated with poor overall survival. Korean J
Pathol. 47:116–123. 2013. View Article : Google Scholar : PubMed/NCBI
|
|
29
|
Gonnissen A, Isebaert S, Perneel C, McKee
CM, Van Utterbeeck F, Lerut E, Verrill C, Bryant RJ, Joniau S,
Muschel RJ and Haustermans K: Patched 1 expression correlates with
biochemical relapse in high-risk prostate cancer patients. Am J
Pathol. 188:795–804. 2018. View Article : Google Scholar : PubMed/NCBI
|
|
30
|
Hasanovic A and Mus-Veteau I: Targeting
the multidrug transporter Ptch1 potentiates chemotherapy
efficiency. Cells. 7:1072018. View Article : Google Scholar :
|
|
31
|
Chen X, Horiuchi A, Kikuchi N, Osada R,
Yoshida J, Shiozawa T and Konishi I: Hedgehog signal pathway is
activated in ovarian carcinomas, correlating with cell
proliferation: It's inhibition leads to growth suppression and
apoptosis. Cancer Sci. 98:68–76. 2007. View Article : Google Scholar
|
|
32
|
Liao X, Siu MK, Au CW, Wong ES, Chan HY,
Ip PP, Ngan HY and Cheung AN: Aberrant activation of hedgehog
signaling pathway in ovarian cancers: Effect on prognosis, cell
invasion and differentiation. Carcinogenesis. 30:131–140. 2009.
View Article : Google Scholar
|
|
33
|
Bhattacharya R, Kwon J, Ali B, Wang E,
Patra S, Shridhar V and Mukherjee P: Role of hedgehog signaling in
ovarian cancer. Clin Cancer Res. 14:7659–7666. 2008. View Article : Google Scholar : PubMed/NCBI
|
|
34
|
Zheng F, Xiao X and Wang C: The effect of
PTCH1 on ovarian cancer cell proliferation and apoptosis. Cancer
Biother Radiopharm. 34:103–109. 2019. View Article : Google Scholar
|
|
35
|
Kardum V, Karin V, Glibo M, Skrtic A,
Martic TN, Ibisevic N, Skenderi F, Vranic S and Serman L:
Methylation-associated silencing of SFRP1 gene in high-grade serous
ovarian carcinomas. Ann Diagn Pathol. 31:45–49. 2017. View Article : Google Scholar : PubMed/NCBI
|
|
36
|
Karin-Kujundzic V, Kardum V, Sola IM, Paic
F, Skrtic A, Skenderi F, Serman A, Nikuseva-Martic T, Vranic S and
Serman L: Dishevelled family proteins in serous ovarian carcinomas:
A clinicopathologic and molecular study. APMIS. 128:201–210. 2020.
View Article : Google Scholar
|
|
37
|
Vrsalovic MM, Korac P, Dominis M, Ostojic
S, Mannhalter C and Kusec R: T- and B-cell clonality and frequency
of human herpes viruses-6, -8 and Epstein Barr virus in
angioimmunoblastic T-cell lymphoma. Hematol Oncol. 22:169–177.
2004. View Article : Google Scholar
|
|
38
|
Peng L, Hu J, Li S, Wang Z, Xia B, Jiang
B, Li B, Zhang Y, Wang J and Wang X: Aberrant methylation of the
PTCH1 gene promoter region in aberrant crypt foci. Int J Cancer.
132:E18–E25. 2013. View Article : Google Scholar
|
|
39
|
McDonald D, Carrero G, Andrin C, de Vries
G and Hendzel MJ: Nucleoplasmic beta-actin exists in a dynamic
equilibrium between low-mobility polymeric species and rapidly
diffusing populations. J Cell Biol. 172:541–552. 2006. View Article : Google Scholar : PubMed/NCBI
|
|
40
|
Hoock TC, Newcomb PM and Herman IM: Beta
actin and its mRNA are localized at the plasma membrane and the
regions of moving cytoplasm during the cellular response to injury.
J Cell Biol. 112:653–664. 1991. View Article : Google Scholar : PubMed/NCBI
|
|
41
|
Acharya P, Quinlan A and Neumeister V: The
ABCs of finding a good antibody: How to find a good antibody,
validate it, and publish meaningful data. F1000Res. 6:8512017.
View Article : Google Scholar : PubMed/NCBI
|
|
42
|
Pak E and Segal RA: Hedgehog signal
transduction: Key players, oncogenic drivers, and cancer therapy.
Dev Cell. 38:333–344. 2016. View Article : Google Scholar : PubMed/NCBI
|
|
43
|
Carpenter G: Nuclear localization and
possible functions of receptor tyrosine kinases. Curr Opin Cell
Biol. 15:143–148. 2003. View Article : Google Scholar : PubMed/NCBI
|
|
44
|
Anido J, Scaltriti M, Bech Serra JJ,
Santiago Josefat B, Todo FR, Baselga J and Arribas J: Biosynthesis
of tumorigenic HER2 C-terminal fragments by alternative initiation
of translation. EMBO J. 25:3234–3244. 2006. View Article : Google Scholar : PubMed/NCBI
|
|
45
|
Kagawa H, Shino Y, Kobayashi D, Demizu S,
Shimada M, Ariga H and Kawahara H: A novel signaling pathway
mediated by the nuclear targeting of C-terminal fragments of
mammalian patched 1. PLoS One. 6:e186382011. View Article : Google Scholar : PubMed/NCBI
|
|
46
|
Cretnik M, Musani V, Oreskovic S, Leovic D
and Levanat S: The patched gene is epigenetically regulated in
ovarian dermoids and fibromas, but not in basocellular carcinomas.
Int J Mol Med. 19:875–883. 2007.PubMed/NCBI
|
|
47
|
Löf-Öhlin ZM, Levanat S, Sabol M, Sorbe B
and Nilsson TK: Promoter methylation in the PTCH gene in cervical
epithelial cancer and ovarian cancer tissue as studied by eight
novel Pyrosequencing® assays. Int J Oncol. 38:685–692.
2011.
|