Introduction
As tumor cells opt for the 'Warburg effect'
phenotype to fuel cellular expansion via aerobic glycolysis
(1), lactic acid and
CO2 are subsequently produced with a concomitant
accumulation of H+, culminating in a measurable drop in
the tumor extracellular pH (2).
This increase in acidity of the tumor microenvironment, also termed
acidosis, has been described in several cancer types, including
lung cancer (3), breast cancer
(4,5), head and neck cancer (6), cervical cancer (7) and sarcoma (8), and has been demonstrated to be
associated with advanced tumor aggressiveness (9,10).
Notably, in a study comparing clinical samples from various cancer
types, metastatic lung tumors were demonstrated to display the
highest degree of acidosis, with a 7.2-fold increase in lactate
concentration compared with non-metastatic lung tumor specimen
(11), while metastatic head and
neck tumors exhibit the second largest increase in lactate
concentration (a 2.6-fold increase) (6). Several studies have also associated
differing degrees of acidosis with cellular changes in metabolism,
stemness properties and immune evasion ability (12-17), suggesting that acidosis may
actively participate in cancer progression. Furthermore, blocking
proton transport has been linked to improved clinical outcomes in
breast cancer, suggesting that acidosis may also serve as a
putative druggable target in therapeutic interventions (18-20). However, despite the supporting
evidence that has been collected in this regard, whether acidosis
serves an active role in cancer, or is merely a consequence of
altered tumor metabolism, remains to be confirmed
experimentally.
For metastasis to successfully occur, tumor cells
need to overcome multiple challenges prior to the final
establishment as a new tumor colony. Once primary tumor cells have
overcome the physical constraints set by the surrounding tissues to
gain access into the vascular systems, these cells are confronted
with harsh threats, including immune surveillance and the
tangential shear force exerted by the blood flow on the surface of
the circulating tumor cells (CTCs) (21-23). After extravasation, rapid
acquisition of nutrients is required to support the growth of the
new colony. The variety of these challenges highlights that tumor
cells need to acquire multiple characteristics to survive as a
metastatic colony in the new environment. Several animal models
have been successfully employed to address different aspects of
metastasis, including spontaneous metastasis, heterotopic
transplantation and genetic engineering metastasis models (24). Although these models have provided
important insights over time, one potential disadvantage is that
they may highlight certain specific components of the metastatic
process, while underrepresenting changes involved in other steps of
metastasis. For instance, the knowledge of critical events involved
in the mechanism through which founder CTCs establish a new colony,
with its subsequent development, remains poor due to the lack of a
suitable study model.
In a set of experiments using the dorsal window
chamber model, Estrella et al (25) observed that acidic pH in the tumor
environment promotes local invasion of breast cancer. Nevertheless,
to the best of our knowledge, the mechanism(s) via which acidosis
participates in metastatic colonization after extravasation and
contributes to secondary tumor establishment remain largely
unknown. Therefore, the present study used a novel metastatic
colonization model, clinical samples and complementary in
vitro assays to elucidate the role of long-term acidosis in
lung cancer metastasis.
Materials and methods
Cell lines and long-term acidosis
Human CLS1 cells were isolated from an 87-year-old
male patient with lung adenosquamous carcinoma who provided written
informed consent, according to the protocol NTUH-IRB201103028RC
approved by National Taiwan University Hospital Research Ethics
Committee (Taipei, Taiwan) (26).
These cells were cultured in RPMI-1640 medium supplemented with 10%
FBS and 1 mM sodium pyruvate (all from Thermo Fisher Scientific,
Inc.) at 37°C with 5% CO2 in a humidified incubator. For
the establishment of pH 6.6 and pH 7.4 subclones by long-term
acidosis treatment, cells were cultured in media adjusted to pH 6.6
as described previously (27) for
2 months, while the control pH 7.4 subclone cells were cultured in
pH 7.4 media. Mother stocks of the acidotic and control cells were
prepared upon reaching the 48th passage. All experiments were
performed using cells at passage 50. In experiments assessing
short-term acid treatment, the cells were cultured in the
corresponding pH media for 24 h.
Time-lapse microscopy
pH 7.4 or pH 6.6 cells were seeded in 6-well plates
at a density of 2,000 cells/well, and live images were captured
every 40 min over a period of 96 h using an inverted phase-contrast
light microscopy equipped with the ASTEC-real time cell monitoring
system (Astec Co., Ltd.). Cell doubling times were analyzed by
visual inspection of the serial images and calculated as the time
between two completed cytokinesis events.
Trypan blue exclusion assay
pH 7.4 or pH 6.6 cells (20,000 cells/well) were
seeded in 6-well plates as triplicates, and cultured for 0, 24, 48,
72 or 96 h at 37°C before harvesting. Cells were stained with
trypan blue (Thermo Fisher Scientific, Inc.) for 30 sec at room
temperature to exclude non-viable cells, and counted using a
Bright-Line™ hemocytometer (Reichert, Inc.) under a DMi1 inverted
light microscope (Leica Camera AG).
MTT assay
To analyze the cellular mitochondrial metabolic
rate, pH 7.4 or pH 6.6 cells (1,000 cells/well) were seeded in
96-well plates and cultured for 24, 48, 72 or 96 h at 37°C, before
incubation with 20 µl 5 mg/ml MTT (Merck KGaA) diluted in
180 µl complete medium (RPMI-1640 medium with 10% FBS and 1
mM sodium pyruvate) for 2 h. MTT was subsequently removed, and 100
µl/well DMSO (Bionovas Biotechnology Co., Ltd.) was added
and cells were incubated for 15 min. Optical absorbance was
measured at 570 nm using an Elx800 reader (BioTek Instruments,
Inc.).
Metastatic colonization model
All animal protocols were reviewed and approved by
the National Taiwan University College of Medicine Institutional
Animal Care and Use Committee (approval no. 20170550; Taipei,
Taiwan). A total of 60 female nude mice
(BALB/cAnN.Cg-Foxn1nu/CrlNarl mice; age, 4 weeks;
mean weight, 14.71±1.21 g) were purchased from National Applied
Research Laboratories, National Laboratory Animal Center (Taipei,
Taiwan), and kept at 22±2°C and 55±10% humidity with a 12/12-h
light/dark cycle, with free access to food and water. In experiment
#1, 8 mice were implanted subcutaneously with 10-cell inoculates of
pH 6.6 or pH 7.4 cells to simulate metastatic colonization at
opposite flanks, while the same procedure was performed with 1-cell
inoculates in another 8 mice. In experiment #2, 18 nude mice were
implanted subcutaneously with 10 pH 6.6 or pH 7.4 cells at opposite
lower flanks, while 1 pH 6.6 or pH 7.4 cell was implanted at
opposite upper flanks of the same recipient mouse. In experiment
#3, the same procedure as in experiment #2 was performed using 26
nude mice. Briefly, pH 6.6 or pH 7.4 cells at passage 50 were
resuspended in complete culture medium, before accurately selecting
either 10 or 1 cells under a Zeiss Axio Observer D1 inverted
fluorescence microscope (Zeiss AG) and packing these together by
natural gravity in 5 µl Growth Factor Reduced, Phenol
Red-Free Matrigel™ (Corning, Inc.; final concentration, 50%) for
subcutaneous injection into the 5-week-old nude mice using 4%
isoflurane for induction and 2% isoflurane for maintenance of
anesthesia. Body weight was recorded every other day starting from
the time when a palpable tumor could be detected (18 to 20 days
post-implantation; Fig. S1).
Tumor volume was measured every other day using a caliper and
calculated as 1/2 (length x width2), where length refers
to the longest dimension and width refers to the smallest dimension
perpendicular to the length. Intolerable distress caused to the
animals, such as continued declining weight loss ≥20% for up to 2
days, or a xenograft tumor volume reaching 2,000 mm3,
were set as the humane endpoints of the present study. Mice were
euthanized at week 6 post-implantation in a CO2 chamber
for 5 min (CO2 flow set to 30% chamber volume
displacement per min). The mice were observed for an additional 5
min to determine death as judged by stopped breathing, heart arrest
and loss of blink reflex. Dissection was performed to thoroughly
inspect any subcutaneous tumors that may have developed. The tumors
were extracted, and their volumes were recorded. No further
metastasis was observed. The tumor burden observed was: maximum
tumor diameter, 9.44 mm; maximum sum of diameter, 16.84 mm; and
maximum tumor volume, 308.225 mm3. The samples were
fixed in 4% paraformaldehyde at room temperature for 24 h, followed
by histological analyses. Notably, mouse no. 18 of experiment 2 was
euthanized at day 35 post-tumor inoculation after observation of
clinical signs including dullness, lethargy and failure to respond
to stimuli as suggested by the ethical guidelines of the National
Taiwan University College of Medicine Institutional Animal Care and
Use Committee (Taipei, Taiwan).
Transcriptome sequencing and
analyses
For long-term acidosis treatment, two independent
transcriptome analysis experiments with two biological replicates
each were performed for both pH 6.6 and pH 7.4 cells. CLS1 cells
treated with either 0-h (short term, pH 7.4) or 24-h acidosis
(short term, pH 6.6) served as short-term treatment references.
Total RNA was extracted using TRIzol® reagent (cat. no.
26073; Thermo Fisher Scientific, Inc.) and an RNeasy Mini Kit (cat.
no. 74106; Qiagen, Inc.). Only samples with an integrity number
>9.0 were used to construct the sequencing libraries using the
TruSeq Stranded mRNA Library Prep Kit (cat. no. 20020595; Illumina,
Inc.). Briefly, mRNA purification was performed using
oligo(dT)-coupled magnetic beads. Double-stranded cDNAs were
synthesized using the SuperScript™ II Reverse Transcriptase kit
(cat. no. 18064-014; Thermo Fisher Scientific, Inc.) and random
primers. The reverse transcription temperature protocol was 10 min
at 25°C, 15 min at 42°C and 15 min at 70°C, then holding at 4°C.
The quality of the libraries was assessed on the Agilent
Bioanalyzer 2100 system and a Real-Time PCR system (Agilent
Technologies, Inc.). The loading concentration of the final
libraries was 290 pM as measured by the Qubit 2.0 Fluorometer
Q32866 (Thermo Fisher Scientific, Inc.). Sequencing was performed
using an Illumina™ NovaSeq 6000 System (Illumina, Inc.) with the
NovaSeq 6000 S1 Reagent Kit (300 cycles; cat. no. 20012863;
Illumina, Inc.) at a depth of ~40 million reads per sample of
150-bp paired-end reads. Bases with low quality and sequences from
adapters in raw data were removed using the program FASTQ (version
0.20.0) (28). The filtered reads
were mapped with Bowtie 2 (https://bowtie-bio.sourceforge.net/bowtie2/index.shtml)
and aligned to the human reference genome hg19 as it provided the
most comprehensive annotation available at the time of analysis.
The software FeatureCounts v2.0.1 (29) in the Subread package v2.0.1
(https://subread.sourceforge.net/) was
applied for quantification of the gene abundance. Differentially
expressed genes were identified by DESeq2 version 1.28.0 (30) for the samples with biological
replicates or by EdgeR version 3.36.0 (31) for the samples without biological
replicates (0 and 24 h acidosis samples). Significant differential
expression of genes was defined as a posterior probability of being
equally expressed (PPEE) <0.05 and log2 |posterior
fold change|>1. Data were deposited in the National Center for
Biotechnology Information Gene Expression Omnibus database
(accession no. GSE200546; https://www.ncbi.nlm.nih.gov/geo/query/acc.cgi?acc=GSE200546).
Gene Ontology (GO), Kyoto Encyclopedia of
Genes and Genomes (KEGG) and protein-protein interaction (PPI)
analyses
Cellular component (CC), molecular function (MF) and
biological process (BP) functions were analyzed using the GO
database (http://geneontology.org/) using
Protein Analysis Through Evolutionary Relationships 15.0
(https://pantherdb.org/) with a significance
threshold of P<0.05 and false discovery rate <0.05. KEGG
signaling pathway analyses were subsequently performed using KEGG
Orthology-Based Annotation System 3.0 (32) for the Homo sapiens
reference list, with a significance threshold of P<0.05 and
corrected P<0.05. PPI analyses were performed using the Search
Tool for the Retrieval of Interacting Genes/Proteins (STRING)
database version 10.5 (https://string-db.org; >0.5 confidence score;
species was limited to Homo sapiens).
Histological and immunohistochemistry
staining
For H&E staining, xenograft samples were fixed
in 4% paraformaldehyde at room temperature for 24 h and then
embedded in paraffin. Sections (4-µm thick) were
de-paraffinized with xylene (Merck KGaA) for 5 min at room
temperature and rehydrated with a gradient of 95, 85, 70 and 50%
ethanol for 5 min each at room temperature prior to a 2-min
incubation at room temperature with H&E Y solution (ScyTek
Laboratories, Inc.). Images of all sections were captured using a
Zeiss Axio Imager Z2 upright fluorescence microscope (Zeiss
AG).
For immunohistochemistry staining, human lung cancer
tissue microarray slides (LC10014a, LC10013c and LC814a; 10%
formalin-fixed for 24 h at room temperature, paraffin-embedded;
5-µm thick) were purchased from US Biomax, Inc.; TissueArray.Com LLC as approved by National Taiwan
University Hospital Research Ethics Committee (approval no.
202201055RIND; Taipei, Taiwan). Xenograft samples including both
paired and unpaired tumors were fixed in 4% paraformaldehyde for 24
h at room temperature, paraffin-embedded and cut as sections of
4-µm thick. All slides were de-paraffinized with xylene
(Merck KGaA) for 5 min at room temperature and rehydrated with a
gradient of 95, 85 and 70% ethanol for 5 min each at room
temperature. Antigen retrieval was performed in 10 mM citric acid
buffer at 100°C for 20 min followed by 3%
H2O2 treatment for 20 min at room
temperature. Blocking using Protein block (normal goat serum
reagent as supplied by the manufacturer; cat. no. HK112-9KE;
BioGenex) was performed for 30 min at room temperature. The slides
were incubated with anti-human ITGA4 antibodies (cat no. 350695;
dilution, 1:500; United States Biological) for 2 h at room
temperature and then washed with PBS buffer three times. The slides
were incubated with HRP rabbit/mouse antibodies (undiluted; cat.
no. K5007: Dako; Agilent Technologies, Inc.) for 1 h at room
temperature. 3,3-diaminobezidine chromogenic staining was used for
detection prior to 5 sec hematoxylin counterstaining at room
temperature. LC814a included 6 cases of small cell carcinoma and 17
cases each of squamous cell carcinoma and adenocarcinoma, as well
as their matched lymph node metastases. LC10014a included 50 cases
of adenocarcinoma, and LC10013c included 48 cases of adenocarcinoma
with the matched adjacent normal lung tissues (NATs) and 4 normal
lung tissues. There were 13 overlapping cases among these three
lung tissue arrays, which were annotated and analyzed only once to
avoid repetition. Images of all sections were captured using a
Zeiss Axio Imager Z2 upright fluorescence microscope (Zeiss AG) and
analyzed using StrataQuest 6.0.1.216 software (TissueGnostics GmbH)
for at least three randomly selected fields.
Vasculogenic mimicry assay
In vitro vasculogenic mimicry assays were
performed on 96-well plates coated with 50 µl Growth Factor
Reduced, Phenol Red-Free Matrigel™ per well. pH 6.6 and pH 7.4
cells were seeded at a density of 4×10⁴ cells/well and
cultured for 10 h. Images of the wells were captured using a Zeiss
Axio Observer D1 inverted fluorescence microscope (Zeiss AG). Three
independent experiments with three repeats each were performed.
Three randomly selected images per sample were analyzed using Image
J version 1.53k (National Institutes of Health) for vasculogenic
mimicry structures. Five parameters were analyzed: Total tube
length, number of branching points, number of loops, percentage of
total loop area per well and number of tubes.
To analyze in vivo vasculogenic mimicry,
paraffin-embedded slides of xenograft samples (4%
paraformaldehyde-fixed for 24 h at room temperature; 4-µm
thick) were de-paraffinized with xylene (Merck KGaA) for 5 min at
room temperature and rehydrated with a gradient of 95, 85 and 70%
ethanol for 5 min each at room temperature. The slides were treated
with a periodic acid-Schiff PAS-1 staining kit (ScyTek
Laboratories, Inc.) according to the manufacturer's instructions.
Slides were then processed as for immunohistochemical staining,
including antigen retrieval, quenching, blocking, secondary
antibody incubation, washing, chromogen detection, and
counterstaining as described for immunohistochemical staining.
Slides were incubated with polyclonal rabbit anti-human CD31
antibody (cat. no. ab28364; dilution, 1:500; Abcam) for 2 h at room
temperature. Images of all sections were captured using a Zeiss
Axio Imager Z2 upright fluorescence microscope (Zeiss AG). The
angiogenic structures (CD31+/PAS+) were
counted in four biologically paired whole tumors. Vasculogenic
mimicry structures were defined by CD31−/PAS+
staining accompanied by the presence of red blood cells in the
lumen, and counted from at least five whole tumors of either pH 6.6
and pH 7.4.
Side population analysis
pH 7.4 or pH 6.6 cells (1×10⁶ cells/ml)
were seeded 14 h before the experiment, then incubated in RPMI-1640
medium containing 2% FBS (both from Thermo Fisher Scientific, Inc.)
and 7.5 µg/ml Hoechst 33342, with either DMSO (Mock group)
or the ATP-binding cassette (ABC) transporter inhibitor reserpine
(20 µM; Reserpine group) (all from Merck KGaA) for 2 h at
37°C in the dark, then treated with 0.05% Trypsin-EDTA for
resuspension in sorting buffer containing 50 µg/ml propidium
iodide (both from Thermo Fisher Scientific, Inc.) to exclude
non-viable cells. Cells were subsequently sorted by dual wavelength
analysis (blue, 424-444 nm; red, 675 nm) with an excitation
wavelength of 350 nm using a BD FACS Aria II flow cytometer
(Becton, Dickinson and Company). Data were analyzed using FCS
Express 4 Plus (De Novo Software), and the fold-change of ABC
transporter-dependent side population cells was calculated as [pH
6.6 (side population %Mock-side population
%Reserpine)]/[pH 7.4 (side population
%Mock-side population %Reserpine)].
Western blot analysis
Cell lysates were collected using a buffer
containing 50 mM Tris/HCl (pH 8.0), 1% SDS, 1% deoxycholate and 10
mM EDTA, supplemented with cOmplete™ Protease Inhibitor Cocktail
(cat. no. 11836145001; Roche Diagnostics) and phosphatase inhibitor
cocktail 3 (cat. no. P0044; Merck KGaA), and the lysates were
centrifuged at 4°C at 12,000 × g for 5 min. The protein
concentration was determined using a BCA protein assay kit (Thermo
Fisher Scientific, Inc.), and aliquots containing 20 µg
total protein per lane were analyzed by 10% SDS-PAGE and blotted
onto a PVDF membrane (Pall Corporation). The membranes were blocked
with TBS buffer containing 0.05% Tween-20 and 5% skimmed milk for
30 min at room temperature. After a 2-h incubation at room
temperature with the primary antibodies, including rabbit anti
α-tubulin antibody (cat. no. GTX112141; dilution, 1:1,000; GeneTex,
Inc.), rabbit anti-Oct4 antibody (cat. no. SC9081; dilution, 1:500;
Santa Cruz Biotechnology, Inc.) and rabbit anti-mouse Nanog
antibody (cat. no. RCAB002P; dilution, 1:500; ReproCELL, Inc.). The
membranes were washed with TBS buffer containing 0.1% Tween-20
three times at room temperature before incubation with secondary
antibodies (goat anti-rabbit HRP antibody; cat. no. GTX213110;
dilution, 1:5,000; GeneTex, Inc.), for 1 h at room temperature.
Bands were visualized using the ECL chemiluminescence method
(WesternBright® ECL HRP substrate; Advansta, Inc.) with
an LAS-4000 luminescent image analyzer (FUJIFILM Wako Pure Chemical
Corporation).
Statistical analysis
Unless otherwise specified, all experiments were
repeated independently at least three times. The mean values of the
groups were compared, and the results are presented as the mean ±
SD. GraphPad Prism 7 software (Dotmatics) and OriginPro 2023b
software (OriginLab) were used for statistical analysis.
Comparisons between different groups were analyzed by Student's
unpaired t-test. In paired tumors, the germination times, volume,
density, the percentage of ITGA4+ cells and
ITGA4+ stained areas, as well as the analysis of
endothelial angiogenic and vasculogenic mimicry structures, were
analyzed by Student's paired t-test. In the lung tissue microarray,
the mean intensity of expression per ITGA4+ cells was
analyzed for tumor different nodal statuses and stages using
one-way ANOVA with Tukey's multiple comparisons test. Two-way mixed
ANOVA with the Bonferroni multiple comparisons test was used to
analyze the percentage of ITGA4+ cells in the normal
group vs. (NAT group vs. lung cancer within the same patient
group). Two-way mixed ANOVA with the Bonferroni multiple
comparisons test was used to analyze the mean intensity of
expression per ITGA4+ cells in the no-metastasis group
vs. (metastatic primary tumors group vs. lymph node metastases
within the same patients group). P<0.05 was considered to
indicate a statistically significant difference.
Results
Establishment of the long-term acidosis
cell model
Tumor acidosis develops over long periods of time,
involving serial regulatory processes in the cancer cell that may
lead to the acquisition of a stable phenotype (15). To accurately reflect this
scenario, a long-term acidosis cell model was established in the
present study (Fig. 1A) using the
CLS1 patient-derived primary cells of lung adenosquamous carcinoma
reported in our previous study (26). These cells were acclimated for 2
months in culture media at pH 6.6 to emulate the cellular responses
to acidosis relative to normal physiological culture conditions (pH
7.4) (33,34). Using time-lapse microscopy, both
subclones acclimated at pH 6.6 and pH 7.4 were found to replicate
synchronously without detectable abnormalities or differences in
morphology (Fig. 1B), nor any
significant differences in cell doubling time, population survival
or metabolic rates (Fig. 1C-E).
Cell lines from other cancer types, such as SAS (Tohoku University,
Sendai, Japan) and OECM1 (National Defense Medical Center, Taipei,
Taiwan) of oral squamous cell carcinoma origin, also exhibited good
adaptation to the of acidotic conditions, displaying discernible
changes in population survival rates or growth dynamics (data not
shown). These finding suggested that the lung cancer cells became
well adapted to the long-term acidosis regime, and subsequent
analyses could be conducted with only minimal concern regarding
discrepancies of growth dynamics.
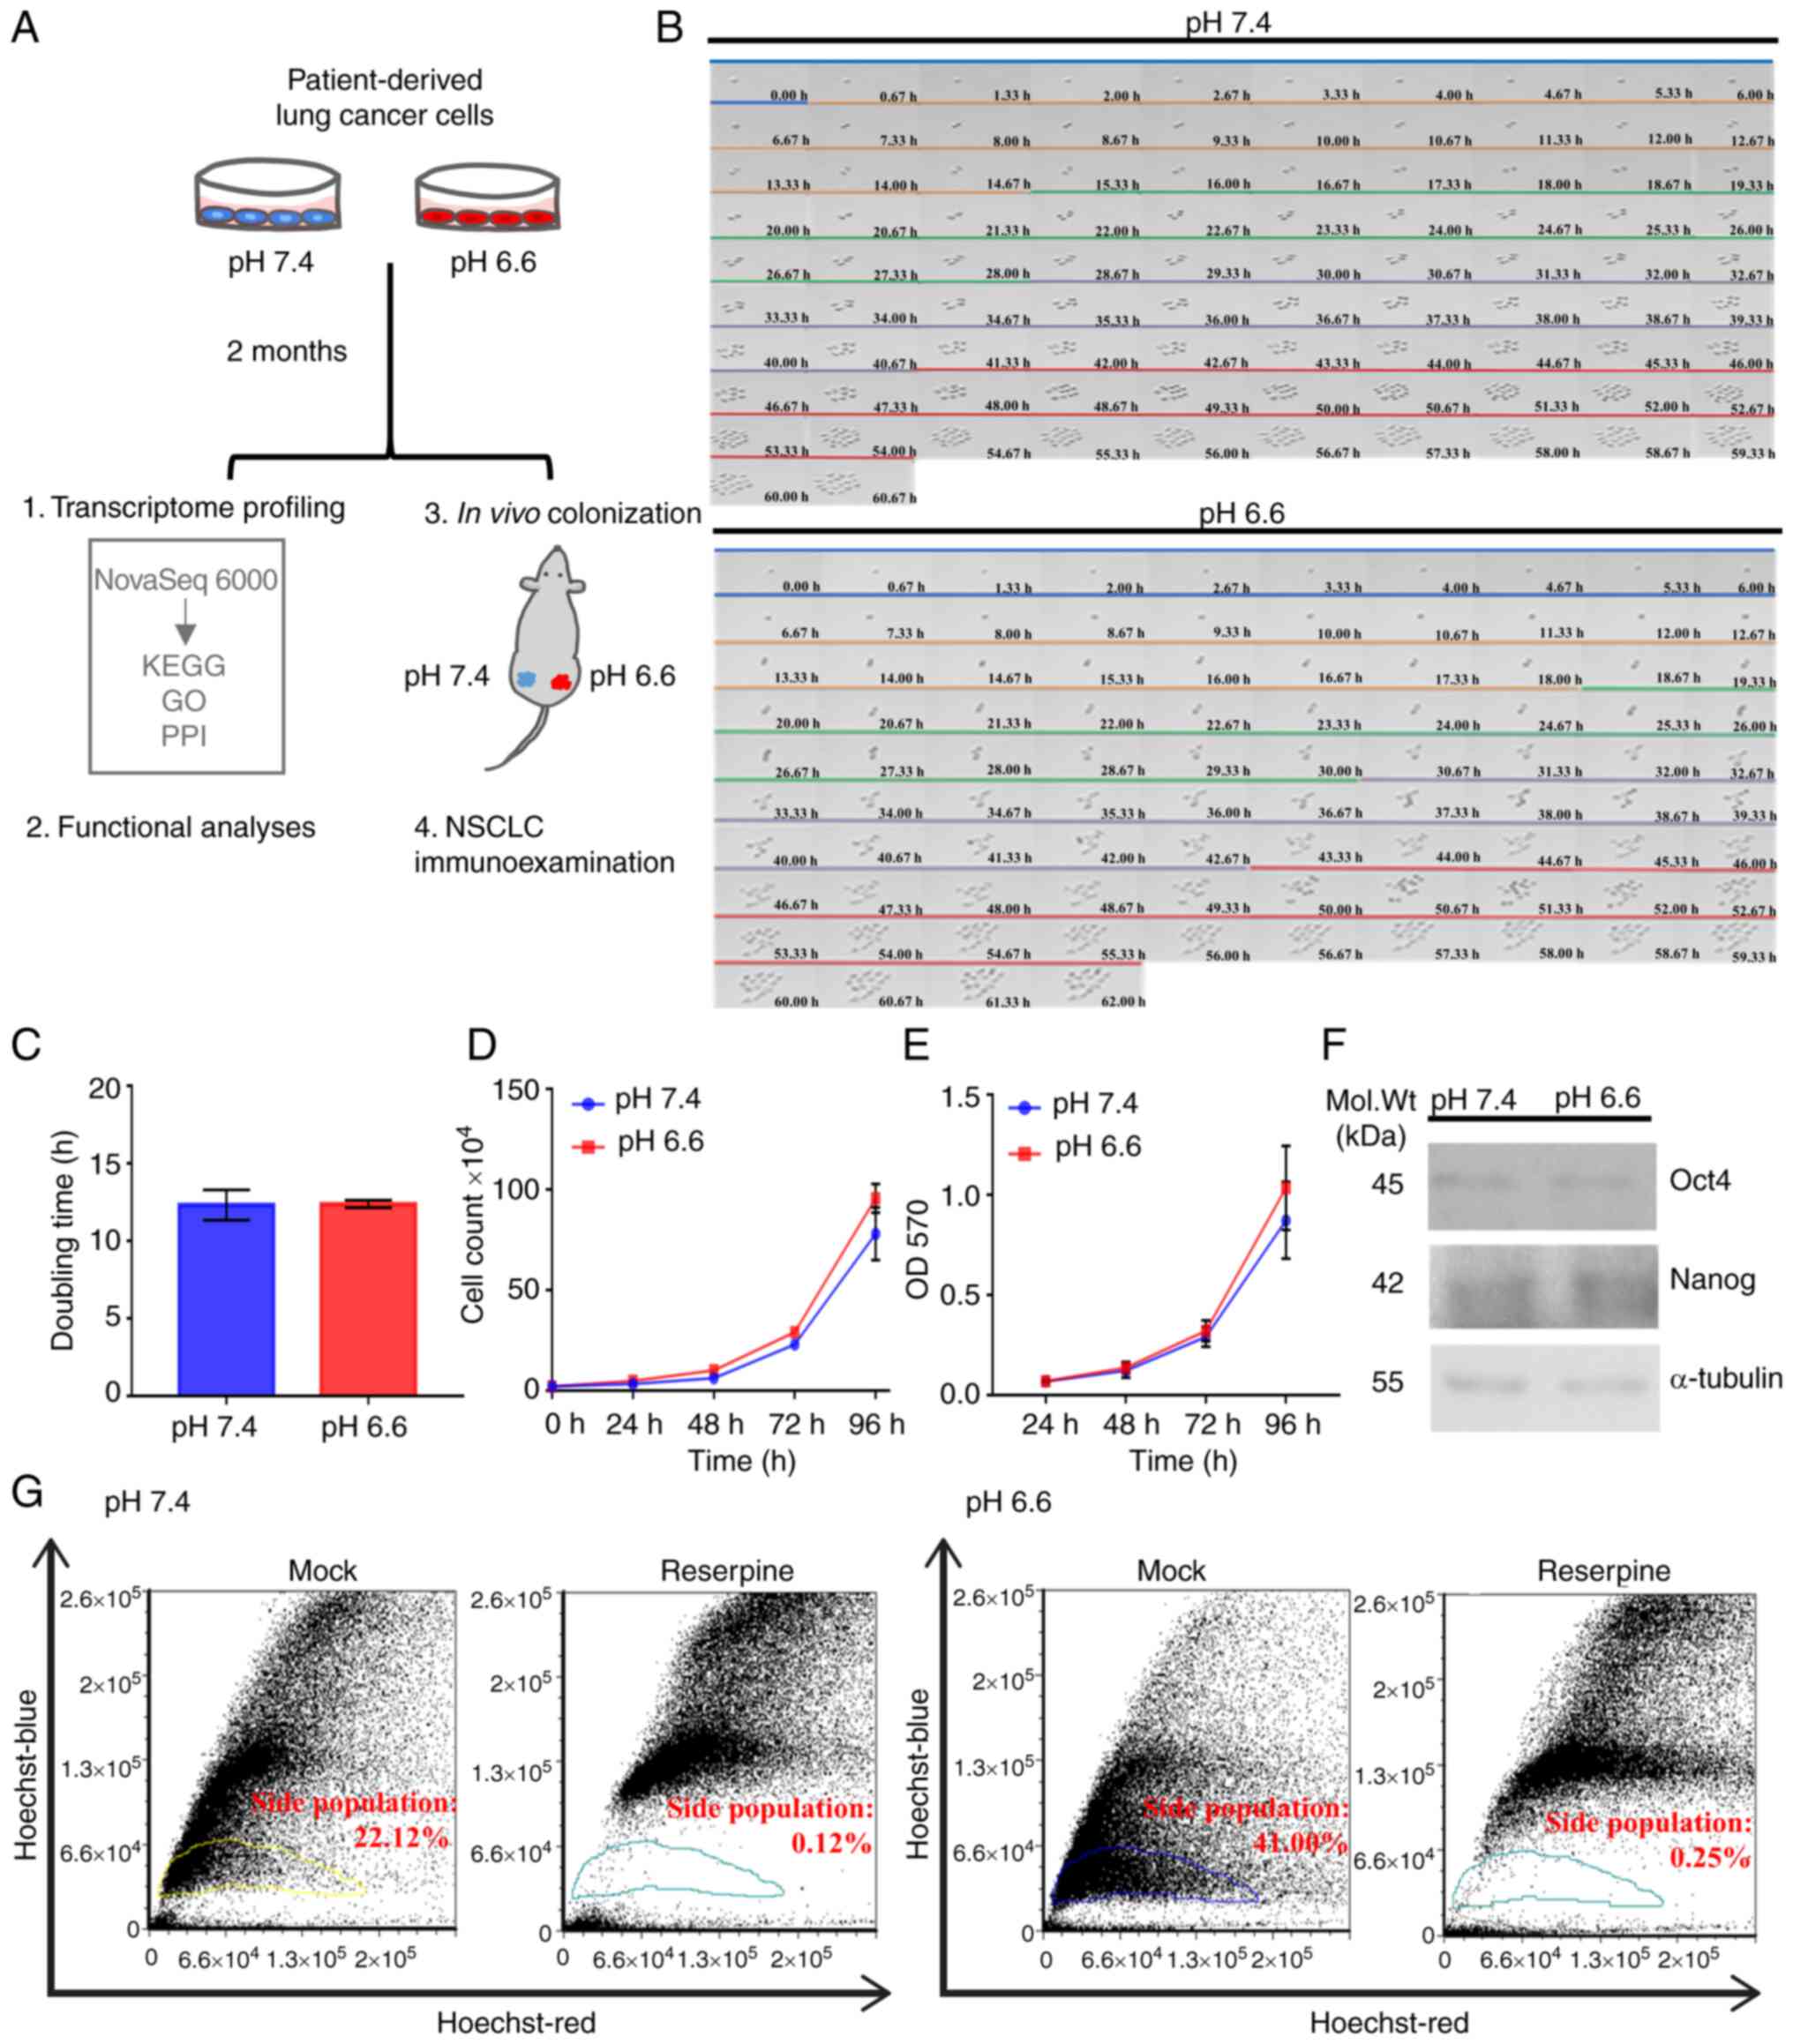 | Figure 1Establishment of long-term acidosis
lung cancer cell model. (A) Treatment scheme and analytical
approach for long-term acidosis in metastatic colonization.
Patient-derived CLS1 lung cancer cells were acclimated for 2 months
in pH 7.4 or pH 6.6 media. Both in vitro and in vivo
assays were validated by clinicopathological examination of NSCLC
specimens. (B) Time lapse microscopy across 96 h to observe
doubling dynamics and morphology at a magnification of x40. Each
color bar indicates one doubling generation, from generation 0
(blue) to 4 (red). (C) Average doubling time of cell generations
(G0-G4) presented as the mean ± SD from three independent
experiments. (D) Viability of pH 7.4 and pH 6.6 cells as examined
using trypan blue exclusion assay at 0, 24, 48, 72 and 96 h
post-seeding based on three independent experiments. (E) Metabolic
curve as determined using MTT assay at 24, 48, 72 and 96 h based on
two independent experiments with three replicates each. (F) Protein
expression of the stemness-associated transcription factors Oct4
and Nanog. Representative western blot image using 20 µg
whole cell lysate per lane. (G) ATP-binding
cassette-transporter-dependent clearance activity. Gated areas mark
the reserpine-sensitive side population cells. Data were analyzed
using Student's unpaired t-test and are presented as the mean ± SD.
Mol. Wt, molecular weight; NSCLC, non-small cell lung cancer; OD,
optical density; GO, Gene Ontology; PPI, protein-protein
interaction; KEGG, Kyoto Encyclopedia of Genes and Genomes. |
Numerous studies have reported that an acidic
microenvironment can trigger stemness-like properties in tumor
cells (35,36). Although western blotting indicated
no significant change in the protein expression levels of either of
the stemness-associated transcription factors Oct4 and Nanog
(Fig. 1F), the pH 6.6 subclones
displayed a 1.85-fold increase in the proportion of
reserpine-sensitive side population cells relative to the pH 7.4
subclones (Fig. 1G), suggesting a
survival advantage of the pH 6.6 subclone associated with ABC
transporter-dependent clearance of noxious agents while growing in
adverse environments. Taken together, the present results indicated
that lung cancer cells can adapt to long-term acidosis, preserving
regular cellular morphology and growth dynamics. Acidosis per
se may not be sufficient to promote the stemness properties of
lung cancer cells; however, with an increased proportion of side
population cells, acidotic cancer cells may display a survival
advantage in adverse environments. The two CLS1 subclones obtained
were referred to as pH 6.6 cells and pH 7.4 cells, and they were
subsequently used as the model to study the lung cancer cell
response following long-term acidosis.
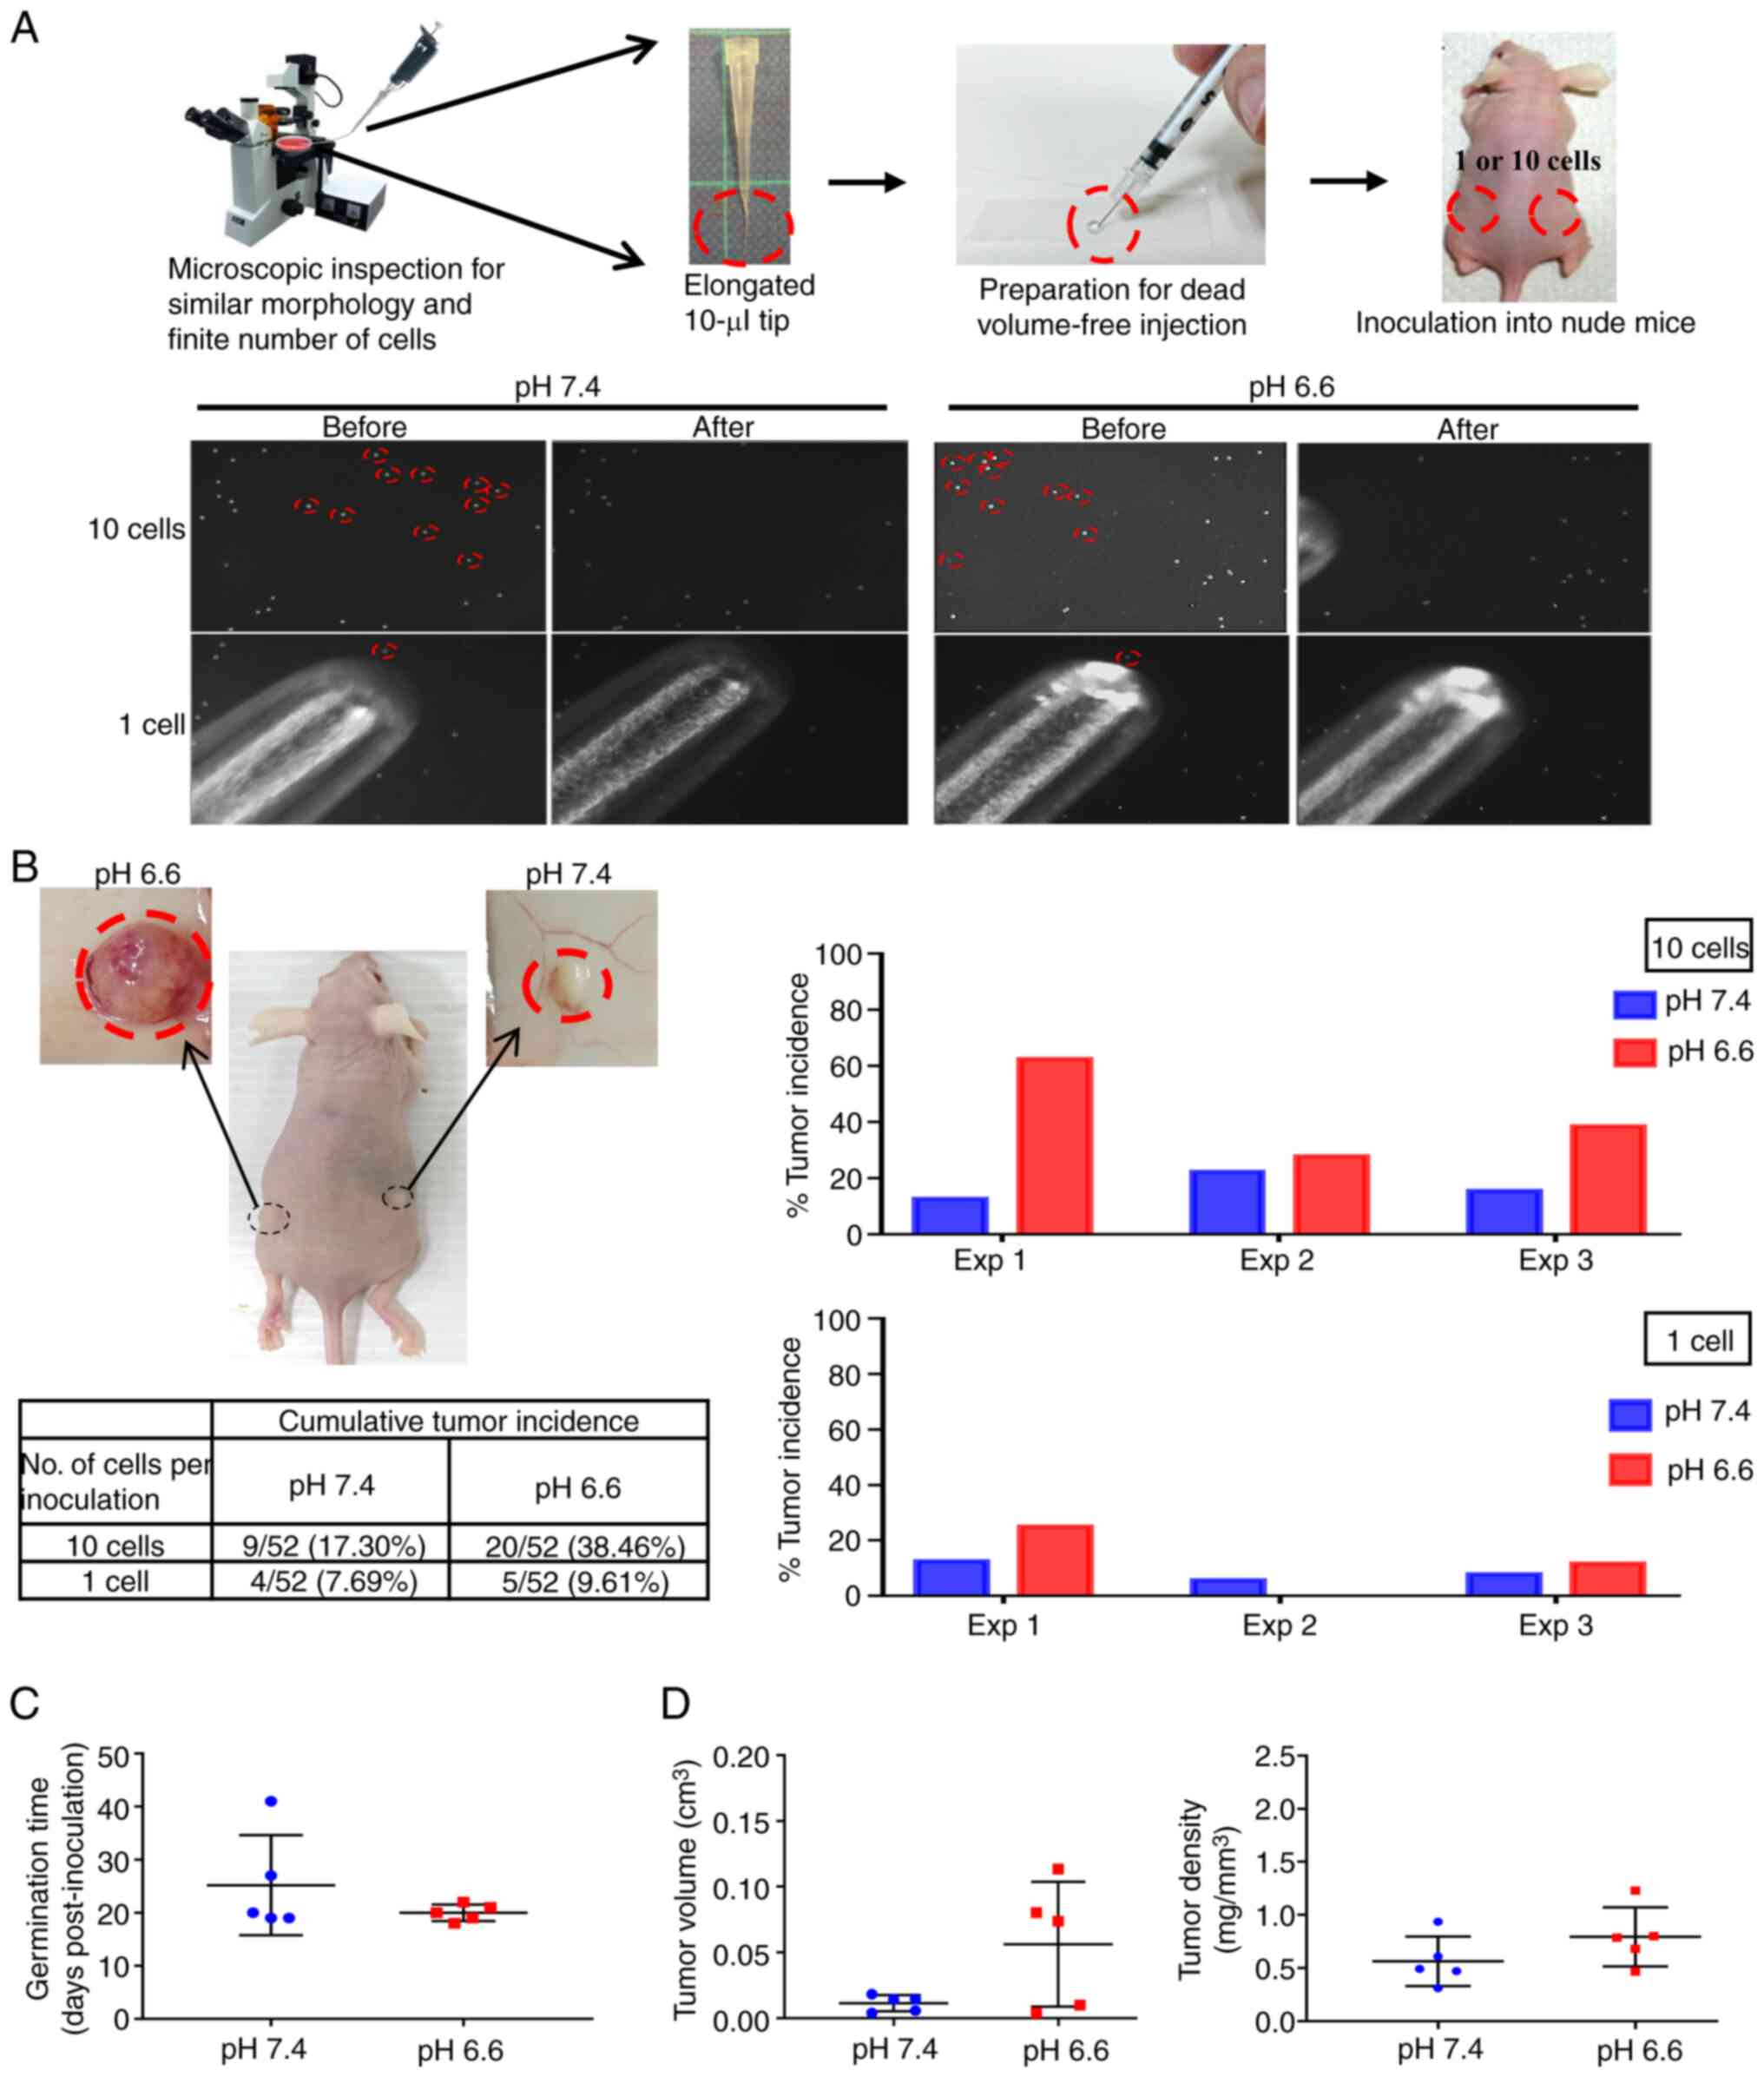
Acidosis promotes metastatic incidence
and growth
Overcoming the adverse environment for growth is a
primordial task for CTCs to successfully establish as a new
metastatic colony (22). To test
whether the survival advantage of acidotic cells may lead to
increased metastatic colony incidence, a novel experimental model
that tightly controlled the exact number and physical conditions of
the inoculated cells was designed, to enable a rigorous comparison
of the colonizing ability of the pH 7.4 and pH 6.6 cells. Since
CTCs found in the pulmonary veins of patients with non-small cell
lung cancer (NSCLC) are mostly clusters of ~10 cells (37), exactly 10 cells or one single cell
from the pH 6.6 and pH 7.4 cells were selected under an inverted
microscope, then packed together by natural gravity in 5 µl
growth factor-reduced Matrigel (Fig.
2A). These cells were implanted subcutaneously in opposite
flanks of nude mice, which were sacrificed to inspect the tumor
growth either on day 42 post-inoculation or earlier if humane
endpoint criteria had been reached. After performing three
independent experiments, grown tumor masses were retrieved from 27
mice (Fig. S2), while 33 mice
did not develop tumors (Fig.
S3). As shown in Fig. 2B, the
cumulative tumor incidence of the 10-cell and 1-cell inoculations
of the pH 6.6 cells surpassed that of the pH 7.4 cells by 2.22- and
1.25-fold, respectively. When comparing paired tumors grown on the
same mouse, the germination time of the pH 6.6 tumors was faster
(20±1.5 days vs. 25±9.4 days post-inoculation for the pH 7.4
tumors), and their standard deviation was smaller, indicating a
more coordinated pace compared with their pH 7.4 counterparts
(Fig. 2C); they also exhibited a
larger volume with a slightly higher density (Fig. 2D). Albeit without reaching
statistical significance, the tumor incidence rate, germination
time, volume and density all displayed consistent differences when
comparing pH 6.6 tumors with their pH 7.4 counterparts,
collectively supporting a more robust establishment of the pH 6.6
cells as developing colonies. This also indicates that, despite the
low number of cells inoculated, the metastatic colonization model
was able to provide reliable information on the role of long-term
acidosis in promoting tumor germination and growth.
Acidosis results in reorganization of the
ECM
The molecular events underlying the metastatic
advantage of acidotic cells were subsequently investigated. RNA
sequencing analysis was employed to profile the transcriptomes of
both the pH 6.6 and pH 7.4 cells (Gene Expression Omnibus series
accession no. GSE200546; https://www.ncbi.nlm.nih.gov/geo/query/acc.cgi?acc=GSE200546)
(38). A total of 1,735
differentially expressed genes (>2-fold change; PPEE <0.05)
were identified in two independent RNA sequencing experiments with
two biological replicates each (Fig.
S4). Of these genes, 142 showed consistent changes in all
replicates (Fig. 3A), of which 44
genes were found to be upregulated and 98 genes were downregulated
in pH 6.6 cells. Heatmap analysis of these 142 acidosis-responsive
genes highlighted the differential expression of numerous
ECM-related genes, including ITGA4, FBN1, FBN2,
COL6A1, ITGB4 and VTN (Fig. 3B). In Table I, the 20 most upregulated and
downregulated genes are listed. Furthermore, functional annotation
of these 142 acidosis-responsive genes using KEGG database analysis
identified 'ECM-receptor interaction' and 'cell adhesion molecules'
as the most significantly overrepresented categories.
Correspondingly, in the GO enrichment analysis of these
acidosis-responsive genes, the terms 'cell adhesion' and
'regulation of cell communication' in the BP category, 'plasma
membrane' and 'extracellular region' in the CC category, and
'extracellular matrix structural constituent' in the MF category
were the main terms identified (Fig.
3C). Finally, STRING analysis of the protein-protein networks
(>0.5 confidence score) revealed that these 142
acidosis-responsive genes gravitated around processes involving
'ECM organization', 'regulation of localization' and 'cellular
response to chemical stimulus' (Fig.
3D). Taken together, these results suggested that a coordinated
and largescale reorganization of the ECM occurs upon long-term
acidosis of lung cancer cells.
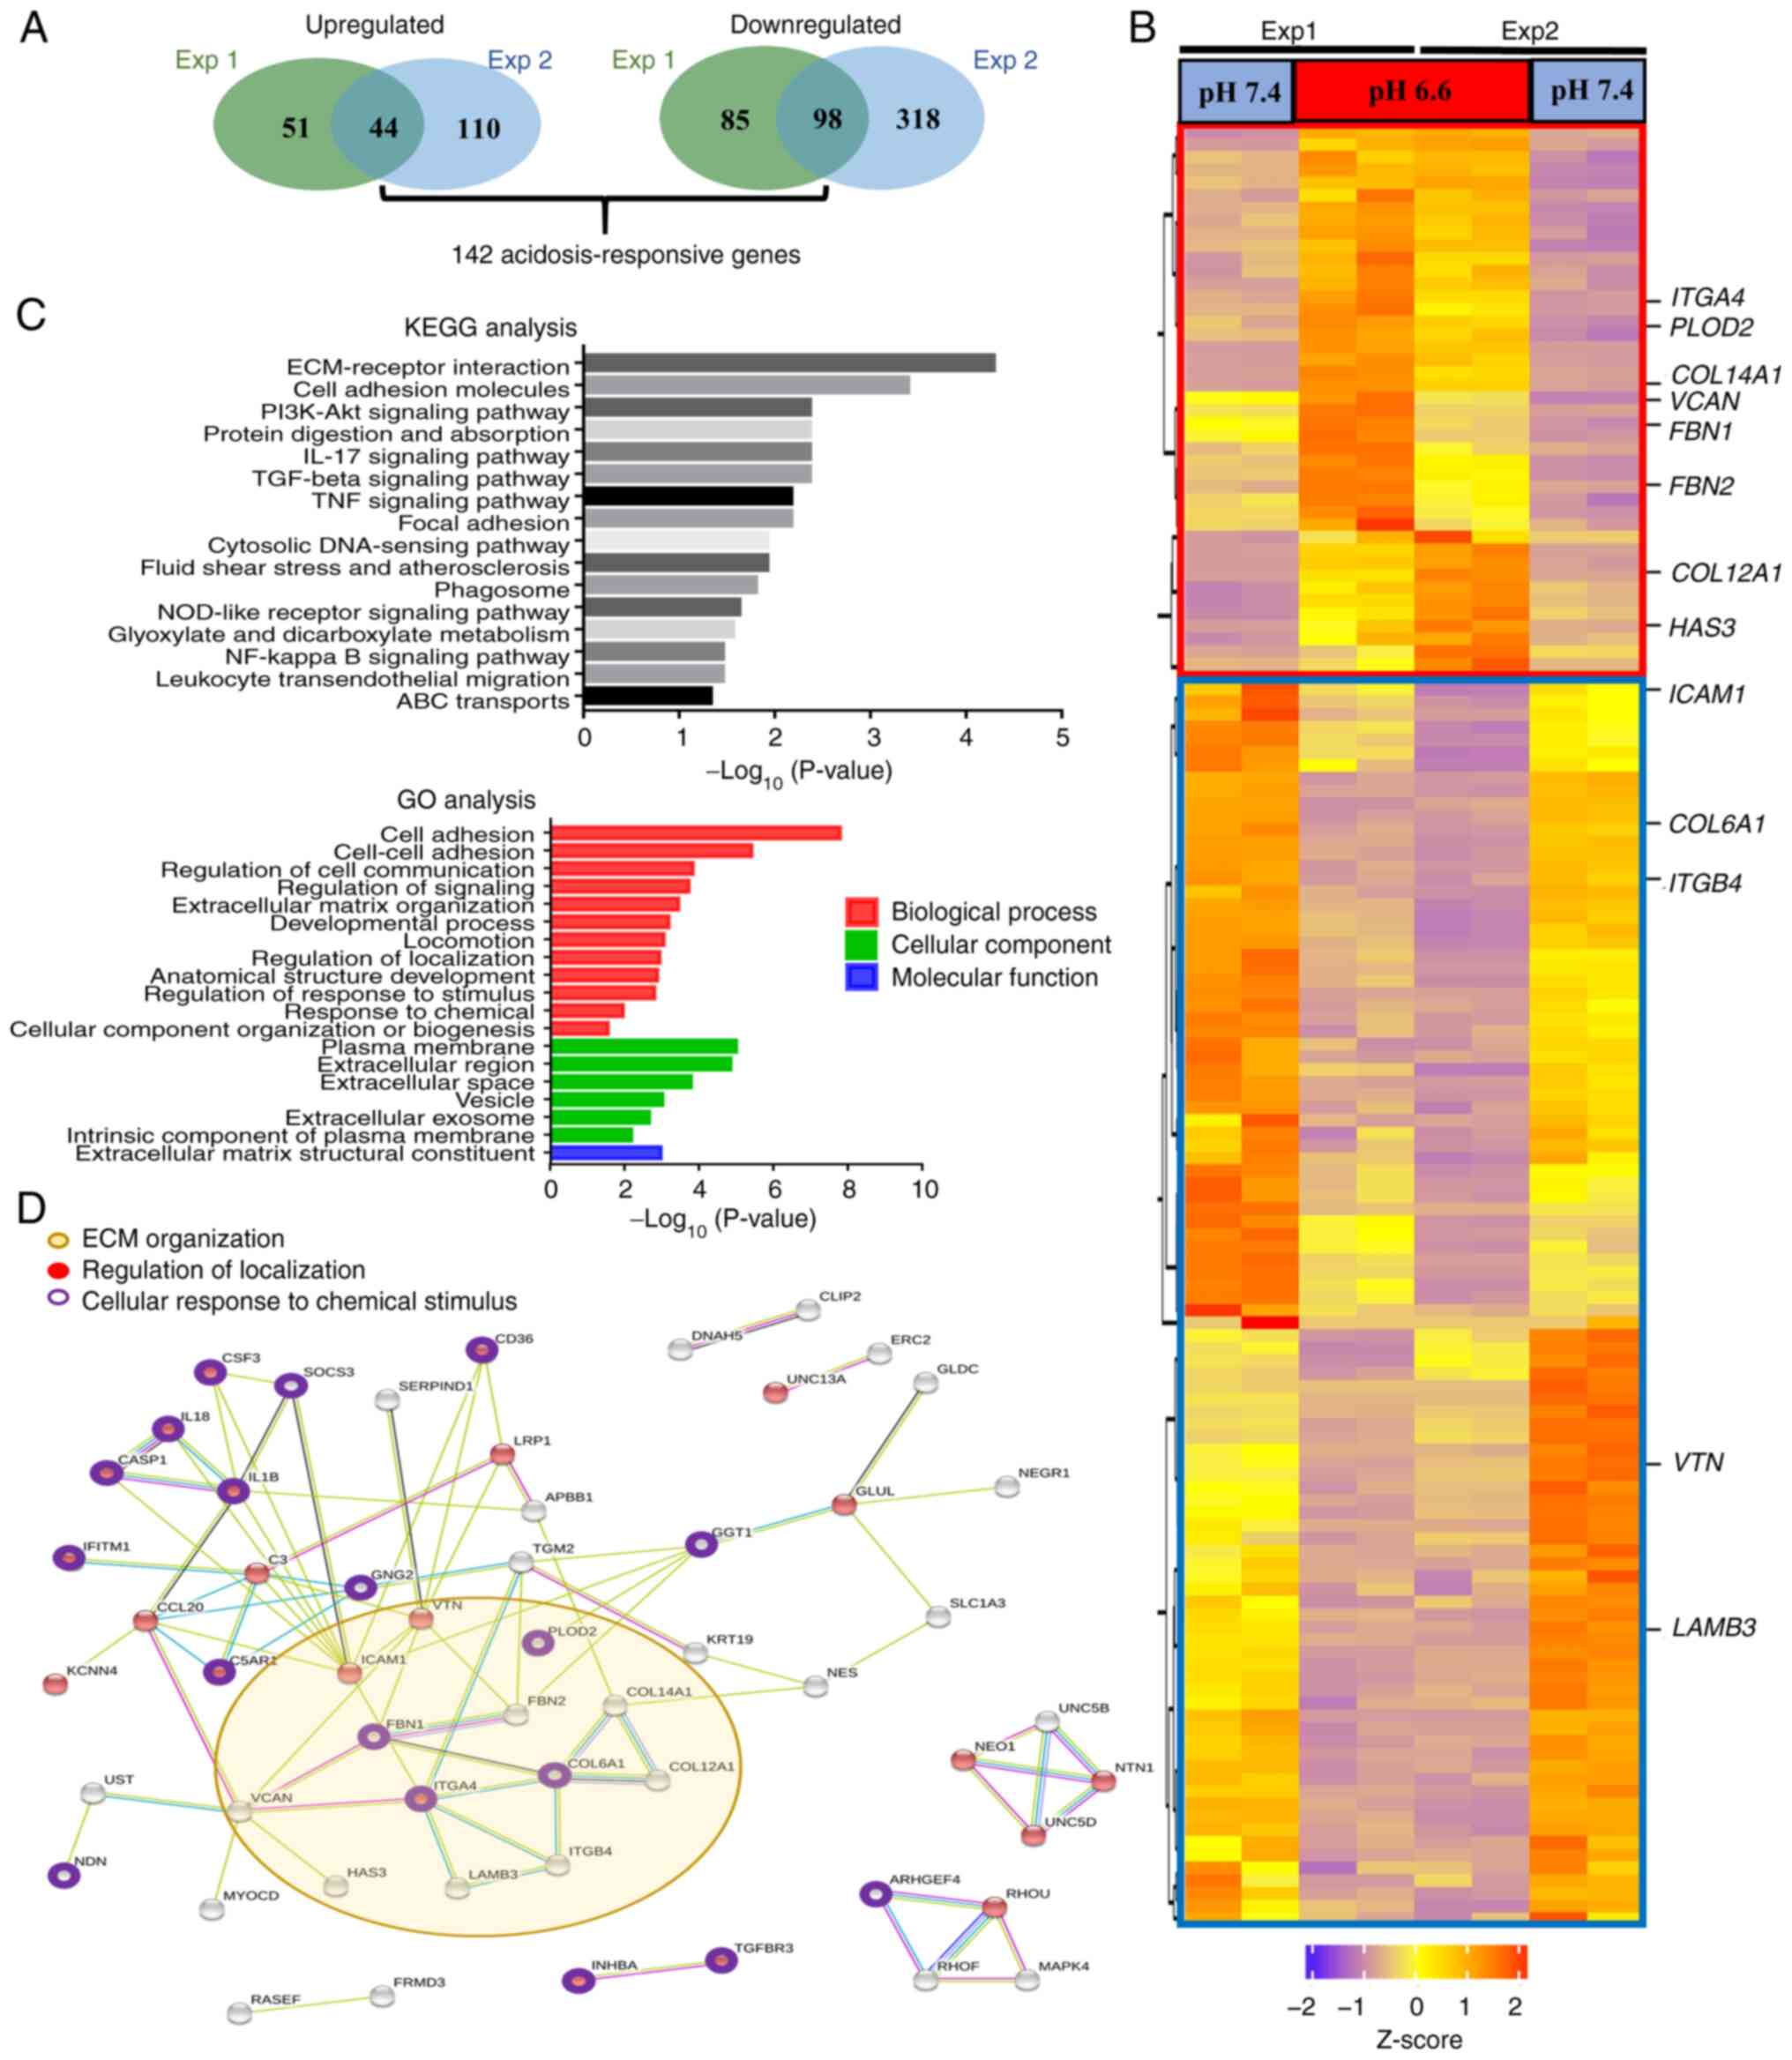 | Figure 3Long-term acidosis induces
reorganization of the ECM. (A) A total of 142 acidosis-responsive
genes were identified as those showing consistent differential
expression with >2-fold change at a posterior probability of
being equally expressed <0.05 in two independent RNA sequencing
experiments with two repeats each. (B) Heatmap of the 142
acidosis-responsive genes. The red box demarks the 44 upregulated
genes, while blue box demarks the 98 downregulated genes in pH 6.6
cells. ECM-associated genes identified by KEGG analysis are
indicated. (C) Both KEGG pathway and GO analyses annotated
ECM-associated events, including 'ECM-receptor interaction', 'cell
adhesion' and 'extracellular matrix structural constituent', as the
most prominent changes induced after long-term acidosis. P<0.05
was considered to indicate a statistically significant difference.
(D) Protein-protein interaction analysis of the 142
acidosis-responsive genes using the Search Tool for the Retrieval
of Interacting Genes/Proteins database. Interactions are
color-coded as follows: Blue, gene co-occurrence; black,
co-expression; purple, experimentally determined; aqua, curated
databases; and olive yellow, text-mining. A confidence score
>0.5 was set as the filter value. ABC, ATP-binding cassette;
ECM, extracellular matrix; Exp, experiment; GO, Gene Ontology;
KEGG, Kyoto Encyclopedia of Genes and Genomes; NOD,
nucleotide-binding oligomerization domain. |
 | Table IDifferentially expressed genes after
long-term acidosis. |
Table I
Differentially expressed genes after
long-term acidosis.
A, Top 20
upregulated genes
|
|---|
| No. | Gene name | Reads FC |
log2FC |
|---|
| 1 |
TMPRSS15 | 2177.5183 | 11.0885 |
| 2 | LEF1 | 16.1598 | 4.0143 |
| 3 | COL14A1 | 14.8659 | 3.8939 |
| 4 | ITGA4 | 13.5348 | 3.7586 |
| 5 | CFI | 12.7163 | 3.6686 |
| 6 | SLITRK6 | 10.1096 | 3.3377 |
| 7 | COL12A1 | 8.9881 | 3.1680 |
| 8 | ADGRV1 | 7.5856 | 2.9232 |
| 9 | NCAM2 | 7.2470 | 2.8574 |
| 10 | TENM1 | 6.6790 | 2.7396 |
| 11 | NEGR1 | 6.3001 | 2.6554 |
| 12 | GNG2 | 6.1555 | 2.6219 |
| 13 | MYOCD | 5.2372 | 2.3888 |
| 14 | GPR141 | 5.1445 | 2.3630 |
| 15 | RASEF | 4.7859 | 2.2588 |
| 16 | LBH | 4.4340 | 2.1486 |
| 17 | FBN2 | 4.2925 | 2.1018 |
| 18 | HAS3 | 3.9088 | 1.9667 |
| 19 | GCA | 3.8591 | 1.9482 |
| 20 | OR51B5 | 3.8137 | 1.9312 |
|
| B, Top 20
downregulated genes |
|
| No. | Gene name | Reads FC |
log2FC |
|
| 1 | SERF1A | 0.0075 | −7.0553 |
| 2 | CDH11 | 0.0378 | −4.7272 |
| 3 | MAL2 | 0.0383 | −4.7077 |
| 4 | DCLK1 | 0.0427 | −4.5507 |
| 5 | ARHGEF5 | 0.0462 | −4.4350 |
| 6 | ZNF44 | 0.0588 | −4.0875 |
| 7 | NDN | 0.0598 | −4.0641 |
| 8 | IGSF11 | 0.0622 | −4.0060 |
| 9 | MAPK4 | 0.0637 | −3.9722 |
| 10 | AMDHD1 | 0.0696 | −3.8445 |
| 11 | CSF3 | 0.0753 | −3.7305 |
| 12 |
TMEM256-PLSCR3 | 0.0869 | −3.5250 |
| 13 | ERC2 | 0.1061 | −3.2370 |
| 14 | FAM134B | 0.1286 | −2.9585 |
| 15 | CRIP1 | 0.1300 | −2.9439 |
| 16 | SLCO2B1 | 0.1365 | −2.8728 |
| 17 | AGR2 | 0.1404 | −2.8321 |
| 18 | MYOM3 | 0.1409 | −2.8270 |
| 19 | PLA2R1 | 0.1440 | −2.7962 |
| 20 | CYB5R2 | 0.1672 | −2.5801 |
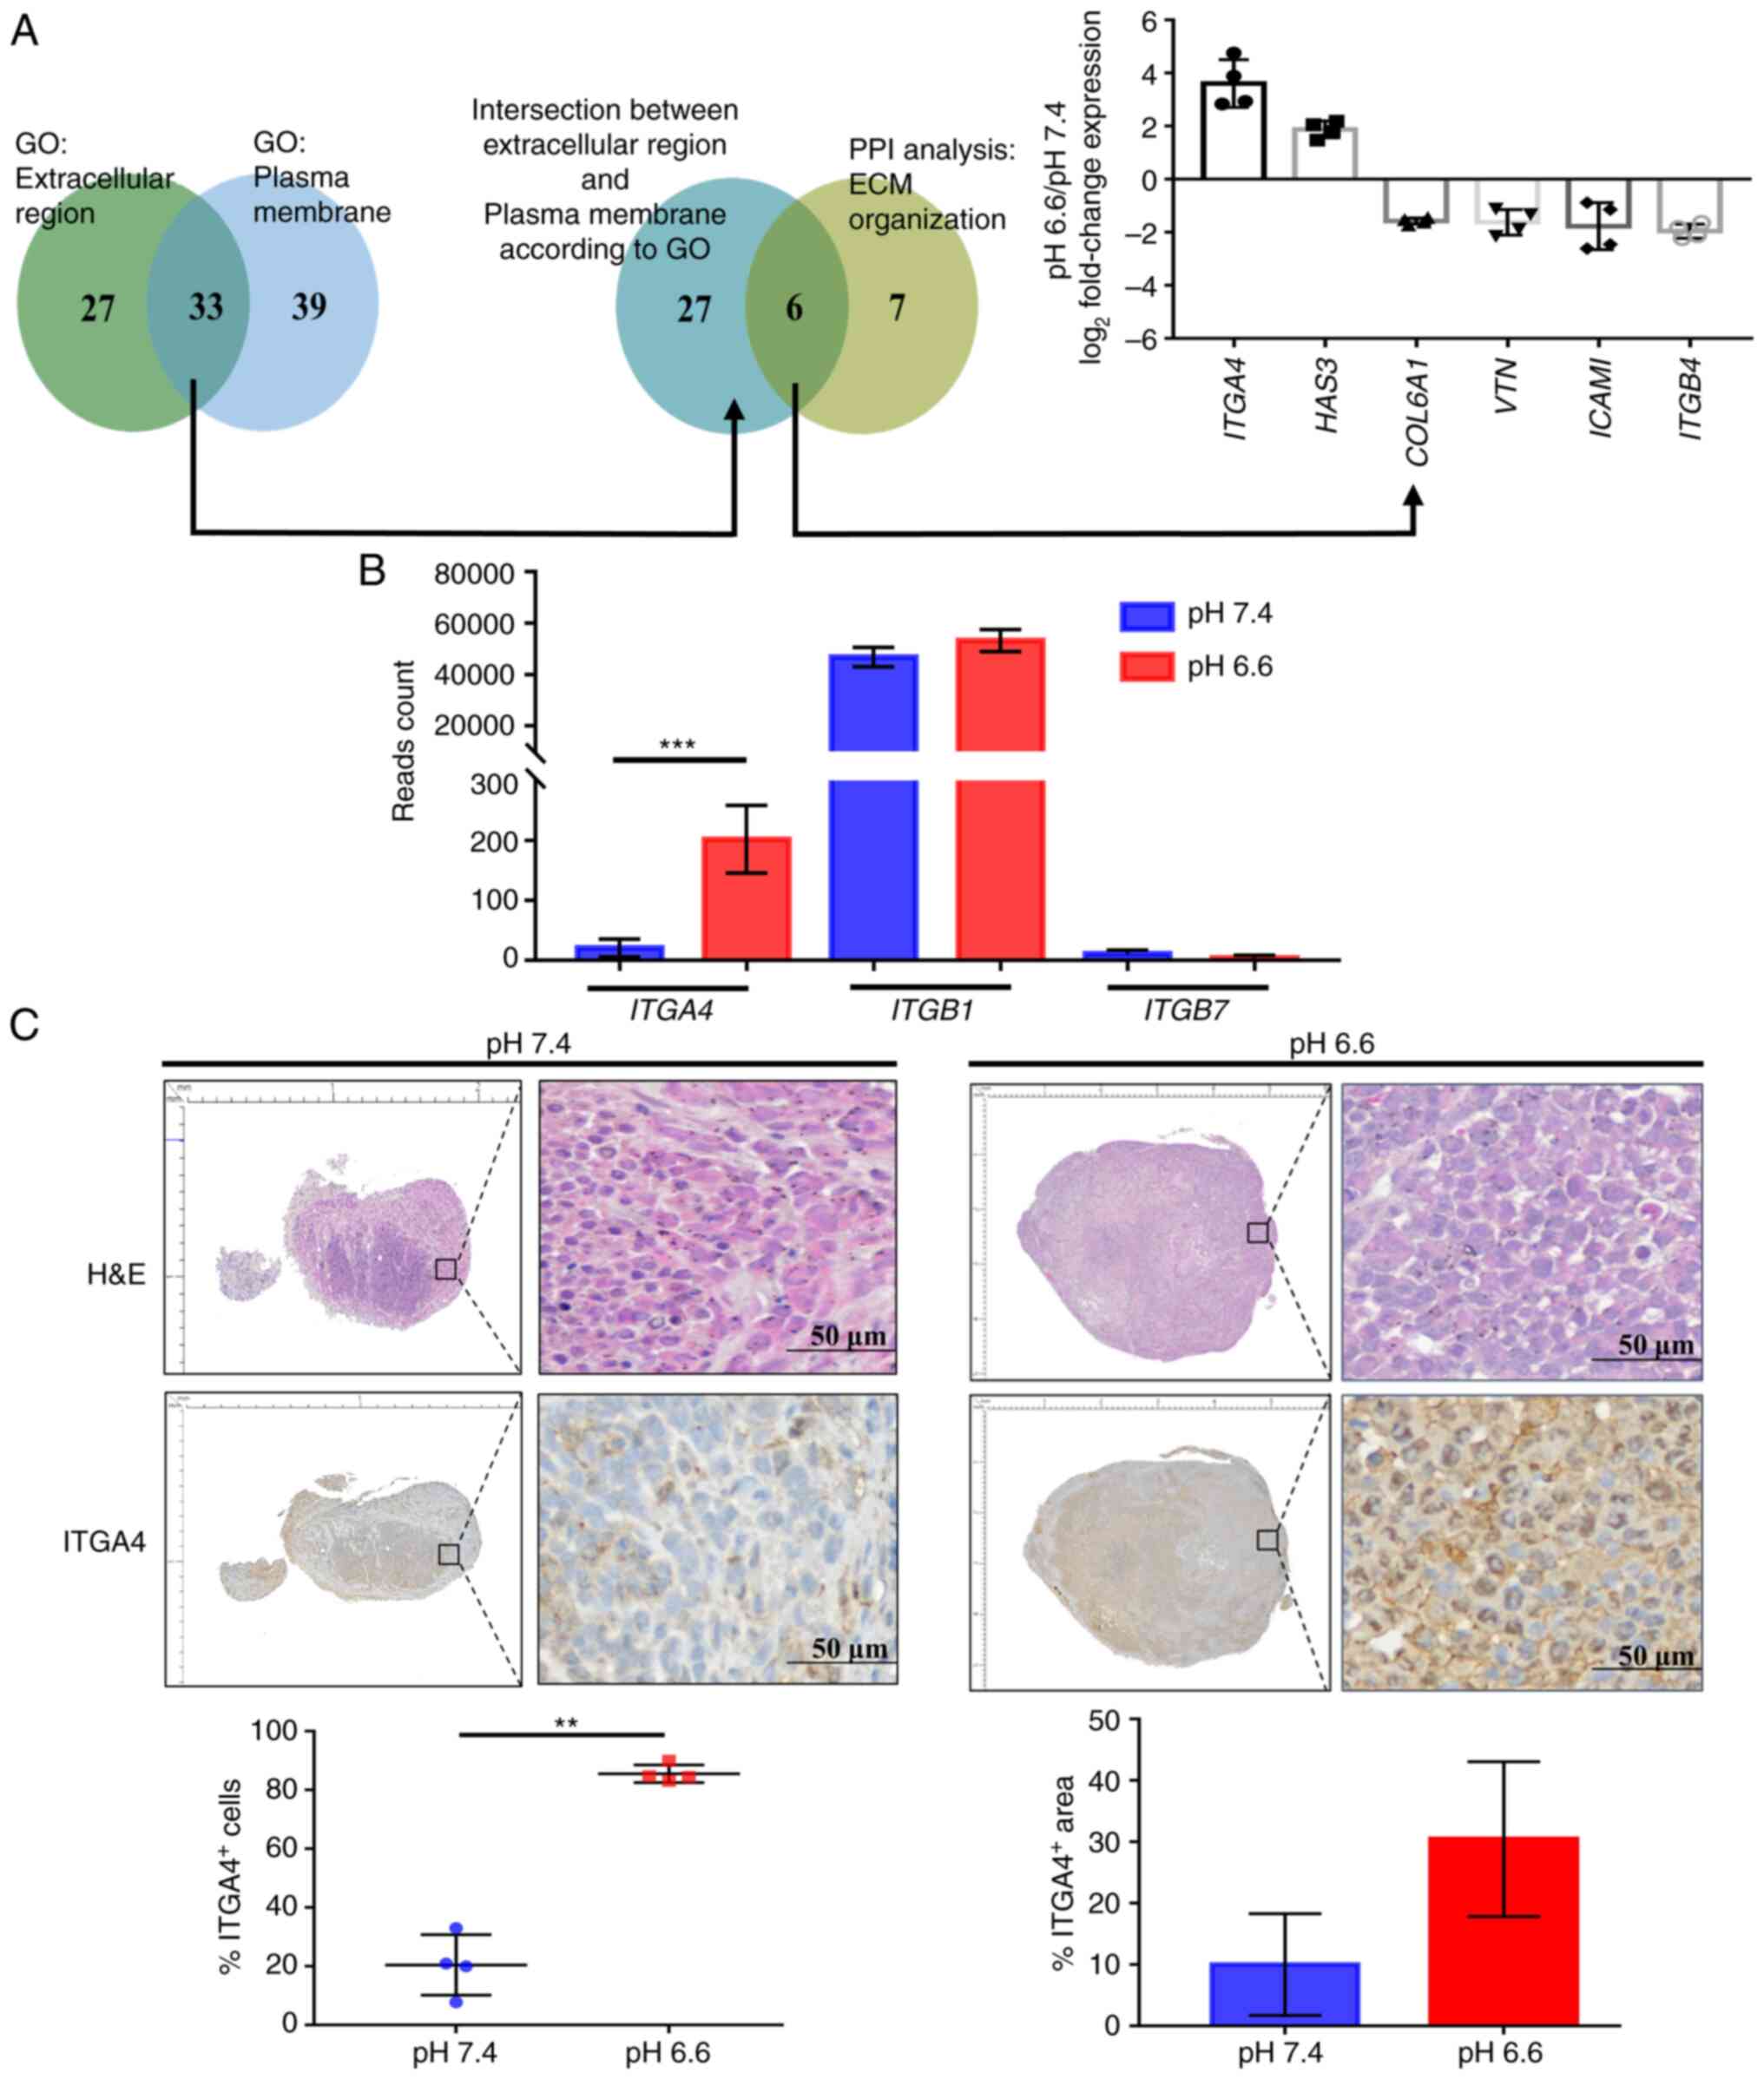
Increased ITGA4 protein expression in the
acidotic metastases
To identify the direct participants of
acidosis-induced ECM organization that may offer targetability in
terms of future therapeutic interventions, the acidosis-responsive
genes annotated to the two GO categories 'extracellular region' and
'plasma membrane', which were also included in the 'ECM
organization' category in PPI analysis, were selected. Of the six
targets identified, ITGA4 was found to be the most
upregulated gene as determined by the fold change of the read
counts (Fig. 4A). ITGA4
transcripts were present at low levels in pH 7.4 cells. They encode
for the α4 subunit of the integrin protein family, which
heterodimerizes with either the β1 or the β7 subunit to form a
functional integrin to regulate cell motility and adhesion
(39). High and steady levels of
ITGB1 transcripts were found in both the pH 6.6 and 7.4 cell
groups, while ITGB7 was expressed only at negligible levels
(Fig. 4B). This suggests that the
higher expression of ITGA4 may result in an increase of functional
α4β1 integrin in the pH 6.6 cells. Immunohistochemical examination
confirmed that the percentage of ITGA4-expressing cells was
significantly higher in the pH 6.6 metastatic tumors, although the
increase in the positively stained area was not statistically
significant (Fig. 4C).
Furthermore, ITGA4 proteins were demonstrated to be predominantly
localized to the cell membrane of the pH 6.6 tumors (Fig. 4C; lower right panel). Taken
together, these experiments suggested that acidosis induced the
upregulation of ITGA4 mRNA, which is effectively translated
into protein, and this higher level of ITGA4 protein expression was
sustained in acidotic metastatic colonies.
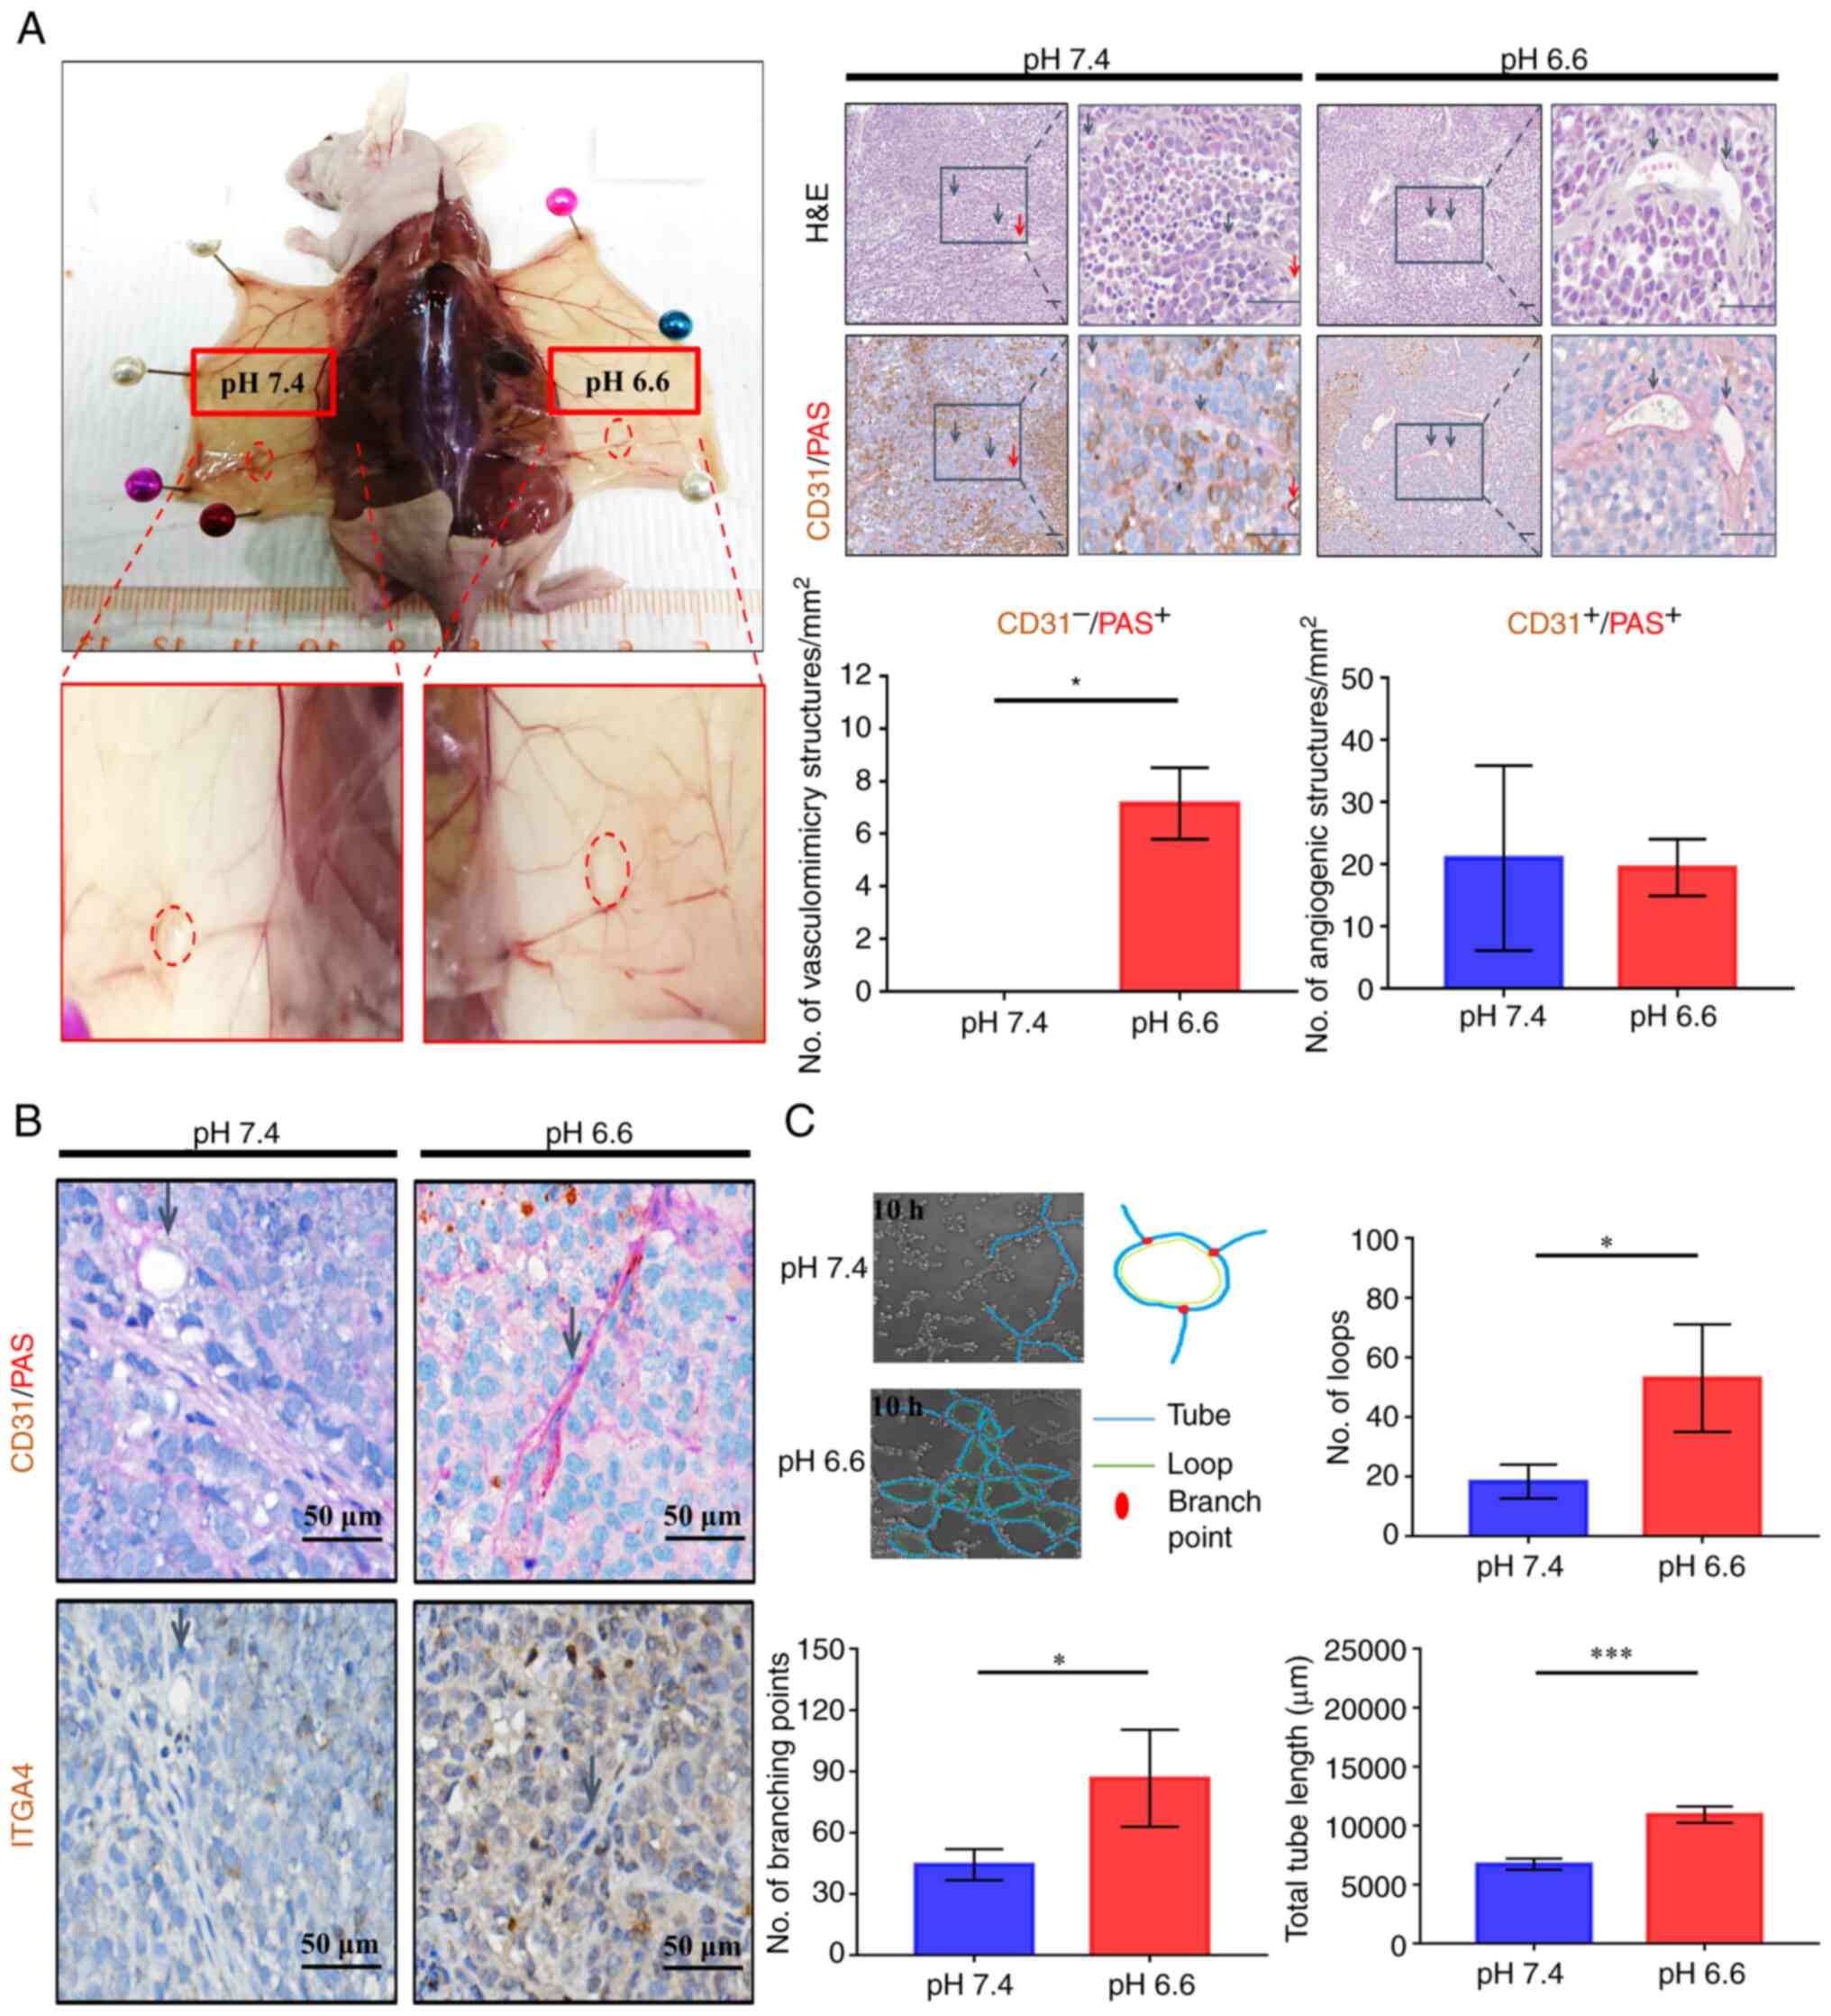
Long-term acidosis enhances vasculogenic
mimicry
In solid tumors, ITGA4 expression has been
implicated in tumor interaction with vascular endothelial cells,
which is crucial for proper metastatic colonization and
angiogenesis (40,41). To examine the development of
vascular structures, all paired tumors that were grown in the same
recipient mouse were compared, in order to minimize
inter-individual differences in the ability of vascularization. A
similar extent of macroscopic neoangiogenic blood vessel formation
was observed for pH 6.6 and pH 7.4 tumors (Fig. 5A; left panels). Both tumors were
found to be irrigated internally with CD31-positive angiogenic
microvessels. By contrast, only the pH 6.6 tumors displayed a large
number of CD31−/PAS+ trabecular structures,
indicative of the presence of vasculogenic mimicry in the acidotic
tumors, while no such structures were observed in the paired pH 7.4
tumors (Fig. 5A). This
observation was sustained even when comparing all grown tumors
obtained from the experiment (Fig.
S5A), and the accentuated expression of ITGA4 surrounding these
structures (Fig. 5B) suggested a
possible involvement of ITGA4 in the formation of vasculogenic
mimicry. To verify whether long-term acidosis could promote
vasculogenic mimicry in vitro, live microscopy was employed
to compare the potential of vasculogenic mimicry of pH 6.6 cells
vs. pH 7.4 cells. The numbers of vasculogenic mimicry loops and
branch points formed by pH 6.6 cells were significantly higher, and
their total lengths were longer (Fig.
5C). Parameters of potential trabecular space for nutrient
infusion, as evaluated by the total loop area per well (Fig. S5B), as well as the quantity of
tubes formed (Fig. S5C), were
also found to be higher in the acidotic cells. Taken together,
these results suggested that long-term acidosis could promote the
formation of vasculogenic mimicry networks, thereby enhancing the
ability of tumors to establish nutrient and metabolite exchanges in
the new colony.
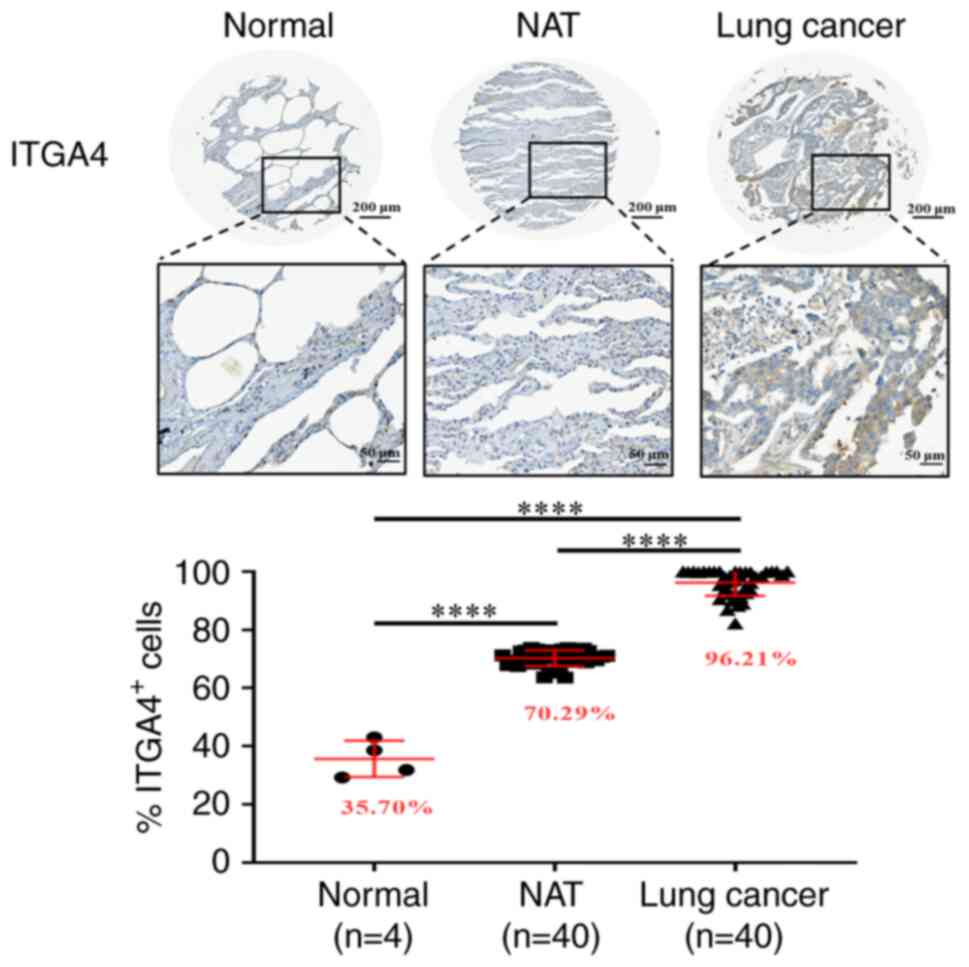
ITGA4 upregulation is not restricted to
the cancer cells
Since acidosis may affect the microenvironment
beyond the intratumoral milieu, it was subsequently examined
whether upregulation of ITGA4 also occurred in the adjacent
tissues. Immunohistochemical staining indicated that ITGA4 protein
expression in normal lung tissue was low, whereas in normal lung
tissues adjacent to the tumors, the presence of ITGA4 was found to
be significantly higher, accompanying an even higher expression in
the tumor cells themselves (Fig.
6). A 2-fold upregulation of ITGA4 expression upon
challenging the cells with a pH 6.6 environment for 24 h was also
observed, suggesting that this increase in the mRNA level was a
rapid response to environmental acidosis, which may be further
maintained and amplified as acidosis is sustained (Fig. S6). These results indicated that
the upregulation of ITGA4 is a phenomenon common to tissues
in the tumor microenvironment, which is further amplified in the
tumor cells as acidosis is prolonged.
Upregulation of ITGA4 expression is a
signature of primary tumors with metastatic potential
Upregulation of ITGA4 expression has been associated
with metastasis in several different tumor types (42-44). To determine the participation of
ITGA4 in metastatic colonization, clinical lung cancer specimens
were examined, and ITGA4 expression was compared across TNM
descriptors. As shown in Fig. 7A,
ITGA4 was widely expressed in all adenocarcinoma specimens tested.
Notably, compared with the non-metastatic primary tumors, ITGA4
expression as evaluated by mean intensity per positively stained
cells was significantly higher in the primary tumors that had
already disseminated (N1 and N2+N3; Fig. 7B), whereas the level of ITGA4
expression was not significantly different between the N1 or N2
primary tumors and their corresponding lymph node metastases
(Fig. 7C). Similarly, statistical
analysis across different stages of lung cancer (Fig. 7D) also indicated that upregulation
of ITGA4 expression occurred upon the tumor's entry into stage II
(Fig. 7E), whereas neither more
advanced stages, nor their corresponding metastases, showed any
further significant increase in the ITGA4 level (Fig. 7F). Taken together, these results
indicated that the upregulation of ITGA4 is a common feature of
primary lung tumors that have developed metastatic potential, and
acquisition of a higher level of ITGA4 may be a prerequisite for
the successful completion of metastasis to form secondary tumors.
Since the upregulation of ITGA4 persists within the lymph node
metastases where acidosis may no longer be present, these data also
suggested that acidosis may possess the potential to induce
long-term regulatory changes that support the continued
upregulation of ITGA4 even after extratumoral acidosis pressure is
alleviated.
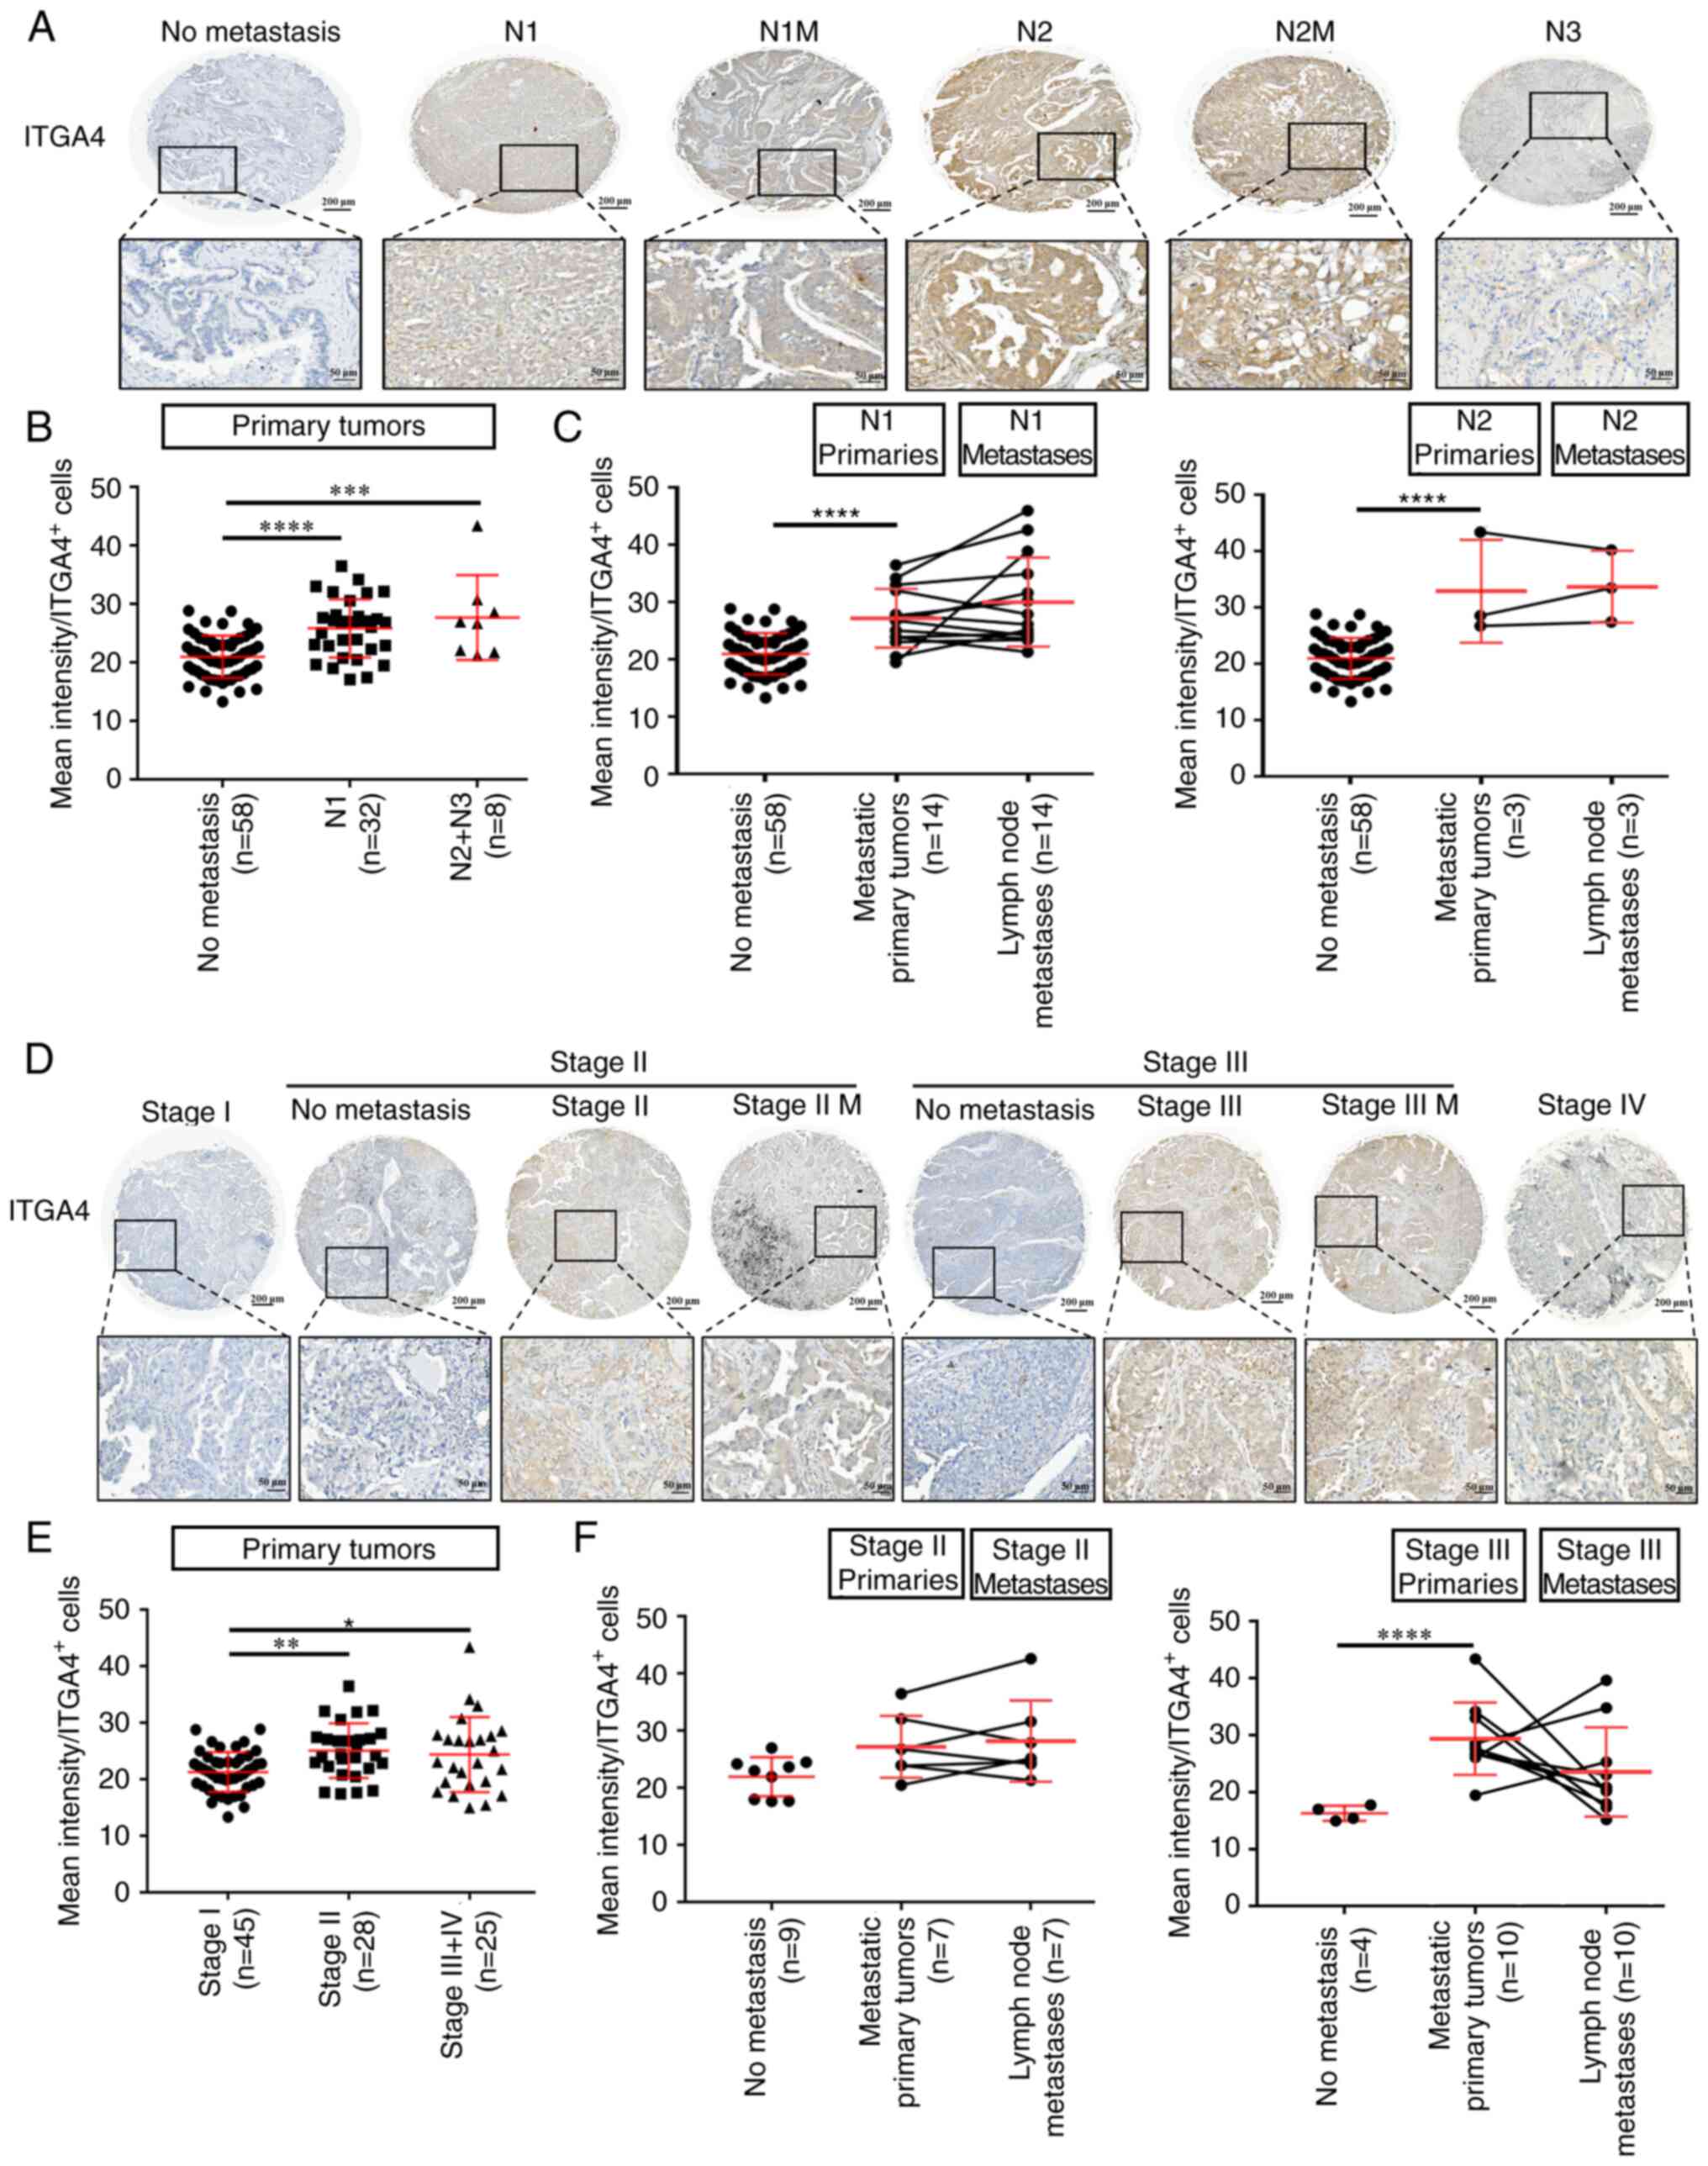 | Figure 7Upregulation of ITGA4 expression is a
signature of primary tumors with metastatic potential. (A)
Representative images of ITGA4 expression in lung cancer for
different nodal statuses. (B) ITGA4 expression was calculated as
the mean intensity of staining per ITGA4-positive cells, and
analyzed by one-way ANOVA with Tukey's multiple comparisons test.
(C) ITGA4 expression at the primary site of N1 or N2 tumors
compared with their corresponding lymph node metastases, as
analyzed by two-way mixed ANOVA with the Bonferroni method for post
hoc pairwise comparisons. (D) Representative images of ITGA4
expression in lung cancer at different stages. (E) ITGA4 expression
in primary tumors at different cancer stages as analyzed by one-way
ANOVA with Tukey's multiple comparisons test. (F) ITGA4 expression
at the primary site of stage II or III tumors compared with their
corresponding lymph node metastases, as analyzed by two-way mixed
ANOVA with the Bonferroni method for post hoc pairwise comparisons.
Magnification, x200. Upper scale bar, 200 µm; lower scale
bar, 50 µm. *P<0.05, **P<0.01,
***P<0.001 and ****P<0.0001. ITGA4,
integrin subunit α-4; M, matched lymph node metastatic site of the
same tumor; N, nodal status. |
Discussion
An acidic microenvironment presents continuous
stress to cells, which respond through adaptation and evolution to
achieve dynamic fitness for their survival. As cancer cells are
intrinsically prone to genetic changes, long-term acidosis may
further promote their pace of evolution, driving the selection for
tumor cells with enhanced survival capabilities (45,46). Nevertheless, a systematic analysis
of the role of acidosis in cancer progression has been hampered by
difficulties, including long experimental time periods, marked
individual variabilities and scarcity of in vivo probes.
Recently, MRI chemical exchange saturation transfer combined with
positron emission tomography imaging was used to demonstrate the
contribution of acidosis to the metastatic potential of breast
cancer cell lines in an animal model (47). In the present study, a metastatic
colonization model was established to investigate the effect of
long-term acidosis on lung cancer cells. The results indicated that
acidosis facilitated the colonization step of metastasis by
conferring a growth advantage to the tumor mass, leading to higher
tumor incidence rates. Transcriptomics analysis of acidotic cells
revealed an extensive reorganization of the ECM, featuring
upregulation of the ECM organization gene ITGA4. Acidotic
tumors exhibited prominent vasculogenic mimicry structures at
ITGA4-rich regions, while the acidotic cells also displayed an
improved vasculogenic mimicry ability in vitro, suggesting a
role of the ITGA4 protein in the facilitation of nutrient supply in
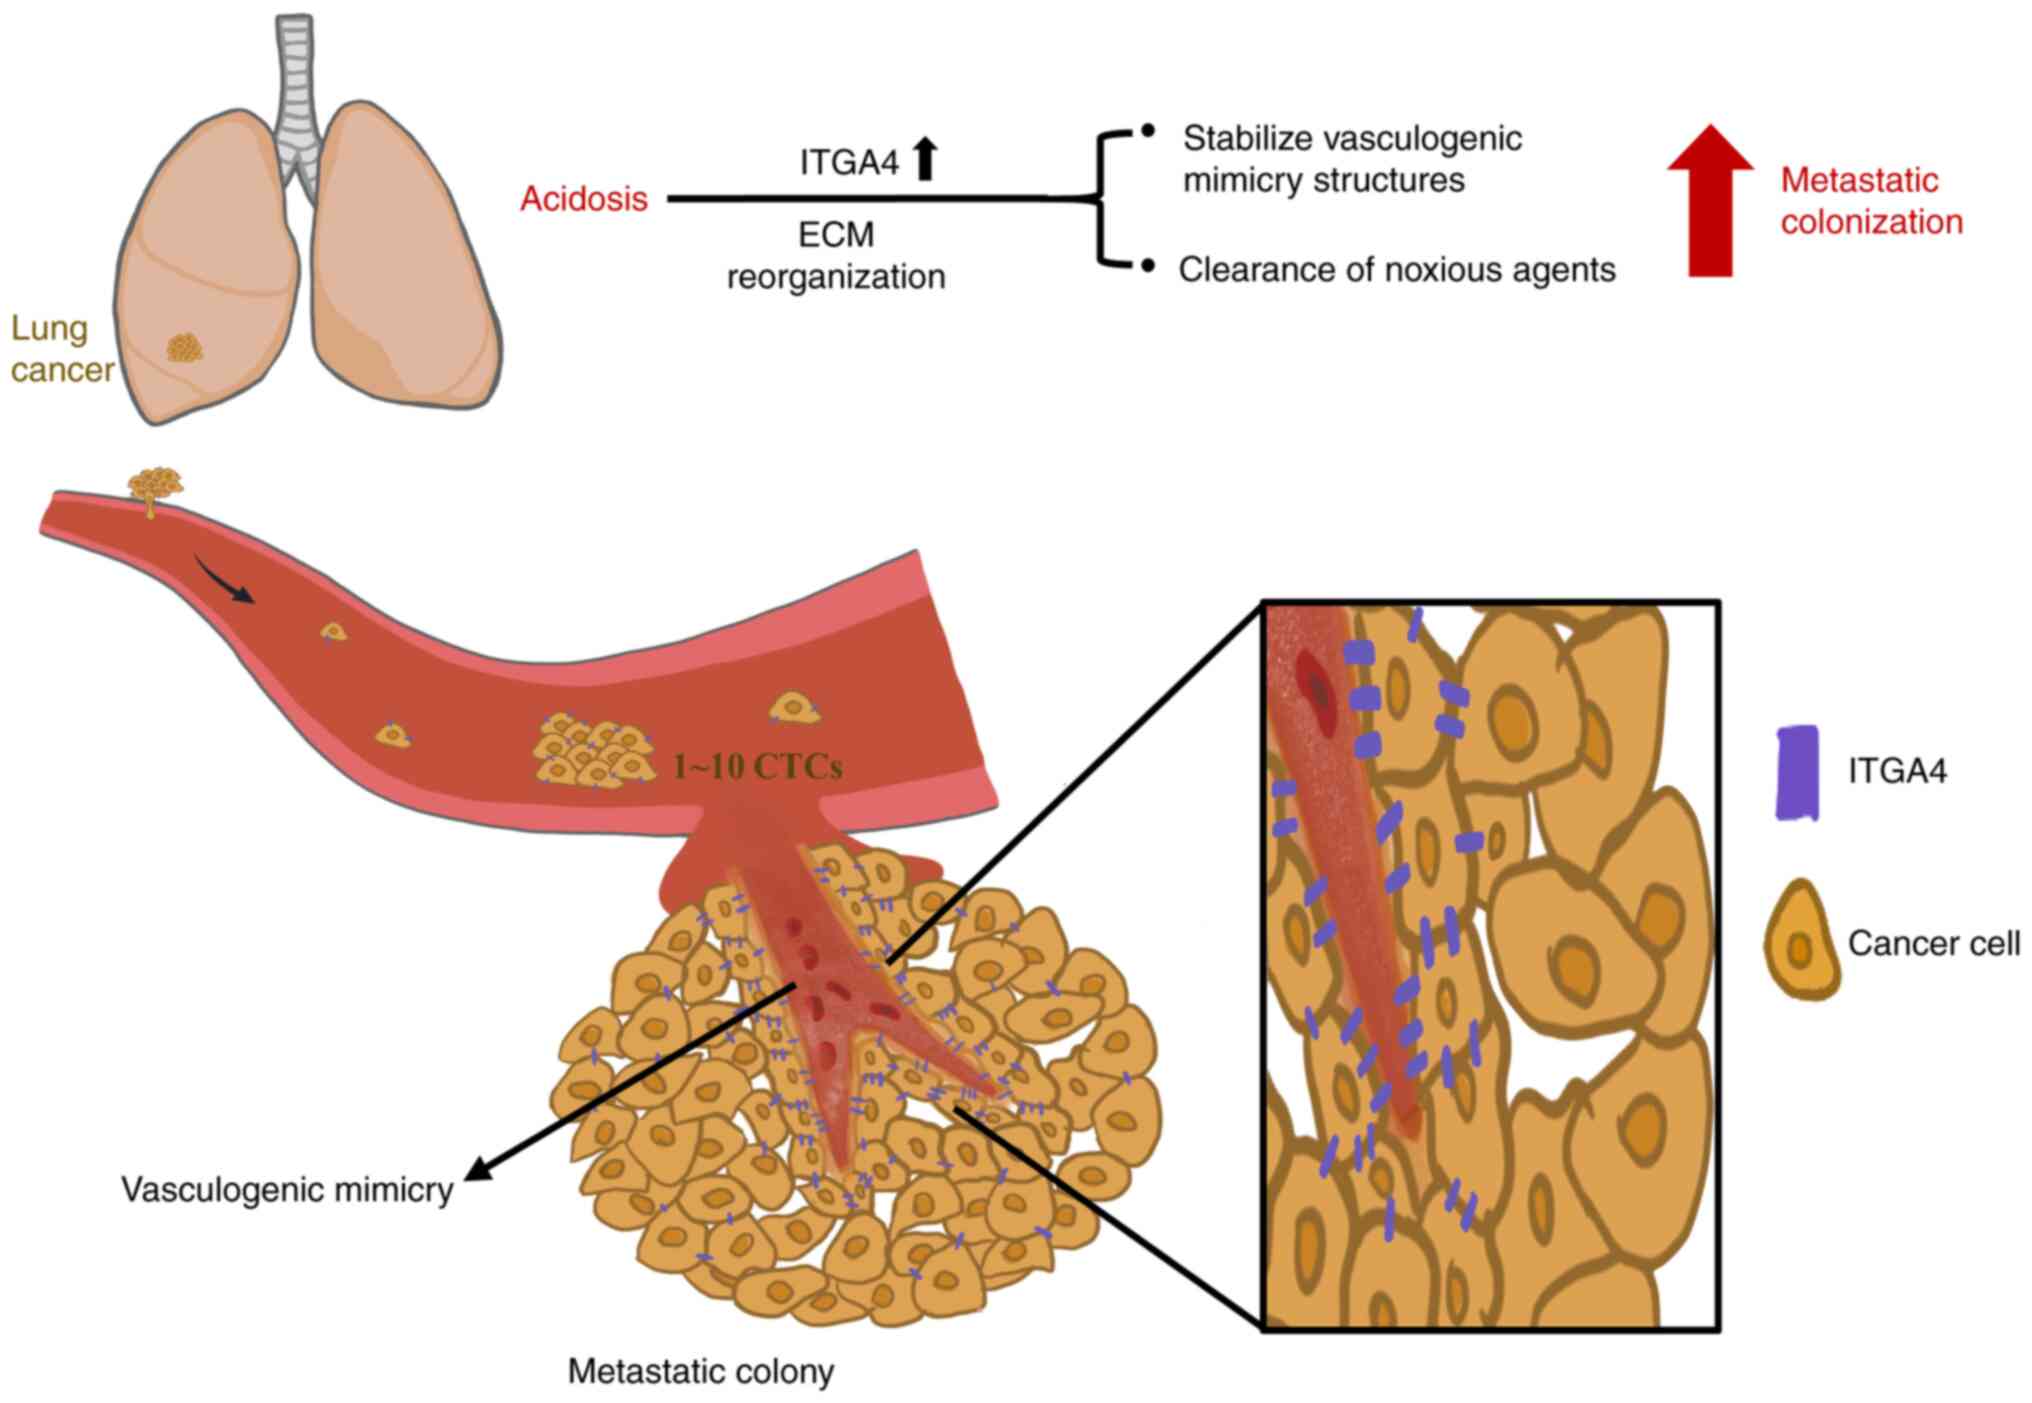
the growing tumor mass. In summary, the present study provided
evidence that acidosis promoted the establishment of CTCs as new
metastatic colonies after extravasation via remodeling of the ECM
and vasculogenic mimicry (Fig.
8). The present study also demonstrated that upregulation of
ITGA4 expression occurred in both tumor and adjacent normal
tissues, indicating that acidosis affects not only the tumor, but
also induces changes in the surrounding tissues.
In the present experimental animal model, the
initial events of metastatic colonization at distant organs were
simulated by the subcutaneous implantation of exactly 10 tumor
cells or only 1 tumor cell, reflective of the number of CTCs in the
pulmonary vein of patients with NSCLC (37). This technique is derived from the
tumor incidence stemness assay in our previous study (26), with improvements to tightly
control the exact number and physical conditions of the inoculated
cells. As the number of cells implanted was low, tumors did not
develop in all mice (Fig. S3)
(26), and no further metastasis
or internal tumors were observed in the experimental time span (42
days post-inoculation). Three individual experiments were conducted
using the same procedures, with a gradual increase in the number of
animals used each time based on the gained experience. This
approach was taken to cope with the expected low incidence of tumor
formation and taking ethical considerations into account, while
still obtaining robust and reproducible findings. Notably, the
inoculation of paired tumors at both flanks of the same mouse
allowed comparisons of tumor development free of individual
differences, which revealed a growth advantage of the acidotic
cells, despite the divergent measurements observed among different
experimental animals. No medium/buffer/vector control group was
needed in this experimental design as the test group pH 6.6 cells
were compared with the control group pH 7.4 cells. We hypothesized
that this novel animal model can emulate the scenario of metastatic
colonization, thus offering a study model that complements other
metastasis tumor models currently in use, including spontaneous
metastasis (48), tail vein
injection (49) and genetically
engineered mouse models (50).
Our previous study reported the strong positive
association between the ECM component fibronectin and the
metastatic potential of lung cancer cells (51). Fibronectin is an integrin α4β1
ligand (52), and the present
study also revealed that the fibronectin-interacting genes
FBN1 and FBN2 (53)
were upregulated in acidotic cells. Furthermore, the whole
transcriptome dataset suggested that the change of ECM composition
is an extensive and coordinated event, involving other
extracellular components, such as collagen type XIV α-1 chain and
collagen type XII α1 chain. The individual contribution of these
genes in terms of acidosis-induced ECM remodeling and vasculogenic
mimicry requires further investigation. Our preliminary results
regarding ectopic overexpression of full-length ITGA4 cDNA have
revealed that the sole manipulation of ITGA4 gene expression
was not sufficient to recapitulate the complete phenotype elicited
by long-term acidosis (data not shown). Perturbations of cell
adhesion and proliferation also made it difficult to evaluate the
effects of altering ITGA4 levels compared with the mock
transfection control. Similarly, in melanoma cells (54), it has been reported that
overexpression of ITGA4 induces homotypic adhesion of the cells in
the form of integrin α4β1 interaction. These observations also
highlight the pleiotropic and longitudinal nature of long-term
acidosis, and that its final effects on cancer progression are an
integrated outcome involving multiple players/steps over time,
which cannot be recapitulated by the transient manipulation of
ITGA4 expression alone.
ITGA4 encodes for a member of the integrin α
family (39), which forms a
heterodimeric transmembrane protein with either the β1 or the β7
subunit to function in cell adhesion and expansion. The present
study revealed that both the mRNA and protein expression levels of
ITGA4 were increased in long-term acidotic cells, with accentuated
localization of ITGA4 around the vascular mimicry structures of the
tumors. It has been reported that upregulation of ITGA4 is
associated with poor prognosis of numerous types of tumors
(42-44,55). ITGA4 has also been implicated in
the activation of the Hedgehog signaling pathway, enhancing cancer
cell stemness and tumorigenicity, and stabilizing cell clusters
(56). The present study
corroborates the findings of these studies, by demonstrating the
increase in tumor incidence, chemoresistance properties and
vasculogenic mimicry after long-tern acidosis, which favors the
establishment of secondary tumors.
Integrin α4β1 and the hyaluronan ligand CD44 have
been reported to synergize in enhancing ABC transporter
functionality, thereby promoting tumor chemoresistance (57) and providing protection against
noxious agents through limiting their entry into cells (58). The pH 6.6 cells exhibited an
~2-fold increase in the proportion of the side population cells,
indicating the involvement of ABC transporter activity. However,
our transcriptome analysis indicated no transcriptional
upregulation of any of the ABC transporter family genes (data not
shown), suggesting that this side population functionality may
involve post-transcriptional regulation, as has been reported in
human hematopoietic progenitor cells, in which the integrin
α4β1/CD44 axis controls side population/drug efflux functionality
(57). Although an increase in
the proportion of side population cells is a hallmark for the
stemness properties of cancer cells (59), the expression levels of the
stemness-associated transcription factors Nanog and Oct4 were not
found to be increased in the pH 6.6 cells. Taken together, these
results suggested that acidotic cells possess a superior ability to
achieve clearance of noxious agents via the ABC transporters, thus
promoting the survival of metastatic colonies in the new
environment. However, acidosis per se may be insufficient to
promote the expression of stemness-associated transcription factors
Nanog and Oct4 in cancer cells.
The benefits of vasculogenic mimicry in rapidly
establishing nutrient supply for the development of metastasis have
been described in numerous tumor types, including melanoma
(60), head and neck cancer
(61), lung cancer (62-64) and colorectal cancer (65). The finding that ITGA4 expression
was elevated in the proximity of vasculogenic mimicry structures of
the acidosis colonies was in accordance with previous studies
demonstrating that integrins are associated with the formation of
vasculogenic mimicry (66,67).
The present study demonstrated that acidosis enhanced the formation
of vasculogenic mimicry networks, which together with the
capability to expel noxious agents through ABC transporter
activity, could support the survival and expansion of the
metastatic colony in new environments. These results suggest a role
for acidosis as an intricate factor of cancer progression and shed
light on the key molecular role of ITGA4, which may aid the
development of therapeutic interventions with the aim of deterring
lung tumor metastasis.
Supplementary Data
Availability of data and materials
The transcriptome analysis datasets generated and/or
analyzed during the current study are available in the GEO
repository, https://www.ncbi.nlm.nih.gov/geo/query/acc.cgi?acc=GSE200546.
All other datasets used and/or analyzed during the current study
are available from the corresponding author on reasonable
request.
Authors' contributions
WYS contributed to conceptualization of the study,
experimentation, methodology, software, visualization, data
acquisition, analysis, curation and writing (original draft
preparation). PHC performed the experiments. MYPK contributed to
the conceptualization of the study and provided resources. HWC
contributed to the conceptualization of the study, provided
resources and obtained funding. MTL, XJS and YLH performed data
curation, data acquisition and analysis. HYEC contributed to
project administration, conceptualization of the study,
methodology, funding acquisition, writing, reviewing and editing of
the manuscript, and supervision. WYS and HYEC confirmed the
authenticity of all the raw data. All authors have read and
approved the final manuscript.
Ethics approval and consent to
participate
All animal protocols were reviewed and approved by
the National Taiwan University College of Medicine Institutional
Animal Care and Use Committee (approval no. 20170550; Taipei,
Taiwan). Usage of human lung cancer tissue microarray slides
(LC10014a, LC10013c and LC814a) was approved by National Taiwan
University Hospital Research Ethics Committee (approval no.
202201055RIND; Taipei, Taiwan). Human CLS1 cells were isolated from
an 87-year-old male patient after the patient provided written
informed consent, which was approved by the National Taiwan
University Hospital Research Ethics Committee (approval no. NTUH
IRB201103028RC; Taipei, Taiwan).
Patient consent for publication
Not applicable.
Competing interests
The authors declare that they have no competing
interests.
Abbreviations:
|
ECM
|
extracellular matrix, CTCs,
circulating tumor cells
|
|
ITGA4
|
integrin subunit α-4
|
|
GO
|
Gene Ontology
|
|
PPI
|
protein-protein interaction
|
|
KEGG
|
Kyoto Encyclopedia of Genes and
Genomes
|
|
PAS
|
periodic acid-Schiff
|
|
BP
|
biological process
|
|
CC
|
cellular component
|
|
MF
|
molecular function
|
Acknowledgments
Not applicable.
Funding
The present study was supported by the grants MOST
107-2314-B-002-197-MY3, MOST106-2314-B-002-140,
MOST103-2221-E-002-107-MY3 and MOST 102-2321-B-002-024 from the
Ministry of Science and Technology, Taiwan.
References
|
1
|
Pascale RM, Calvisi DF, Simile MM, Feo CF
and Feo F: The Warburg effect 97 years after its discovery. Cancers
(Basel). 12:28192020.
|
|
2
|
Pillai SR, Damaghi M, Marunaka Y, Spugnini
EP, Fais S and Gillies RJ: Causes, consequences, and therapy of
tumors acidosis. Cancer Metastasis Rev. 38:205–222. 2019.
|
|
3
|
Faubert B, Li KY, Cai L, Hensley CT, Kim
J, Zacharias LG, Yang C, Do QN, Doucette S, Burguete D, et al:
Lactate metabolism in human lung tumors. Cell. 171:358–371.e9.
2017.
|
|
4
|
Kennedy KM, Scarbrough PM, Ribeiro A,
Richardson R, Yuan H, Sonveaux P, Landon CD, Chi JT, Pizzo S,
Schroeder T and Dewhirst MW: Catabolism of exogenous lactate
reveals it as a legitimate metabolic substrate in breast cancer.
PLoS One. 8:e751542013.
|
|
5
|
Damaghi M, West J, Robertson-Tessi M, Xu
L, Ferrall-Fairbanks MC, Stewart PA, Persi E, Fridley BL, Altrock
PM, Gatenby RA, et al: The harsh microenvironment in early breast
cancer selects for a Warburg phenotype. Proc Natl Acad Sci USA.
118:e20113421182021.
|
|
6
|
Brizel DM, Schroeder T, Scher RL, Walenta
S, Clough RW, Dewhirst MW and Mueller-Klieser W: Elevated tumor
lactate concentrations predict for an increased risk of metastases
in head-and-neck cancer. Int J Radiat Oncol Biol Phys. 51:349–353.
2001.
|
|
7
|
Walenta S, Wetterling M, Lehrke M,
Schwickert G, Sundfør K, Rofstad EK and Mueller-Klieser W: High
lactate levels predict likelihood of metastases, tumor recurrence,
and restricted patient survival in human cervical cancers. Cancer
Res. 60:916–921. 2000.
|
|
8
|
Lora-Michiels M, Yu D, Sanders L, Poulson
JM, Azuma C, Case B, Vujaskovic Z, Thrall DE, Charles HC and
Dewhirst MW: Extracellular pH and P-31 magnetic resonance
spectroscopic variables are related to outcome in canine soft
tissue sarcomas treated with thermoradiotherapy. Clin Cancer Res.
12:5733–5740. 2006.
|
|
9
|
Meyer KA, Kammerling EM, et al: pH studies
of malignant tissues in human beings. Cancer Res. 8:513–518.
1948.
|
|
10
|
Persi E, Duran-Frigola M, Damaghi M, Roush
WR, Aloy P, Cleveland JL, Gillies RJ and Ruppin E: Systems analysis
of intracellular pH vulnerabilities for cancer therapy. Nat Commun.
9:29972018.
|
|
11
|
Vlachostergios PJ, Oikonomou KG, Gibilaro
E and Apergis G: Elevated lactic acid is a negative prognostic
factor in metastatic lung cancer. Cancer Biomark. 15:725–734.
2015.
|
|
12
|
Schoonjans CA, Joudiou N, Brusa D, Corbet
C, Feron O and Gallez B: Acidosis-induced metabolic reprogramming
in tumor cells enhances the anti-proliferative activity of the PDK
inhibitor dichloroacetate. Cancer Lett. 470:18–28. 2020.
|
|
13
|
Ning WR, Jiang D, Liu XC, Huang YF, Peng
ZP, Jiang ZZ, Kang T, Zhuang SM, Wu Y and Zheng L: Carbonic
anhydrase XII mediates the survival and prometastatic functions of
macrophages in human hepatocellular carcinoma. J Clin Invest.
132:e1531102022.
|
|
14
|
Desquiret-Dumas V, Leman G, Wetterwald C,
Chupin S, Lebert A, Khiati S, Le Mao M, Geffroy G, Kane MS,
Chevrollier A, et al: Warburg-like effect is a hallmark of complex
I assembly defects. Biochim Biophys Acta Mol Basis Dis.
1865:2475–2489. 2019.
|
|
15
|
Boedtkjer E and Pedersen SF: The acidic
tumor microenvironment as a driver of cancer. Annu Rev Physiol.
82:103–126. 2020.
|
|
16
|
Moellering RE, Black KC, Krishnamurty C,
Baggett BK, Stafford P, Rain M, Gatenby RA and Gillies RJ: Acid
treatment of melanoma cells selects for invasive phenotypes. Clin
Exp Metastasis. 25:411–425. 2008.
|
|
17
|
Damaghi M, Tafreshi NK, Lloyd MC, Sprung
R, Estrella V, Wojtkowiak JW, Morse DL, Koomen JM, Bui MM, Gatenby
RA and Gillies RJ: Chronic acidosis in the tumour microenvironment
selects for overexpression of LAMP2 in the plasma membrane. Nat
Commun. 6:87522015.
|
|
18
|
Ibrahim-Hashim A and Estrella V: Acidosis
and cancer: From mechanism to neutralization. Cancer Metastasis
Rev. 38:149–155. 2019.
|
|
19
|
Harguindey S, Alfarouk K, Polo Orozco J,
Fais S and Devesa J: Towards an integral therapeutic protocol for
breast cancer based upon the new H+-centered anticancer
paradigm of the late post-Warburg era. Int J Mol Sci.
21:74752020.
|
|
20
|
de la Cruz-López KG, Castro-Muñoz LJ,
Reyes-Hernández DO, García-Carrancá A and Manzo-Merino J: Lactate
in the regulation of tumor microenvironment and therapeutic
approaches. Front Oncol. 9:11432019.
|
|
21
|
Massagué J and Obenauf AC: Metastatic
colonization by circulating tumour cells. Nature. 529:298–306.
2016.
|
|
22
|
Amintas S, Bedel A, Moreau-Gaudry F,
Boutin J, Buscail L, Merlio JP, Vendrely V, Dabernat S and Buscail
E: Circulating tumor cell clusters: United we stand divided we
fall. Int J Mol Sci. 21:26532020.
|
|
23
|
Chrabaszcz K, Jasztal A, Smęda M,
Zieliński B, Blat A, Diem M, Chlopicki S, Malek K and Marzec KM:
Label-free FTIR spectroscopy detects and visualizes the early stage
of pulmonary micrometastasis seeded from breast carcinoma. Biochim
Biophys Acta Mol Basis Dis. 1864:3574–3584. 2018.
|
|
24
|
Gómez-Cuadrado L, Tracey N, Ma R, Qian B
and Brunton VG: Mouse models of metastasis: Progress and prospects.
Dis Model Mech. 10:1061–1074. 2017.
|
|
25
|
Estrella V, Chen T, Lloyd M, Wojtkowiak J,
Cornnell HH, Ibrahim-Hashim A, Bailey K, Balagurunathan Y, Rothberg
JM, Sloane BF, et al: Acidity generated by the tumor
microenvironment drives local invasion. Cancer Res. 73:1524–1535.
2013.
|
|
26
|
Chen WJ, Ho CC, Chang YL, Chen HY, Lin CA,
Ling TY, Yu SL, Yuan SS, Chen YJ, Lin CY, et al: Cancer-associated
fibroblasts regulate the plasticity of lung cancer stemness via
paracrine signalling. Nat Commun. 5:34722014.
|
|
27
|
Peppicelli S, Bianchini F, Torre E and
Calorini L: Contribution of acidic melanoma cells undergoing
epithelial-to-mesenchymal transition to aggressiveness of
non-acidic melanoma cells. Clin Exp Metastasis. 31:423–433.
2014.
|
|
28
|
Chen S, Zhou Y, Chen Y and Gu J: Fastp: An
ultra-fast all-in-one FASTQ preprocessor. Bioinformatics.
34:i884–i890. 2018.
|
|
29
|
Liao Y, Smyth GK and Shi W: FeatureCounts:
An efficient general purpose program for assigning sequence reads
to genomic features. Bioinformatics. 30:923–930. 2014.
|
|
30
|
Love MI, Huber W and Anders S: Moderated
estimation of fold change and dispersion for RNA-seq data with
DESeq2. Genome Biol. 15:5502014.
|
|
31
|
Robinson MD, McCarthy DJ and Smyth GK:
edgeR: A bioconductor package for differential expression analysis
of digital gene expression data. Bioinformatics. 26:139–140.
2010.
|
|
32
|
Bu D, Luo H, Huo P, Wang Z, Zhang S, He Z,
Wu Y, Zhao L, Liu J, Guo J, et al: KOBAS-i: Intelligent
prioritization and exploratory visualization of biological
functions for gene enrichment analysis. Nucleic Acids Res. 49(W1):
W317–W325. 2021.
|
|
33
|
Ruzzolini J, Peppicelli S, Andreucci E,
Bianchini F, Margheri F, Laurenzana A, Fibbi G, Pimpinelli N and
Calorini L: Everolimus selectively targets vemurafenib resistant
BRAFV600E melanoma cells adapted to low pH. Cancer Lett.
408:43–54. 2017.
|
|
34
|
Su T, Huang S, Zhang Y, Guo Y, Zhang S,
Guan J, Meng M, Liu L, Wang C, Yu D, et al: miR-7/TGF-β2 axis
sustains acidic tumor microenvironment-induced lung cancer
metastasis. Acta Pharm Sin B. 12:821–837. 2022.
|
|
35
|
Andreucci E, Peppicelli S, Ruzzolini J,
Bianchini F, Biagioni A, Papucci L, Magnelli L, Mazzanti B, Stecca
B and Calorini L: The acidic tumor microenvironment drives a
stem-like phenotype in melanoma cells. J Mol Med (Berl).
98:1431–1446. 2020.
|
|
36
|
Choodetwattana P, Proungvitaya S,
Jearanaikoon P and Limpaiboon T: The upregulation of OCT4 in acidic
extracellular pH is associated with gemcitabine resistance in
cholangiocarcinoma cell lines. Asian Pac J Cancer Prev.
20:2745–2748. 2019.
|
|
37
|
Murlidhar V, Reddy RM, Fouladdel S, Zhao
L, Ishikawa MK, Grabauskiene S, Zhang Z, Lin J, Chang AC, Carrott
P, et al: Poor prognosis indicated by venous circulating tumor cell
clusters in early-stage lung cancers. Cancer Res. 77:5194–5206.
2017.
|
|
38
|
Edgar R, Domrachev M and Lash AE: Gene
expression omnibus: NCBI gene expression and hybridization array
data repository. Nucleic Acids Res. 30:207–210. 2002.
|
|
39
|
Hynes RO: Integrins: Bidirectional,
allosteric signaling machines. Cell. 110:673–687. 2002.
|
|
40
|
Cardones AR, Murakami T and Hwang ST:
CXCR4 enhances adhesion of B16 tumor cells to endothelial cells in
vitro and in vivo via beta(1) integrin. Cancer Res. 63:6751–6757.
2003.
|
|
41
|
Wagenblast E, Soto M, Gutiérrez-Ángel S,
Hartl CA, Gable AL, Maceli AR, Erard N, Williams AM, Kim SY,
Dickopf S, et al: A model of breast cancer heterogeneity reveals
vascular mimicry as a driver of metastasis. Nature. 520:358–362.
2015.
|
|
42
|
Young SA, McCabe KE, Bartakova A, Delaney
J, Pizzo DP, Newbury RO, Varner JA, Schlaepfer DD and Stupack DG:
Integrin α4 enhances metastasis and may be associated with poor
prognosis in MYCN-low neuroblastoma. PLoS One. 10:e01208152015.
|
|
43
|
Bulian P, Shanafelt TD, Fegan C, Zucchetto
A, Cro L, Nückel H, Baldini L, Kurtova AV, Ferrajoli A, Burger JA,
et al: CD49d is the strongest flow cytometry-based predictor of
overall survival in chronic lymphocytic leukemia. J Clin Oncol.
32:897–904. 2014.
|
|
44
|
Pulkka OP, Mpindi JP, Tynninen O, Nilsson
B, Kallioniemi O, Sihto H and Joensuu H: Clinical relevance of
integrin alpha 4 in gastrointestinal stromal tumours. J Cell Mol
Med. 22:2220–2230. 2018.
|
|
45
|
Marusyk A, Tabassum DP, Altrock PM,
Almendro V, Michor F and Polyak K: Non-cell-autonomous driving of
tumour growth supports sub-clonal heterogeneity. Nature. 514:54–58.
2014.
|
|
46
|
Michl J, Wang Y, Monterisi S, Blaszczak W,
Beveridge R, Bridges EM, Koth J, Bodmer WF and Swietach P:
CRISPR-Cas9 screen identifies oxidative phosphorylation as
essential for cancer cell survival at low extracellular pH. Cell
Rep. 38:1104932022.
|
|
47
|
Anemone A, Consolino L, Conti L, Irrera P,
Hsu MY, Villano D, Dastrù W, Porporato PE, Cavallo F and Longo DL:
Tumour acidosis evaluated in vivo by MRI-CEST pH imaging reveals
breast cancer metastatic potential. Br J Cancer. 124:207–216.
2021.
|
|
48
|
Munoz R, Man S, Shaked Y, Lee CR, Wong J,
Francia G and Kerbel RS: Highly efficacious nontoxic preclinical
treatment for advanced metastatic breast cancer using combination
oral UFT-cyclophosphamide metronomic chemotherapy. Cancer Res.
66:3386–3391. 2006.
|
|
49
|
Minn AJ, Gupta GP, Siegel PM, Bos PD, Shu
W, Giri DD, Viale A, Olshen AB, Gerald WL and Massagué J: Genes
that mediate breast cancer metastasis to lung. Nature. 436:518–524.
2005.
|
|
50
|
Guy CT, Webster MA, Schaller M, Parsons
TJ, Cardiff RD and Muller WJ: Expression of the neu protooncogene
in the mammary epithelium of transgenic mice induces metastatic
disease. Proc Natl Acad Sci USA. 89:10578–10582. 1992.
|
|
51
|
Yu IF, Yu YH, Chen LY, Fan SK, Chou HYE
and Yang JT: A portable microfluidic device for the rapid diagnosis
of cancer metastatic potential which is programmable for
temperature and CO2. Lab Chip. 14:3621–3628. 2014.
|
|
52
|
Pang X, He X, Qiu Z, Zhang H, Xie R, Liu
Z, Gu Y, Zhao N, Xiang Q and Cui Y: Targeting integrin pathways:
Mechanisms and advances in therapy. Signal Transduct Target Ther.
8:12023.
|
|
53
|
Sabatier L, Chen D, Fagotto-Kaufmann C,
Hubmacher D, McKee MD, Annis DS, Mosher DF and Reinhardt DP:
Fibrillin assembly requires fibronectin. Mol Biol Cell. 20:846–858.
2009.
|
|
54
|
Qian F, Vaux DL and Weissman IL:
Expression of the integrin alpha 4 beta 1 on melanoma cells can
inhibit the invasive stage of metastasis formation. Cell.
77:335–347. 1994.
|
|
55
|
Schlesinger M and Bendas G: Contribution
of very late antigen-4 (VLA-4) integrin to cancer progression and
metastasis. Cancer Metastasis Rev. 34:575–591. 2015.
|
|
56
|
Xie J, Yang P, Lin HP, Li Y, Clementino M,
Fenske W, Yang C, Wang C and Wang Z: Integrin α4 up-regulation
activates the hedgehog pathway to promote arsenic and
benzo[α]pyrene co-exposure-induced cancer stem cell-like property
and tumorigenesis. Cancer Lett. 493:143–155. 2020.
|
|
57
|
Malfuson JV, Boutin L, Clay D, Thépenier
C, Desterke C, Torossian F, Guerton B, Anginot A, de Revel T,
Lataillade JJ and Le Bousse-Kerdilès MC: SP/drug efflux
functionality of hematopoietic progenitors is controlled by
mesenchymal niche through VLA-4/CD44 axis. Leukemia. 28:853–864.
2014.
|
|
58
|
Golebiewska A, Brons NHC, Bjerkvig R and
Niclou SP: Critical appraisal of the side population assay in stem
cell and cancer stem cell research. Cell Stem Cell. 8:136–147.
2011.
|
|
59
|
Wu C and Alman BA: Side population cells
in human cancers. Cancer Lett. 268:1–9. 2008.
|
|
60
|
Maniotis AJ, Folberg R, Hess A, Seftor EA,
Gardner LM, Pe'er J, Trent JM, Meltzer PS and Hendrix MJ: Vascular
channel formation by human melanoma cells in vivo and in vitro:
Vasculogenic mimicry. Am J Pathol. 155:739–752. 1999.
|
|
61
|
Upile T, Jerjes W, Radhi H, Al-Khawalde M,
Kafas P, Nouraei S and Sudhoff H: Vascular mimicry in cultured head
and neck tumour cell lines. Head Neck Oncol. 3:552011.
|
|
62
|
Fu R, Du W, Ding Z, Wang Y, Li Y, Zhu J,
Zeng Y, Zheng Y, Liu Z and Huang JA: HIF-1α promoted vasculogenic
mimicry formation in lung adenocarcinoma through NRP1 upregulation
in the hypoxic tumor microenvironment. Cell Death Dis.
12:3942021.
|
|
63
|
He X, You J, Ding H, Zhang Z, Cui L, Shen
X, Bian X, Liu Y and Chen J: Vasculogenic mimicry, a negative
indicator for progression free survival of lung adenocarcinoma
irrespective of first line treatment and epithelial growth factor
receptor mutation status. BMC Cancer. 21:1322021.
|
|
64
|
Williamson SC, Metcalf RL, Trapani F,
Mohan S, Antonello J, Abbott B, Leong HS, Chester CP, Simms N,
Polanski R, et al: Vasculogenic mimicry in small cell lung cancer.
Nat Commun. 7:133222016.
|
|
65
|
Baeten CIM, Hillen F, Pauwels P, de Bruine
AP and Baeten CGMI: Prognostic role of vasculogenic mimicry in
colorectal cancer. Dis Colon Rectum. 52:2028–2035. 2009.
|
|
66
|
Ruffini F, Graziani G, Levati L, Tentori
L, D'Atri S and Lacal PM: Cilengitide downmodulates invasiveness
and vasculogenic mimicry of neuropilin 1 expressing melanoma cells
through the inhibition of αvβ5 integrin. Int J Cancer.
136:E545–E558. 2015.
|
|
67
|
Vartanian A, Stepanova E, Grigorieva I,
Solomko E, Belkin V, Baryshnikov A and Lichinitser M: Melanoma
vasculogenic mimicry capillary-like structure formation depends on
integrin and calcium signaling. Microcirculation. 18:390–399.
2011.
|