Introduction
The non-invasive imaging of GLUT2-expressing cells,
such as insulin-producing pancreatic islet cells, remains a
challenge (1). INS-1E cells are
currently used as a model of glucose-responsive insulin-producing
cells (2,3). The aims of the present study were to
document the presence of GLUT2 in INS-1E cells by
immunocytochemistry and to explore its possible role in the
concentration- and time-dependent uptake of two novel fluorescent
desnitroso-streptozotocin analogs. For the purpose of comparison,
similar experiments were conducted in human embryonic kidney (HEK)
cells, rat isolated pancreatic islets, rat hepatic cells, rat
exocrine pancreatic cells and BRIN-BD11 cells. In the INS-1E cells
and other GLUT2-expressing cells, the cell fluorescence eventually
reached a level suggesting that the intracellular concentration of
the desnitroso-streptozotocin analogs exceeded, by approximately
one order of magnitude, the extracellular concentration. It is
proposed, therefore, that these fluorescent analogs may be used to
label GLUT2-expressing cells.
Materials and methods
Fluorescent desnitroso-streptozotocin
analogs
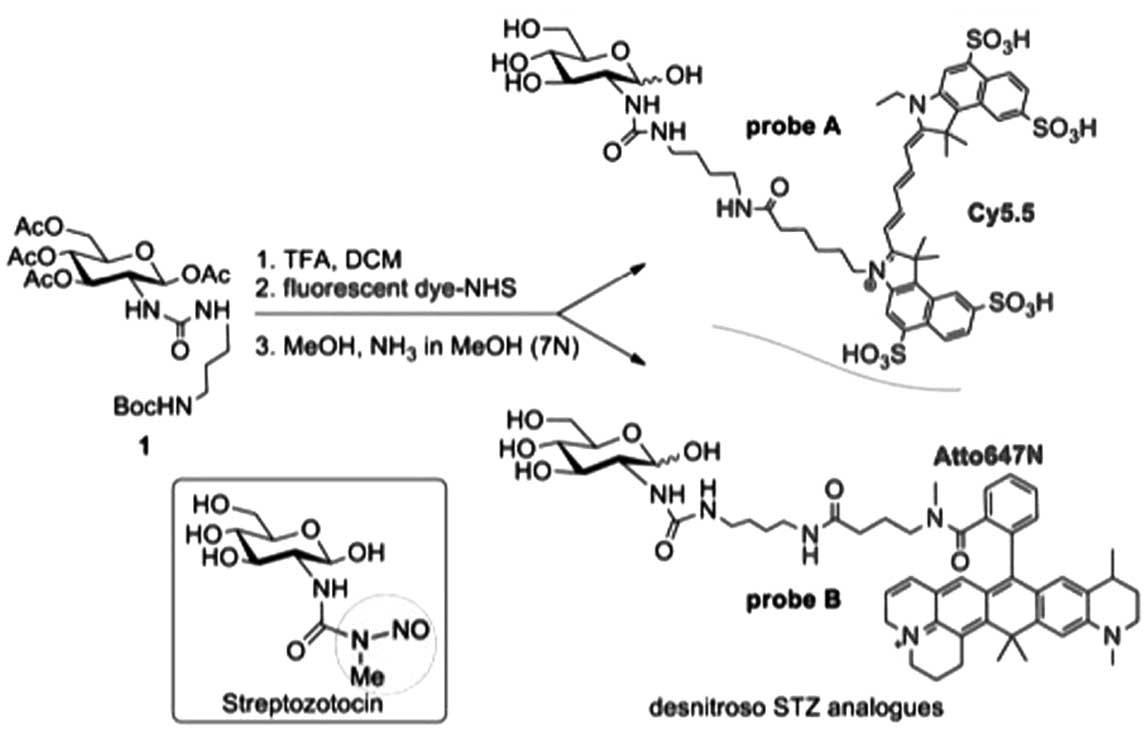
The first probe used in the present study (probe A)
was prepared according to the methods of Ran et al(4), as follows. Trifluoroacetic acid (TFA;
100 μl) was added to a solution of
1,3,4,6-tetra-O-acetyl-2-[3-(4-tert-butoxycarbonylamino-butyl)-ureido]-2-deoxy-glucopyranose
(Compound 1 in Fig. 1; 4.4 mg, 8.0
mmol) in dichloromethane (100 μl) and the resultant mixture was
stirred at room temperature for 2 h. After evaporation of the
solvent and TFA, an oily residue was obtained. Cy5.5-NHS (1.0 mg),
water (100 μl), acetonitrile (100 μl) and triethylamine (10.0 mg)
were added to this residue. The resulting mixture was stirred at
room temperature for 4 h, and this was followed by the addition of
sodium methoxide (108.0 mg) in methanol (100 μl). The resultant
mixture was stirred at room temperature overnight and the solvent
was removed under vacuum to give an oily residue. This residue was
subjected to a reversed-phase flash C18 column to obtain probe A
(Cy5.5; 0.6 mg; 55%); ESI-MS: m/z 1192.9.
The second probe used in the present study (probe B)
was prepared by an adaptation of the method proposed by Ran et
al(4) and based on the ATTO
TEC procedure sheet whereby the dye to sugar ratio was optimized
from 9:1 (dye:sugar) to a ratio of 4:1. TFA (500 μl) was added to a
solution of
1,3,4,6-tetra-O-acetyl-2-[3-(4-tert-butoxycarbonylamino-butyl)-ureido]-2-deoxy-glucopyranose
(Compound 1 in Fig. 1; 29.8 mg,
52.1 mmol) in dichloromethane (500 μl), and the resultant mixture
was stirred at room temperature for 2 h. After evaporation of the
solvent and TFA, an oily residue was obtained. ATTO 647N-NHS (5.0
mg, 5.9 μmol) was dissolved in 1.5 ml DMSO, and triethylamine (80
μl) was added to the residue. The resulting mixture was stirred at
room temperature for 2 h and the solvent was evaporated. The
residue was taken up in water and the organic phase was extracted
twice with dichloromethane. The separated and combined organic
layers were dried by evaporation under a vacuum. Purification was
performed using Biogel chromatography in MeOH to give 4.4 mg (83%)
of a blue solid. Subsequent deacetylation was performed in 2 ml
MeOH and by addition of NH3 in MeOH (100 μl; 7N) and the
mixture was stirred for 12 h. MALDI-TOF MS yielded a 902.9
[M+Na]+ molecular mass (MALDI-TOF MS was by a Bruker
Biflex III, using 2,5-dihydroxybenzoic acid as a matrix).
INS-1E, HEK, BRIN-BD11, hepatic and
pancreatic exocrine cells and isolated pancreatic islets
The insulin-producing INS-1E cells were kindly
provided by Professor C. Wollheim (University Medical Center,
Geneva, Switzerland) and cultured at 37ºC in RPMI-1640 medium
(Invitrogen Life Technologies Europe BV, Gent, Belgium) containing
11.1 mM D-glucose and 2.0 mM L-glutamine, and supplemented with 5%
(v/v) heat-inactivated fetal bovine serum, 1% (v/v) penicillin (100
U/ml)-streptomycin (100 μg/ml), 10.0 mM HEPES, 1.0 mM sodium
pyruvate and 50.0 μM 2-mercaptoethanol, in humidified air
containing 5% CO2. The INS-1E cells were used between
passages 20 and 40.
HEK-293 cells were provided by American Type Culture
Collection (ATCC, Manassas, VA, USA). The HEK cells were incubated
in the ATCC formulated Eagle’s minimum essential medium, to which
fetal bovine serum (final concentration 10%), penicillin (50 IU/ml)
and streptomycin (50 μg/ml) were added.
Rat pancreatic islets were isolated by the
collagenase procedure (5), whilst
rat pancreatic exocrine cells were isolated according to the
procedure proposed by Amsterdam and Jamieson (6). The islets and exocrine cells were
incubated in RPMI-1640 culture medium (Invitrogen Life
Technologies). The study was approved by the Ethic Committee of
Brussels Free university (Brussels, Belgium).
Rat hepatic cells were prepared according to the
method of Berry and Friend (7) and
incubated in DMEM medium (Gibco-BRL, Invitrogen Life Technologies)
containing 10.0 mM D-glucose, L-glutamine, penicillin, streptomycin
and 10% inactivated fetal bovine serum.
BRIN-BD11 cells were kindly provided by Professor A.
Herchuelz (Laboratory of Pharmacology, Brussels Free University,
Brussels, Belgium) and cultured as described elsewhere (8).
Immunohistochemistry
INS-1E cells were plated on 13 mm glass coverslips,
placed into 12-well plates and left to adhere and proliferate for 4
days in RPMI GlutaMAX™ medium (Gibco-BRL, Invitrogen) supplemented
with 1 mM sodium pyruvate (Gibco-BRL), penicillin-streptomycin (100
U/ml and 100 μg/ml, Gibco-BRL), 50 μM β-mercaptoethanol and 10%
FBS. Prior to staining, cells were washed with PBS, then fixed in
4% PAF (v/v) for 15 min and washed several times with TBS and
TBS-Triton 0.3% (v/v). Coverslips were covered with 10% normal goat
serum for 1 h at room temperature, followed by incubation with
rabbit anti-GLUT2 antibody (Santa Cruz Biotechnology, Inc., Santa
Cruz, CA, USA; sc-9117; dilution 1:100), overnight at 4ºC. The
secondary antibody was a goat anti-rabbit conjugated to Alexa594
(Invitrogen; dilution 1:100). The nuclei were counterstained with
DAPI. Coverslips were examined using the Axioplan microscope (Carl
Zeiss, Göttingen, Germany) connected to a video camera and a
complementary acquisition system.
Uptake of fluorescent
desnitroso-streptozotocin analogs
In order to assess the uptake of probes A and B,
groups of ~70×103 cells or 15 rat isolated pancreatic
islets were incubated for 15 min or more, up to 24 h, in 0.1 ml of
incubation medium. After incubation, the extracellular medium was
removed and after two washes, the fluorescence of the cells (or
islets) was measured using a Glomax Multi Detection instrument
(Promega, Leiden, The Netherlands). The results of these
measurements were expressed in arbitrary units.
The reference fluorescence values measured at
increasing concentrations (0.15, 0.3, 0.6 and 1.2 μM) of probe A or
B, and expressed in arbitrary units, yielded a positive correlation
(P<0.03 or less) with the latter concentrations. In two
experiments conducted in the 0.15–1.2 or 0.3–2.0 μM range, the A/B
ratios found at increasing concentrations averaged 55.1±6.6% (n=8).
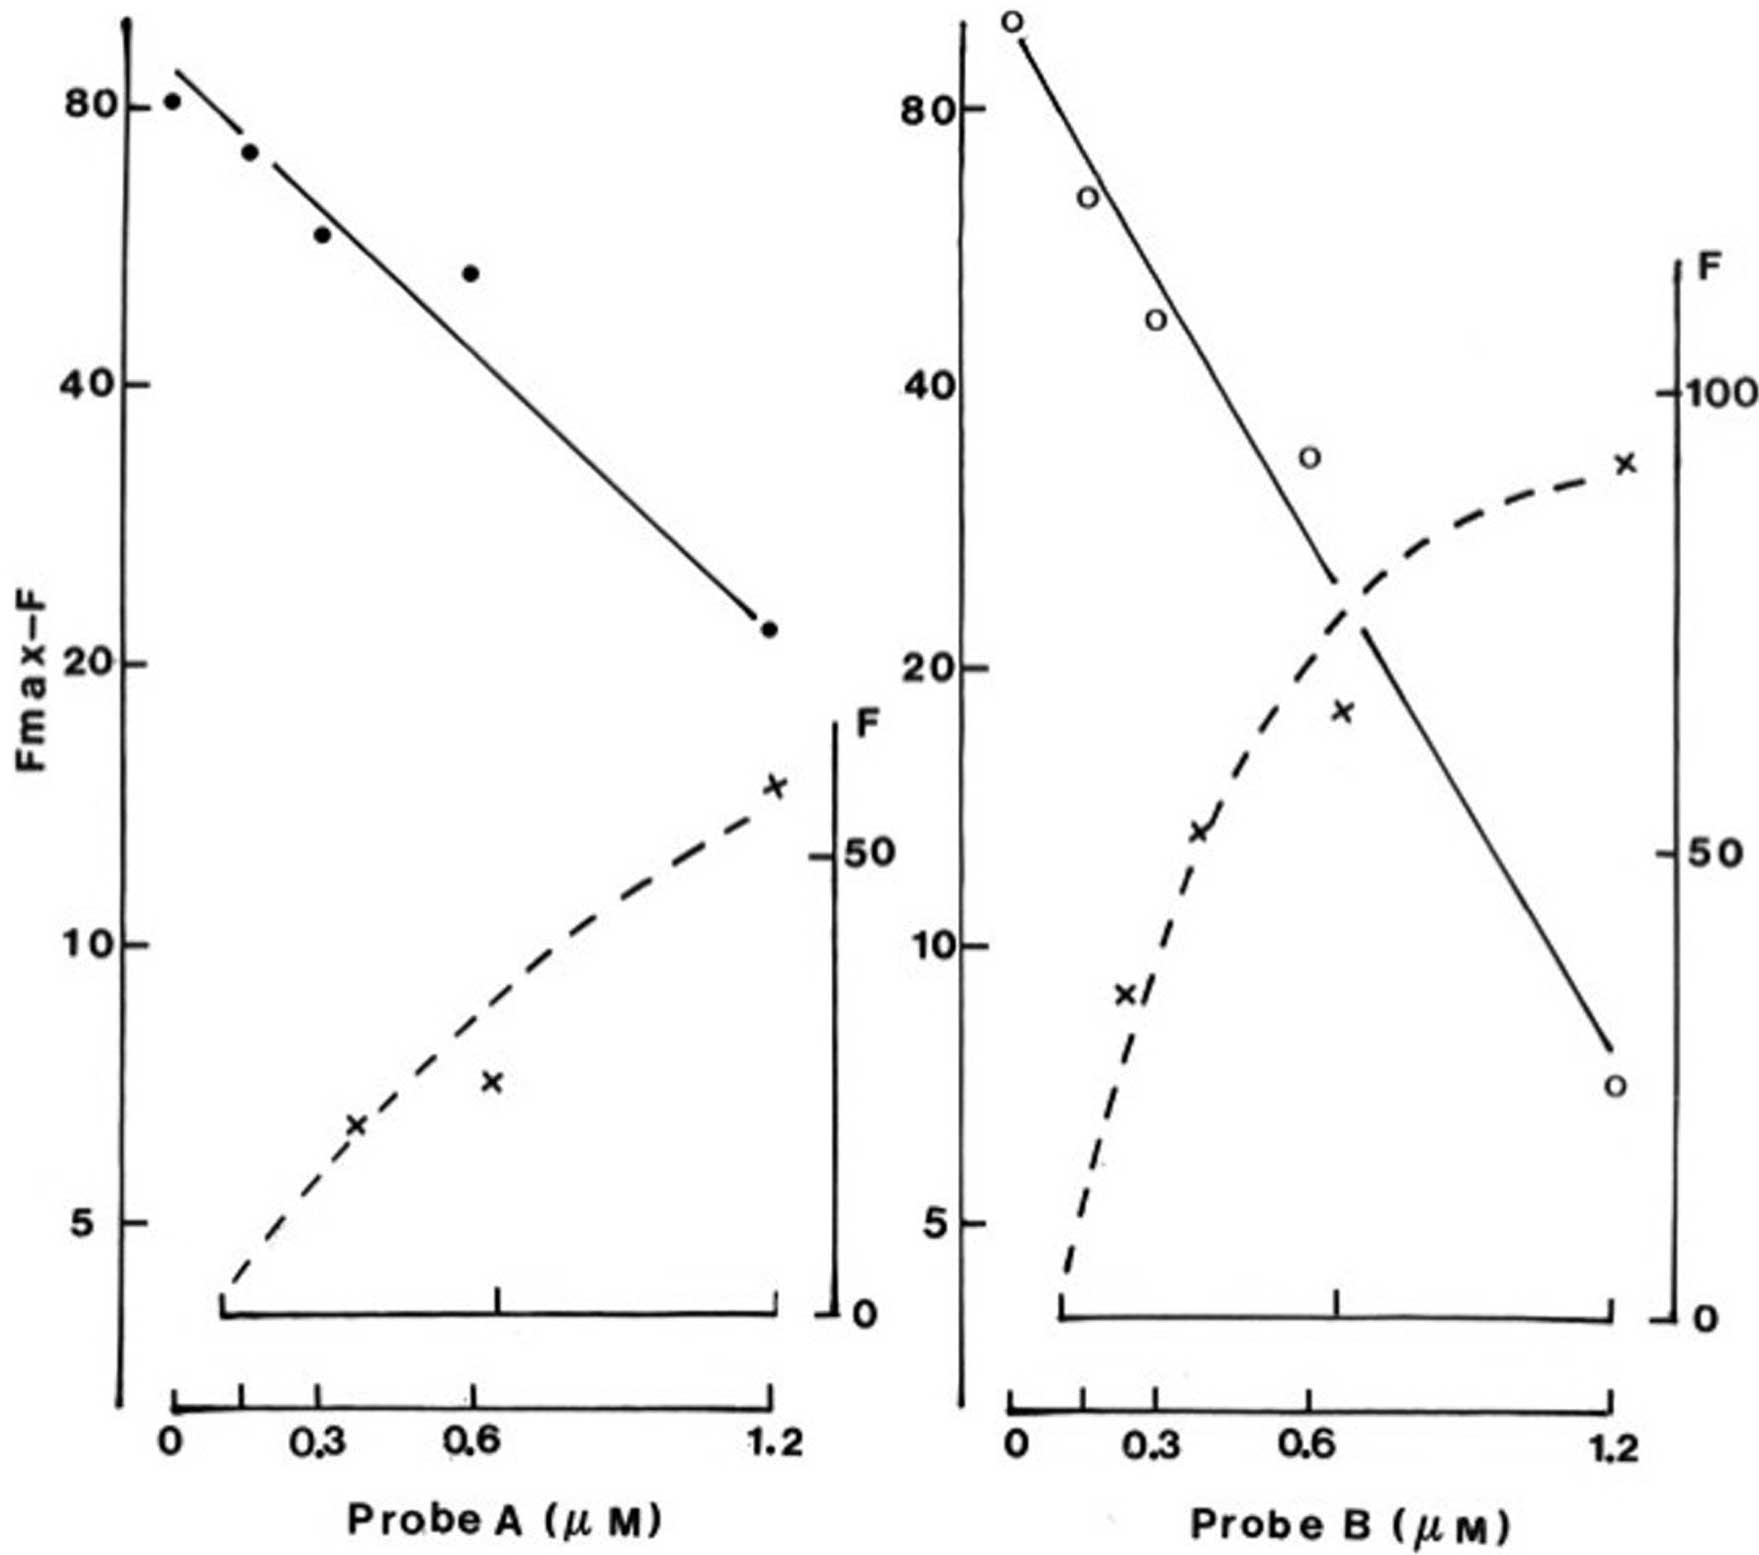
At increasing concentrations of each probe, the fluorescent
measurements were not strictly proportional to the concentration of
the probe (Fig. 2). For instance,
the measurements recorded at the lowest concentration of the probes
represented 25.2±4.5% (n=4) of the corresponding value found within
the same experiment and with the same probe at a 6–7 times higher
concentration, distinct (P<0.05) from the theoretical value of
13.8±0.7% (n=4) based on the assumption of a rule of
proportionality.
Fluorescence imaging
Cells (or isolated pancreatic islets) were seeded on
96-well cell culture plates (Greiner Bio-One, Alphen aan den Rijn,
The Netherlands). After incubation, the probe-containing medium was
removed and the plates were washed twice.
The fluorescence imaging of labeled cells was
achieved using an Axiovert 200m microscope (Carl Zeiss NV-SA) and a
TexaRed filter.
D-glucose phosphorylation in INS-1E cell
homogenates
Groups of 2×10⁶ INS-1E cells were
sonicated three times for 10 sec in 1.0 ml of an iced Hepes-NaOH
buffer (75.0 mM, pH 7.4) containing 150.0 mM KCl, 15.0 mM
KH2PO4, 16.5 mM MgCl2 and 1.5 mM
EDTA. Aliquots (50 μl) of this homogenate were mixed with 10 μl of
the same homogenization buffer and 60 μl of the same Hepes-NaOH
buffer as mentioned above, but diluted with H2O in a 2/1
ratio (yielding a 50.0 mM Hepes-NaOH buffer) and enriched with ATP
(20.0 mM), D-glucose (7.0 or 50.0 mM) and a trace amount of
D-[U-14C]glucose. After 60 min incubation at 37ºC, 1.0
ml of cold H2O was added to each sample and the
radioactive acidic metabolites were separated by anion-exchange
chromatography (9).
Ethical approval
The study was approved by the Ethic Committee of
Brussels Free university (Brussels, Belgium).
Statistical analysis
All results are expressed as the mean values (±SEM)
together with either the number of individual determinations (n) or
degree of freedom (df). The statistical significance of differences
between mean values was assessed by use of Student’s t-test.
Results
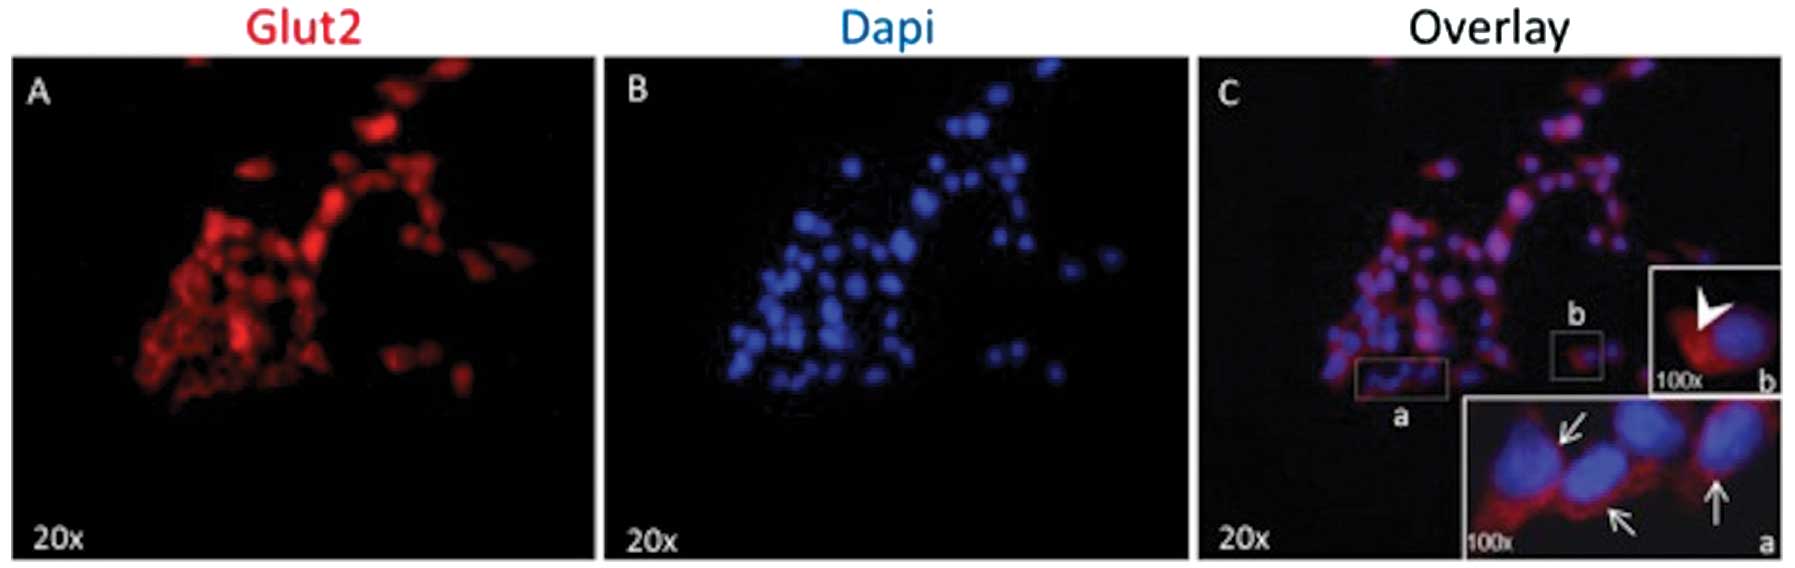
Immunocytochemistry of GLUT2
As illustrated in Fig.
3, GLUT2 protein was largely detected by immunofluorescence in
the membrane of INS-1E cells, but also in the cytosol of these
cells.
Uptake of desnitroso-streptozotocin
analogs
In a representative experiment, the fluorescence of
INS-1E cells not exposed to any probe did not exceed 5.1 arbitrary
units/103. In the same experiment, after 24 h incubation
at the highest probe concentration (12.0 μM) used in the present
study, the fluorescence of INS-1E cells with probe A and B
averaged, respectively, 50.4 and 247.2 arbitrary
units/103. Taking into account both the reference values
for the fluorescence of the probes themselves (see Materials and
methods) and the volume of INS-1E cells, i.e. 1.5
nl/103(10), the latter
value would yield apparent intracellular concentrations of ~78.4 μM
with probe A and 217.3 μM with probe B: approximately one order of
magnitude higher than the initial extracellular concentration (12.0
μM).
In a series of six experiments conducted in INS-1E
cells incubated for 5 or 24 h in the presence of probe A or B in
concentration ranges of 0.25–0.5–1.0 μM or 3.0–6.0–12.0 μM, the
probe A/probe B ratio for the fluorescence of the cells averaged
21.8±1.8% (n=18). The data collected in cells exposed to probe A or
B in the low concentration range of 0.25–0.5–1.0 μM yielded an A/B
ratio of cell fluorescence (21.9±2.5%; n=6) virtually identical to
that recorded in the higher concentration range of 3.0–6.0–12.0 μM
(21.7±2.5%; n=12). Such ratios were markedly lower (P<0.005 or
less) than those observed for the fluorescence of the probes
themselves (55.1±6.6%; n=8), indicating that, under identical
experimental conditions, the net uptake of probe A by the INS-1E
cells, considered in molar units, only represented ~40% of that of
probe B.
The A/B ratio for INS-1E cell fluorescence was not
identical, however, after either 5 or 24 h incubation. Thus, the
value recorded after 5 h incubation averaged 134.1±11.7% (n=9;
P<0.02) of the paired value recorded within the same
experiment(s) and at the same concentration of each probe after 24
h incubation. This finding suggests that a difference may prevail
between the two probes in terms of the time course for their uptake
by the INS-1E cells.
In agreement with the latter suggestion, the time
course for the uptake of probe A or B indicated that, after 5 h
incubation, the fluorescence of INS-1E cells exposed to these
probes in the 3.0–6.0–12.0 μM range amounted to 89.7±2.9% (n=6) in
the case of probe A and 61.6±3.5% (n=6) in the case of probe B of
the paired value recorded within the same experiment(s) with the
same probe and at the same probe concentration after 24 h
incubation. In addition to differing significantly (P<0.001)
from one another, the latter two mean percentages were both
significantly lower than unity (P<0.02 or less) and both
significantly higher (P<0.001) than the theoretical value of
20.8% based on the assumption of a rule of proportionality between
uptake of the probe and length of incubation.
The concentration dependency for the uptake of
probes A and B was examined in 3 experiments conducted in the
0.25–0.5–1.0 μM range and in 4 experiments conducted in the
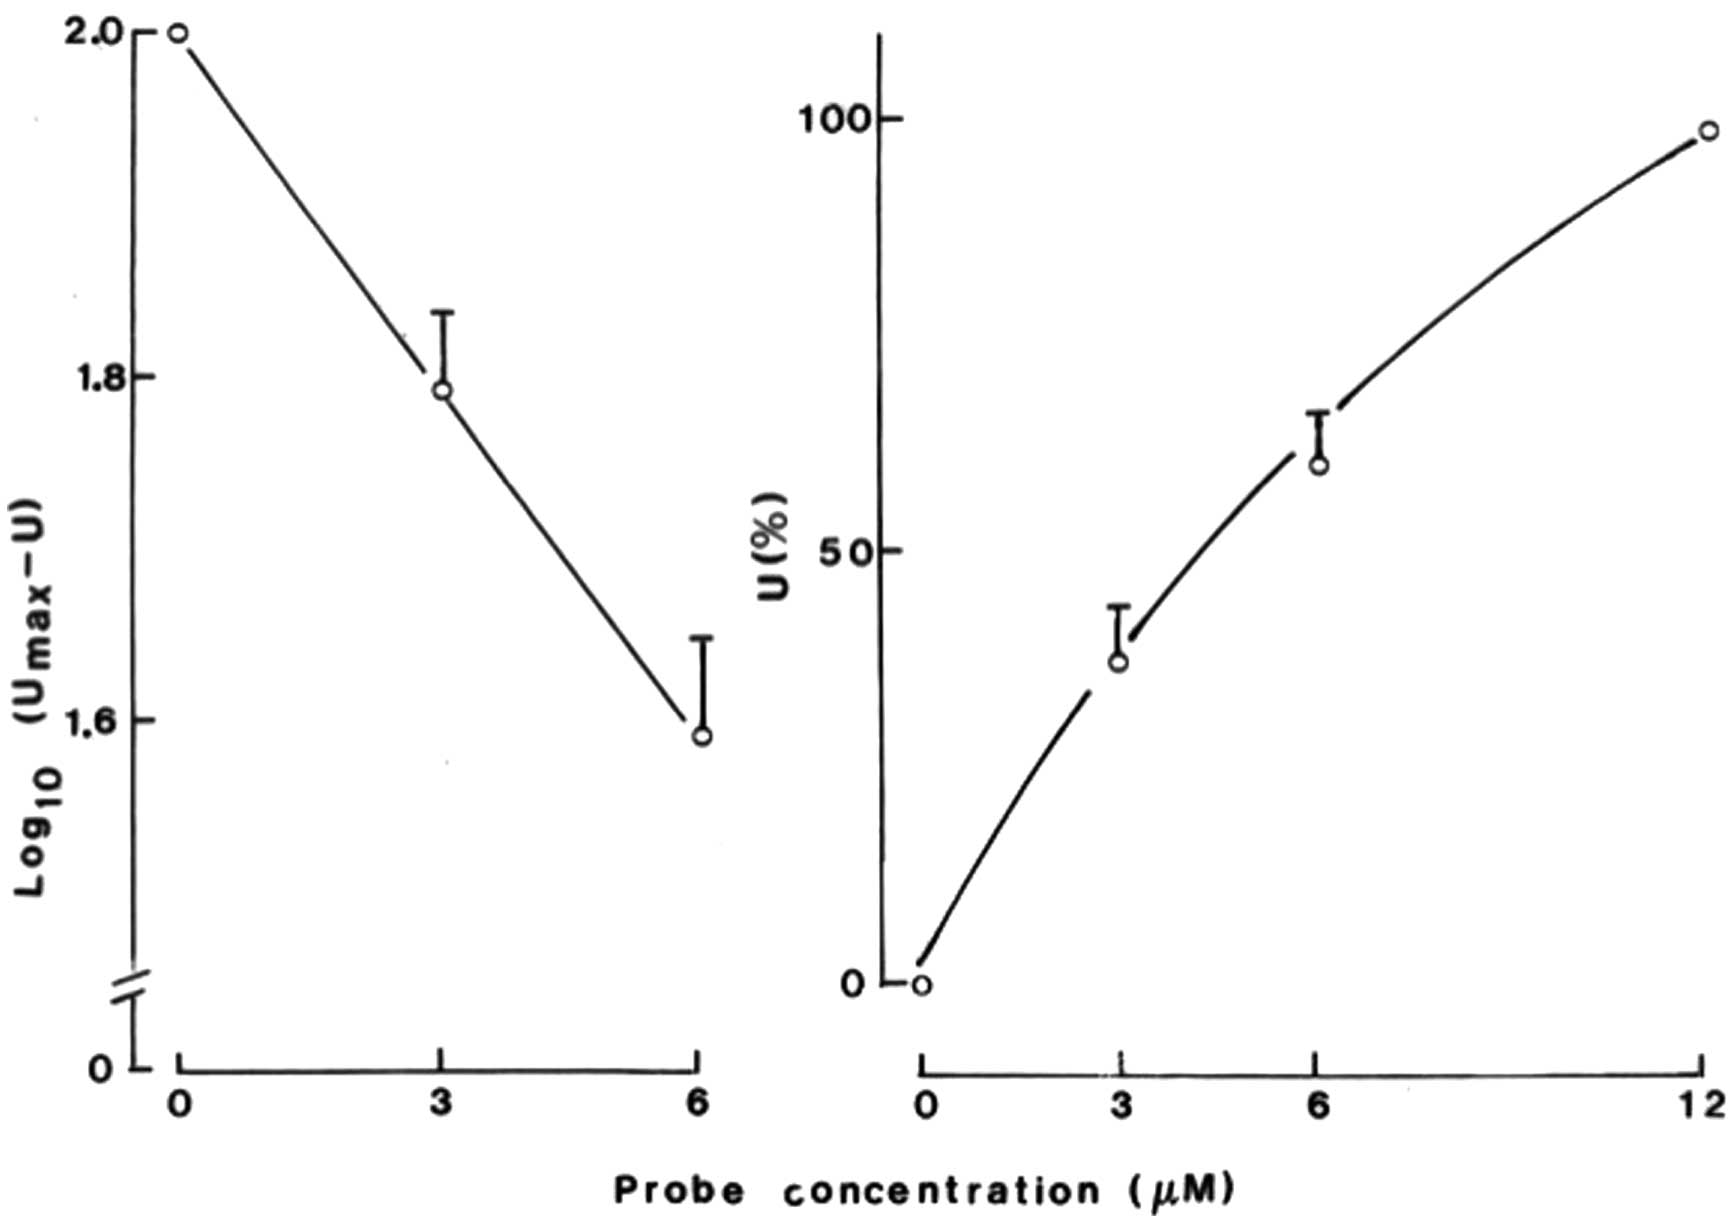
3.0–6.0–12.0 μM range. The results of the latter experiments are
shown in Fig. 4. The results
indicate that, after 5 or 24 h incubation in the presence of either
probe A or probe B, the fluorescence of the INS-1E cells averaged
3.0 and 6.0 μM, respectively, which was 37.5±6.7 and 60.7±5.4%
(n=8) of the corresponding value recorded at 12.0 μM, yielding a
curvilinear pattern with downward concavity (Fig. 3, right panel). When the cell
fluorescence observed at 3.0 and 6.0 μM was expressed relative to
the close-to-maximal value (Umax) recorded at 12.0 μM,
the results were compatible with an exponential pattern responding
to the equation U = Umax (1 − e−KC), in which
U represents the uptake of the probe at a concentration (C) and K
the slope of the corresponding regression line established in
semi-logarithmic coordinates. Thus, as shown in Fig. 4 (left panel), the regression line
between the decimal logarithmic values of (Umax - U) and
the concentration of the probe yielded a correlation coefficient
equal to unity and a negative slope of −0.0676 μM−1. At
lower probe concentrations in the 0.25–0.5–1.0 μM range, the
measurements of INS-1E cell fluorescence also yielded a curve with
downward concavity, and the results recorded at 0.25 and 0.5 μM
averaged 35.1±8.7% (n=4) and 71.3±8.1% (n=4), respectively, of the
paired corresponding value observed under the same experimental
conditions (30 min, 5 h and 24 h incubation) at the 1.0 μM
concentration of the same probe. These percentages did not differ
significantly from those expected from the regression line drawn in
the left panel of Fig. 4.
When compared within the same experiment(s) and
after 5 or 24 h incubation, there was little difference in the
fluorescence of INS-1E cells exposed to either probe A or probe B
(3.0, 6.0 and 12.0 μM) and incubated at either low (2.8 mM) or high
(16.7 mM) concentrations of D-glucose, with a paired 2.8 mM/16.7 mM
ratio averaging 109.3±16.4% (n=12; P>0.59 vs. unity). Thus,
there was no evidence that the uptake of either probe A or probe B
was affected by the concentration of D-glucose in the incubation
medium.
The uptake of probes A and/or B by INS-1E cells was
also compared to that found, under comparable experimental
conditions, in HEK-293 cells, taken as representative of
GLUT2-expressing kidney cells (11), rat pancreatic islets, rat
hepatocytes, rat exocrine pancreatic cells and BRIN-BD11 cells.
The fluorescence measurements observed in the
HEK-293 cells yielded information closely comparable to that
collected in the INS-1E cells. Firstly, whether in HEK cells
exposed for either 5 or 24 h to either probe A or probe B, their
respective uptake at 12.0 μM was 2.85±0.34 times higher (n=4;
P<0.02) than the paired value observed at a 3.0 μM
concentration, indicating a lack of proportionality (P<0.05)
between uptake and concentration. Furthermore, the 3.0/12.0 μM
ratio for the fluorescence of HEK cells averaged 36.8±4.8% (n=4), a
value almost identical (P>0.94) to that computed in the INS-1E
cells (37.5±6.7%; n=8). Secondly, the paired probe A/probe B ratio
for the fluorescence of HEK cells averaged 23.3±2.6% (n=4), a value
again almost identical (P>0.71) to that found in INS-1E cells
(21.8±1.8%; n=18). Lastly, the fluorescence of HEK cells exposed
for 5 h to probes A or B (3.0 or 12.0 μM) represented 50.7±5.0%
(n=4) of the paired value recorded after 24 h of incubation, such a
percentage being significantly higher (P<0.01) than the
theoretical value of 20.8% based on the assumption of a rule of
proportionality between probe uptake and length of incubation, as
also observed in INS-1E cells.
In rat isolated pancreatic islets exposed to probe A
or B (3.0, 6.0 and 12.0 μM), the fluorescence measurements recorded
after only 15 min incubation indicated that the net uptake of these
probes had already reached its close-to-equilibrium value. Thus,
the values observed after only 15 min incubation averaged
106.4±1.4% (n=6) of the corresponding measurements made after 24 h
incubation. As judged from the comparison of measurements made in
the islets at increasing concentrations of each probe (3.0, 6.0 and
12.0 μM), the concentration-uptake relationship differed with probe
A, as compared to probe B. In the case of probe A, the uptake was
grossly proportional to the concentration. For instance, whether
after 15 min or 24 h incubation, it represented 22.3±1.8% and
50.6±1.1%, at 3.0 and 6.0 μM, respectively, of the corresponding
value found at 12.0 μM. In the case of probe B, the measurements at
3.0 μM averaged 73.2±2.1% of those recorded at 6.0 μM, the latter
measurement representing 70.9±0.2% of that found at 12.0 μM. The
results obtained in the islets with probe B are thus similar to
those illustrated in Fig. 4, with
a negative coefficient of correlation between log10
(Umax – U) and concentration (0, 3.0 and 6.0 μM)
amounting to −0.9943 and the slope of the corresponding regression
line yielding a negative value of −0.0894 μM−1. As
expected from these findings, the probe A/probe B paired ratio for
islet fluorescence, as computed after either 15 min or 24 h
incubation, increased from 38.0±1.4% at 3.0 μM to 63.0±0.2% at 6.0
μM and 88.3±2.0% at 12.0 μM.
After 30 min incubation in the presence of probe B
tested in the 0.25–0.5–1.0 μM range, the concentration-dependent
fluorescence of rat hepatic cells and INS-1E cells, assessed within
the same experiment, yielded a comparable relationship. Thus,
according to the analytical procedure illustrated in Fig. 3, the slope of the regression line
(± sample standard deviation of the regression coefficient) was
almost identical (P>0.87) in hepatocytes (0.093±0.010
μM−1) and INS-1E cells (0.091±0.009 μM−1)
with a correlation coefficient between log10
(Umax – U) and C amounting, respectively, to 0.9912 in
hepatocytes (n=4; P<0.009) and 0.9850 in INS-1E cells (n=4;
P<0.02). The absolute value for fluorescence, however, was 4–5
times higher in hepatic cells than in INS-1E cells.
Within the same experiment, the results collected in
rat exocrine pancreatic cells, which do not express GLUT2 and were
incubated under the same experimental conditions, differed from
those found in either hepatic cells or INS-1E cells in several
respects. Firstly, the dispersion of individual measurements at
increasing concentrations of probe B was greater in rat exocrine
pancreatic cells than in either rat liver cells or INS-1E cells, as
documented by the lower correlation coefficient between cell
fluorescence and probe concentration in the exocrine cells
(r=0.8686; n=6; P<0.03) than in the liver cells (r=0.8969; n=6;
P<0.001) or INS-1E cells (r=0.9757; n=6; P<0.001), and by the
much higher magnitude of the standard deviation of the regression
coefficient between cell fluorescence and probe concentration,
expressed relative to the latter coefficient, in exocrine cells
(57.1%) than in either liver cells (16.4%) or INS-1E cells (22.5%).
Secondly, at any given probe concentration, the fluorescence of
exocrine cells was markedly lower than that of liver cells or
INS-1E cells. Expressed in arbitrary units, the slope of the
regression line between cell fluorescence and probe concentration
did not exceed 1.86±1.06 103/μM, a value ~15 times lower
than that found for hepatic cells, 28.28±4.63 103/μM.
The slope found in the exocrine cells was also 2–3 times lower than
that found in the INS-1E cells (4.25±0.95 103/μM),
within the same experiment. The statistical significance of the
difference was confirmed by covariance analysis (F=11.3, f=1, 8;
P=0.01).
The possible role of distinct glucose transporters
in the uptake of the two probes examined in this study was
supported by findings collected in BRIN-BD11 cells established by
electrofusion of RINm5F cells with New England Deaconess Hospital
(NEDH) rat pancreatic islet cells (12). The metabolism of D-glucose in the
BRIN-BD11 cells displays several analogies with that of the hexose
in the parent RINm5F cells (13).
For instance, the concentration dependency of
D-[5-3H]glucose utilization is almost identical in
RINm5F and BRIN-BD11 cells. The total energy yield from D-glucose
catabolism is also similar in these two cell lines (13). The RINm5F cells have lost an
essential attribute of the glucose sensor device in normal
insulin-producing cells, namely the capacity to ensure the
equilibrium of D-glucose concentrations across the plasma membrane
(14), coinciding with a severely
impaired uptake of the diabetogenic agent alloxan and with
resulting resistance to its cytotoxic action (15). A comparable situation may prevail
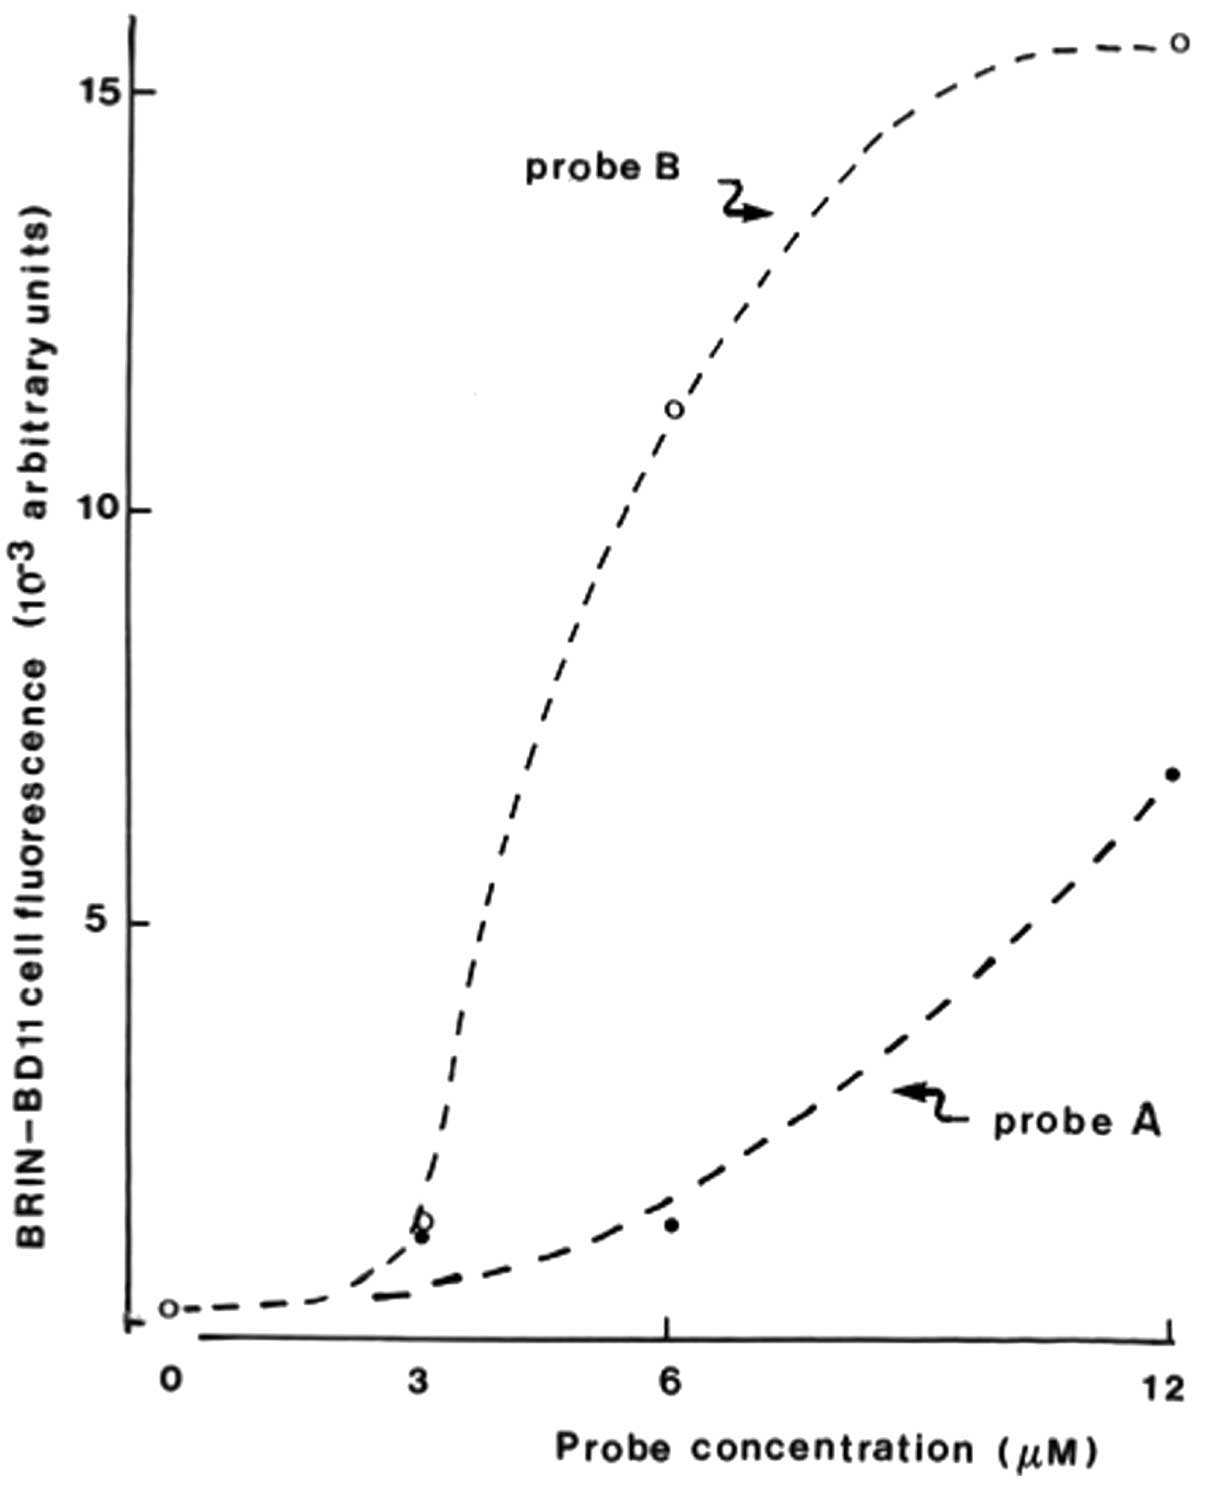
in BRIN-BD11 cells. In turn, such a situation may account for the
unusual concentration dependency for the uptake of probes A and B
by BRIN-BD11 cells with either an upward concavity (probe A) or
sigmoidal pattern (probe B), as shown in Fig. 5. In these experiments, the increase
in the fluorescence of the BRIN-BD11 cells in the low range of
probe concentrations, expressed relative to the increment in probe
concentrations, represented no more than 16.2±4.8% (n=3) of that
recorded with the same probe in the steepest segments of the curves
shown in Fig. 5. Moreover, whilst
the probe A/probe B ratio in cell fluorescence amounted to 85.8% at
the lowest probe concentration (3.6 μM), it reached a value two
times lower (42.5%) at the highest probe concentration (12.0
μM).
At the lowest extracellular probe concentration used
in these experiments (3.0 μM), their estimated intracellular
concentration, taking into account a BRIN-BD11 cell volume of 1.60
nl/103 cells (8), was
close to 16.5 and 10.9 μM for probe A and B, respectively, as
compared to corresponding values of 20.6 and 76.0 μM in INS-1E
cells. The marked difference observed under these experimental
conditions in terms of the apparent uptake of probe B by BRIN-BD11
cells versus INS-1E cells was reduced at the highest probe
concentration (12.0 μM) with estimated intracellular concentrations
of 135.6 μM (probe A) and 180.3 μM (probe B) in BRIN-BD11 cells, as
compared to 78.4 μM (probe A) and 217.3 μM (probe B) in INS-1E
cells.
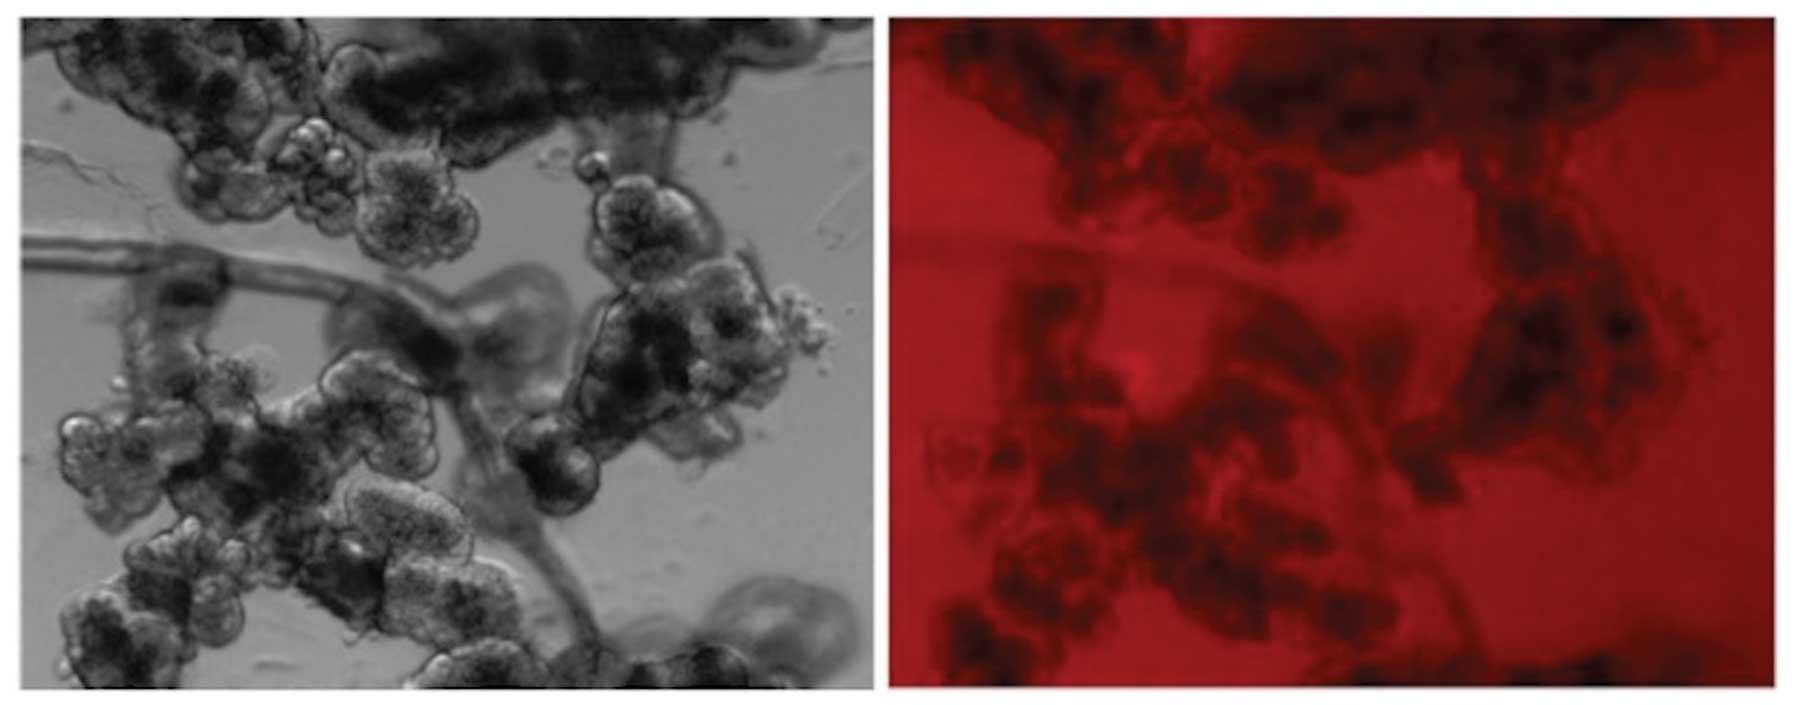
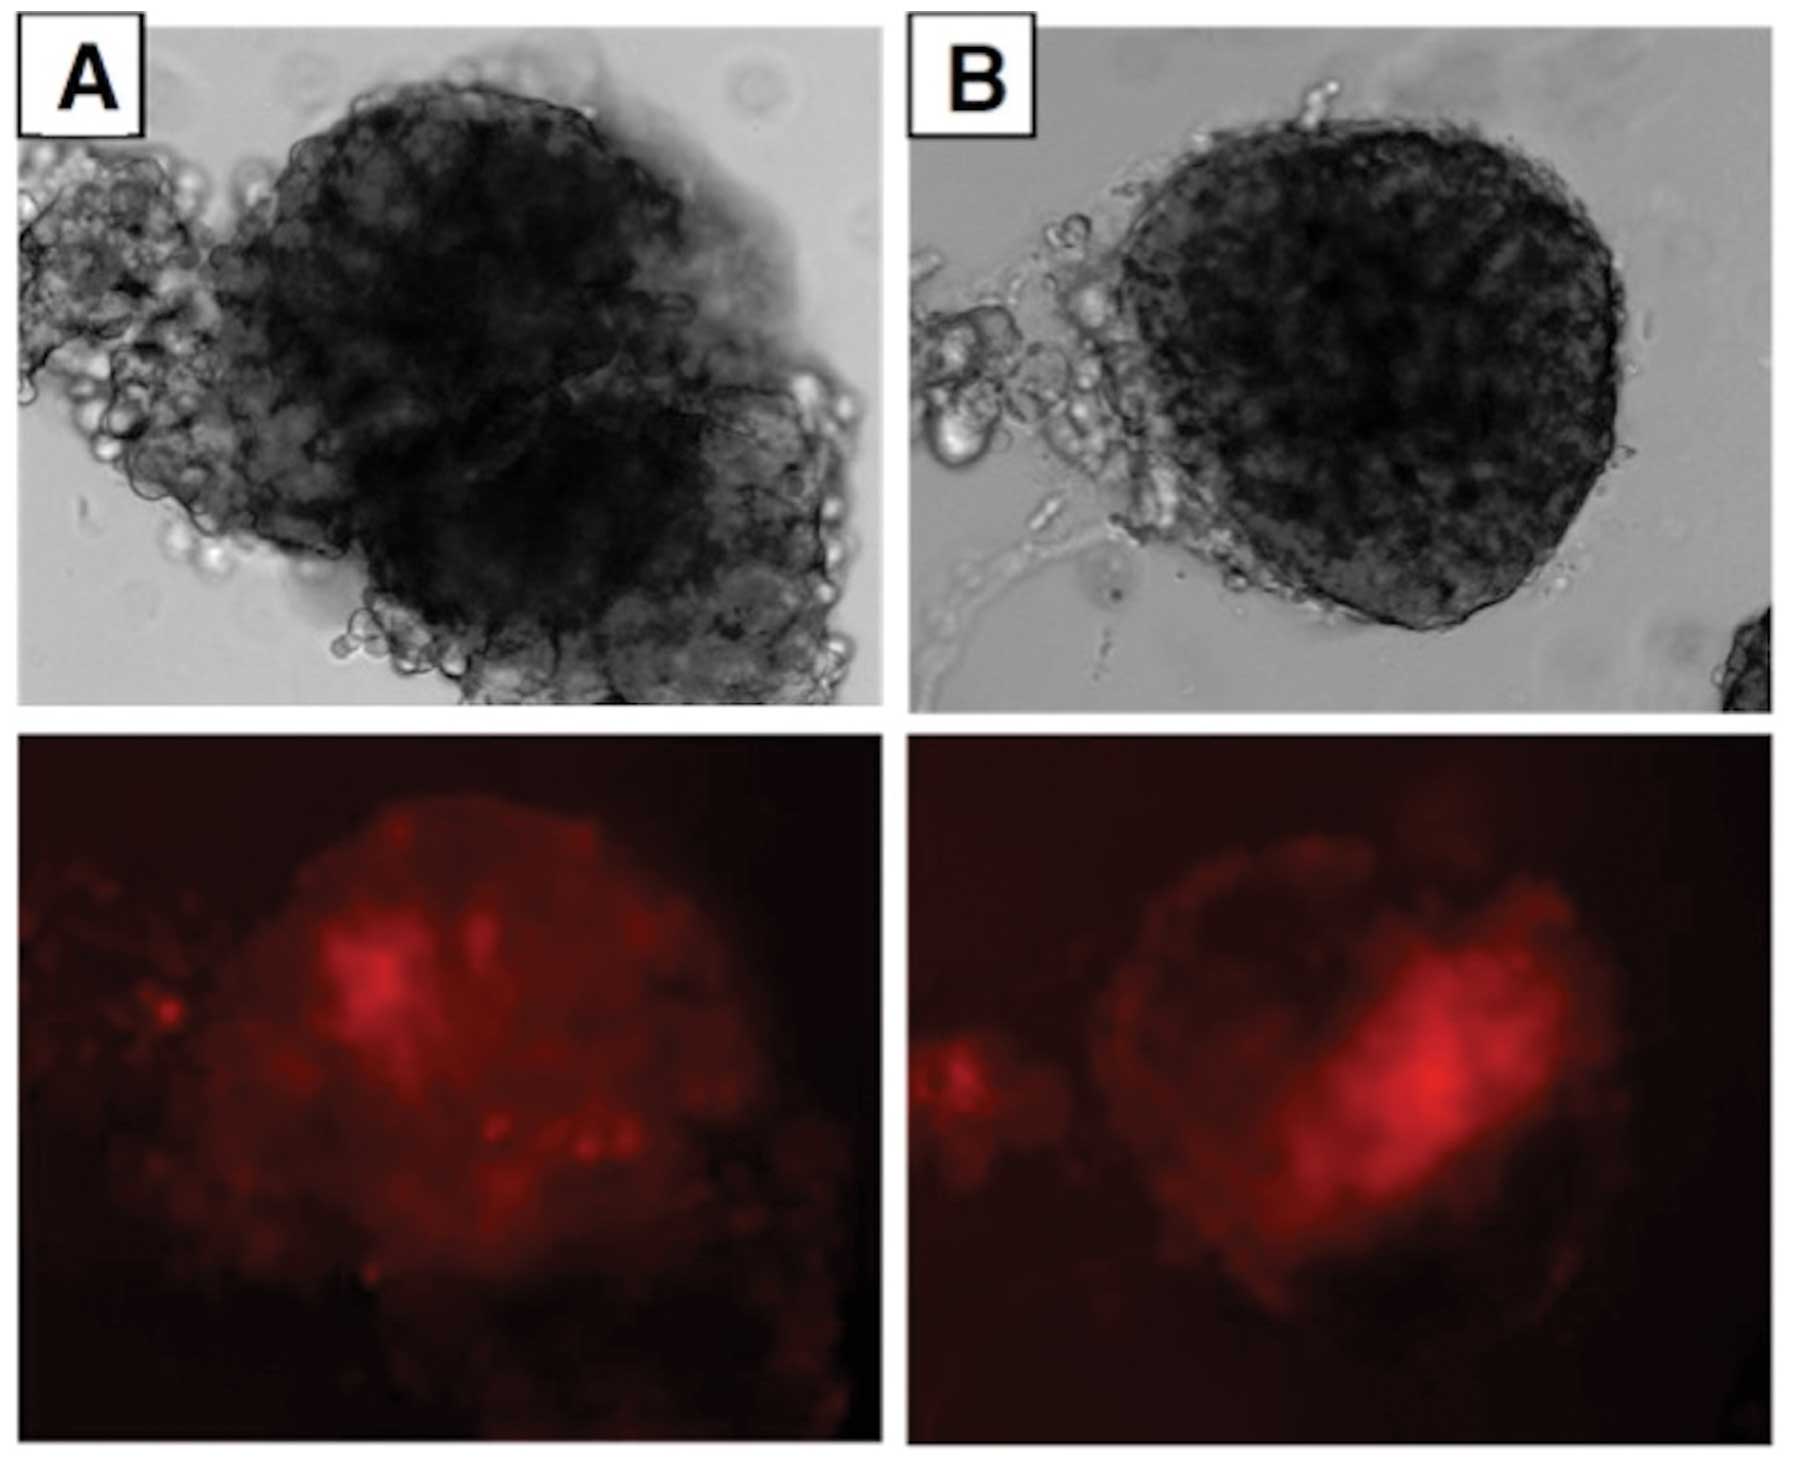
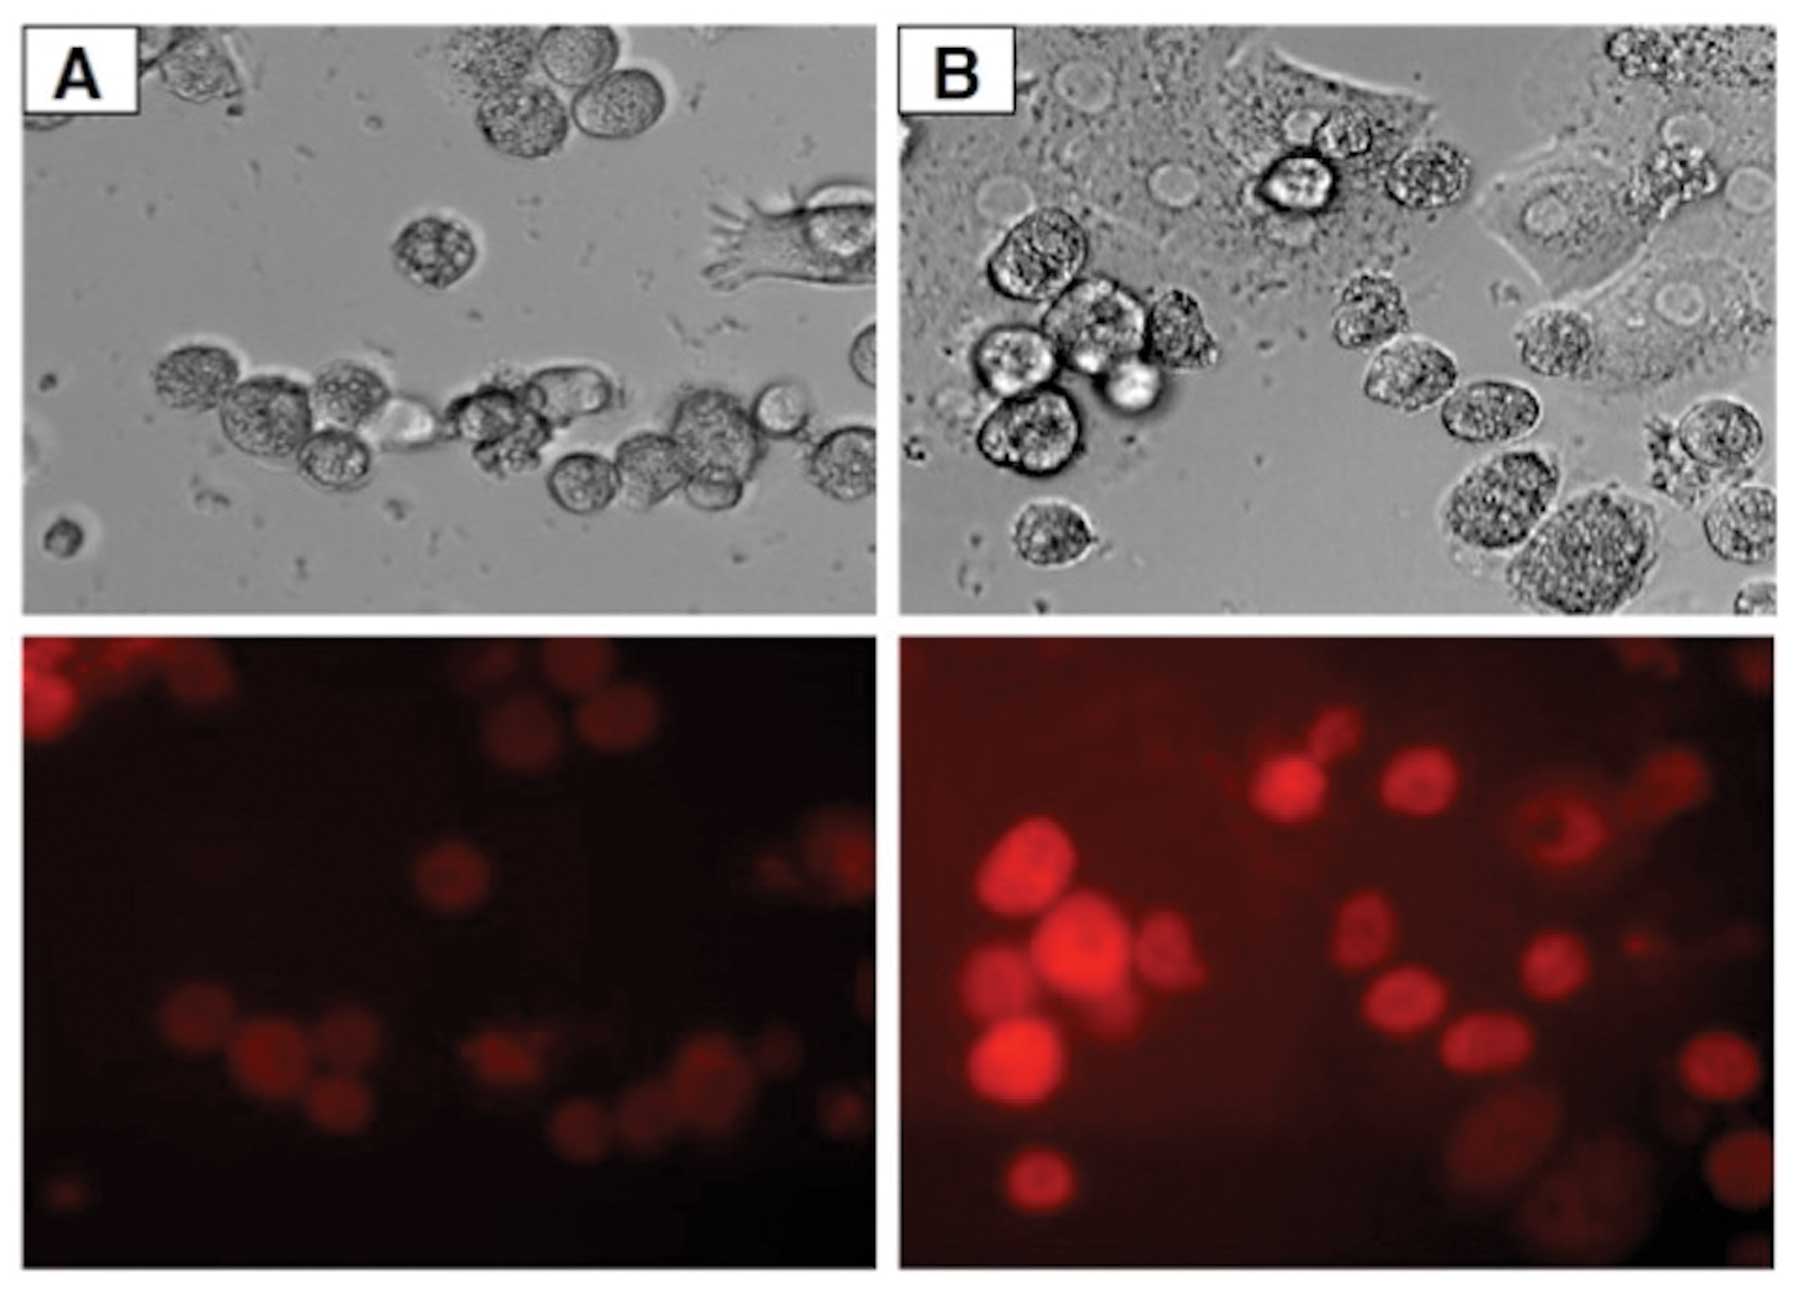
Fluorescent imaging
Even at a 1.0 μM concentration of probe B, uptake
could not be documented by fluorescence imaging in rat exocrine
pancreatic cells (Fig. 6), in
contrast with the findings made in rat pancreatic islets (Fig. 7), rat liver cells (Fig. 8) and INS-1E cells (data not
shown).
D-glucose phosphorylation
At 3.5 and 25.0 mM D-glucose, the phosphorylation of
hexose by INS-1E cell homogenates averaged, respectively, 13.8±1.1
and 55.8±2.1 pmol/103 cells per 60 min (n=8–9). The
latter values were not significantly different (P>0.34 or more)
from the conversion of D-[5-3H]glucose to
3HOH by intact INS-1E cells incubated at either 2.8 mM
D-glucose (11.1±3.2 pmol/103 cells per 60 min) or 16.7
mM D-glucose (46.3 ± 5.7 pmol/103 cells per 60 min), as
previously reported (16).
Discussion
The present study documents the presence of both
GLUT2 and a high Km glucokinase-like catalytic activity
in INS-1E cells. These attributes are well suited to account for
the glucose-sensing capacity of these cells (3). The high similarity between the rate
of D-glucose phosphorylation by INS-1E cell homogenates and that of
D-[5-3H]glucose utilization by intact cells supports the
view that the concentration of D-glucose in the cytosol of INS-1E
cells is close to its extracellular concentration and that the
glucokinase-like enzyme represents the key determinant of D-glucose
phosphorylation and further catabolism.
The labeling of insulin-producing cells remains a
challenge, as recently reviewed (1). The present study dealt mainly with
the use of fluorescent desnitroso-streptozotocin analogs using a
more hydrophilic and a more hydrophobic dye component. It may be
objected that this approach is restricted to the ex vivo
labeling of insulin-producing cells. However, it should not be
ruled out that the detection and quantification of pancreatic
β-cells in vivo could be achieved using the present
fluorescent probes and a suitable fluorescence detection instrument
transiently inserted in the peritoneal cavity.
The concentration- and time-dependent fluorescence
of cells exposed to either probe A or B yielded comparable results
in rat isolated pancreatic islets and either INS-1E, HEK or hepatic
cells, whilst a different situation prevailed in rat exocrine
pancreatic cells or BRIN-BD11 cells. Moreover, a pronounced
fluorescence in the cells exposed to either probe A or B was
rapidly reached despite the fact that the extracellular
concentration of these probes, as tested in the present study,
remained in the 0.15–1.2 μM range. Differences in the cell response
to probe A and probe B, as documented in the present study, may be
accounted for by their different chemical structure and
hydrophobicity.
In conclusion, the present study provides novel
findings considered as potentially helpful in the labeling of
GLUT2-expressing cells with a fluorescent probe.
Acknowledgements
This study was supported by the European Community’s
Seventh Framework Programme FP7/2007-2013-FP7-NMP-In Vivo
Imaging of Beta-cell by Applied Nano Technology under grant
agreement No. (228-993)-(VIBRANT).
References
|
1
|
Malaisse WJ and Maedler K: Imaging of the
β-cells of the islets of Langerhans. Diab Res Clin Pract. 98:11–18.
2012.
|
|
2
|
Asfari M, Janjic D, Meda P, Li G, Halban
PA and Wollheim CB: Establishment of 2-mercaptoethanol-dependent
differentiated insulin-secreting cell lines. Endocrinology.
130:167–178. 1992.PubMed/NCBI
|
|
3
|
Merglen A, Theander S, Rubi B, Chaffard G,
Wollheim CB and Maechler P: Glucose sensitivity and
metabolism-secretion coupling studied during two-year continuous
culture of INS-1E insulinoma cells. Endocrinology. 145:667–678.
2004.PubMed/NCBI
|
|
4
|
Ran C, Pantazopoulos P, Medarova Z and
Moore A: Synthesis and testing of beta-cell specific
streptozotocin-derived near-infrared imaging probes. Angew Chem Int
Ed. 46:8998–9001. 2007. View Article : Google Scholar : PubMed/NCBI
|
|
5
|
Malaisse-Lagae F and Malaisse WJ: Insulin
release by pancreatic islets. Methods in Diabetes Research. I(part
B)Larner J and Pohl S: John Wiley & Sons; New York: pp.
147–152. 1984
|
|
6
|
Amsterdam A and Jamieson D: Studies on
dispersed pancreatic exocrine cells. II Functional characteristics
of separated cells. J Cell Biol. 63:1057–1073. 1974. View Article : Google Scholar : PubMed/NCBI
|
|
7
|
Berry MN and Friend DS: High-yield
preparation of isolated liver parenchymal cells. J Cell Biol.
43:506–520. 1969. View Article : Google Scholar
|
|
8
|
Crutzen R, Shlyonsky V, Louchami K,
Virreira M, Hupkens E, Boom A, Sener A, Malaisse WJ and Beauwens R:
Does NAD(P)H oxidase-derived H2O2 participate
in hypotonicity-induced insulin release by activating VRAC in
β-cells? Eur J Physiol. 463:377–390. 2012.PubMed/NCBI
|
|
9
|
Giroix M-H, Sener A, Pipeleers DG and
Malaisse WJ: Hexose metabolism in pancreatic islets. Inhibition of
hexokinase. Biochem J. 223:447–453. 1984.PubMed/NCBI
|
|
10
|
Orecna M, Hafko R, Bacova Z, Podskocova J,
Chorvat D Jr and Strbak V: Different secretory response of
pancreatic islets and insulin secreting cell lines INS-1 and INS-1E
to osmotic stimuli. Physiol Rev. 57:935–945. 2008.PubMed/NCBI
|
|
11
|
Wallner EI, Wada J, Tramonti G, Lin S and
Kanwar YS: Status of glucose transporters in the mammalian kidney
and renal development. Ren Fail. 23:301–310. 2001. View Article : Google Scholar : PubMed/NCBI
|
|
12
|
McClenaghan NH, Barnett CR, Ah-Sing E,
Abdel-Wahab YHA, O’Harte FPM, Yoon T-W, Swanston-Flatt SK and Flatt
PR: Characterization of a novel glucose-responsive
insulin-secreting cell line, BRIN-BD11, produced by electrofusion.
Diabetes. 45:1132–1140. 1996. View Article : Google Scholar : PubMed/NCBI
|
|
13
|
Rasschaert J, Flatt PR, Barnett CR,
McClenaghan NH and Malaisse WJ: D-glucose metabolism in BRIN-BD11
islet cells. Biochem Mol Med. 57:97–105. 1996. View Article : Google Scholar : PubMed/NCBI
|
|
14
|
Sener A, Giroix M-H and Malaisse WJ:
Impaired uptake of D-glucose by tumoral insulin-producing cells.
Biochem Int. 12:913–919. 1986.PubMed/NCBI
|
|
15
|
Sener A and Malaisse WJ: Resistance to
alloxan of tumoral insulin-producing cells. FEBS Lett. 193:150–152.
1985. View Article : Google Scholar : PubMed/NCBI
|
|
16
|
Bakkali Nadi A, Olivares E and Malaisse
WJ: D-glucose metabolism in normal dispersed islet cells and
tumoral INS-1 cells. Mol Cell Biochem. 210:167–172. 2000.PubMed/NCBI
|