Introduction
Severe aplastic anemia (SAA) is a serious disease
that features bone marrow failure and is associated with high
mortality rates. SAA has been recognized as an autoimmune disease
caused by active destruction of hematopoietic cells by T
lymphocytes (1). In recent years,
a number of factors have been identified that contribute to the
pathogenesis of SAA, including the activation of dendritic cells
(DCs), imbalance of the Th1:Th2 ratio, excessive production of
interferon-γ, expansion of CD8+ T cells and heightened
Fas antigen expression in hematopoietic stem/progenitor cells
(2,3). Cytotoxic T lymphocytes (CTLs) usually
damage target cells using three mechanisms: Cytokines,
perforin-granzyme B and the Fas-FasL pathway (4). The mechanisms underlying how CTLs in
SAA attack bone marrow cells have not been elucidated. Therefore,
using HLA-DR as a molecular marker of activated CTL (5), the present study assessed the
quantity and function of CD8+HLA-DR+ T cells
in patients with SAA.
Flow cytometric analysis and polymerase chain
reaction (PCR) were used to assess the
CD8+HLA-DR+ T cell count in SAA patients and
healthy controls. Furthermore, the expression levels of perforin,
granzyme B, tumor necrosis factor-β (TNF-β) and FasL in CTLs were
assessed. In order to confirm the cytotoxic effect of
CD8+HLA-DR+ T cells on hematopoietic cells,
CTLs from SAA and CD3− bone marrow cells from the normal
controls were co-cultured.
Materials and methods
Patients
Thirty-eight patients with SAA were diagnosed in the
Hematology Department of the General Hospital, Tianjin Medical
University (Tianjin, China) between June 2008 and February 2011
according to the International AA Study Group Criteria (3). The disease was considered severe if
at least two of the following parameters were met: Neutrophil count
<0.5×10⁹/l, platelet count <20×109/l
and reticulocyte count <20×109/l with hypocellular
bone marrow. Very severe aplastic anemia (VSAA) was diagnosed in
cases of SAA with a neutrophil count <0.2×10⁹/l
(3). Patients were excluded if
they had congenital AA or other autoimmune diseases. Patients were
screened for paroxysmal nocturnal hemoglobinuria by flow cytometry
using anti-CD55 and anti-CD59 antibodies. The patient population
comprised 21 males and 17 females. The median age was 28 years
(range, 10–48). Table I lists the
features of 26 cases who were untreated (untreated group) and 12
who were in remission following immunosuppressive therapy (IST;
remission group). The remission criteria were as follows:
Independent transfusion, reticulocytes ≥20×109/l,
absolute neutrophil count (ANC) ≥1.0×10⁹/l and platelet
≥20×109/l. There were 23 healthy volunteers in the
normal control group, including 11 males and 12 females, with a
median age of 27 years (range, 21–38). The study was approved by
the Ethics Committee of Tianjin Medical University (Tianjin,
China). Informed written consent was obtained from all patients in
accordance with the Declaration of Helsinki.
 | Table ICharacteristics of untreated SAA
patients. |
Table I
Characteristics of untreated SAA
patients.
| Case | Age/gender | Granulocytes
(x109/l) | Hemoglobin
(g/l) | Platelets
(x109/l) | Abnormal
chromosomes | Therapy |
|---|
| 1 | 15/M | 0.23 | 58 | 9 | Absence | ATG + CsA |
| 2 | 32/M | 0.45 | 34 | 5 | Absence | ATG + CsA |
| 3 | 30/M | 0.43 | 56 | 11 | Absence | ATG + CsA |
| 4 | 25/F | 0.26 | 73 | 14 | Absence | ATG + CsA |
| 5 | 28/F | 0.37 | 52 | 7 | Absence | ATG + CsA |
| 6 | 20/F | 0.41 | 47 | 9 | Absence | ATG + CsA |
| 7 | 48/M | 0.35 | 62 | 13 | Absence | ATG + CsA |
| 8 | 32/F | 0.25 | 59 | 5 | Absence | ATG + CsA |
| 9 | 40/M | 0.29 | 61 | 12 | Absence | ATG + CsA |
| 10 | 25/M | 0.20 | 50 | 9 | Absence | ATG + CsA |
| 11 | 18/M | 0.38 | 56 | 13 | Absence | ATG + CsA |
| 12 | 28/M | 0.26 | 53 | 8 | Absence | ATG + CsA |
| 13 | 45/F | 0.49 | 49 | 6 | Absence | ATG + CsA |
| 14 | 29/M | 0.02 | 63 | 9 | Absence | ATG + CsA |
| 15 | 10/M | 0.31 | 56 | 10 | Absence | ATG + CsA |
| 16 | 25/F | 0.06 | 60 | 13 | Absence | ATG + CsA |
| 17 | 31/F | 0.39 | 55 | 9 | Absence | ATG + CsA |
| 18 | 42/M | 0.20 | 64 | 11 | Absence | ATG + CsA |
| 19 | 30/M | 0.33 | 43 | 7 | Absence | ATG + CsA |
| 20 | 17/F | 0.29 | 68 | 12 | Absence | ATG + CsA |
| 21 | 43/F | 0.23 | 54 | 9 | Absence | ATG + CsA |
| 22 | 39/M | 0.05 | 70 | 15 | Absence | ATG + CsA |
| 23 | 19/M | 0.19 | 67 | 11 | Absence | ATG + CsA |
| 24 | 27/F | 0.22 | 54 | 7 | Absence | ATG + CsA |
| 25 | 18/M | 0.36 | 65 | 10 | Absence | ATG + CsA |
| 26 | 22/M | 0.44 | 57 | 6 | Absence | ATG + CsA |
Surface and intracellular phenotyping by
flow cytometry
Prior to analysis, the peripheral blood samples were
stimulated in a short-term culture. All cells were maintained in
RPMI-1640 medium supplemented with 20 ng/ml phorbol myristate
acetate (PMA), 1 μg/ml ionomycin and 10 μg/ml Brefeldin A (BFA) for
6 h (Abcam, Hong Kong, China).
The number of CD8+HLA-DR+ T
cells was measured by flow cytometry using anti-CD8-peridinin
chlorophyll (PerCP), anti-CD3-fluorescein isothiocyanate (FITC) and
anti-HLA-DR-FITC antibodies. The expression of perforin, granzyme
B, TNF-β and FasL in CD8+HLA-DR+ T cells was
detected by flow cytometry with the following monoclonal
antibodies, which were all obtained from BD Biosciences (Franklin
Lakes, NJ, USA): Perforin-phycoerythrin (PE), granzyme B-PE,
TNF-β-PE and FasL (CD178)-PE. Data acquisition and analysis were
conducted on a FACSCalibur flow cytometer (BD Biosciences, San
Jose, CA, USA) using the Cell Quest software program (version 3.1;
BD Biosciences).
Analysis of mRNA expression by PCR
CD8+HLA-DR+ T cells were
purified by a double-positive selection process using MACS
separators (Miltenyi Biotec, Auburn, CA, USA), as recommended by
the manufacturer. Total RNA was prepared from purified
CD8+HLA-DR+ cells of healthy controls and SAA
patients using TRIzol reagent (Invitrogen Life Technologies,
Carlsbad, CA, USA) according to the manufacturer’s instructions.
Reverse-transcription (RT) reactions were performed using the
iScript cDNA Synthesis kit (Bio-Rad, Hercules, CA, USA). Primers
for amplifying perforin, granzyme B, TNF-β and FasL are listed in
Table II and PCR was performed
under the conditions presented in Table III (GeneAmp 9700 PCR system;
Applied Biosystems, Grand Island, NY, USA). The amplified products
were electrophoresed on an agarose gel. A negative control without
cDNA template was run with every assay. The transcript copy number
per subject was calculated by normalization to GAPDH
expression.
| Table IIPrimers for amplifying perforin,
granzyme B, TNF-β and FasL. |
Table II
Primers for amplifying perforin,
granzyme B, TNF-β and FasL.
| Gene | Primer | Molecular weight
(bp) |
|---|
| Perforin | F:
5′-CAGGTCAACATAGGCATCCACG-3′
R: 5′-GAACAGCAGGTCGTTAATGGAG-3′ | 160 |
| Granzyme | B F:
5′-GAAACGCTACTAACTACAGG-3′
R: 5′-CCACTCAGCTAAGAGGT-3′ | 126 |
| FasL | F:
5′-TGTTTATGAGCCAGACAAATGG-3′
R: 5′-AAGACAGTCCCCCTTGAGGT-3′ | 203 |
| TNF-β | F:
5′-AGGCATGAGGGATCACAG-3′
R: 5′-AAAGAGGTTTATTGGGCTTC-3′ | 115 |
| GAPDH | F:
5′-TTCCACCCATGGCAAATTCC-3′
R: 5′-AGGCCATGCCAGTGAGCTTC-3′ | 500 |
| Table IIIConditions of PCR. |
Table III
Conditions of PCR.
| Gene | Conditions |
|---|
| Perforin | Initial
denaturation for 3 min at 94°C, 30 sec at 94°C, 30 sec at 57°C and
1 min at 72°C (40 cycles); a terminal extension for 5 min at
72°C |
| Granzyme B | Initial
denaturation for 3 min at 94°C, 30 sec at 94°C, 30 sec at 53°C and
1 min at 72°C (40 cycles); a terminal extension for 5 min at
72°C |
| FasL | Initial
denaturation for 3 min at 94°C, 30 sec at 94°C, 30 sec at 55°C and
1 min at 72°C (40 cycles); a terminal extension for 5 min at
72°C |
| TNF-β | Initial
denaturation for 3 min at 94°C, 30 sec at 94°C, 30 sec at 54°C and
1 min at 72°C (40 cycles); a terminal extension for 5 min at
72°C |
Co-culture of
CD8+HLA-DR+ T cells with target cells and
analysis of apoptosis by flow cytometry
CD8+HLA-DR+ T cells (effector
cells) from untreated SAA patients, remission patients and normal
controls were co-cultured with bone marrow mononuclear cells (with
CD3+ T cells depleted) from remission patients and
normal controls (target cells). The effector T cells of untreated
SAA patients were co-cultured with the target cells of remission
patients and normal controls, which were designated as SAA groups 1
and 2, respectively. There were two control groups: One was the
remission SAA group (effector cells from untreated SAA patients and
target cells of remission patients) and the other was the normal
control (effector cells from untreated SAA patients and target
cells of normal controls). Apoptosis of target cells was detected
by flow cytometry following staining with Annexin V (BD
Biosciences). The levels of lactate dehydrogenase (LDH; Sigma, St.
Louis, MO, USA) in the supernatant were determined by automatic
biochemistry analyzer (Roche Diagnostics AG, Risch,
Switzerland).
Statistical analysis
Statistical analysis was performed using the
parametric unpaired t-test for normally distributed data, and the
non-parametric unpaired t-test for skewed data. Data are presented
as the mean ± standard deviation. P<0.05 was considered to
indicate a statistically significant difference. All statistical
computations were performed using SPSS statistical software version
19 (SPSS, Inc., Chicago, IL USA).
Results
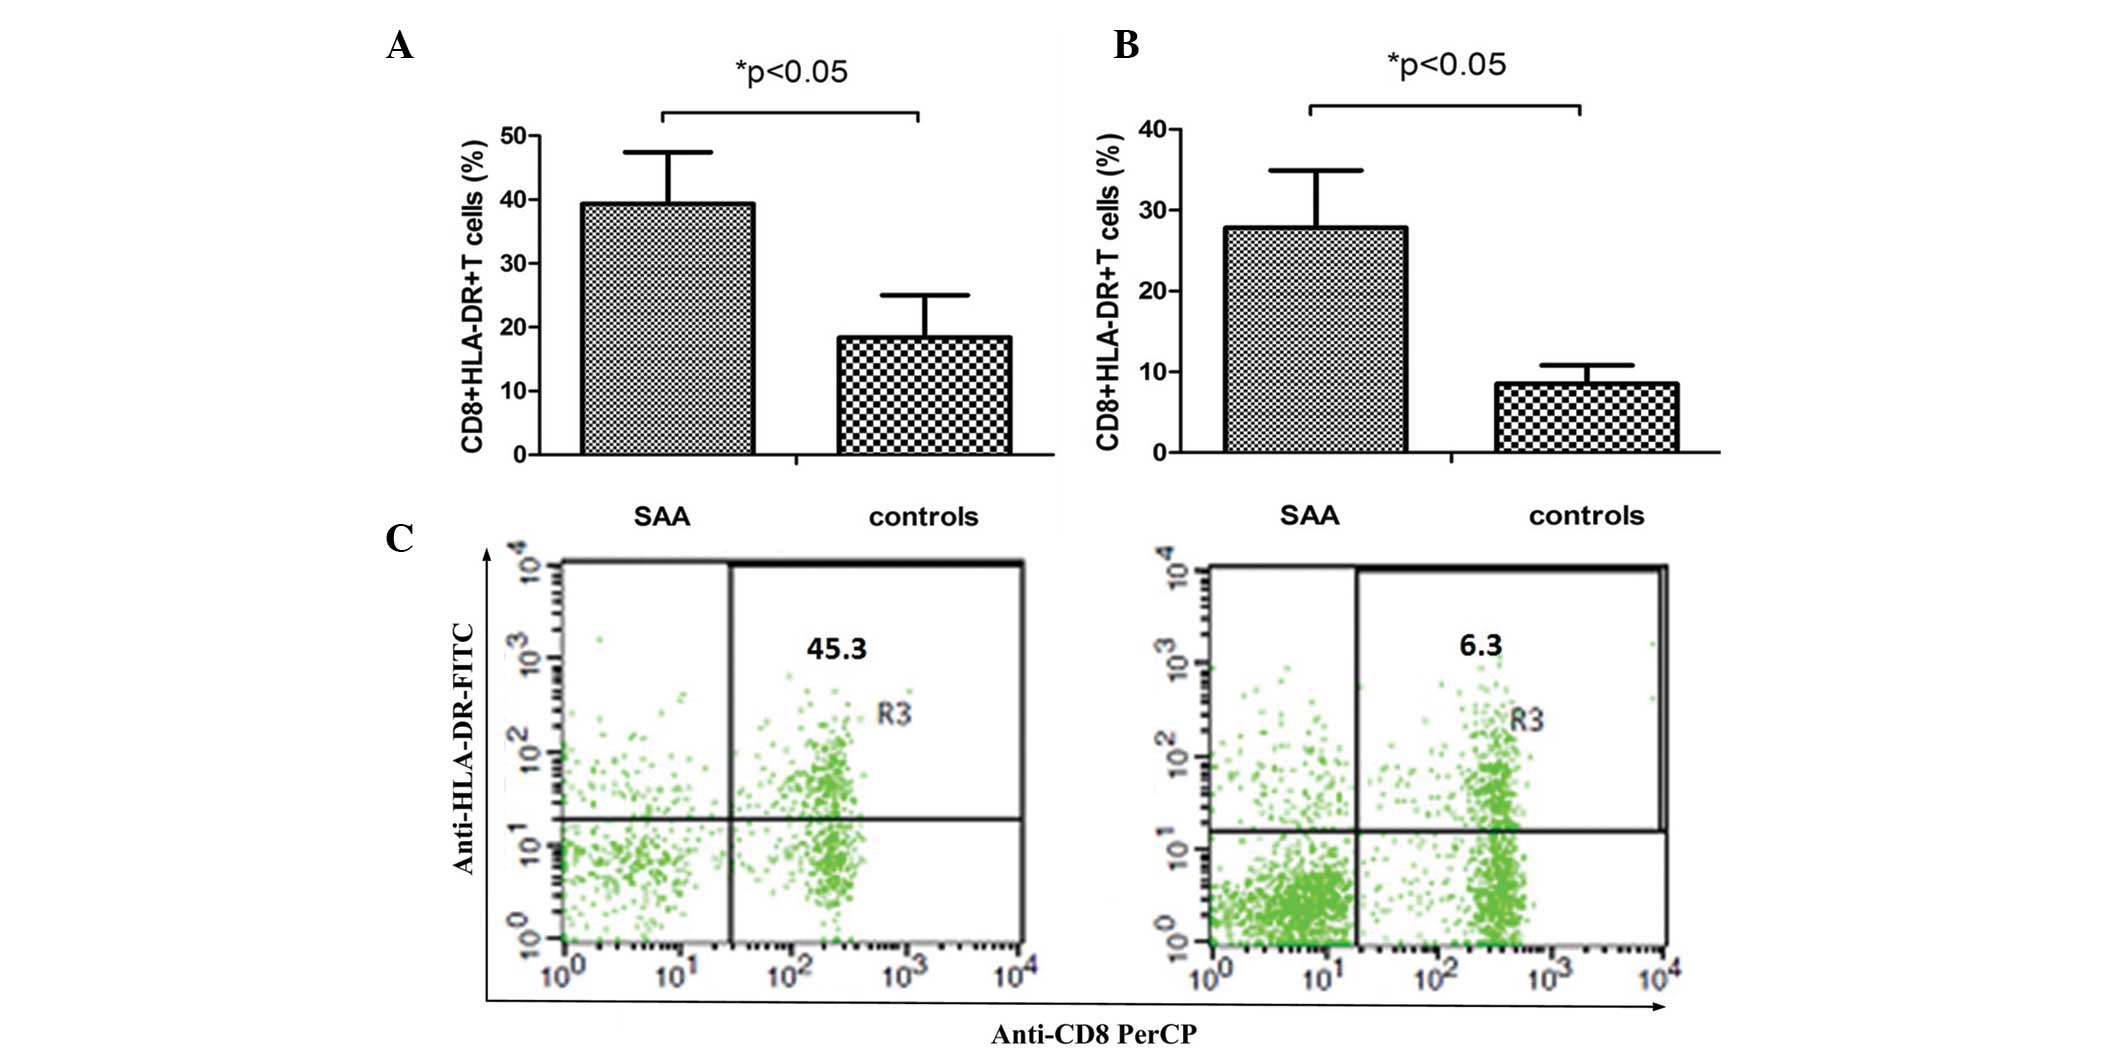
Ratio of
CD8+HLA-DR+ T cells increases in SAA
The ratios of CD8+HLA-DR+ T
cells to CD8+ T cells and to CD3+ T cells
were 39.3±8.1 and 27.8±7.1 in SAA patients, and were significantly
higher than the corresponding ratios in the controls (18.3±6.7 and
8.5±2.3; P<0.05; Fig. 1).
Increased expression of perforin,
granzyme B, TNF-β and FasL in CD8+HLA-DR+ T
cells of SAA patients
The percentages of CD8+HLA-DR+
T cells expressing granzyme B, TNF-β and FasL in in the untreated
SAA group were 8.5, 96.1, 94.3 and 72.1%, respectively, which were
higher than the corresponding values in the control group (1.8,
82.0, 32.9, 15.6%; Fig. 2).
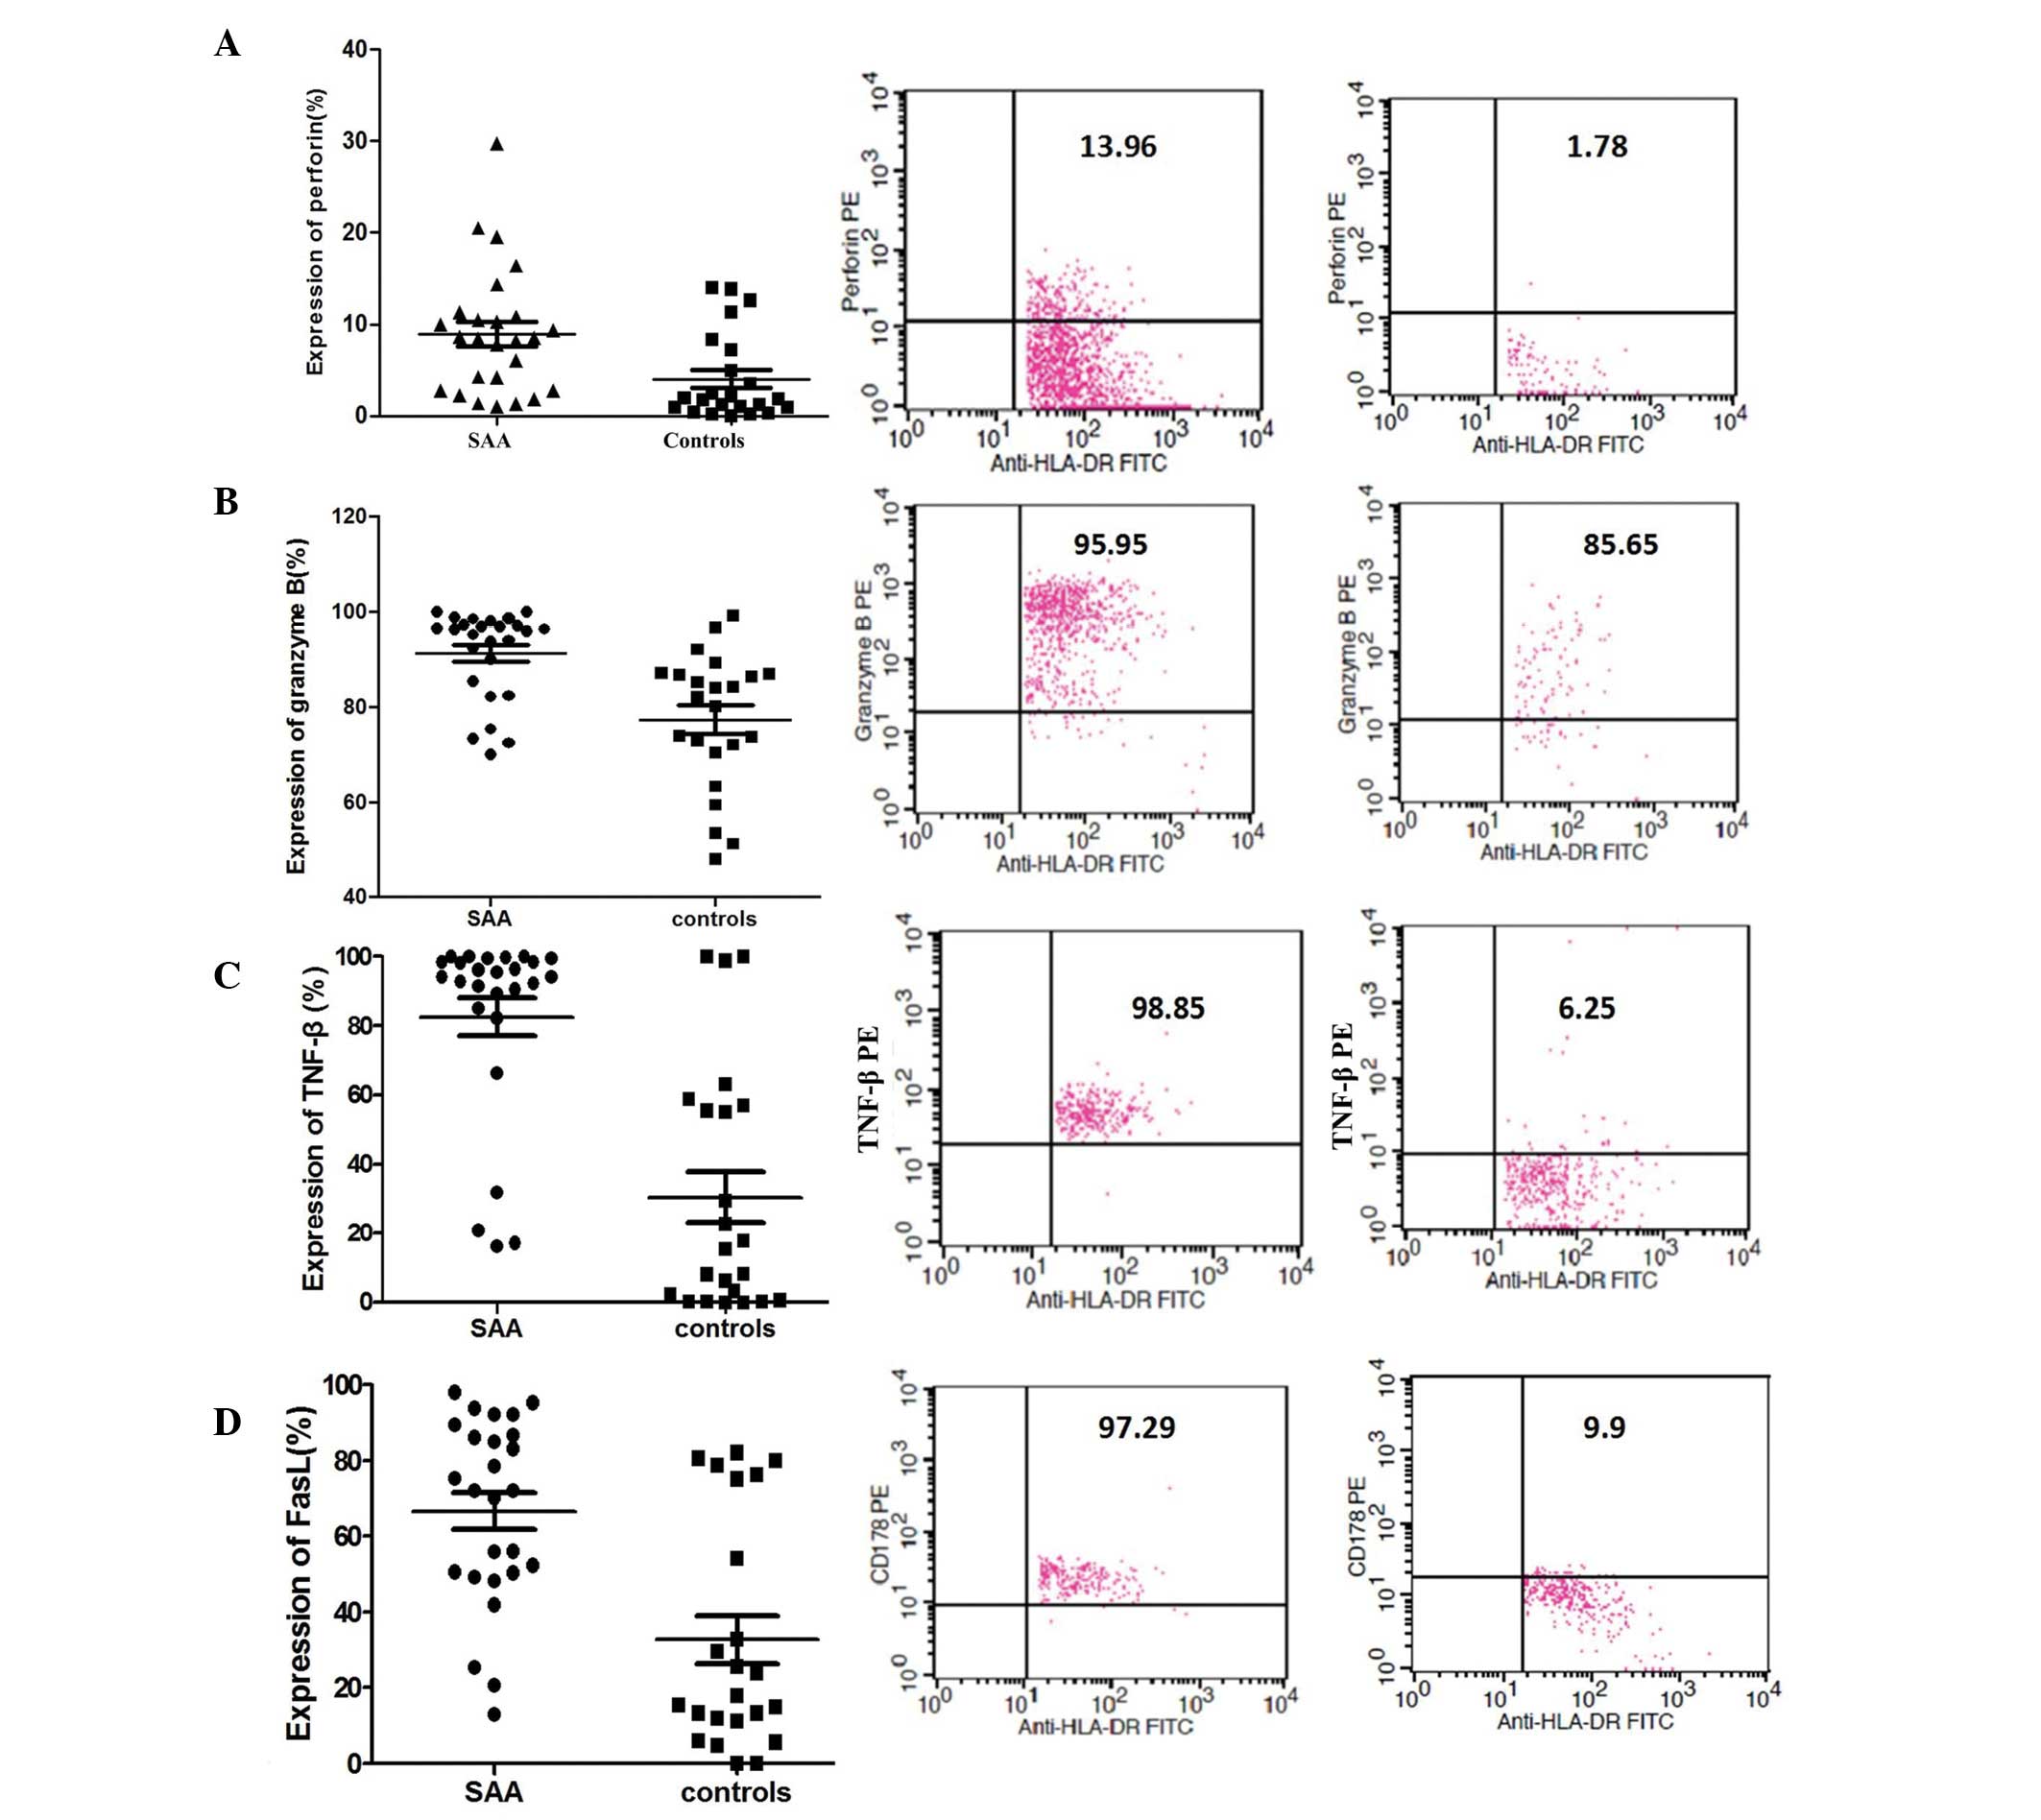 | Figure 2Expression of perforin, granzyme B,
TNF-β and FasL in CD8+HLA-DR+ T cells was
detected by four-color flow cytometry with the following monoclonal
antibodies: Perforin-PE, TNF-β-PE, granzyme B-PE and FasL
(CD178)-PE. Six hours prior to analysis, the peripheral blood
samples were stimulated by short-term culture in RPMI-1640 medium
supplemented with PMA, ionomycin and BFA. The median and the ratio
of these factors are shown. Expression of (A) perforin, (B)
granzyme B, (C) TNF-β and (D) FasL. PMA, phorbol myristate acetate;
BFA, Brefeldin A; TNF-β, tumor necrosis factor-β; FITC, fluorescein
isothiocyanate; PE, phycoerythrin. |
The normalized mRNA expression values for perforin,
granzyme B, TNF-β and FasL in CD8+HLA-DR+ T
cells in the untreated SAA group were 0.66±0.25, 0.56±0.26,
0.61±0.16 and 0.77±0.24, respectively, which were significantly
higher than those in the control group (0.53±0.14, 0.40±0.13,
0.46±0.15 and 0.58±0.16, respectively; P<0.05; Fig. 3).
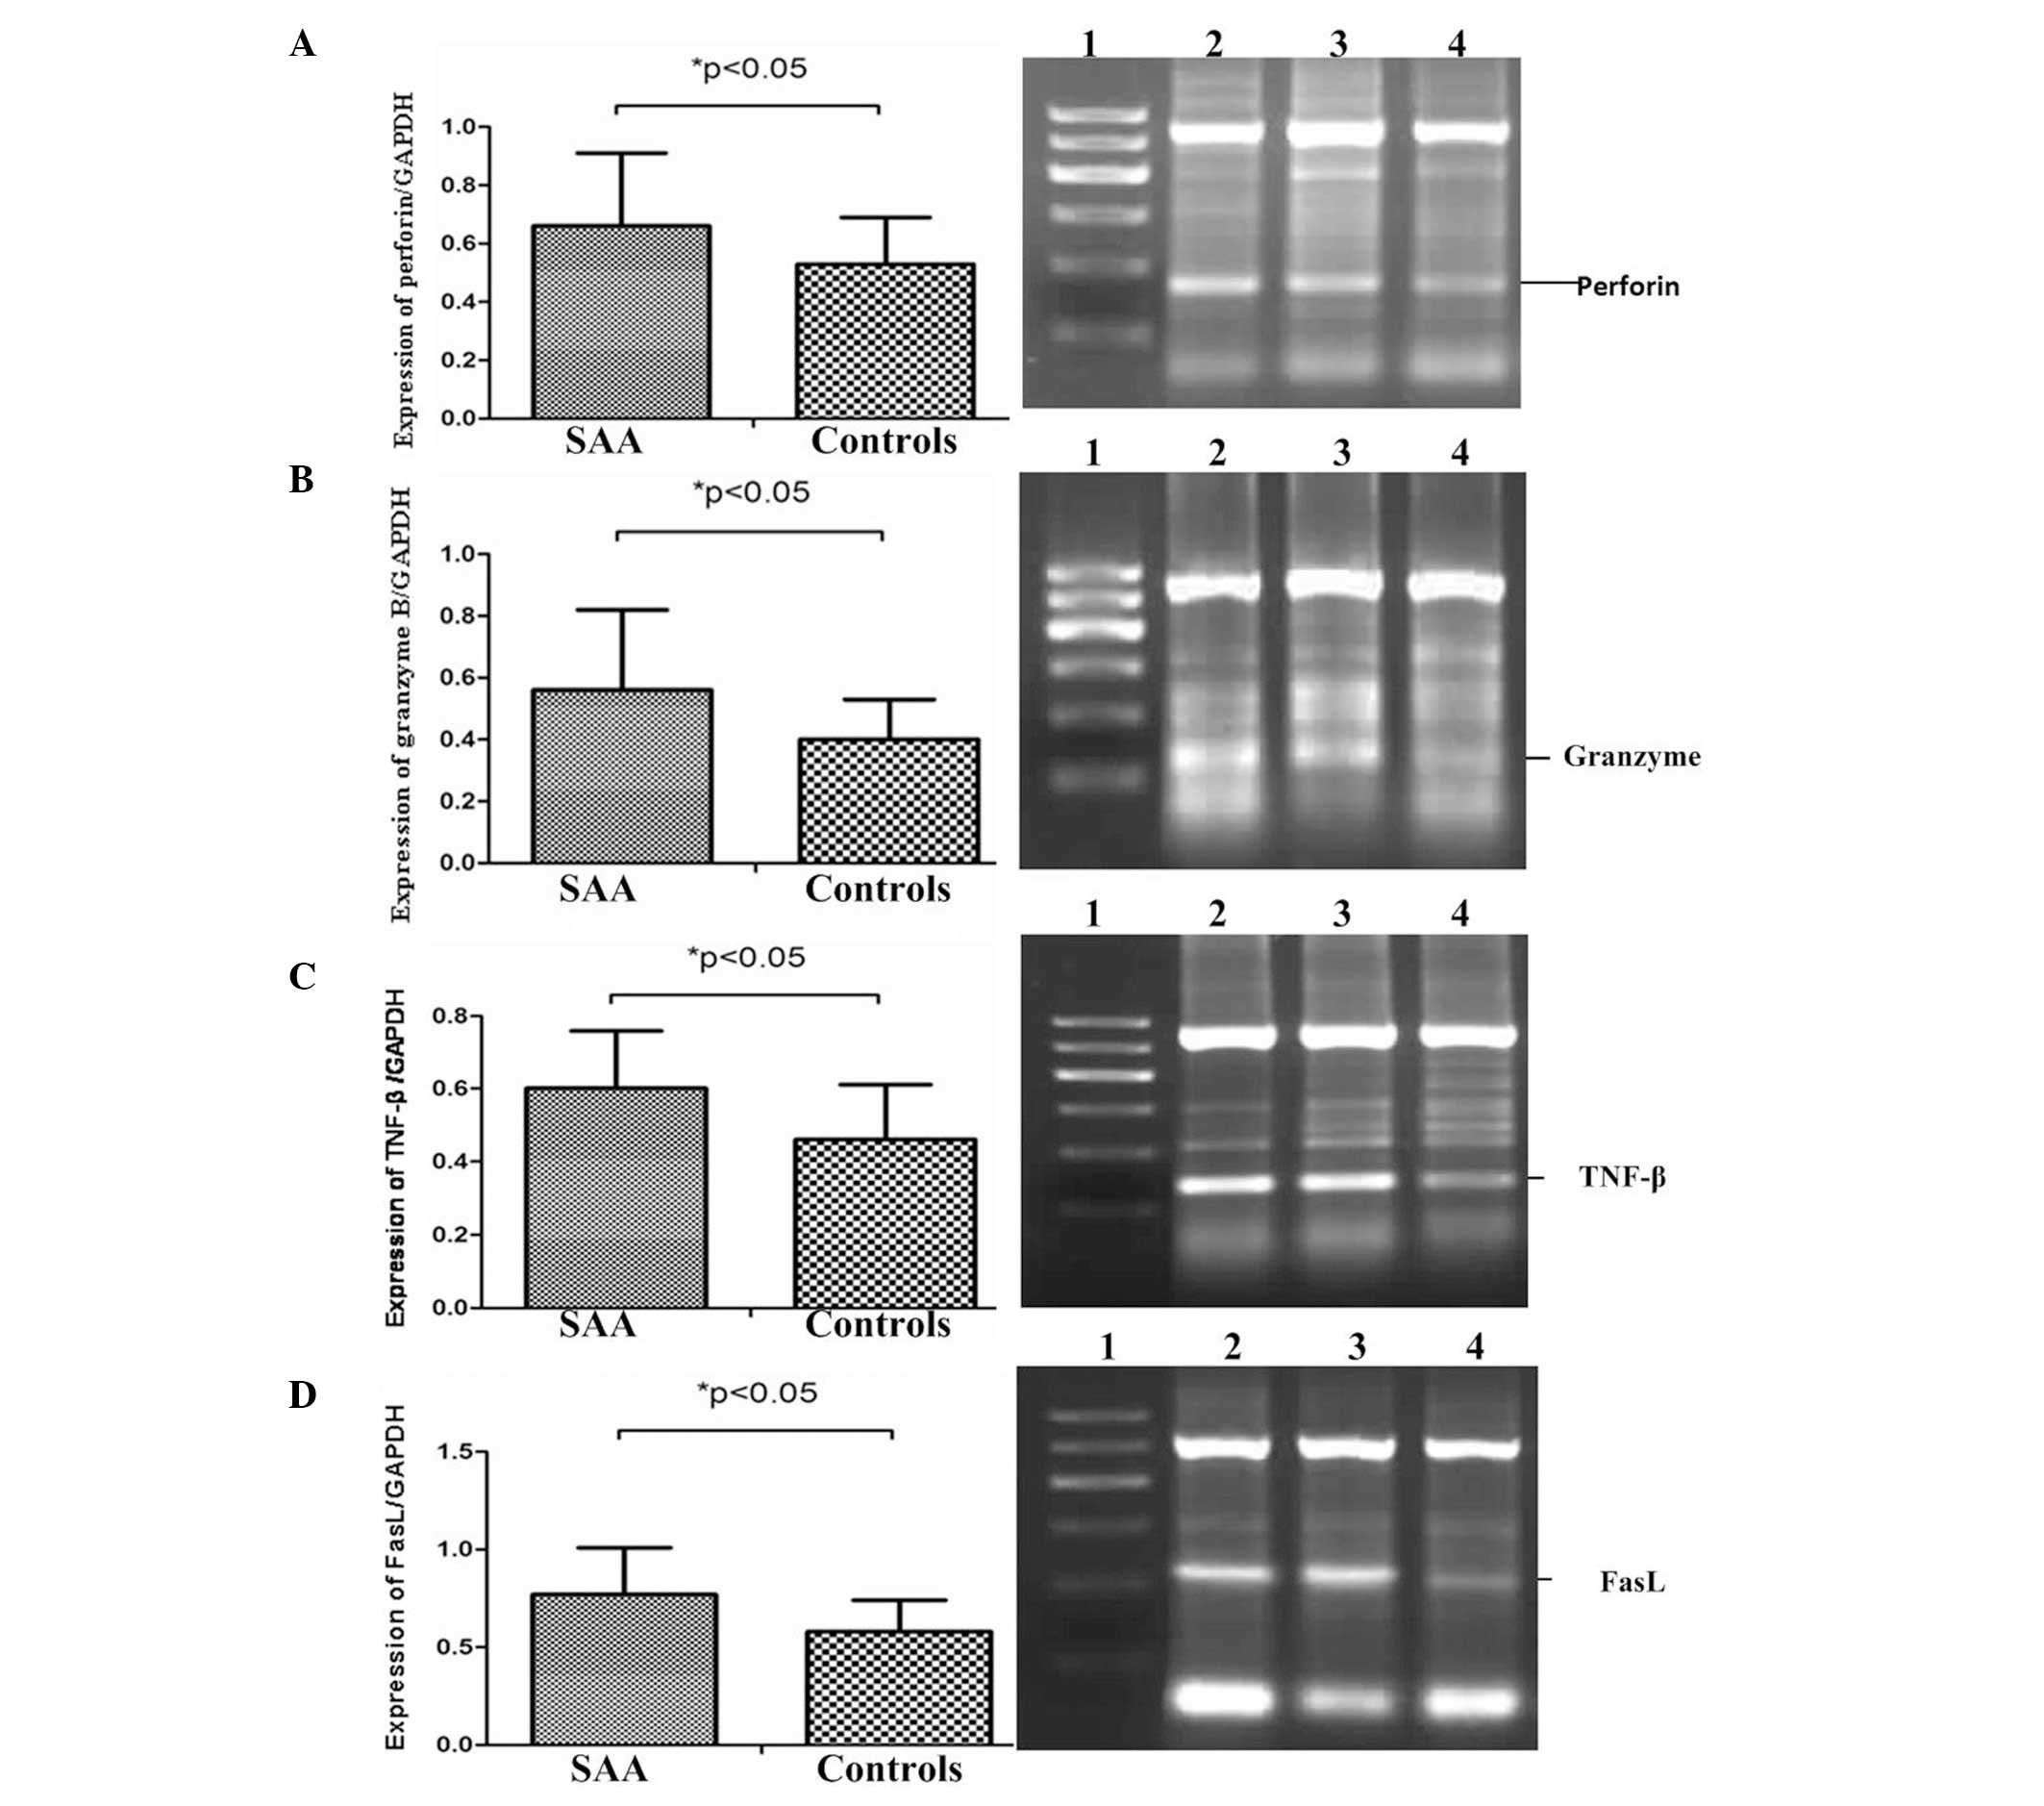 | Figure 3CD8+HLA-DR+ T
cells from SAA patients and healthy controls were purified using a
double positive selection process by MACS separators. The mRNA
expression of perforin, granzyme B, TNF-β and FasL of
CD8+HLA-DR+ T cells was analyzed by
polymerase chain reaction. Transcript copy numbers per subject were
calculated by normalization to GAPDH expression. The expression of
perforin, granzyme B, TNF-β and FasL was significantly different
between SAA patients and healthy controls (*P<0.05).
Expression of (A) perforin/GAPDH, (B) granzyme B/GAPDH, (C)
TNF-β/GAPDH and (D) FasL/GAPDH. Lane 1, 600 bp molecular weight
marker; lanes 2 and 3, SAA patients; lane 4, healthy control. SAA,
severe aplastic anemia; TNF-β, tumor necrosis factor-β. |
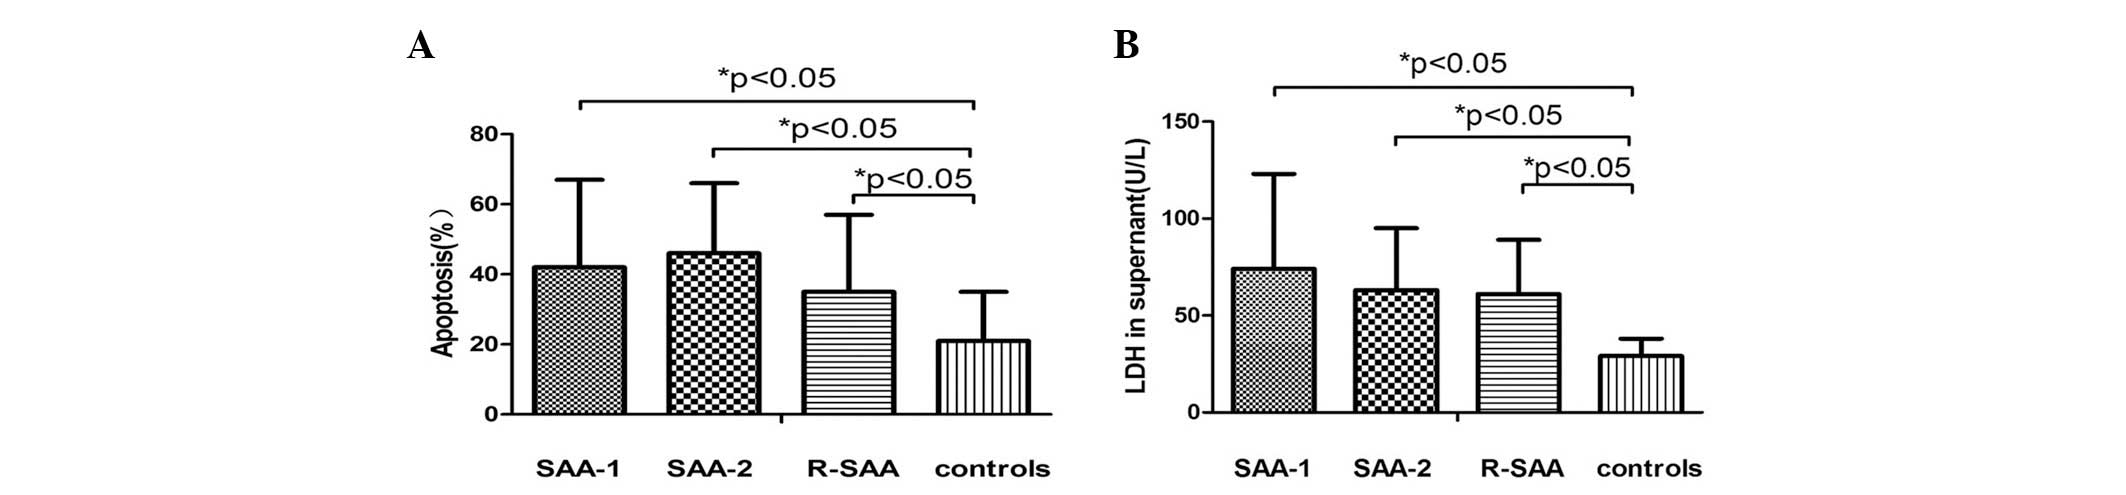
Increased in vitro cytotoxicity in
CD8+HLA-DR+ T cells from untreated SAA
patients
The rates of apoptosis in the SAA group 1
(CD8+HLA-DR+ T cells from untreated SAA
patients and CD3− bone marrow mononuclear cells from
remission patients), SAA group 2 (CD8+HLA-DR+
T cells from untreated SAA patients and CD3− bone marrow
mononuclear cells from normal controls), the remission group
(CD8+HLA-DR+ T cells and CD3− bone
marrow mononuclear cells from remission patients) and the normal
control (CD8+HLA-DR+ T cells and
CD3− bone marrow mononuclear cells from normal controls)
were 41.12±24.84, 45.81±20.47, 35.03±22.09 and 20.95±13.82%,
respectively. There were no significant differences between the SAA
1, SAA 2 and remission groups (P>0.05). However, the rate of
apoptosis in each of these groups was higher than that in the
normal control (P<0.05; Fig.
4).
The LDH levels in the SAA 1, SAA 2, remission and
normal control groups were 74.56±49.13, 62.61±31.76, 61.06±28.41
and 28.60±8.91 U/l, respectively. There were no significant
differences between SAA 1, SAA 2 and remission groups (P>0.05).
However, the levels of LDH in these groups were significantly
higher than those in the normal control (P<0.05; Fig. 4).
Discussion
Numerous studies have established that SAA is an
autoimmune disease caused by cellular immune abnormalities
(6). Several immune abnormalities
have been associated with the pathogenesis of SAA, including a DC
subset imbalance (elevated DC1), enhanced DC function, regulatory T
cell insufficiency, a Th1/Th2 imbalance (enhanced Th1), increased
type I lymphoid factors (IL-2, IFN-γ) and a decreased proportion of
natural killer cells. These abnormalities cause the activation of
CD8+ T cells and excessive expression of apoptosis
ligands in stem cells (7–12). ~70% of SAA patients respond to IST,
including ATG/ALG and CSA (cyclosporine), which further proves that
there must be an aberrant immune activation and tolerance in SAA
(13,14). Although it is well established that
the failure of bone marrow in SAA is due to attack by
CD8+ T cells, the mechanisms underlying this process
have not been elucidated (15). In
the present study, it was demonstrated that the number of
CD8+HLA-DR+ T cells and their expression of
cytotoxic factors was increased in SAA. The in vitro
cytotoxicity of the CD8+HLA-DR+ T cells was
increased compared with healthy controls. Based on these results,
it is concluded that CD8+HLA-DR+ T cells are,
at least in part, responsible for bone marrow failure in SAA.
CD8+ T cells, also termed CTL, damage
their target cells. The MHC II molecule HLA-DR is considered as a
marker of antigen-activated T cells; therefore,
CD8+HLA-DR+ T cells are a subset of activated
effector T cells. Several studies have demonstrated that the
proportion of these cells is significantly decreased in HIV
infection and increased in common variable immunodeficiency disease
(16,17). In the present study, it was
demonstrated that the number of CD8+HLA-DR+ T
cells in patients with SAA was higher than that in the healthy
controls, and it was hypothesized that these cells contribute to
bone marrow failure in SAA.
CD8+HLA-DR+ T cells were
further enriched in SAA in order to analyze their expression of
cytotoxic factors. CTL, which are mainly activated by antigens,
induce apoptosis in target cells by three main pathways (4). Firstly, perforin is a
calcium-dependent pore-forming protein synthesized in cytolytic
lymphocytes and sequestered in secretory granules. Upon
immunological reaction between a cytolytic lymphocyte and a target
cell, perforin is released at the plasma membrane and polymerizes
into transmembrane tubules (forming pores) which triggers the death
of the target cell. Secondly, following binding to its receptors on
target cells, TNF-β secreted from CTL stimulates signaling pathways
leading to apoptosis. Finally, upregulated FasL on CTL binds to Fas
on target cells, leading to activation of the caspase cascade and
target cell apoptosis. Therefore, in order to examine the function
of CD8+HLA-DR+ T cells, their expression of
perforin, granzyme B, FasL and TNF-β were assessed.
Perforin is stored in the cytoplasm of CTL, is the
main cytotoxic protein and an important immune effector (18). Following release by CTLs, perforin
combines with and inserts into the membrane of target cells. The
pores in the membrane formed by perforin induce perturbation of
osmotic pressure between the inside and outside of cells.
Meanwhile, granzyme B enters the target cells through the pores and
initiates apoptosis (19). The
expression of perforin and granzyme B is increased in CTL in
patients with systemic lupus erythematosus and is associated with
disease activity (20). Similarly,
the expression of perforin and granzyme B is also increased in the
blood and local lesions of patients with lichen planus (21).
FasL is predominantly expressed on the surface of
activated T and B lymphocytes, and binds to Fas on target cells to
stimulate the signaling pathways of apoptosis. The interaction
between FasL and Fas polymerizes Fas-associated death domain
protein (FADD) in target cells, recruits caspase 8 and activates a
series of enzyme reactions that ultimately lead to DNA degradation
(22). In a study by Nadeau et
al (23), the levels of FasL
in the plasma and Fas on the neutrophils in pediatric patients with
idiopathic neutropenia were significantly higher than those in
healthy controls.
TNF-β is important in cellular apoptosis, the
inflammatory response and the modulation of the immune system
(24). Activated TNF molecules
trigger TNF receptor polymerization, which subsequently enhances
their affinity for their corresponding ligand. When TNF and TNFR
interact, TNFR activates the caspase cascade, leading to damage of
the mitochondrial membrane and apoptosis of target cells.
Protein and mRNA expression levels of perforin,
granzyme B, TNF-β and FasL were significantly increased in
CD8+HLA-DR+ T cells from SAA patients
compared with those from healthy controls. The increased activation
status of CD8+HLA-DR+ T cells in SAA may
impair hematopoiesis in bone marrow cells through the activity of
perforin, granzyme B, TNF-β and FasL. These markers may also be
useful in the diagnosis of SAA. In future studies, the expression
of perforin, granzyme B, TNF-β and FasL at different stages in
intensive suppressive therapy (IST) treatment will be assessed in
order to determine the optimal regimen, evaluate the therapeutic
effect and elucidate the prognosis for patients.
In the present study,
CD8+HLA-DR+ T cells from untreated SAA
patients, remission patients or healthy controls were co-cultured
with bone marrow mononuclear cells (removing CD3+ T
cells) of the remission patients and healthy controls, and the
cytotoxicity of these co-cultures was assessed. The severity of
bone marrow failure in the patients with SAA prevented us from
using bone marrow mononuclear cells from these patients in
co-culture with CD8+HLA-DR+ T cells from
healthy controls. The CD8+HLA-DR+ T cells
from untreated SAA and remission patients were more cytotoxic than
those from healthy controls; however, there was no significant
difference in cytotoxicity between the cells from untreated SAA and
remission patients. These observations suggested that the induction
of apoptosis in hematopoietic cells by
CD8+HLA-DR+ T cells may be critical in the
bone marrow failure characteristic of SAA. It was previously
reported that 30% of patients may relapse following IST (25). In the present study, the
cytotoxicity of CD8+HLA-DR+ T cells was
reduced following IST treatment, but it did not reach the level of
the control subjects as the normal state. Thus, in order to
decrease the risk of relapse, it is important for patients with SAA
to maintain the IST treatment for a longer period of time and to
taper cyclosporine gradually (26).
In conclusion, the number and cytotoxicity of
CD8+HLA-DR+ T cells in the peripheral blood
of patients with SAA was increased, which may contribute to the
excessive apoptosis of hematopoietic cells in patients with SAA.
CD8+HLA-DR+ T cells appear to have a
prominent role in the immunopathogenesis of SAA and may be used as
a new target for the treatment of SAA. The expression of perforin,
granzyme B, TNF-β and FasL was increased in
CD8+HLA-DR+ T cells. These proteins are
important in the bone marrow failure of SAA and may be useful as
novel diagnostic and therapeutic indexes for SAA.
Acknowledgements
This study was partly supported by the Natural
Science Foundation of China (nos. 30470749, 30971286, 30971285 and
81170472) and the Doctoral Foundation of the Chinese Ministry of
Education (no. 200800620004).
References
|
1
|
Young NS, Bacigalupo A and Marsh JC:
Aplastic anemia: pathophysiology and treatment. Biol Blood Marrow
Transplant. 16(Suppl 1): S119–S125. 2010. View Article : Google Scholar : PubMed/NCBI
|
|
2
|
Bacigalupo A: Aplastic anemia:
pathogenesis and treatment. Hematology Am Soc Hematol Educ Program.
2007:23–28. 2007. View Article : Google Scholar
|
|
3
|
Marsh JC, Ball SE, Cavenagh J, et al:
Guidelines for the diagnosis and management of aplastic anaemia. Br
J Haematol. 147:43–70. 2009. View Article : Google Scholar
|
|
4
|
Keckler MS: Dodging the CTL response:
viral evasion of Fas and granzyme induced apoptosis. Front Biosci.
12:725–732. 2007. View
Article : Google Scholar : PubMed/NCBI
|
|
5
|
Klajman A, Drucker I and Mekori J: The
importance of HLA-DR in autoimmune diseases. Isr J Med Sci.
26:691–692. 1990.PubMed/NCBI
|
|
6
|
Jeong DC, Chung NG, Cho B, et al:
Long-term outcome after immunosuppressive therapy with horse or
rabbit antithymocyte globulin and cyclosporine for severe aplastic
anemia in children. Haematologica. 99:664–671. 2014. View Article : Google Scholar
|
|
7
|
Shao ZH: The research of aplastic anemia.
Basic Clin Med. 27:233–237. 2007.(In Chinese).
|
|
8
|
Zonghong S, Meifeng T, Huaquan W, et al:
Circulating myeloid dendritic cells are increased in individuals
with severe aplastic anemia. Int J Hematol. 93:156–162. 2011.
View Article : Google Scholar : PubMed/NCBI
|
|
9
|
Solomou EE, Keyvanfar K and Young NS:
T-bet, a Th1 transcription factor, is up-regulated in T cells from
patients with aplastic anemia. Blood. 107:3983–3991. 2006.
View Article : Google Scholar : PubMed/NCBI
|
|
10
|
He GS, Shao ZH and He H: Quantitative and
functional changes of T helper cell subsets in the bone marrow of
severe aplastic anemia patients. Zhonghua Xue Ye Xue Za Zhi.
25:613–616. 2004.(In Chinese).
|
|
11
|
Li ZS, Shao ZH, Fu R, et al: Percentages
and functions of natural killer cell subsets in peripheral blood of
patients with severe aplastic anemia. Zhonghua Yi Xue Za Zhi.
91:1084–1087. 2011.(In Chinese).
|
|
12
|
Passweg JR and Marsh JC: Aplastic anemia:
first-line treatment by immunosuppression and sibling marrow
transplantation. Hematology Am Soc Hematol Educ Program.
2010:36–42. 2010. View Article : Google Scholar : PubMed/NCBI
|
|
13
|
Locasciulli A, Oneto R, Bacigalupo A, et
al: Outcome of patients with acquired aplastic anemia given first
line bone marrow transplantation or immunosuppressive treatment in
the last decade: a report from the European Group for Blood and
Marrow Transplantation (EBMT). Haematologica. 92:11–18. 2007.
View Article : Google Scholar
|
|
14
|
Hattori M, Terasawa T, Tsushita K, et al:
The status of antithymocyte globulin therapy for adult patients in
Japan: retrospective analysis of a nationwide survey. Int J
Hematol. 87:48–55. 2008. View Article : Google Scholar
|
|
15
|
Young NS: Pathophysiologic mechanisms in
acquired aplastic anemia. Hematology Am Soc Hematol Educ Program.
2006:72–77. 2006. View Article : Google Scholar
|
|
16
|
Mekmullica J, Brouwers P, Charurat M, et
al: Early immunological predictors of neurodevelopmental outcomes
in HIV-infected children. Clin Infect Dis. 48:338–346. 2009.
View Article : Google Scholar : PubMed/NCBI
|
|
17
|
Viallard JF, Blanco P, André M, et al:
CD8+HLA-DR+ T lymphocytes are increased in
common variable immunodeficiency patients with impaired memory
B-cell differentiation. Clin Immunol. 119:51–58. 2006.
|
|
18
|
Pipkin ME and Lieberman J: Delivering the
kiss of death: progress on understanding how perforin works. Curr
Opin Immunol. 19:301–308. 2007. View Article : Google Scholar : PubMed/NCBI
|
|
19
|
Pardo J, Aguilo JI, Anel A, et al: The
biology of cytotoxic cell granule exocytosis pathway: granzymes
have evolved to induce cell death and inflammation. Microbes
Infect. 11:452–459. 2009. View Article : Google Scholar : PubMed/NCBI
|
|
20
|
Blanco P, Pitard V, Viallard JF, et al:
Increase in activated CD8+ T lymphocytes expressing
perforin and granzyme B correlates with disease activity in
patients with systemic lupus erythematosus. Arthritis Rheum.
52:201–211. 2005.
|
|
21
|
Prpić Massari L, Kastelan M, Gruber F, et
al: Perforin expression in peripheral blood lymphocytes and
skin-infiltrating cells in patients with lichen planus. Br J
Dermatol. 151:433–439. 2004.PubMed/NCBI
|
|
22
|
Lettau M, Paulsen M, Kabelitz D and
Janssen O: FasL expression and reverse signalling. Results Probl
Cell Differ. 49:49–61. 2009. View Article : Google Scholar
|
|
23
|
Nadeau KC, Callejas A, Wong WB, et al:
Idiopathic neutropenia of childhood is associated with Fas/FasL
expression. Clin Immunol. 129:438–447. 2008. View Article : Google Scholar : PubMed/NCBI
|
|
24
|
Takaoka Y, Abe Y, Haraguchi R and Kito K:
Lymphotoxin (TNF-beta). Nihon Rinsho. 68(Suppl 7): 93–95. 2010.(In
Japanese).
|
|
25
|
Kamio T, Ito E, Ohara A, et al: Relapse of
aplastic anemia in children after immunosuppressive therapy: a
report from the Japan Childhood Aplastic Anemia Study Group.
Haematologica. 96:814–819. 2011. View Article : Google Scholar
|
|
26
|
Bacigalupo A, Bruno B, Saracco P, et al:
Antilymphocyte globulin, cyclosporine, prednisolone, and
granulocyte colony-stimulating factor for severe aplastic anemia:
an update of the GITMO/EBMT study on 100 patients. European Group
for Blood and Marrow Transplantation (EBMT) Working Party on Severe
Aplastic Anemia and the Gruppo Italiano Trapianti di Midolio Osseo
(GITMO). Blood. 95:1931–1934. 2000.
|