Introduction
Idiopathic hypercalciuria (IH), as a metabolic
alteration of high prevalence, is considered a risk factor for
urolithiasis. Several linkage studies of patients with
calcium-containing urolithiasis and IH have indicated an
association with the 12q12-14 chromosomal locus, which contains the
vitamin D receptor (VDR) gene. In a study of 150 patients with
nephrolithiasis from northern India, Relan (1) demonstrated that VDR genotypes
appeared to correlate with increased calcium excretion in
hypercalciuric nephrolithiasis. In 2004, Favus (2) observed that the peripheral blood
monocyte VDR was two-fold greater in the male calcium oxalate stone
formers with IH compared with controls. These indicated that
elevated levels of the VDR may account for the excess urine calcium
and kidney stone formation.
The link between urolithiasis and vascular disease
is well documented. Vascular calcification is a cell osteogenic
phenotype transition, which involves numerous osteogenic factors
synthesized by vascular smooth muscle cells (VSMCs), including bone
morphogenetic protein 2 (BMP2), runt-related transcription factor 2
(Runx2), alkaline phosphatase (ALP), type I collagen and
osteocalcin, and are usually associated with the induction of bone
formation (3–6). Therefore, osteogenic factors may
assist in understanding kidney stone formation.
A colony of genetic hypercalciuric rats has been
previously established (7). This
rat model of hypercalciuria consistently excretes more calcium in
urine and contains higher levels of VDR in the duodenum and kidney
compared with control rats (7,8). In
our previous study, several osteogenic factors, including BMP2,
Runx2, Osterix and osteopontin, were found to be significantly
higher in genetic hypercalciuric rat kidney tissue than in control
rat tissue (9). Therefore, stone
formation in kidney tissue may proceed in the same manner as bone
formation, and this process may be regulated by VDR. However, the
role of VDR and these osteogenic factors remains to be fully
elucidated. The aim of the present study was to investigate the
association between VDR, osteogenic factors and calcium and
elucidate the regulatory mechanism of VDR in vitro using
genetic hypercalciuric rats.
Materials and methods
Genetic hypercalciuric rats
All animal procedures were approved by the ethics
committee of Huazhong University of Science and Technology (Wuhan,
China). Adult Sprague-Dawley (SD) rats (Experimental Animal Center,
Tongji Medical College, Huazhong University of Science and
Technology) were placed in individual metabolic cages and fed with
13 g/day of a diet containing 1.2% calcium, 0.65% phosphorus, 0.43%
chloride, 0.4% sodium and 0.24% magnesium (Changsha Tianqin
Biotechnology Co., Ltd., Changsha, China). Classification of rats
as hypercalciuric was performed at the time of weaning. The genetic
hypercalciuric rats were defined as those with urine Ca excretion
>1.5 mg/24 h on two successive 24 h urine collections. The male
and female rats with the highest levels of Ca excretion were
screened and matched to propagate the colony. The male
hypercalciuric rats from generation 23, with a body weight between
180 and 220 g were used in the present study. All animal procedures
were approved by the Animal Care Committees of Huazhong University
of Science and Technology University.
Primary renal tubular epithelial cells
(RTECs)
The rats were anesthetized with an intraperitoneal
injection into the abdominal cavity of 3% pentobarbital sodium
(Beijing Propbs Biotechnology Co., Ltd, Beijing, China). The
kidneys were removed from the rats, following ligation of the renal
pedicle vessels. The average length and width of the kidneys were
17.58±0.82 mm and 8.01±0.92 mm, respectively. Primary RTECs
(PriCell Research Institute, Wuhan, China) were isolated from the
genetic hypercalciuric rat kidneys and identified by an evaluation
for tetramethylrhodamine-marked E-cadherin (Wuhan Amyjet Scientific
Co., Ltd., Wuhan, China) (Fig.
1A). All cells were maintained in Dulbecco’s modified Eagle’s
medium (DMEM) (PriCell, China) supplemented with 10% fetal bovine
serum, and were incubated in a humidified atmosphere containing 5%
CO2 at 37°C. The third generation of RTECs were used for
the subsequent experiments.
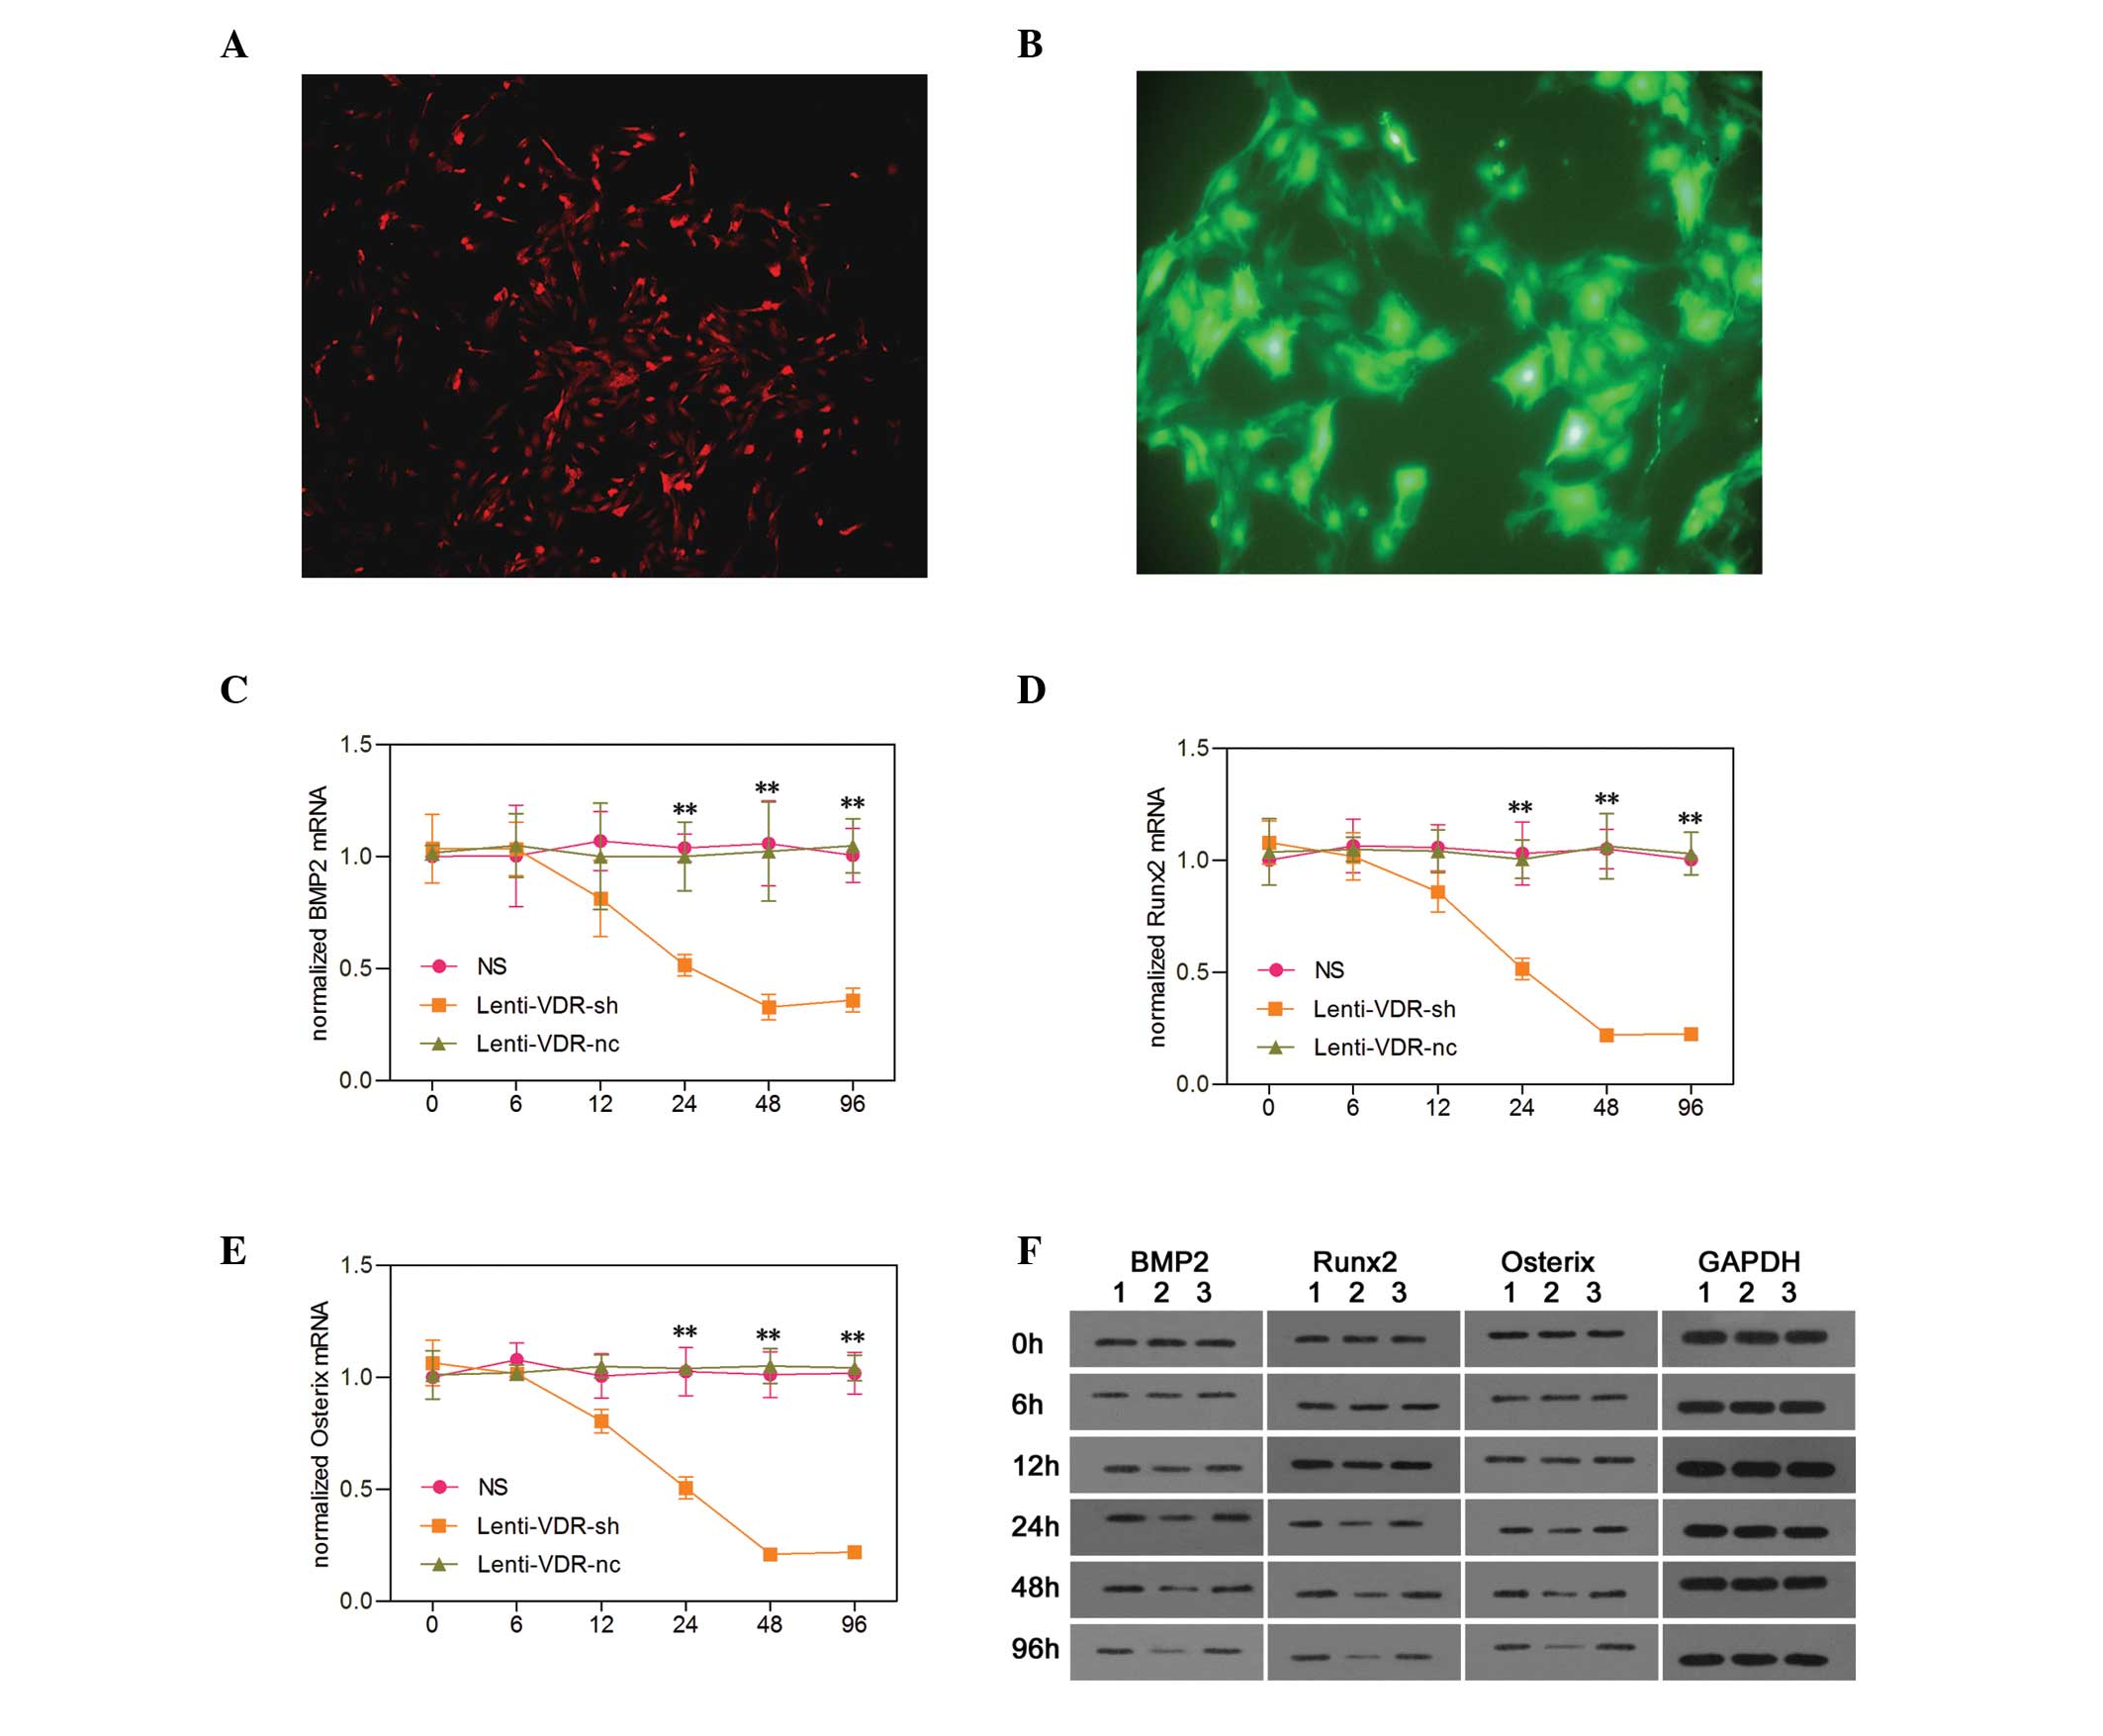 | Figure 1Effect of VDR depletion on the
expression levels of osteogenic factors in primary RTECs. (A)
Expression of E-cadherin in RTECs, stained using
tetramethylrhodamine (magnification, ×100). (B) Identification of
the RTEC-infected lentivirus vector (magnification, ×100). Using
reverse transcription-quantitative polymerase chain reaction, the
mRNA expression levels of (C) BMP2, (D) Runx2 and (E) Osterix were
measured in the NS, Lenti-VDR-sh and Lenti-VDR-nc groups at
different time-points. The expression was normalized to that of the
β-actin gene for each sample. Data are expressed as the mean ±
standard deviation. **P<0.01 vs. NS. (F) Western blot
analysis was performed to determine the protein expression levels
of BMP2, Runx2 and Osterix in the NS, Lenti-VDR-sh and Lenti-VDR-nc
groups at different time-points after treatment. The expression
level of GAPDH was determined to ensure equal loading. Lane 1: NS,
lane 2: Lenti-VDR-sh, lane 3: Lenti-VDR-nc. RTEC, renal tubular
epithelial cell; VDR, vitamin D receptor; BMP2, bone morphogenetic
protein 2; Runx2, runt-related transcription factor 2; NS, normal
saline nc, negative control. |
Tetramethylrhodamine staining
Coverslips were placed onto a 12-well plate and
cells were grown in culture media until they reached 50%
confluence. The media was aspirated from the plates and washed
twice with phosphate-buffered saline (PBS). The cells were fixed
with 4% paraformaldehyde solubilized in PBS-0.1% Triton X-100 for
20 min at room temperature. The cells were then blocked for 1 h
with 2 ml 1X PBS-1%/bovine serum albumin-4%. They were then washed
twice for 5 min with 2 ml 1X PBS. Diluted primary antibody (rabbit
anti-rat E cadherin antibody; 30 μl) was added to each well
and incubated at 37°C for 30 min. Diluted secondary antibody
(tetramethylrhodamine marked goat anti-rabbit IgG; 30 μl)
was then added to each well and incubated at 37°C for 30 min. The
cover glass was removed and washed five times for 5 min in 45°C
washing solution at room temperature.
Lentiviral vectors
A lentiviral vector containing small hairpin (sh)RNA
specifically targeting rat VDR, to silence the gene, was
constructed by Genechem Co. Ltd (Shanghai, China), and classified
as Lenti-VDR-sh. The targeting sequence of the shRNA, as described
previously, was 5′-TGACCAGATTGTCCTGCTTAA-3′ (9). As a control, a negative control (nc)
vector (Genechem, Shanghai, China) was used, termed Lenti-VDR-nc.
These two lentiviral expression vectors contained the reporter gene
of green fluorescent protein (GFP). The lentiviral stocks were
stored in small aliquots (50 μl) at −80°C for titration and
cell infection. The prepared RTECs were transfected with either
Lenti-VDR-sh or Lenti-VDR-nc. The cells were transfected with
Lenti-VDR-sh at 1×10⁶ TU/ml at 37°C, and harvested at 0,
6, 12, 24, 48 and 96 h post-transfection. The transfection
efficiency was detected directly by assessing the expression ratio
of GFP by fluorescence microscopy (TE2000U; Nikon Corporation,
Tokyo, Japan).
Experiment procedures
Experiment one
The RTECs were seeded into six-well plates at a
density of 2×10⁵ cells/well. In group 1, the RTECs were
treated with normal saline (NS) as a control. In group 2, the cells
were transduced with Lenti-VDR-sh at 1×10⁶ TU/ml at
37°C. As a negative control, the cells were incubated with
Lenti-VDR-nc and classified as group 3. The cells were harvested
following 0, 6, 12, 24, 48 and 96 h of infection, and cells
expressing green fluorescence were identified using a fluorescence
microscope (Fig. 1B). The gene and
protein levels of BMP2, Runx2 and Osterix were detected using
reverse-transcription-quantitative polymerase chain reaction
(RT-qPCR) and western blot assays, respectively.
Experiment two
The RTECs were seeded into six-well plates at a
density of 5×10⁵ cells per well. The cells were cultured
with 10−8 mol/l 1,25(OH)2D3 at
room temperature, and harvested following 0, 6, 12, 24, 48 and 96 h
of treatment. Using an o-cresolphthalein complexone method, the
calcium levels in the primary RTECs were measured.
Experiment three
The RTECs were cultured with NS or calcium in
Ca2+-1 (10−10 mol/l), Ca2+-2
(10−9 mol/l), Ca2+-3 (10−8 mol/l)
or Ca2+-4 (10−7 mol/l), and harvested
following 0, 12, 24 and 48 h, respectively. The cells were
collected after 0, 12, 24 and 48 h, respectively. The gene and
protein levels of BMP2, Runx2 and Osterix were detected using
RT-qPCR and western blot assays, respectively.
RT-qPCR analysis
Total RNA was isolated from the primary RTECs using
TRIzol Reagent (Invitrogen Life Technologies, Carlsbad, CA, USA),
according to the manufacturer’s instructions. The cDNA synthesis (2
μg of total RNA) was performed using oligod (T) primer and
Moloney Murine Leukemia Virus reverse transcriptase (Takara Bio,
Inc., Shiga, Japan), according to the manufacturer’s instructions.
The mRNA levels of BMP2, Runx2, Osterix and the housekeeping gene,
β-actin, were analyzed by qPCR on a Light Cycler Real Time PCR
system (Roche Diagnostics, Basel, Switzerland). The qPCR reactions
were performed using SYBR Green PCR Master mix (Takara Bio, Inc).
Thermocycling was performed at a final volume of 20 μl,
which contained 2 μl cDNA and 400 nM of each of the forward
and reverse primers. The qPCR reaction was performed using the
following program: 95°C for 10 min, 40 cycles of 95°C for 30 sec,
60°C for 30 sec, and 72°C for 30 sec. The primer sequences of BMP2,
Runx2, Osterix and β-actin are described in Table I. The threshold cycle (Ct) values
were analyzed using the comparative Ct (ΔΔCt) method
(10) and normalized to the
endogenous control, β-actin. Fold changes were calculated using the
2−ΔΔCt method.
 | Table ISequences of the rat primers used for
reverse transcription-quantitative polymerase chain reaction. |
Table I
Sequences of the rat primers used for
reverse transcription-quantitative polymerase chain reaction.
| Gene | Forward primer | Reverse primer | Primer length
(bp) |
|---|
| BMP2 |
5′-ACCAGACTATTGGACACCAG-3′ |
5′-AATCCTCACATGTCTCTTGG-3′ | 237 |
| Runx2 |
5′-TCCCATCTGCTAGAAGTGTT-3′ |
5′-TTAGCCAGCTCACTTTCTTC-3′ | 202 |
| Osterix |
5′-AAGCCATACACTGACCTTTC-3′ |
5′-GTGGGTAGTCATTGGCATAG-3′ | 191 |
| β-actin |
5′-AAGAGCTATGAGCTGCCTGA-3′ |
5′-TACGGATGTCAACGTCACAC-3′ | 159 |
Western blot analysis
The total proteins (50 μg) harvested from
each sample were separated by 12% SDS-PAGE (Shenzhen Qi Hong Yuan
Technology Co., Ltd., Shenzhen, China) and transferred onto
polyvinylidene difluoride membranes (Millipore, Bedford, USA).
Nonspecific reactivity was blocked using 5% nonfat dry milk in
Tris-buffered saline with Tween 20 (TBST; Shanghai Shifeng
Biotechnology, Co., Ltd., Shanghai, China) for 2 h at 22°C. The
membrane was then incubated with goat polyclonal BMP2 antibody
(cat. no. SC-6895; 1:500; Santa Cruz Biotechnology, Inc., Dallas,
TX, USA), goat polyclonal Runx2 antibody (cat. no. SC-8566; 1:400;
Santa Cruz Biotechnology, Inc.) or goat polyclonal Osterix antibody
(cat. no. SC-22538 1:400; Santa Cruz Biotechnology, Inc.) overnight
at 4°C, followed by reaction with horseradish peroxidase-conjugated
goat anti-mouse or rabbit anti-goat antibody (cat. nos. BA1050 and
BA1060; 1:40,000 or 1:50,000; Boster Systems, Inc., Pleasanton, CA,
USA) for 2 h at 22°C. The reactive protein was detected using an
enhanced chemiluminescence system (GE Healthcare, Amersham,
UK).
Quantification of calcium
deposition
The cells were decalcified using 0.6 N HCl (Shenzhen
Qihongyuan Technology Co., Ltd., Shenzhen, China) for 24 h. The
calcium content of the HCl supernatants were determined
colorimetrically using the o-cresolphthalein complexone method
(Calcium kit; Sigma-Aldrich, St. Louis, MO, USA), as previously
described (10). Following
decalcification using 0.6 N HCl for 24 h, the cells were washed
three times with PBS and solubilized with 0.1 N NaOH/0.1% SDS. The
protein content was measured using a Bicinchoninic Acid Protein
Assay kit (Pierce Biotechnology, Inc., Rockford, IL, USA). The
calcium content of the cell layer was normalized to the protein
content.
Statistical analysis
The data were analyzed using Statistical Package for
Social Science (SPSS) 10.0 (SPSS, Inc., Chicago, IL, USA). The
values are expressed as the mean ± standard deviation. Unpaired
Student’s t-tests (two-tailed) were used to compare the means
between two independent groups/samples. General linear models (GLM)
for repeated measures were used for comparisons over time. If the
global tests from the GLM were significant, Bonferroni’s tests were
used for pairwise comparisons. Multiple comparisons between
experimental groups were performed on the data obtained from three
independent experiments using one-way analysis of variance (ANOVA)
followed by Bonferroni’s post-hoc test. P<0.05 was considered to
indicate a statistically significant difference.
Results
Effect of VDR knockdown on the expression
of osteogenic factors in primary RTECs
As shown in Fig. 1,
no significant differences were detected in mRNA expression levels
of BMP2, Runx2 or Osterix among the NS, Lenti-VDR-sh and
Lenti-VDR-nc groups at the beginning of the experiment (0 h).
However, 24, 48 and 96 h after infection, the mRNA expression
levels of BMP2, Runx2 and Osterix were markedly decreased in the
Lenti-VDR-sh group compared with the NS and Lenti-VDR-nc groups,
and in the latter less than in the former. By contrast, no
significant differences were identified in the mRNA expressionu
levels of BMP2, Runx2 and Osterix between the NS and Lenti-VDR-nc
groups. At 12 h, the expression levels of BMP2, Runx2 and Osterix
appeared to be lower in the Lenti-VDR-sh group compared with the NS
and Lenti-VDR-nc groups, however, no significant differences were
observed among the NS, Lenti-VDR-sh and Lenti-VDR-nc groups. The
lowest mRNA level was observed at 48 and 96 h in the Lenti-VDR-sh
group, with no significant change observed between these two time
points.
The western blot analysis revealed similar change in
protein expression levels as those observed in the mRNA expression
levels following silencing of the VDR gene in the primary RTECs. As
shown in Fig. 1, the protein
levels of osteogenic factors were markedly decreased at 24, 48 and
96 h in the Lenti-VDR-sh group (lane 2). Conversely, the protein
levels of BMP2, Runx2 and Osterix were not altered following
treatment in the NS or Lenti-VDR-nc groups (lanes 1 and 3).
Effect of VDR depletion on calcium
deposition in primary RTECs
The quantities of calcium deposition in primary
RTECs was determined colorimetrically using the o-cresolphthalein
complex one method, as previously described (11). As shown in Fig. 2, no significant differences were
identified in calcium deposition in the primary RTECs among the NS,
Lenti-VDR-sh or Lenti-VDR-nc groups at the beginning of experiment.
A decrease in the calcium content of the primary RTECs was observed
as early as 12 h following exposure to Lenti-VDR-sh, and the lowest
level was observed at 48 h. However, the total levels of calcium
deposition in the cells in the NS and Lenti-VDR-nc groups were
unchanged during the experiment.
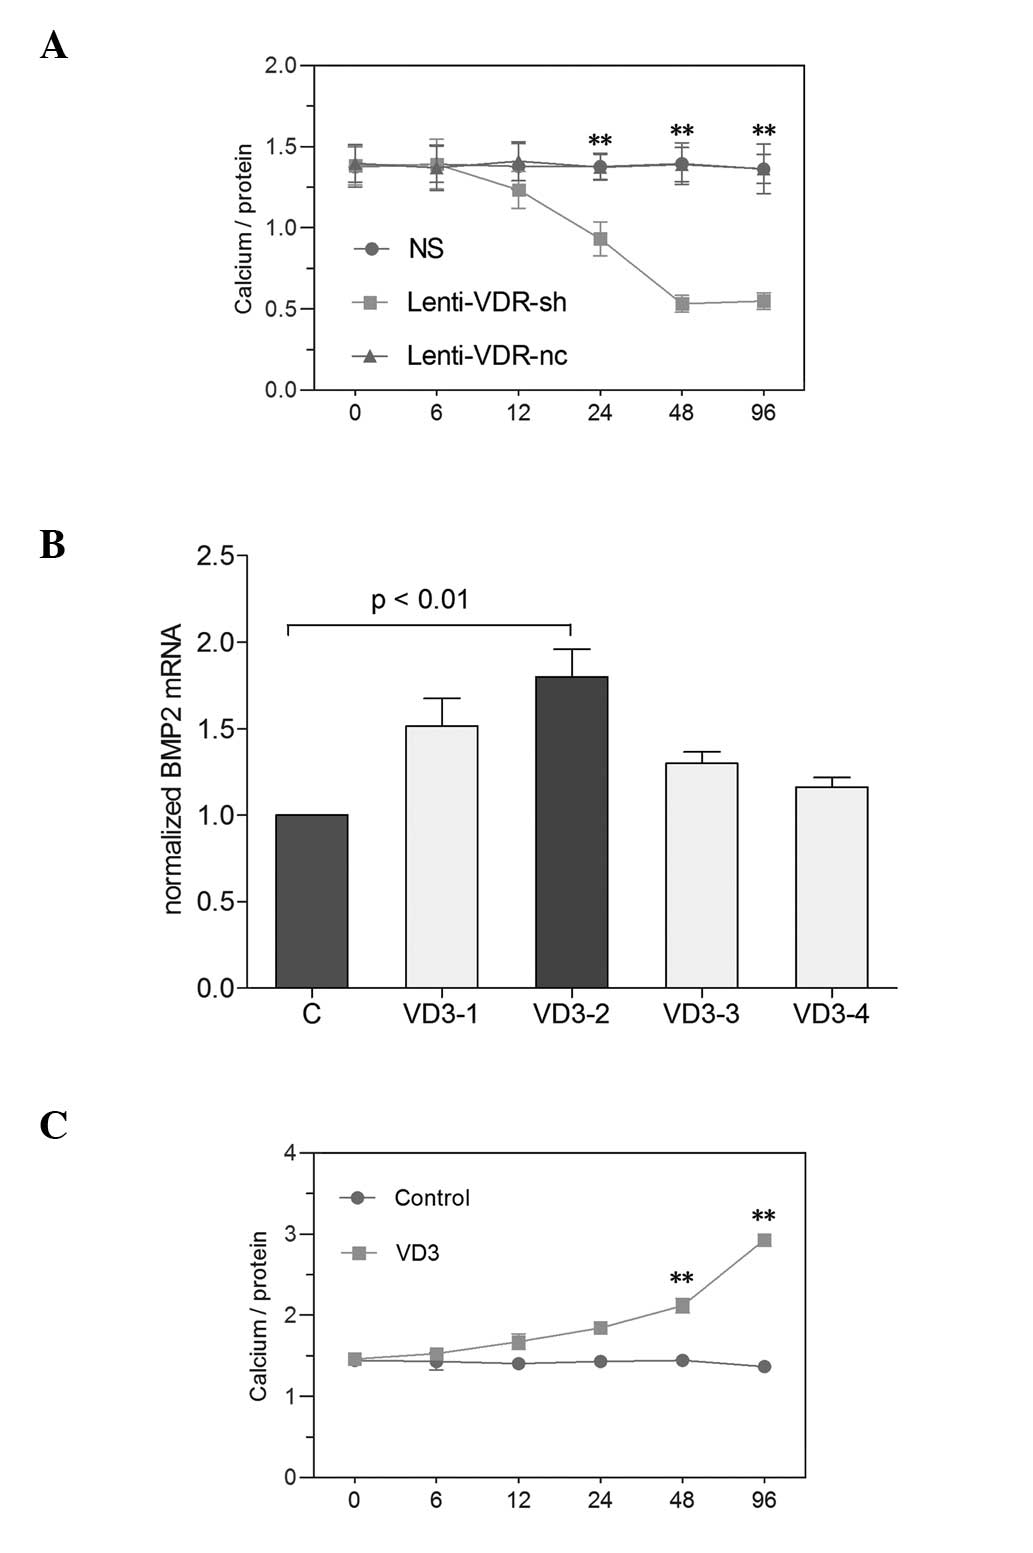 | Figure 2Effect of silencing the VDR gene and
increased 1,25(OH)2D3 on calcium levels in
primary RTECs. Primary RTECs were treated with NS, Lenti-VDR-sh or
Lenti-VDR-nc and harvested 0, 6, 12, 24, 48 and 96 h after
treatment. (A) Calcium levels in the RTECs were determined
colorimetrically using the o-cresolphthalein complexone method.
Calcium content was normalized to the protein content
(calcium/protein). **P<0.01 vs. NS. (B) RTECs were
cultured for the indicated durations with NS, VD3-1
(10−7 mol/l), VD3-2 (10−8 mol/l),
VD3-3 (10−9 mol/l) or VD3 -4
(10−10 mol/l), and the mRNA expression of BMP2 was
examined by reverse transcription-quantitative polymerase chain
reaction. (C) RTECs were cultured in the presence of the
10−8 mol/l 1,25(OH)2D3 and were
harvested at different time-points. The calcium levels in the
primary RTECs were determined using the o-cresolphthalein
complexone method. **P<0.01 vs. Control. Data are
expressed as the mean ± standard deviation. RTEC, renal tubular
epithelial cell; VDR, vitamin D receptor; BMP2, bone morphogenetic
protein 2; NS, normal saline (Control; C); VD3,
1,25(OH)2D3. |
Effect of elevated
1,25(OH)2D3 on calcium levels in primary
RTECs
The RTECs were cultured for the indicated
time-periods in the NS (control), VD3-1 (10−7
mol/l), VD3-2 (10−8 mol/l), VD3-3
(10−9 mol/l) and VD3-4 (10−10
mol/l) groups. As shown in Fig. 2,
1,25(OH)2D3
at 10-8 mol/l had the highest efficiency in primary RTECs,
determined by RT-qPCR (P<0.01). To determine the association
between 1,25(OH)2D3 and RTEC mineralization,
the levels of calcium were examined in primary RTECs treated with
1,25(OH)2D3. As shown in Fig. 2, treatment of primary RTECs with
1,25(OH)2D3 caused time-dependent
upregulation of calcium levels, and upregulated calcium levels by
2.14-fold at 96 h.
Effect of elevated calcium on the
expression of osteogenic factors in primary RTECs
The basal levels of osteogenic factors were detected
in cells in the genetic hypercalciuric and NC rats. The mRNA and
protein expression levels of BMP2, Runx2 and Osterix in the cells
were significantly higher in the genetic hypercalciuric rats
compared with the NC rats (**P<0.01; Fig. 3).
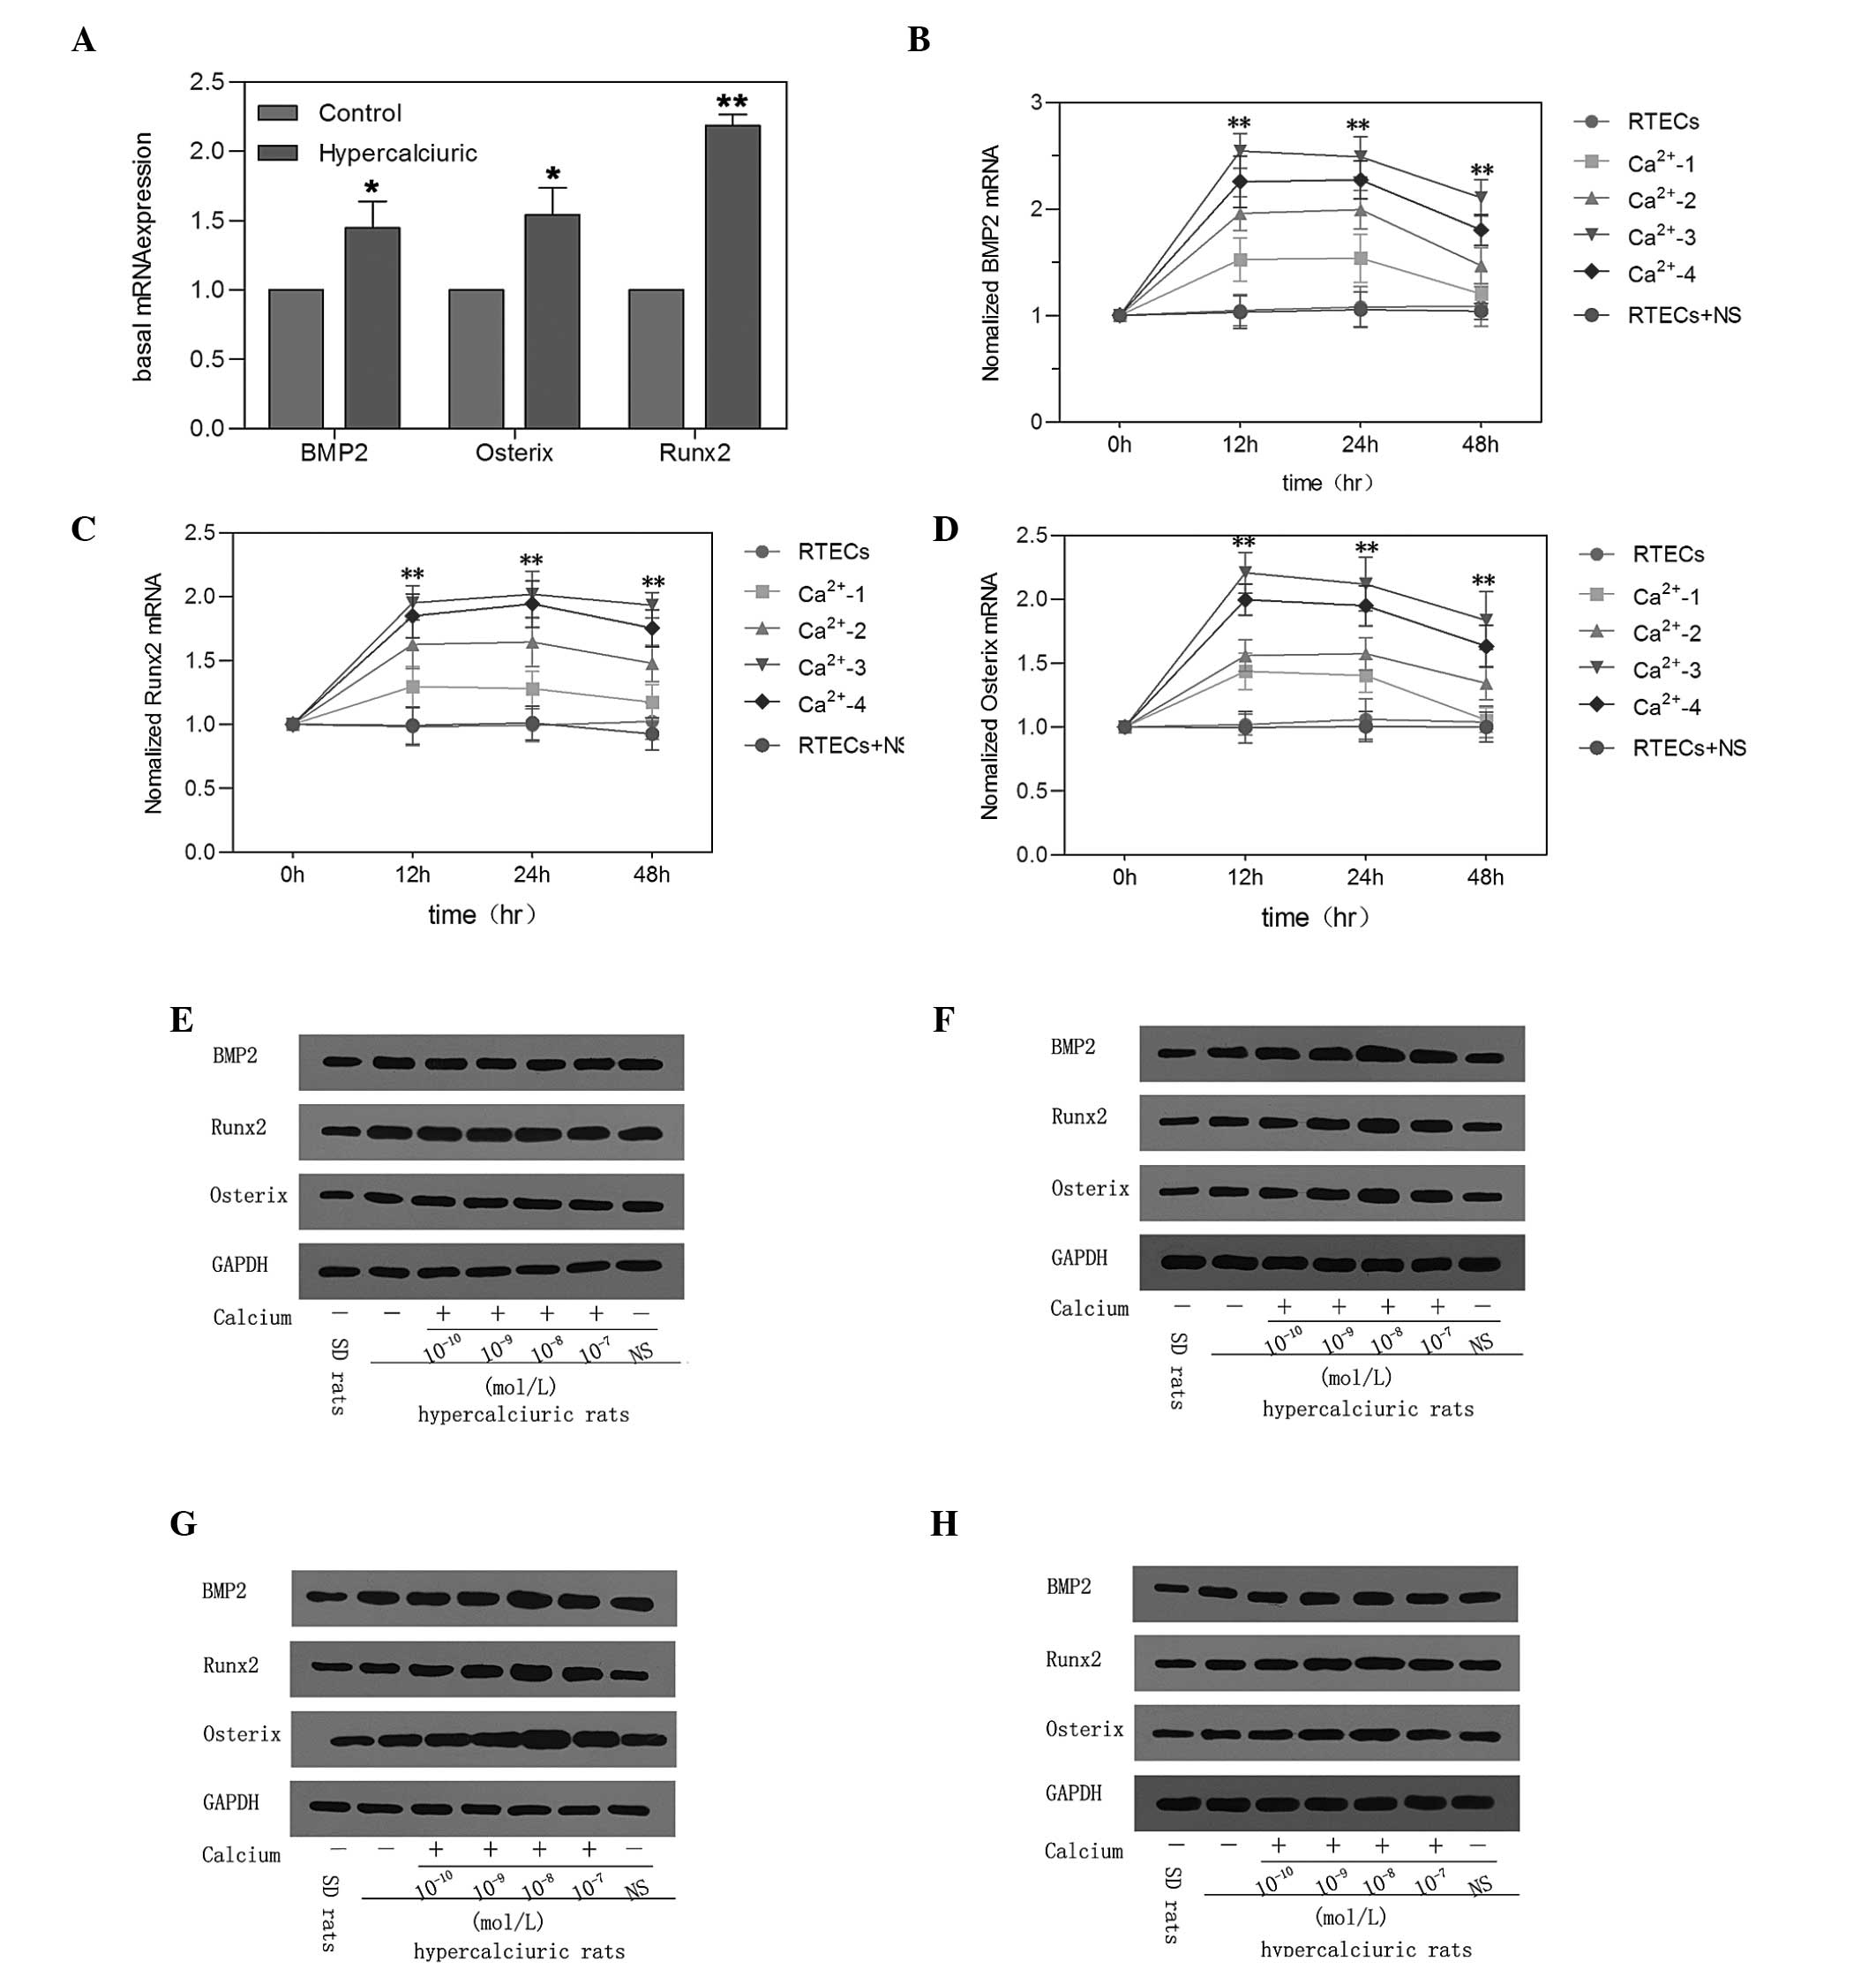 | Figure 3Effect of elevated calcium on the
expression of osteogenic factors in primary RTECs. (A) Basal mRNA
expression levels of the BMP2, Runx2 and Osterix osteogenic factors
were detected in cells from SD and genetic hypercalciuric rats.
*P<0.05, **P<0.01 vs. Control. (B)
RTECs were cultured for the indicated time-periods with
Ca2+-1 (10−10 mol/L), Ca2+-2
(10−9 mol/L), Ca2+-3 (10−8 mol/L),
Ca2+-4 (10−7 mol/L) or NS. Using reverse
transcription-quantitative polymerase chain reaction, the mRNA
levels of (B) BMP2, (C) Runx2 and (D) Osterix were measured at
different time-points and normalized to the expression of β-actin
for each sample. Data are expressed as the mean ± standard
deviation (**P<0.01, vs. RTECs). The protein
expression levels of BMP2, Runx2 and Osterix were determined at (E)
0, (F) 12, (G) 24 and (H) 48 h by western blot analysis. The
expression of GAPDH was measured to ensure equal loading. RTEC,
renal tubular epithelial cell; BMP2, bone morphogenetic protein 2;
Runx2, runt-related transcription factor 2; NS, normal saline; SD,
Sprague Dawley. |
The mRNA expression levels of BMP2, Runx2 and
Osterix were significantly increased in the cells incubated with
calcium. The cells were then cultured for the indicated
time-periods in Ca2+-1 (10−10 mol/l),
Ca2+-2 (10−9 mol/l), Ca2+-3
(10−8 mol/l) and Ca2+-4 (10−7
mol/l). As shown in Fig. 3, the
levels of calcium at 10-8 mol/l exhibited the highest efficiency in
the primary RTECs, determined by RT-qPCR. After 12, 24 and 48 h,
the mRNA expression levels of BMP2, Runx2 and Osterix were markedly
increased in the cells incubated with calcium compared with the
cells treated with NS and the untreated cells. Western blot
analysis demonstrated that the changes protein expression levels
were similar to those observed in mRNA expression levels following
the upregulation of calcium in the primary RTECs (Fig. 3).
Discussion
Evidence for an association between nephrolithiasis
and certain cardiovascular diseases has been provided by
epidemiological studies (12–14).
Over a century ago, pathologists recognized atherosclerotic
calcification as a form of extraskeletal ossification (15). It has since been demonstated that
vascular calcification is not passive, but is a complex, active and
highly regulated process of ectopic calcification (16–18).
This process involves numerous regulating factors and appears to
share several similarities with skeletal mineralization and
osteogenesis (19). BMPs, which
belong to the transforming growth factor-β (TGF-β) superfamily,
induce bone and cartilage formation when implanted at ectopic sites
in rats (20,21). Among BMPs, BMP2, a potent
osteogenic differentiation factors, is required for osteoblast
differentiation and bone formation and has been implicated in
vascular calcification (22).
The BMP2 signaling pathway contains BMP2, Runx2 and
Osterix. Li (22) demonstrated
that BMP2, acting through Runx2, induces ectopic ossification in
muscle tissue in vivo. Runx2 regulates osteoblast
differentiation and chondrocyte maturation and is an essential
regulator of calcification of VSMCs in vitro (23). Matsubara (24) observed that BMP2 regulates Osterix
through Msh homeobox 2 (Msx2) and Runx2 during osteoblast
differentiation. Osterix is a zinc finger-containing transcription
factor and is expressed in all developing bones (25). It has been demonstrated that
Osterix, which directs the differentiation of pre-osteoblasts into
mature osteoblasts, lies downstream of Runx2 (25,26).
However, whether the BMP2 signaling pathway is involved in kidney
stone formation remains to be elucidated. In our previous study,
the expression levels of BMP2, Runx2 and Osterix were found to be
increased in genetic hypercalciuric rat kidney tissue (9). In the present study, higher
expression levels of BMP2, Runx2 and Osterix were also observed in
primary RTECs. The high expression levels of these osteogenic
factors indicated that kidney stone formation may proceed in the
same way as occurs in bone formation and ectopic calcification in
arteries.
However, high expression levels of VDR in the
duodenum and kidney is also observed in genetic hypercalciuric rats
(7,8). The association between VDR and the
osteogenic factors remains to be fully elucidated. The active form
of vitamin D, 1,25(OH)2D3, exerts its
biological actions through binding to the VDR. Zebger-Gong
(27) provided evidence that
high-dose 1,25(OH)2D3 (calcitriol) increased
the expression of Osterix and induced an osteoblastic phenotype in
VSMCs, in subtotally nephrectomized rats and in vitro.
However, serum levels of 1,25(OH)2D are not elevated
and, therefore, elevated levels of tissue VDR may amplify the
biological actions of normal circulating 1,25(OH)2D
levels on stone formation (7,28).
Our previous study also revealed that elevated
1,25(OH)2D3 induced an increase in the mRNA
and protein levels of BMP2, Runx2 and Osterix in primary RTECs
(9). In the present study, VDR
knockdown caused a significant decrease in the gene and protein
levels of BMP2, Runx2, and Osterix in primary RTECs. These results
indicated that 1,25(OH)2D3/VDR positively
regulated the expression of BMP2, Runx2 and Osterix in
vitro. However, how 1,25(OH)2D3/VDR
increases the expression of these osteogenic factors remains to be
elucidated.
Hypercalciuria is the most important characteristic
of genetic hypercalciuric rats. In the present study, the calcium
deposition in primary RTECs were reduced following silencing of the
VDR gene. Elevated levels of 1,25(OH)2D3
caused a time-dependent upregulation of calcium levels in the
primary RTECs, but not in the control rats. These results suggested
that genetic hypercalciuric rats may be more susceptible to
elevated levels of 1, 25(OH)2D3 compared with
control rats. However, Schmidt (29) reported that calcified areas and the
expression levels of Msx2, BMP2 and Runx2 in the blood vessels in
VDR-knockout mice are increased compared with wild-type mice. This
suggests that the action of VDR on the expression of osteoblastic
differentiation factors differs in kidney and blood vessels.
In the present study, the BMP2 singling pathway and
the deposition of calcium in primary RTECs was regulated by VDR.
However, a significant gap remains in current understanding of the
BMP2 singling pathway and calcium deposition in primary RTECs. In
the present study, the gene and protein levels of BMP2, Runx2 and
Osterix were increased in the RTECs cultured with different
concentrations of Ca2+, which reveals that
Ca2+ may be more important in stone formation. It ws
Ca2+, rather than 1,25(OH)2D3/VDR,
that caused RTECs to express more osteogenic factors directly,
however, 1,25(OH)2D3/VDR may provide renal
tubular epithelial cells with high calcium environment by
negatively regulating the expression of renal epithelial calcium
transport proteins involving transient receptor potential cation
channel subfamily V member 5(8).
These appear to explain the mechanisms underlying the contribution
of elevated VDR levels to higher expressions of these osteogenic
factors.
In conclusion, the findings of the present study
indicated that osteogenic factors, including BMP2, Runx2 and
Osterix may be important role in renal stone formation in IH. VDR
knockdown reduced the expression levels of BMP2, Runx2 and Osterix,
and decreased the calcium content of primary RTECs. However,
elevated 1,25(OH)2D3/VDR induced an increase
in calcium content in the primary RTECs, and elevated calcium
levels increased the expression levels of BMP2, Runx2 and Osterix.
Therefore, 1,25(OH)2D3/VDR may mediate the
increases in the expression of BMP2, Runx2 and Osterix by
positively regulating calcium levels in primary RTECs.
Acknowledgments
This study was supported by grants from the National
Science Foundation of China (nos. 30972985 and 81270787).
References
|
1
|
Relan V, Khullar M, Singh SK and Sharma
SK: Association of vitamin D receptor genotypes with calcium
excretion in nephrolithiatic subjects in northern India. Urol Res.
32:236–240. 2004. View Article : Google Scholar : PubMed/NCBI
|
|
2
|
Favus MJ, Karnauskas AJ, Parks JH and Coe
FL: Peripheral blood monocyte vitamin D receptor levels are
elevated in patients with idiopathic hypercalciuria. J Clin
Endocrinol Metab. 89:4937–4943. 2004. View Article : Google Scholar : PubMed/NCBI
|
|
3
|
Burton DG, Matsubara H and Ikeda K:
Pathophysiology of vascular calcification: Pivotal role of cellular
senescence in vascular smooth muscle cells. Exp Gerontol.
45:819–824. 2010. View Article : Google Scholar : PubMed/NCBI
|
|
4
|
Kanno Y, Into T, Lowenstein CJ and
Matsushita K: Nitric oxide regulates vascular calcification by
interfering with TGF-signalling. Cardiovasc Res. 77:221–230. 2008.
View Article : Google Scholar
|
|
5
|
Jang WG, Kim EJ, Kim DK, et al: BMP2
protein regulates osteocalcin expression via Runx2-mediated Atf6
gene transcription. J Biol Chem. 287:905–915. 2012. View Article : Google Scholar :
|
|
6
|
Cai J, Pardali E, Sanchez-Duffhues G and
ten Dijke P: BMP signaling in vascular diseases. FEBS Lett.
586:1993–2002. 2012. View Article : Google Scholar : PubMed/NCBI
|
|
7
|
Wang SG, Luo DX and Liu JH: Establishment
of genetic hypercalciuric stone-forming rat’s model. Chin J Urol.
27:63–65. 2006.
|
|
8
|
Xi QL, Wang SG, Ye ZQ, et al: Effect of
silencing VDR gene in kidney on renal epithelial calcium
transporter proteins and urinary calcium excretion in genetic
hypercalciuric stone-forming rats. Urology. 78:1442.e1–e7. 2011.
View Article : Google Scholar
|
|
9
|
Jia Z, Wang S, Tang J, et al: Does crystal
deposition in genetic hypercalciuric rat kidney tissue share
similarities with bone formation? Urology. 83:509.e7–e14. 2014.
View Article : Google Scholar
|
|
10
|
Schmittgen TD and Livak KJ: Analyzing
real-time PCR data by comparative C(T) method. Nat Protoc.
3:1101–1108. 2008. View Article : Google Scholar
|
|
11
|
Jono S, McKee MD, Murry CE, et al:
Phosphate regulation of vascular smooth muscle cell calcification.
Circ Res. 87:E10–E17. 2000. View Article : Google Scholar : PubMed/NCBI
|
|
12
|
Khan SR: Is oxidative stress, a link
between nephrolithiasis and obesity, hypertension, diabetes,
chronic kidney disease, metabolic syndrome? Urol Res. 40:95–112.
2012. View Article : Google Scholar : PubMed/NCBI
|
|
13
|
Hayden MR, Tyagi SC, Kolb L, Sowers JR and
Khanna R: Vascular ossification-calcification in metabolic
syndrome, type 2 diabetes mellitus, chronic kidney disease, and
calciphylaxis-calcific uremic arteriolopathy: The emerging role of
sodium thiosulfate. Cardiovasc Diabetol. 4:42005. View Article : Google Scholar : PubMed/NCBI
|
|
14
|
Sage AP, Tintut Y and Demer LL: Regulatory
mechanisms in vascular calcification. Nat Rev Cardiol. 7:528–536.
2010. View Article : Google Scholar : PubMed/NCBI
|
|
15
|
Bunting CH: The formation of true bone
with cellular (red) marrow in a sclerotic aorta. J Exp Med.
8:365–376. 1906. View Article : Google Scholar : PubMed/NCBI
|
|
16
|
Shao JS, Aly ZA, Lai CF, et al: Vascular
Bmp Msx2 Wnt signaling and oxidative stress in arterial
calcification. Ann NY Acad Sci. 1117:40–50. 2007. View Article : Google Scholar : PubMed/NCBI
|
|
17
|
Moe SM and Chen NX: Mechanisms of vascular
calcification in chronic kidney disease. J Am Soc Nephrol.
19:213–216. 2008. View Article : Google Scholar
|
|
18
|
Schoppet M, Shroff RC, Hofbauer LC and
Shanahan CM: Exploring the biology of vascular calcification in
chronic kidney disease: what’s circulating? Kidney Int. 73:384–390.
2008. View Article : Google Scholar
|
|
19
|
Boström K, Watson KE, Horn S, Wortham C,
Herman IM and Demer LL: Bone morphogenetic protein expression in
human atherosclerotic lesions. J Clin Invest. 91:1800–1809. 1993.
View Article : Google Scholar : PubMed/NCBI
|
|
20
|
Reddi AH: Bone morphogenetic proteins: an
unconventional approach to isolation of first mammalian morphogens.
Cytokine Growth Factor Rev. 8:11–20. 1997. View Article : Google Scholar : PubMed/NCBI
|
|
21
|
Wozney JM, Rosen V, Celeste AJ, et al:
Novel regulators of bone formation: molecular clones and
activities. Science. 242:1528–1534. 1988. View Article : Google Scholar : PubMed/NCBI
|
|
22
|
Li X, Yang HY and Giachelli CM: BMP-2
promotes phosphate uptake, phenotypic modulation and calcification
of human vascular smooth muscle cells. Atherosclerosis.
199:271–277. 2008. View Article : Google Scholar : PubMed/NCBI
|
|
23
|
Sun Y, Byon CH, Yuan K, et al: Smooth
muscle cell-specific runx2 deficiency inhibits vascular
calcification. Circ Res. 111:543–552. 2012. View Article : Google Scholar : PubMed/NCBI
|
|
24
|
Matsubara T, Kida K, Yamaguchi A, et al:
BMP2 regulates Osterix through Msx2 and Runx2 during osteoblast
differentiation. J Biol Chem. 283:29119–29125. 2008. View Article : Google Scholar : PubMed/NCBI
|
|
25
|
Nakashima K, Zhou X, Kunkel G, et al: The
novel zinc finger-containing transcription factor osterix is
required for osteoblast differentiation and bone formation. Cell.
108:17–29. 2002. View Article : Google Scholar : PubMed/NCBI
|
|
26
|
Komori T: Regulation of osteoblast
differentiation by transcription factors. J Cell Biochem.
99:1233–1239. 2006. View Article : Google Scholar : PubMed/NCBI
|
|
27
|
Zebger-Gong H, Muller D, Diercke M, et al:
1,25-Dihydroxyvitamin D3-induced aortic calcifications in
experimental uremia: up-regulation of osteoblast markers,
calcium-transporting proteins and osterix. J Hypertens. 29:339–348.
2011. View Article : Google Scholar
|
|
28
|
Bai S, Wang H, Shen J, Zhou R, Bushinsky
DA and Favus MJ: Elevated vitamin D receptor levels in genetic
hypercalciuric stone-forming rats are associated with
downregulation of Snail. J Bone Miner Res. 25:830–840. 2010.
|
|
29
|
Schmidt N, Brandsch C, Kühne H, Thiele A,
Hirche F and Stangl GI: Vitamin D receptor deficiency and low
vitamin D diet stimulate aortic calcification and osteogenic key
factor expression in mice. PLoS One. 7:e353162012. View Article : Google Scholar : PubMed/NCBI
|


