Introduction
Lung cancer is the leading cause of mortality among
all types of malignancy (1).
Regardless of the treatment provided, the 5-year survival rate in
lung cancer is <15%. The poor prognosis is predominantly
attributed to the development of drug resistance (2). It is therefore important to identify
the mechanisms underlying drug resistance in lung cancer.
Cancer stem cells (CSCs) exhibit increased drug
resistance and tumorigenicity (3,4).
Levina et al (1) suggested
that CSCs may be enriched and subsequently isolated from cancer
cell populations following drug treatment. The authors isolated
what they termed drug-surviving cells (DSCs) from human cancer cell
lines treated with cisplatin, doxorubicin or etoposide. The
isolated DSCs were clonogenic, expressed CSC cell surface and
embryonic stem cell markers, exhibited self-renewal and
differentiation, and were tumorigenic and metastatic in severe
combined immunodeficiency mice. It was concluded that the DSCs were
CSCs and that enrichment of CSCs following drug treatment in
vitro may result in a similar selection of drug-resistant CSCs
in patients during chemotherapy (1).
Our group previously established the cell line
Am1010 (5) directly from a lung
cancer patient who was treated with chemotherapy but developed
multidrug resistance. In the present study, the establishment of
eight sublines of DSCs from Am1010, labeled with red fluorescent
protein (RFP) or green fluorescent protein (GFP), by long-term
exposure to cisplatin or taxol is described. Cell proliferation and
gene expression were then determined, in order to define the
differences between the sublines.
Materials and methods
Ethics statement
All experimentation presented in the current study
has been approved by the local institutional review board. The
tumor sample was obtained from the Department of Thoracic Surgery
at the 1st Affiliated Hospital of Guangzhou Medical College with
the approval of the local ethical committee. Written informed
consent was obtained from the patient.
RFP or GFP expression in Am1010
cells
The RFP (DsRed-2) gene (Clontech Laboratories,
Mountain View, CA, USA) was inserted in the retroviral-based
mammalian expression vector, pLNCX (Clontech Laboratories), to form
the pLNCX DsRed-2 vector. The EGFP gene (Clontech Laboratories) was
inserted into the retroviral-based mammalian expression vector,
pLEIN, to form the pLEIN EGFP vector. Transfection of pLNCX DsRed-2
or pLEIN GFP into PT67 packaging cells produced retroviral
supernatants containing the DSRed-2 or EGFP gene.
Briefly, PT67 cells were grown as monolayers in Dulbecco's modified
Eagle's medium supplemented with 10% fetal bovine serum (FBS;
Gemini Biological Products, Calabasas, CA, USA). Exponentially
growing cells in 10-cm dishes were transfected with 10 µg of
the expression vector using Lipofectamine® and Plus
reagent (Invitrogen Life Technologies, Carlsbad, CA, USA).
Transfected cells were replated 48 h after transfection and 100
µg/ml G418 was added. After two days, the quantity of G418
was increased to 200 µg/ml. During the drug selection
period, surviving colonies were visualized under fluorescence
microscopy and RFP-positive and GFP-positive colonies were isolated
(6).
For RFP or GFP gene transduction, cells were
incubated at 20% confluence with a 1:1 precipitated mixture of
retrovirus-containing supernatants of PT67 cells and RPMI 1640 or
other culture medium (Invitrogen Life Technologies) containing 10%
FBS (Gemini Biological Products) for 72 h. Cells were replenished
with fresh medium at this time. Cancer cells were harvested with
trypsin/EDTA and subcultured at a ratio of 1:15 into selective
medium, which contained 50 µg/ml G418. In order to select
brightly fluorescent cells, the concentration of G418 was increased
to 800 µg/ml in a stepwise manner. The clones of cancer
cells expressing RFP or GFP were isolated using cloning cylinders
(Bel-Art Products, Wayne, NJ, USA) by trypsin/EDTA and amplified
and transferred by conventional culture methods in the absence of
the selective agent (6).
Establishment of DSC sublines
Once Am1010 cells (5) had grown to 80% confluence, cisplatin
(1 µM) was added to the medium for 1 month. Suspended cells
appeared following drug exposure and were transferred to a new
culture dish. Am1010 cells were also exposed to taxol (0.1
µM) in a procedure similar to that used for cisplatin.
Am1010-cis-suspension-GFP, Am1010-cis-adhesion-GFP,
Am1010-tax-suspension-GFP, Am1010-tax-adhesion-GFP,
Am1010-cis-suspension-RFP, Am1010-cis-adhesion-RFP,
Am1010-tax-suspension-RFP and Am1010-tax-adhesion-RFP cells were
isolated by culture with cisplatin or taxol. When the DSC sublines
were passaged, the suspended or attached status of the subline was
maintained for 30–100 h. After this time period, the suspended
cells attached and proliferated. The cells were subsequently
cultured as normal cells, and their gene expression of CCND1, TNC,
COL1A2, ITGA1, RRAS2, PDGFC, SHC1, ICAM1, CLDN7, F11R and CDH1 was
assayed every three months, in order to observe their stability.
Unstable cells were discarded.
Reverse transcription-quantitative
polymerase chain reaction (RT-qPCR)
The expression of tenascin C (TNC); cyclin D1
(CCND1); collagen, type 1, α2 (COL1A2); integrin α1 (ITGA1);
related RAS viral (r-ras) oncogene homolog 2 (RRAS2);
platelet-derived growth factor C (PDGFC); Src homolog 2 domain
containing (SHC1); intercellular adhesion molecule 1 (ICAM1); F11
receptor (F11R); claudin 7 (CLDN7); and cadherin 1 (CDH1) was
analyzed by SYBR Green qPCR. Total RNA was isolated from cultured
cells, omental tissues and oral mucosal tissues using the
TRIzol® method (Invitrogen Life Technologies). The total
quantity of RNA was determined using a Nanodrop spectrophotometer
(ND1000; NanoDrop Technologies, Wilmington, DE, USA). The purity
was assessed using denaturing agarose gel electrophoresis. cDNA
synthesis was conducted with 1 mg of RNA using the High Capacity
cDNA Reverse Transcription kit (Invitrogen Life Technologies).
RT-qPCR was performed using an ABI Prism 7900HT system (Applied
Biosystems, Foster City, CA, USA). RT-qPCR reactions were conducted
using 26 Power SYBR Green PCR master mixes (Applied Biosystems)
according to the manufacturer's instructions. For PCR
amplification, an initial step at 50°C for 2 min was performed,
followed by a denaturation step at 95°C for 15 min. Subsequently,
45 cycles of a denaturation step (95°C for 15 sec) and an annealing
and extension step (60°C for 60 sec) were performed. PCR reactions
were performed in triplicate for each sample. A dissociation
reaction was also conducted for each primer in order to assess its
specificity. The relative quantification (ΔΔCt method), which
describes the change in expression of the target gene in a test
sample relative to that in a calibrator sample, was used to analyze
the data. Data were analyzed using the 7900HT sequence detector
system software version 2.2.1 (Applied Biosystems). Results were
expressed relative to the expression levels of internal reference
genes (β-actin and GAPDH). Details of the primers used for specific
genes are presented in Table
I.
 | Table IGene expression analysis. |
Table I
Gene expression analysis.
| Gene | GB.accession | Primer sequence
5′→3′ | Amplificon size
(bp) |
|---|
| CCND1 | NM_053056 | Forward
AGAACACGGCTCACGCTTAC | 204 |
| | Reverse
CCCAGACCCTCAGACTTGC | |
| TNC | NM_002160 | Forward
GAGATGCCAAGACTCGCTACA | 182 |
| | Reverse
GTTGACACGGTGACAGTTCCT | |
| COL1A2 | NM_000089 | Forward
CTACCCAACTTGCCTTCATG | 229 |
| | Reverse
GTCTTTCCCCATTCATTTGTC | |
| ITGA1 | NM_181501 | Forward
TGGCTTCTGAATGAAATACGA | 109 |
| | Reverse
TTCTTTGGGTCACATACTGGA | |
| RRAS2 | NM_012250 | Forward
GTGGTAGAACTTTTACTTGCTGG | 116 |
| | Reverse
AGTGATTTCAGAGTCTCATCCTG | |
| PDGFC | NM_016205 | Forward
GTTCTTTCGATACGGCTTAGG | 126 |
| | Reverse
CCAGATTTTATACGATTTTAGGC | |
| SHC1 | NM_003029 | Forward
CTATGTACTCTACGCCAAAGTGC | 183 |
| | Reverse
TATGTGGGGATTGTCTACTGC | |
| ICAM1 | NM_000201 | Forward
GACCCCAACCCTTGATGATA | 266 |
| | Reverse
AGTGCTTTTGTGCCGATAGA | |
| CLDN7 | NM_001307 | Forward
ATGTATAGTCCTCTTGGGTTGG | 215 |
| | Reverse
TCAGTGGGGTGCTAAGTGTTC | |
| F11R | NM_016946 | Forward
TCATCTTGTAACTGAAAGCGTG | 110 |
| | Reverse
CTAACTCCGTTTTCCTCCACTA | |
| CDH1 | NM_004360 | Forward
GAGGATGATTGAGGTGGGTC | 114 |
| | Reverse
GGGATTCTGGGCTTTGAGTA | |
| GAPDH | NM_002046 | Forward
TGTTGCCATCAATGACCCCTT | 202 |
| | Reverse
CTCCACGACGTACTCAGCG | |
| β-actin | NM_001101 | Forward
CATGTACGTTGCTATCCAGGC | 250 |
| | Reverse
CTCCTTAATGTCACGCACGAT | |
Cell proliferation measurements
Aliquots (100 µl) of exponentially growing
cell suspensions (5×10⁴ cells/ml) were seeded in 96-well
microtiter plates and incubated for 24 h. At 0, 24, 48 and 96 h, 20
µl of 3-(4,5-dimethylthiazol-2-yl)-2,5-diphenyltetrazolium
bromide solution (5 mg/ml in phosphate-buffered saline) was added
to each well and the plates were incubated at 37°C for an
additional 3 h. Following centrifugation of the plates at 800 × g
for 5 min, the medium was aspirated from each well as fully as
possible and 200 µl of dimethyl sulfoxide was added to each
well to dissolve the formazan crystals. The optical density was
measured at 490 nm using the Delta-soft ELISA analysis software
interfaced to a Bio-Tek microplate reader (EL-340; Biometallics,
Inc., Princeton, NJ, USA).
Statistical analysis
Differences in proliferation between different cell
lines were analyzed using Student's t-test. Statistical analysis
was performed using SPSS 13.0 softward (SPSS, Inc., Chicago, IL,
USA). P<0.05 was considered to indicate a statistically
significant difference.
Results
Labeling of Am1010 sublines with GFP and
RFP
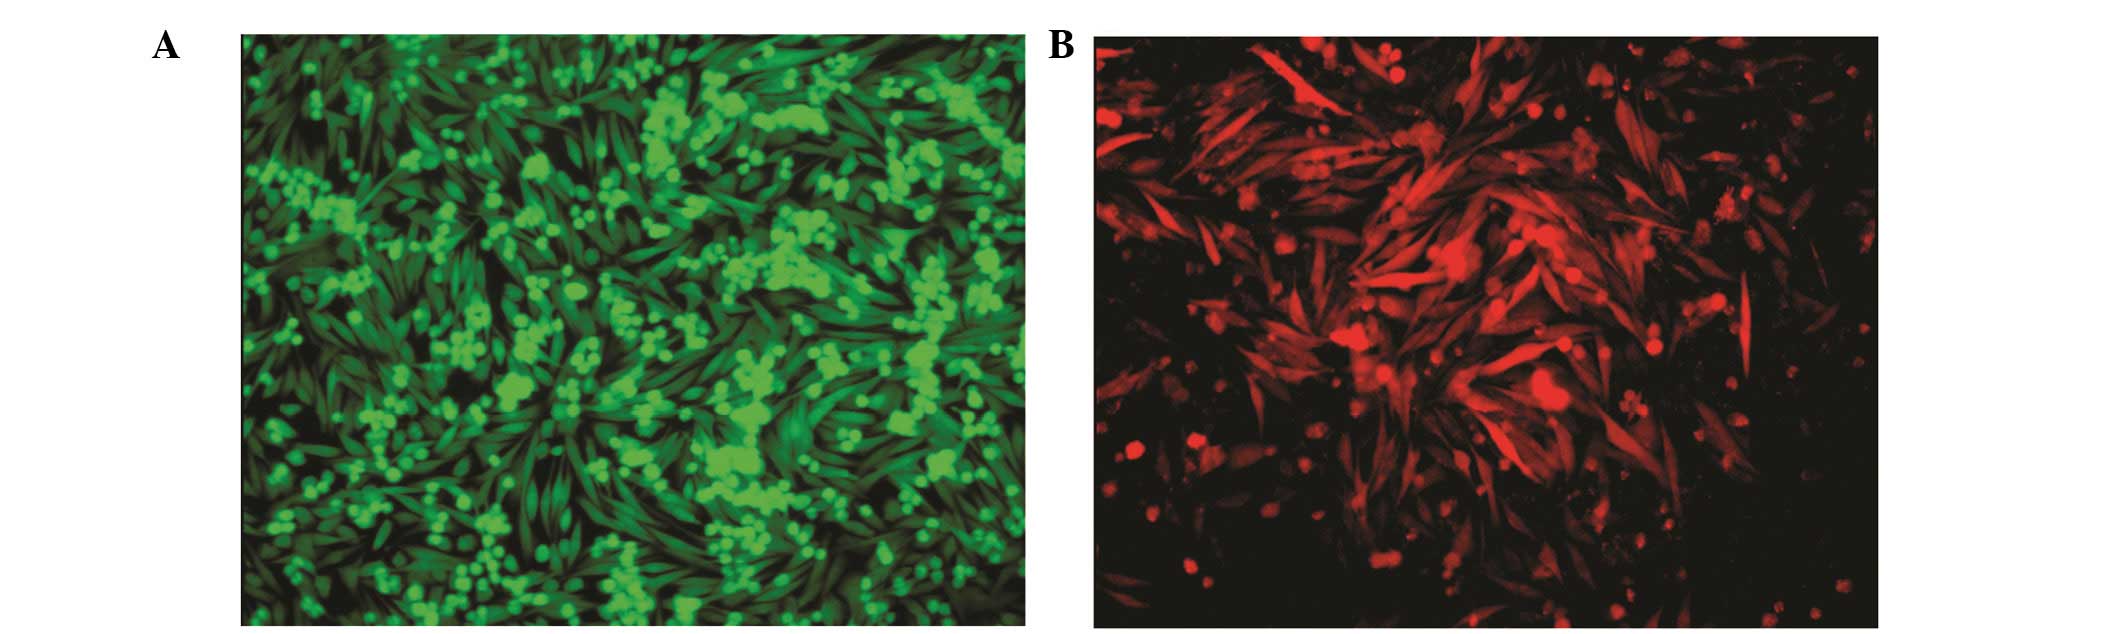
Am1010 cells were stably labeled with GFP or RFP.
Fig. 1 shows Am1010-GFP and
Am1010-RFP cells. GFP and RFP expression did not alter the
proliferation rate of the cells (data not shown).
DSC sublines of Am1010-GFP or Am1010-RFP
had differing adhesion properties
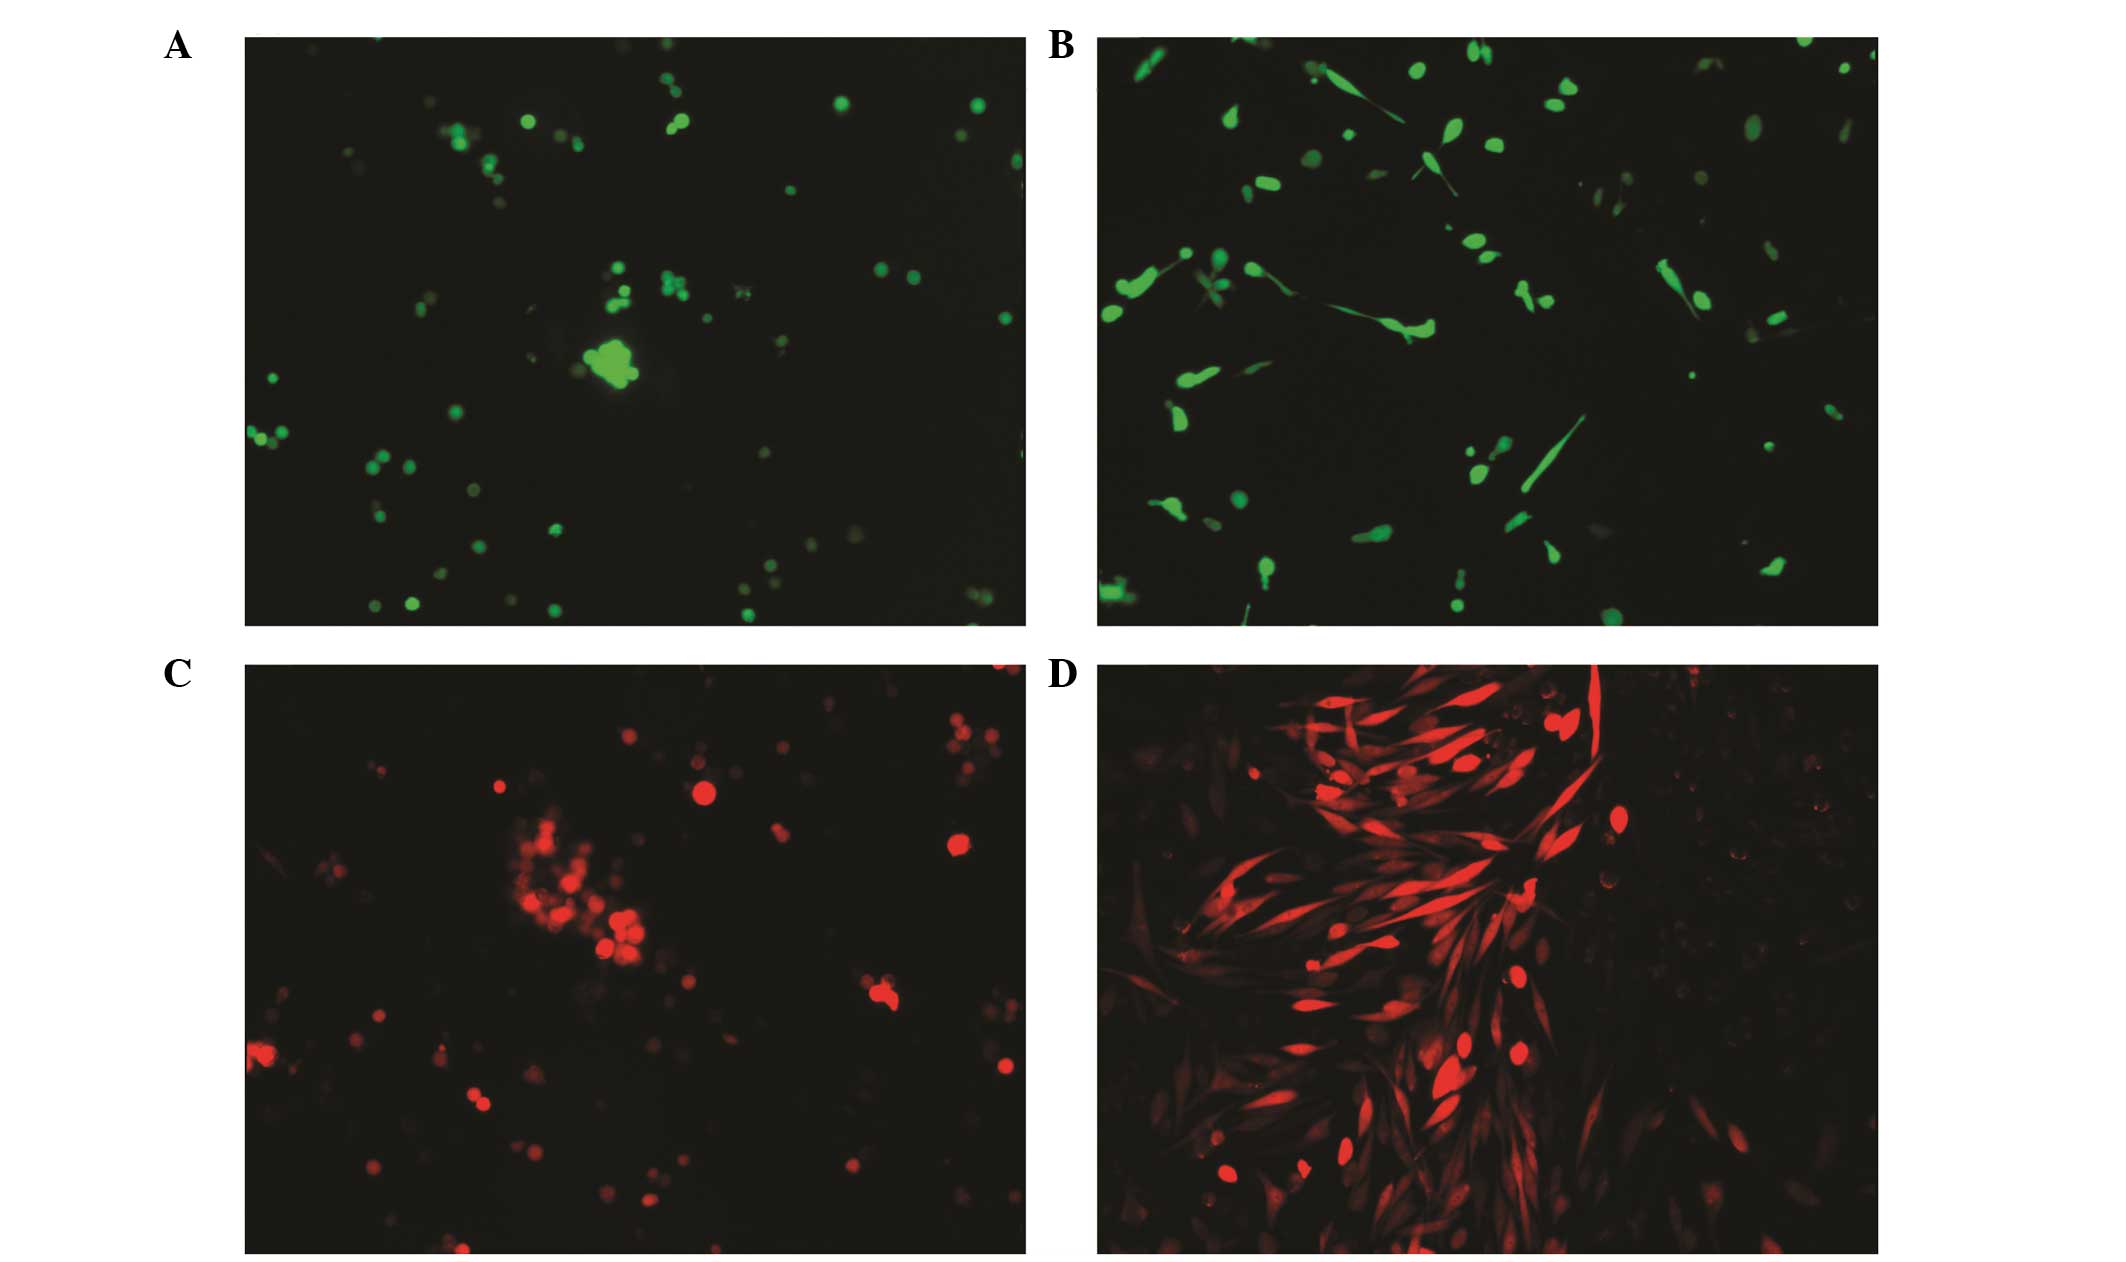
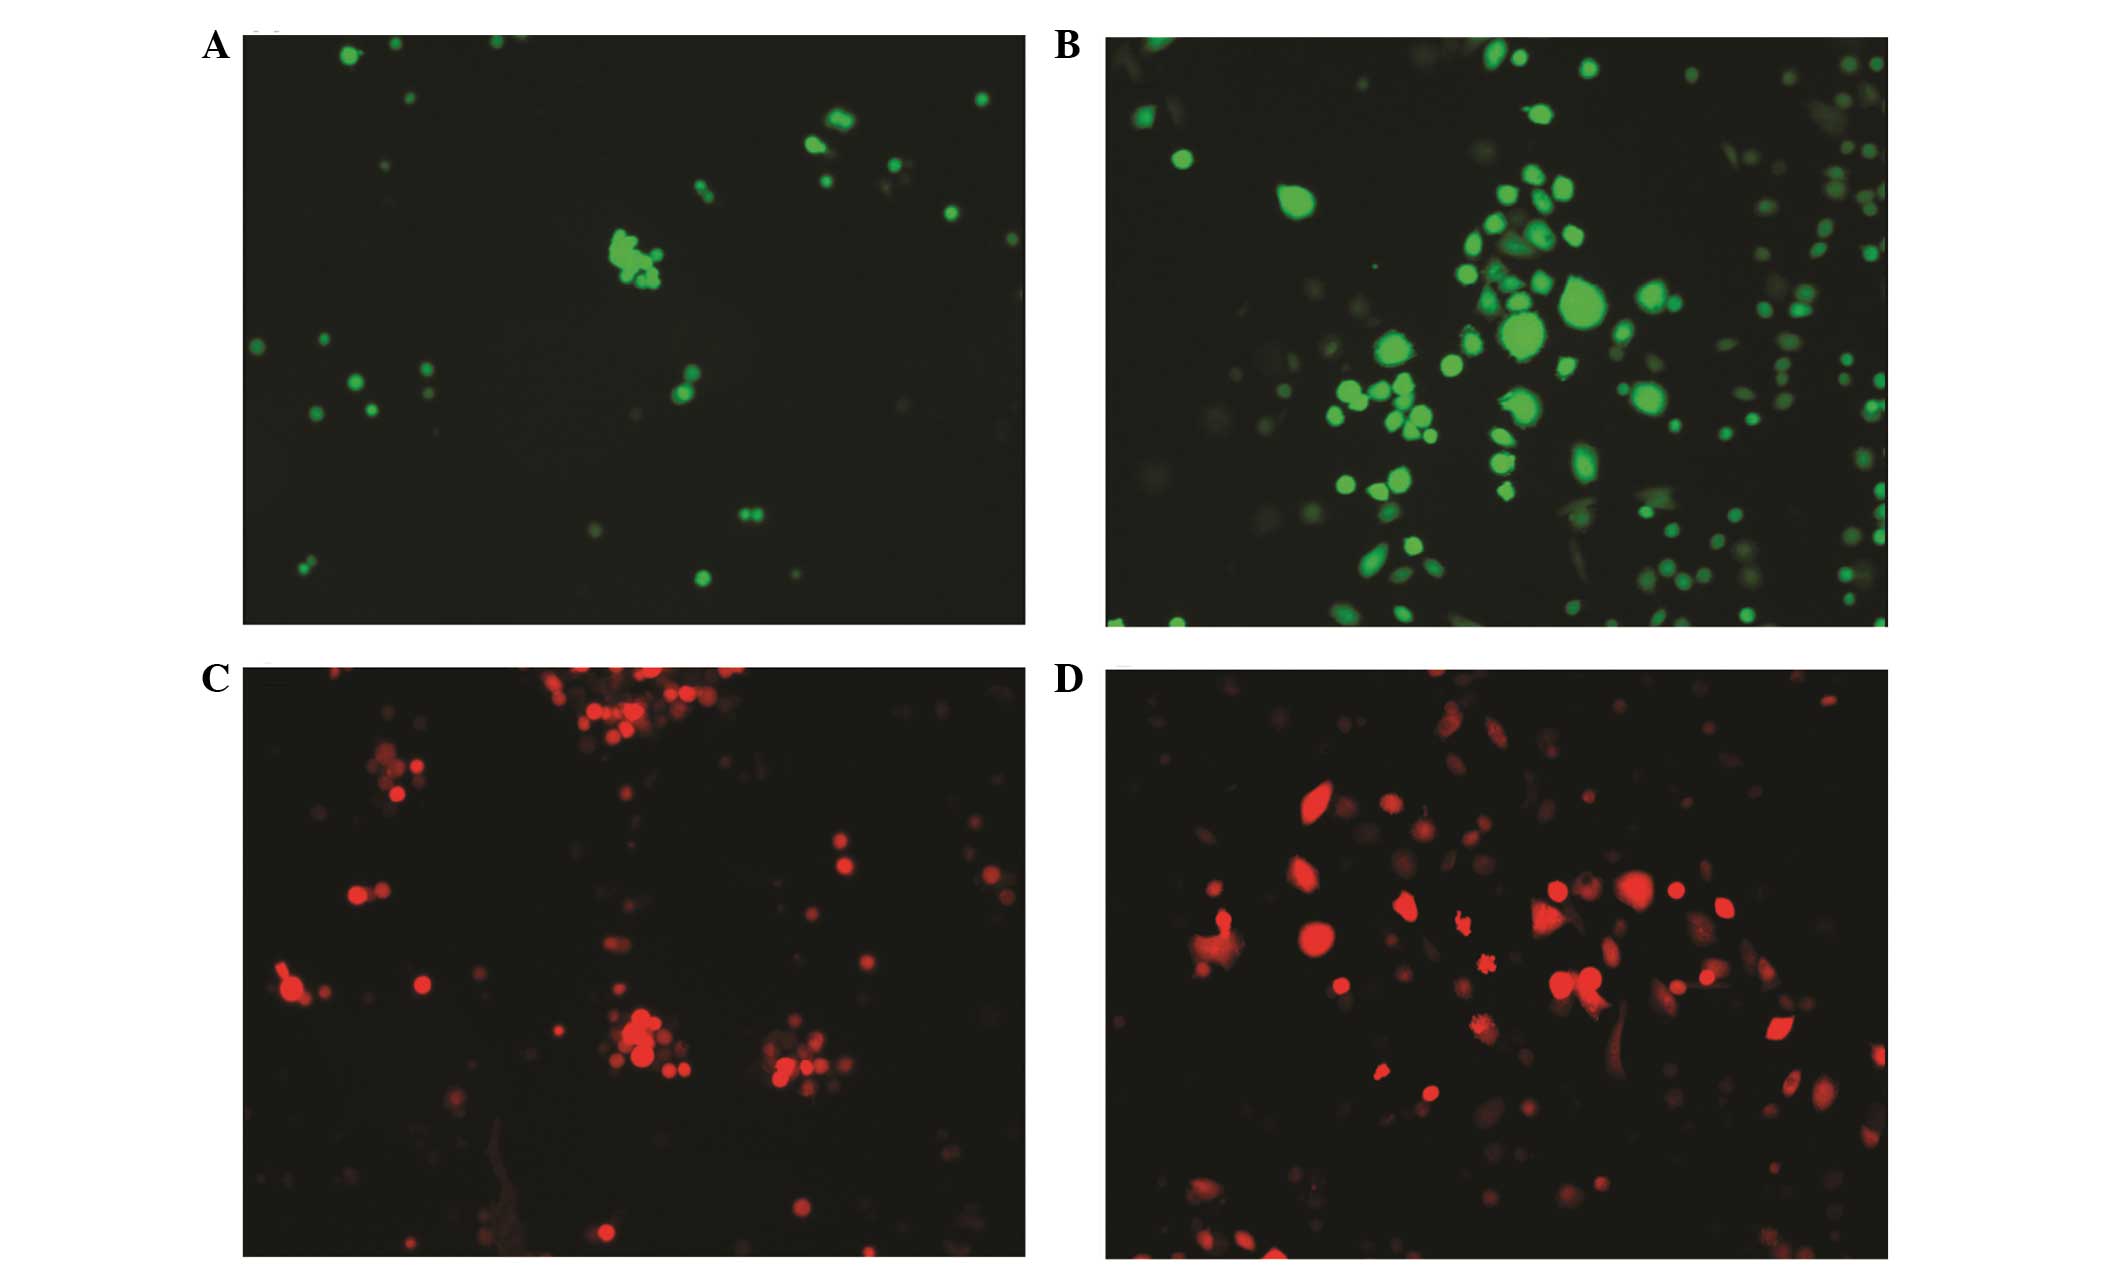
Exposure of Am1010-GFP or Am1010-RFP cells to
cisplatin or taxol, enabled the isolation of suspended or attached
sublines. The following sublines were selected:
Am1010-cis-suspension-GFP, Am1010-cis-adhesion-GFP,
Am1010-cis-suspension-RFP, Am1010-cis-adhesion-RFP (Fig. 2), Am1010-tax-suspension-GFP,
Am1010-tax-adhesion-GFP, Am1010-tax-suspension-RFP and
Am1010-tax-adhesion-RFP (Fig. 3).
When the DSC sublines were passaged, the suspension or attached
status of the subline was maintained for 30–100 h. After this time
period, the suspended cells attached and proliferated.
Gene expression of TNC, CCND1, COL1A2,
ITGA1, RRAS2, PDGFC, SHC1, ICAM1, F11R, CLDN7 and CDH1 in the DSC
sublines, Am1010-GFP and Am1010-RFP
Am1010-cis-adhesion and Am1010-cis-suspension cells
exhibited the same trend for the expression of the eleven genes
measured. Expression of TNC, CCND1, COL1A2, ITGA1, RRAS2, SHC1 and
ICAM1 was upregulated and that of F11R, CLDN7 and CDH1 expression
was downregulated (all P<0.01), as compared with the Am1010
cells which have a basic value of 1 in Table II and Fig. 4, and the Am1010-tax-adhesion and
Am1010-tax-suspension cells (all P<0.01). PDGFC expression
exhibited little variation, as compared with the
Am1010-tax-adhesion and Am1010-tax-suspension cells (P>0.05).
Am1010-cis-adhesion cells revealed a greater degree of upregulation
of gene expression than Am1010-cis-suspension cells. By contrast,
Am1010-cis-suspension cells demonstrated a greater degree of
downregulation of gene expression than Am1010-cis-adhesion
cells.
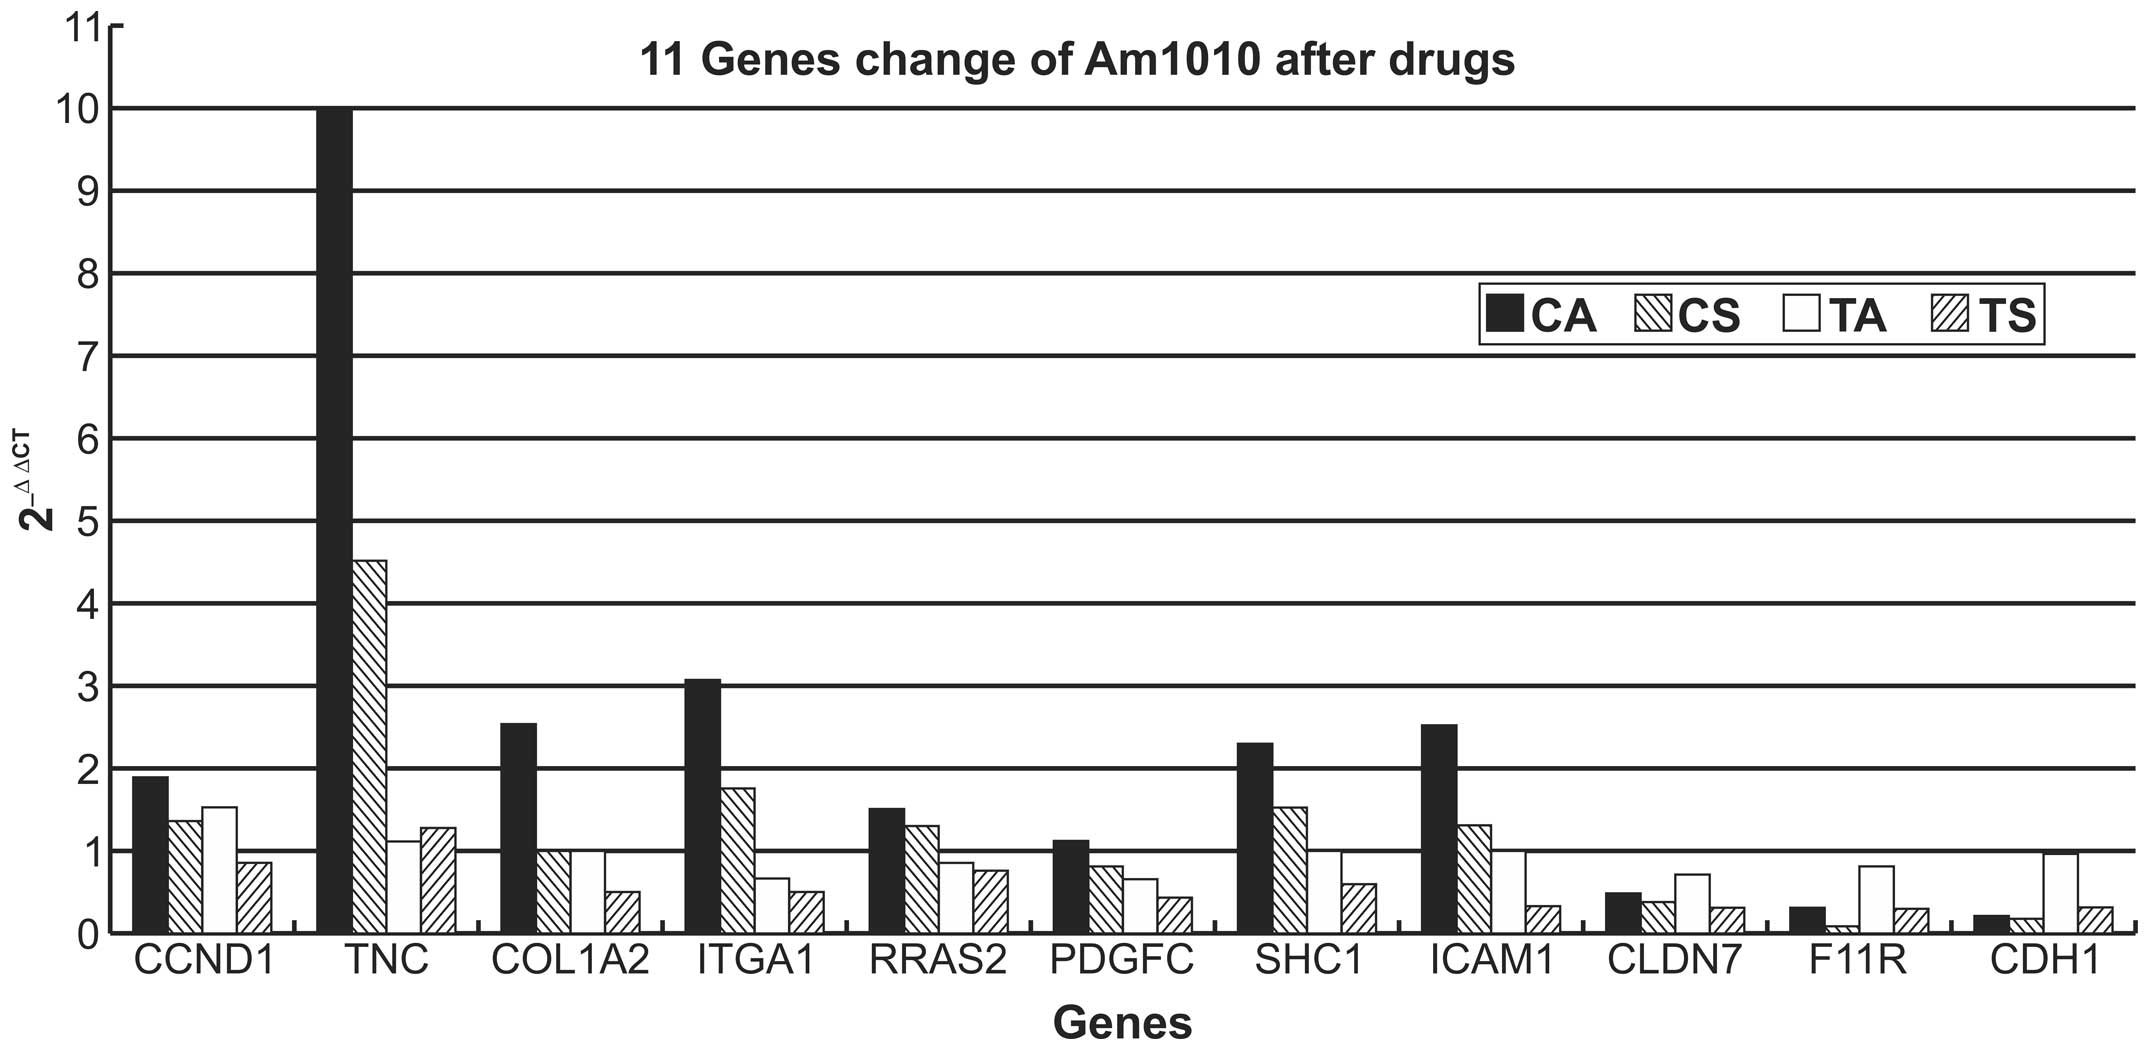 | Figure 4Relative gene expression changes in
different sub-cell lines. Am1010 cells that attached poorly
following drug exposure demonstrated upregulation of CCND1, TNC,
COL1A2, ITGA1, RRAS2, PDGFC and SHC1 expression in the
focal-adhesion pathway, and ICAM1 expression in the cell-adhesion
pathway, in addition to downregulation of F11R, CLDN7 and CDH1
expression in the cell-adhesion pathway. Cells with improved
attachment following drug exposure demonstrated that all eleven
genes exhibited slight changes in the expression levels in cells
with improved attachment. CCND1, cyclin D1; TNC, tenascin C;
COL1A2, collagen, type 1, α2; ITGA1, integrin α1; RRAS2, related
RAS viral (r-ras) oncogene homolog 2; PDGFC, platelet-derived
growth factor C; SHC1, Src homolog 2 domain containing; ICAM1,
intercellular adhesion molecule 1; CLDN7, claudin 7; F11R, F11
receptor; CDH1, cadherin 1; CA, Am1010-cis-adhesion; CS,
Am1010-cis-suspension; TA; Am1010-tax-adhesion; TS,
Am1010-tax-suspension; cis, cisplatin; tax, taxol. |
| Table IIRelative gene expression changes in
different cell sublines. |
Table II
Relative gene expression changes in
different cell sublines.
|
2−ΔΔCT |
Am1010-cis-adhesion |
Am1010-cis-suspension |
Am1010-tax-adhesion |
Am1010-tax-suspension |
|---|
| CCND1 | 1.92 | 1.34 | 1.53 | 0.88 |
| TNC | 9.99 | 4.53 | 1.11 | 1.25 |
| COL1A2 | 2.55 | 1.01 | 1.00 | 0.51 |
| ITGA1 | 3.06 | 1.78 | 0.70 | 0.48 |
| RRAS2 | 1.50 | 1.31 | 0.85 | 0.75 |
| PDGFC | 1.11 | 0.81 | 0.66 | 0.47 |
| SHC1 | 2.29 | 1.54 | 0.94 | 0.57 |
| ICAM1 | 2.54 | 1.33 | 1.01 | 0.30 |
| CLDN7 | 0.52 | 0.38 | 0.71 | 0.31 |
| F11R | 0.31 | 0.11 | 0.83 | 0.31 |
| CDH1 | 0.21 | 0.19 | 0.93 | 0.34 |
All eleven genes exhibited little variation of
expression in Am1010-tax-adhesion cells (P>0.05). By contrast,
the expression of almost all genes, with the exception of TNC,
which exhibited little variation, was downregulated in
Am1010-tax-suspension cells (P<0.05; Table II and Fig. 4).
Differential cell proliferation rates in
DSC sublines derived from Am1010-GFP and Am1010-RFP cells
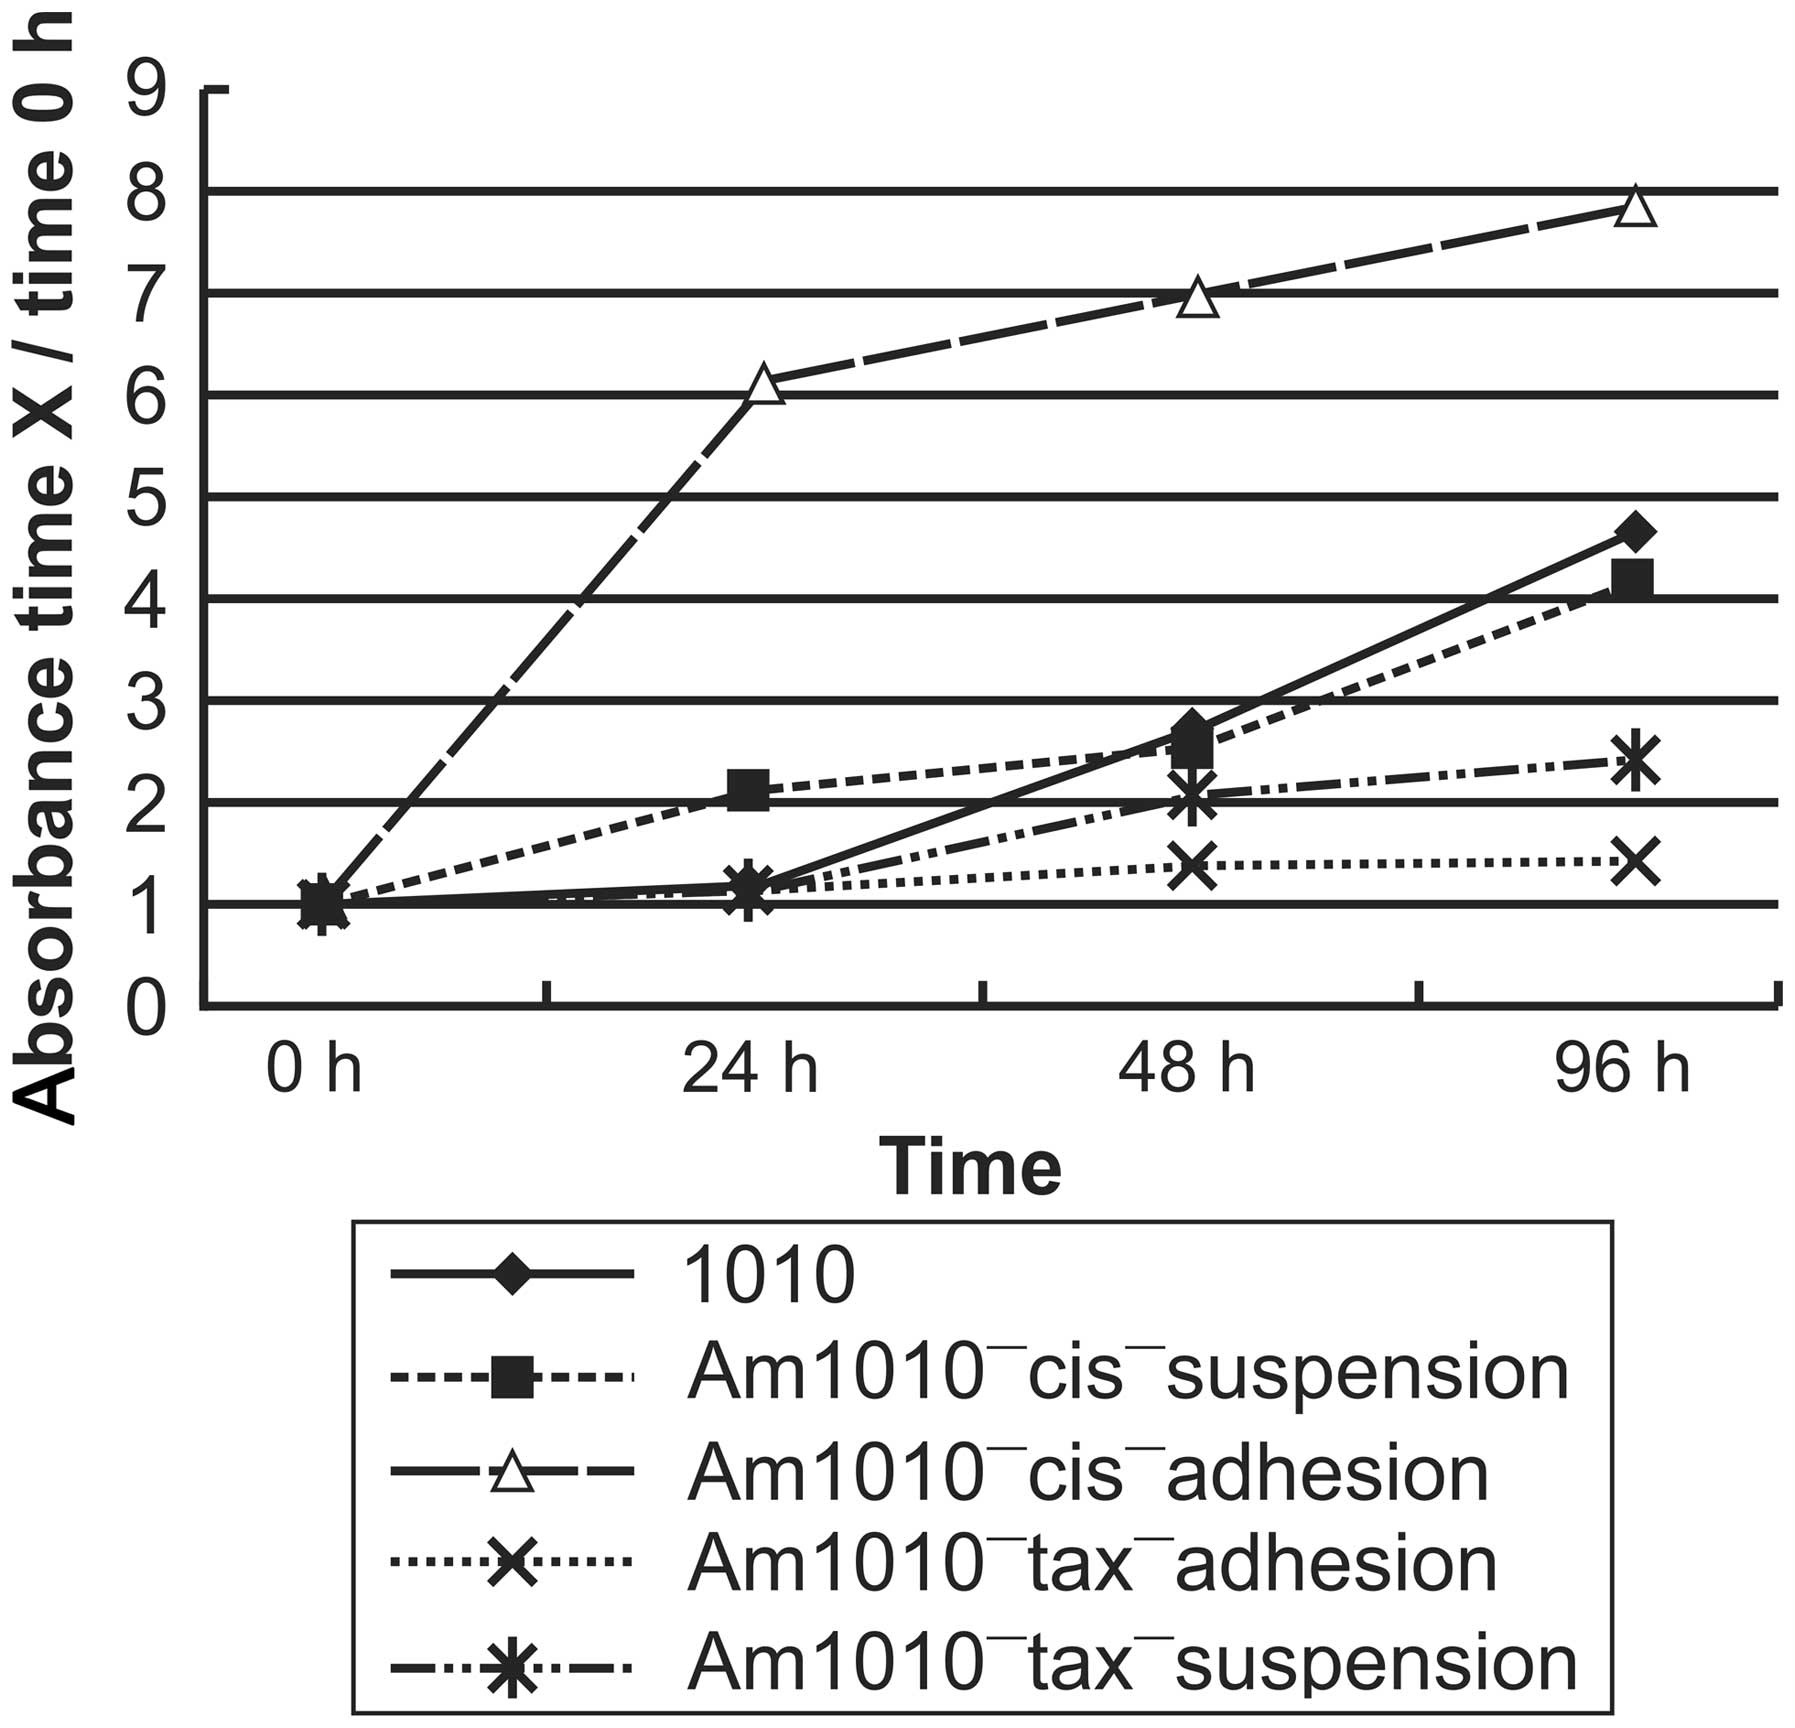
The cell proliferation rate differed among the DSC
sublines derived from Am1010-GFP and Am1010-RFP cells (P>0.05;
Fig. 5). Am1010-cis-suspension-GFP
cells and Am1010-cis-suspension-RFP cells were thus termed
Am1010-cis-suspension cells. Am1010-cis-adhesion-GFP cells and
Am1010-cis-adhesion-RFP cells were termed Am1010-cis-adhesion
cells. Am1010-tax-suspension-GFP cells and
Am1010-tax-suspension-RFP cells were termed Am1010-tax-suspension
cells. Am1010-tax-adhesion-GFP cells and Am1010-tax-adhesion-RFP
cells were termed Am1010-tax-adhesion cells. Am1010-cis-adhesion
cells and Am1010-tax-adhesion cells had the highest and lowest
proliferation rates, respectively (P<0.01).
Discussion
The present study describes the establishment of
eight DSC sublines expressing either GFP or RFP, derived by drug
exposure from the Am1010 cell line (5), which was established from a
metastasis resected from a patient with lung cancer. These cell
lines demonstrated in vitro multidrug resistance to
cisplatin and taxol. Exposure of Am1010 cells in vitro to
cisplatin or taxol resulted in sublines with varied proliferation
and ability to attach to a cell culture dish.
The variability in the ability to attach to a cell
culture dish indicated that the expression of certain genes
associated with the adhesion pathway of Am1010 cells may vary
following exposure to chemotherapy. In our previous study, eleven
adhesion pathway genes, TNC, CCND1, COL1A2, ITGA1, RRAS2, PDGFC,
SHC1, ICAM1, F11R, CLDN7 and CDH1 were observed to be
differentially expressed in a microarray analysis comparing
expression in Am1010 cells with that in P0318 cells (5). In contrast to Am1010 cells, P0318 is
a non-drug-surviving cell line. The patient from whom this cell
line was obtained had not undergone chemotherapy and exhibited the
same pathology as that of the donor of the Am1010 cell, with the
exception of the presence of metastases (5). The differential expression of these
genes in the two cell lines may be associated with their differing
metastatic ability. TNC, CCND1, COL1A2, ITGA1, RRAS2, PDGFC and
SHC1 are genes involved in the focal adhesion pathway and ICAM1,
F11R, CLDN7 and CDH1 are genes involved in the cell-adhesion
pathway. The two pathways have important roles in cancer
metastasis. The expression of these genes was consequently
evaluated following drug exposure. The drug concentration of
cisplatin and taxol in the cell cultures was 1 µM and 0.1
µM, respectively, which was similar to the levels in the
body when cisplatin was used at the dose of 80–120 mg/m2
and taxol is used at the dose of 135–250 mg/m2.
Following cisplatin exposure, all cells exhibited a
similar expression pattern for each of the eleven genes. TNC,
CCND1, COL1A2, ITGA1, RRAS2, SHC1 and ICAM1 expression was
upregulated and F11R, CLDN7 and CDH1 expression was downregulated.
PDGFC expression exhibited little variation. Gene expression was
more markedly upregulated in cells with improved attachment and
more distinctly downregulated in cells with poorer attachment.
Following taxol exposure, all eleven genes exhibited little change
in expression in cells with improved attachment. By contrast,
almost all of the evaluated genes were downregulated in cells that
attached poorly, with the exception of TNC, which exhibited little
change in expression. The differences in the adhesion properties of
the sublines suggest that drug exposure may alter the
aggressiveness and metastatic potential of cancer cells, which has
important implications for cancer chemotherapy.
Cell proliferation assays indicated very different
growth rates among the DSC sublines derived from Am1010-GFP cells
or Am1010-RFP cells. Am1010-cis-adhesion-GFP cells grew at the
fastest rate. Thus, drug resistance may led to an acceleration of
the growth of cancer cells. Enhanced proliferation may make a tumor
more aggressive. The results of the present study suggested that
chemotherapy in patients with lung cancer may give rise to DSCs
with altered proliferation and metastasis.
Levina et al (1) suggested that CSCs may be enriched and
subsequently isolated from cancer cell populations following drug
exposure. The authors isolated DSCs from human cancer cell lines
treated with cisplatin, doxorubicin or etoposide, and concluded
that the DSCs were CSCs. Levina et al (1) stated that enrichment of CSCs
following drug treatment in vitro suggests that a similar
positive selection of drug-resistant CSCs may occur in patients
during chemotherapy.
Studies by these group have demonstrated that drug
exposure of cancer cells may result in DSCs, which vary
significantly in proliferation, adhesion and gene expression
(1,7). The present data suggested that drug
exposure in cancer cells may generate highly aggressive variants.
These results have important implications for the chemotherapy of
lung cancer.
Acknowledgments
The present study was supported by the China Natural
Science Foundation (grant no. 81000951), China Natural Postdoctoral
Foundation (grant no. 20080440742), Government Technology Agency
Foundation of Guangdong Province, China (grant no. 2007B031515017),
Guangzhou City, China (grant nos. 2007Z1-E0111 and 2060402), and
the Doctor Start Foundation of Guangzhou Medical College.
Abbreviations:
|
DSC
|
drug surviving cell
|
|
CSC
|
cancer stem cell
|
References
|
1
|
Levina V, Marrangoni AM, DeMarco R,
Gorelik E and Lokshin AE: Drug-selected human lung cancer stem
cells: cytokine network, tumorigenic and metastatic properties.
PLoS One. 3:e30772008. View Article : Google Scholar : PubMed/NCBI
|
|
2
|
Nadkar A, Pungaliya C, Drake K, Zajac E,
Singhal SS and Awasthi S: Therapeutic resistance in lung cancer.
Expert Opin Drug Metab Toxicol. 2:753–777. 2006. View Article : Google Scholar : PubMed/NCBI
|
|
3
|
Peacock CD and Watkins DN: Cancer stem
cells and the ontogeny of lung cancer. J Clin Oncol. 26:2883–2889.
2008. View Article : Google Scholar : PubMed/NCBI
|
|
4
|
Tysnes BB and Bjerkvig R: Cancer
initiation and progression: involvement of stem cells and the
microenvironment. Biochim Biophys Acta. 1775:283–297.
2007.PubMed/NCBI
|
|
5
|
Li HL, Xie SM, Zhang L, et al:
Establishment and characterization of a new drug surviving cell
line Am1010, derived directly from muscle metastases of a human
lung adenocarcinoma patient with multi-drug-resistance to
cisplatin, taxol and gefitinib. Acta Pharmacol Sin. 31:601–608.
2010. View Article : Google Scholar : PubMed/NCBI
|
|
6
|
Hoffman RM and Yang M: Color-coded
fluorescence imaging of tumor-host interactions. Nat Protoc.
1:928–935. 2006. View Article : Google Scholar
|
|
7
|
Alamgeer M, Peacock CD, Matsui W, Ganju V
and Watkins DN: Cancer stem cells in lung cancer: Evdence and
controversies. Respirology. 18:757–764. 2013. View Article : Google Scholar : PubMed/NCBI
|