Introduction
Renal cell carcinoma (RCC) arises from the renal
tubular epithelium and accounts for 2–3% of all adult malignancies
in the USA (1). RCC varies widely
from region to region, with the highest rates observed in North
America and the Czech Republic (2)
and it is the tenth most common type of cancer in Europe (3). RCC includes various different
histologic subtypes that possess distinct biological behaviors and
prognoses (4). Four types of RCC
have been clinically characterized, with 85% of cases of adult RCC
being clear cell RCC (ccRCC), while the other 15% are the
papillary, chromophobe and oncocytic types (1). The incidence of ccRCC is steadily
increasing by 2.5% per year, and >64,700 new cases and 13,500
mortalities were reported in 2012 (5). Since advanced ccRCC is highly
resistant to chemotherapy and cytotoxic therapeutic agents,
one-third of patients will experience recurrence following
resection of the tumor (6).
Furthermore, a quarter of patients present with locally invasive or
metastatic RCC (7). Therefore, the
factors involved in disease progression and metastasis provide
molecular targets to facilitate the development of effective
therapeutic strategies.
Gelsolin (GSN) is a widely distributed actin-binding
protein, consisting of six domains (G1–G6), which regulates
cytoskeletal turnover. GSN has two forms that are encoded by one
gene on chromosome 9 in humans: Intracellular (cytoplasmic; cGSN)
and extracellular (plasma; pGSN). cGSN is ubiquitously expressed in
cells and tissues, and although there are various expression levels
during cell differentiation and carcinogenesis pGSN is
predominantly expressed within muscle cells (8). GSN mediates various cell functions,
including cell motility, morphogenesis and actin cytoskeletal
remodeling. The most extensively examined roles of GSN are its
actin filament severing, capping, uncapping and nucleating
activities (9). Furthermore, GSN
appears to exert complex roles in tumor biology, with evidence
supporting its involvement in tumor suppression and malignant
progression. GSN is reported to be downregulated in certain types
of tumor, including breast cancer (10) and renal clear cell carcinoma
(11), indicating that depletion
of GSN promotes oncogenesis. However, to the best of our knowledge,
there is no evidence that GSN is involved in the proliferation and
invasion of ccRCC. The aim of the current study was to investigate
the effect of GSN on the proliferation and invasion of ccRCC by
transfection of a GSN overexpression lentiviral vector,
pLen0-DCE-RTP-gelsolin, into 786-0 ccRCC cell line cells in
vitro.
Materials and methods
Cell lines and culture
The 786-0 ccRCC cell line and pack-aging cell line,
293T were purchased from the cell bank of the Chinese Academy of
Sciences (Shanghai, China) and cultured in RPMI-1640 (Gibco Life
Technologies, Carlsbad, CA, USA) and Dulbecco's modified Eagle's
medium (IBCO kit; Gibco Life Technologies) supplemented with 10%
fetal bovine serum (Takara Biotechnology Co., Ltd., Dalian, China)
and 1% penicillin-streptomycin (100 µg/ml; Invitrogen Life
Technologies, Beijing, China) for 48 h at 37°C under an atmosphere
of 5% CO2.
Construction of the
plen0-DCE-RTP-gelsolin vector and lentivirus packaging
A specific primer was designed using Primer Premier
5.0 software (Shanghai Shenggong Biology Engineering Technology
Service, Ltd., Shanghai, China) according to the nucleotide
sequences of the human GSN gene, as reported in Genebank
(http://www.ncbi.nlm.nih.gov/genbank/;
reference sequence: NM_000177.4). The primer sequence for GSN was
as follows: Forward, 5′-GGAATTCATGGCTCCGCACCGCCCC-3′; and reverse,
5′-CGGGATCCTCAGGCAGCCAGCTCAG-3′. The coding DNA sequence region of
the GSN gene was amplified using a Madison polymerase chain
reaction (PCR) kit (Promega Corporation, Madison, WI, USA)
according to the manufacturer's instructions. The target DNA gene
fragment was subcloned into the pLen0-DCE-RTP lentiviral vector
(Baili Biotechnology Co., Ltd., Shanghai, China) to construct a GSN
overexpression lentiviral vector (pLen0-DCE-RTP-gelsolin). The GSN
was identified by PCR and DNA sequencing. PCR amplification was
performed using the following reaction mixture: 1X PCR reaction
buffer (50 mM KCl and 20 mM Tris-HCl, pH 8.4; Promega Corporation),
primers (2.5 µM each), 3 mM MgCl2, 0.5 mM dNTPs,
0.4 µg template DNA, 1X Q solution and 5 Unit Taq
polymerase (Takara Biotechnology Co., Ltd.). The final reaction
volume was 50 µl. The amplification was performed under the
following conditions: 94°C for 2 min, 98°C for 10 sec, 55°C for 30
sec, 68°C for 2.5 min and 30 cycles at 68°C for 5 min using a
thermocycler (SimpliAmp™; Promega Corporation). The PCR products
were separated on a 2% agarose gel (Lonza Group Ltd., Basel,
Switzerland) using 25 and 50 bp molecular weight DNA markers
(DL2000TM) and stained with ethidium bromide (Lonza Group Ltd.).
The separated gene fragments were analyzed using a iCycler iQ™ Real
Time PCR Detection and Image Collection system (Lonza Group Ltd.).
The images were scanned using a Bio-Rad GelDoc 1000 Gel
Documentation system (Bio-Rad Laboratories, Inc., Hercules, CA,
USA). The PCR products were purified and sequenced by Gene Co.,
Ltd. (Beijing, China).
Exponential 293T cells were seeded in 10-cm cell
culture dishes (2–2.5×10⁶ cells/dish). The lentiviral
vector packaging system (volume, 1,800 µl) was added to the
cells at a density of 60–70%. After the supernatant was collected
by centrifugation at 30 × g for 15 min at 4°C, the
high-concentration lentiviral concentrate was used to infect the
293T cells. The ratio of positive cells (2×10⁸ TU/ml)
was detected by flow cytometry (FACS Calibur; BD Biosciences, San
Jose, CA, USA) and the virus titer was detected using a double
dilution assay.
Lentiviral transfection of the 786-0
ccRCC cells
Exponential 786-0 cells were seeded in 24-well
culture plates (3–5×10⁴ cells/well). The viral
supernatant with plen0-DCE-RTP-gelsolin and green fluorescent
protein (GFP) was added into the cells at a density of 70–80%.
After 72 h, the transfection ratio was determined under a
fluorescence microscope. The cells with a transfection ratio of
>80% served as the target cells and were identified by western
blot analysis.
There were three experimental groups, including the
GSN overexpression group (786-0/GSN), the empty vector group
(786-0/GFP) and a control group (786-0). All experiments were
performed in triplicate.
MTT assay
The three experimental groups of cells were seeded
in 96-well plates at 200 µl/well (1×10⁵
cells/ml). Following culturing for 0, 12, 24, 36, 48, 60 or 72 h,
20 µl MTT (5 mg/ml) was added to the well. The optical
density (OD) value of the cells was determined at a wavelength of
490 nm (GE Healthcare, Uppsala, Sweden).
Cell adhesion assay
Matrigel (Sigma-Aldrich, St. Louis, MO, USA) was
added into 96-well plates (50 µg/well). The three groups of
cells were resuspended in 0.1% bovine serum albumin (BSA) RPMI-1640
serum-free medium (Gibco Life Technologies) and added in to the
wells with the Matrigel (2×10⁴ cells/well). The 0.1%
BSA-1640 serum-free medium served as the blank group. There were
three repeated wells for each group. Following removal of the
non-adherent cells by rinsing with RPMI-1640, the OD value of the
cells in each well was determined at a wavelength of 570 nm using a
Thermo Scientific Multiskan® Spectrum spectrophotometer
(Bio-Tek Instruments, Inc., Winooski, VT, USA).
Transwell invasion assay
Transwell filters (Corning Incorporated, Corning,
NY, USA) were coated with 3.9 µg/µl Matrigel (60–80
µl). The three groups of cells were resuspended in 100
µl serum-free RPMI-1640 medium and added into the upper
compartment of the chambers. The cells migrating from the Matrigel
into the pores of the inserted filter were fixed with 100% methanol
(Sigma-Aldrich), and stained with hematoxylin (Sigma-Aldrich). The
positive-stained cells were counted under three randomly selected
visual fields at ×400 magnification with a fluorescence microscope
(SMZ1000; Nikon Corporation, Tokyo, Japan).
ELISA
Three groups of cells were seeded in 96-well plates
at 200 µl/well (1×10⁵ cells/ml) and the
supernatant was extracted by centrifugation at 30 × g for 15 min at
4°C. The expression levels of matrix metalloproteinase (MMP)2 and
MMP9 were determined using ELISA kits (Human MMP-2/Human MMP-9
DuoSet ELISA; R&D Systems Europe, Ltd., Lille, France)
according to the manufacturer's instructions.
Western blot analysis
Total protein was extracted from each of thee three
groups of cells using lysis buffer containing 50 mM Tris-HCl (pH
7.4), 150 mM NaCl, 1% Triton X-100, 0.1% SDS, and 1 mM EDTA,
supplemented with protease inhibitor cocktail (Roche Diagnostics,
Basel, Switzerland). Protein (30 µg) was subjected to
SDS-PAGE and transferred to nitrocellulose membranes
(Sigma-Aldrich). Protein samples (30 µg) were separated by
10% SDS-PAGE (Bio-Rad Laboratories, Inc.) and transferred onto
nitrocellulose membranes (Sigma-Aldrich) for 2 h at 4°C at 200 mA.
The membranes were then blocked for 1 h at room temperature with 5%
non-fat milk. Following electrophoresis of the membranes, the
proteins were incubated with primary antibodies against monoclonal
mouse anti-human MMP2 (cat. no. MAB-0244), monoclonal mouse
anti-human MMP9 (cat. no. MAB-0245) (Cell Signaling Technology,
Inc., Danvers, MA, USA), monoclonal mouse anti-human E-cadherin
(clone: NCH-38; Dako, Carpinteria, CA, USA) and monoclonal mouse
anti-human GSN (cat. no. SC-401005; Shengke Lusi Biotechnology
Ltd., Shanghai, China) at 4°C (dilution, 1:800). The membranes were
then incubated with horseradish peroxidase-conjugated antibodies
(cat. no. PV6002; Zhongshan Goldenbridge Biotechnology, Beijing,
China) for 30 min at 37°C (dilution, 1:800). The antigen-antibody
reaction was visualized by enhanced chemiluminescence
(Sigma-Aldrich) and GAPDH (cat. no. AB-82633, Abcam, Cambridge, UK)
served as the internal reference.
Statistical analysis
The data were analyzed using SPSS Software version
11.5 (SPSS, Inc., Chicago, IL, USA). The data are presented as the
mean ± standard deviation and the paired Samples t-test was
conducted to investigate differences within the groups for the
qualitative variables. P<0.05 was considered to indicate a
statistically significant difference.
Results
Construction of the
plen0-DCE-RTP-gelsolin vector and cell transfection
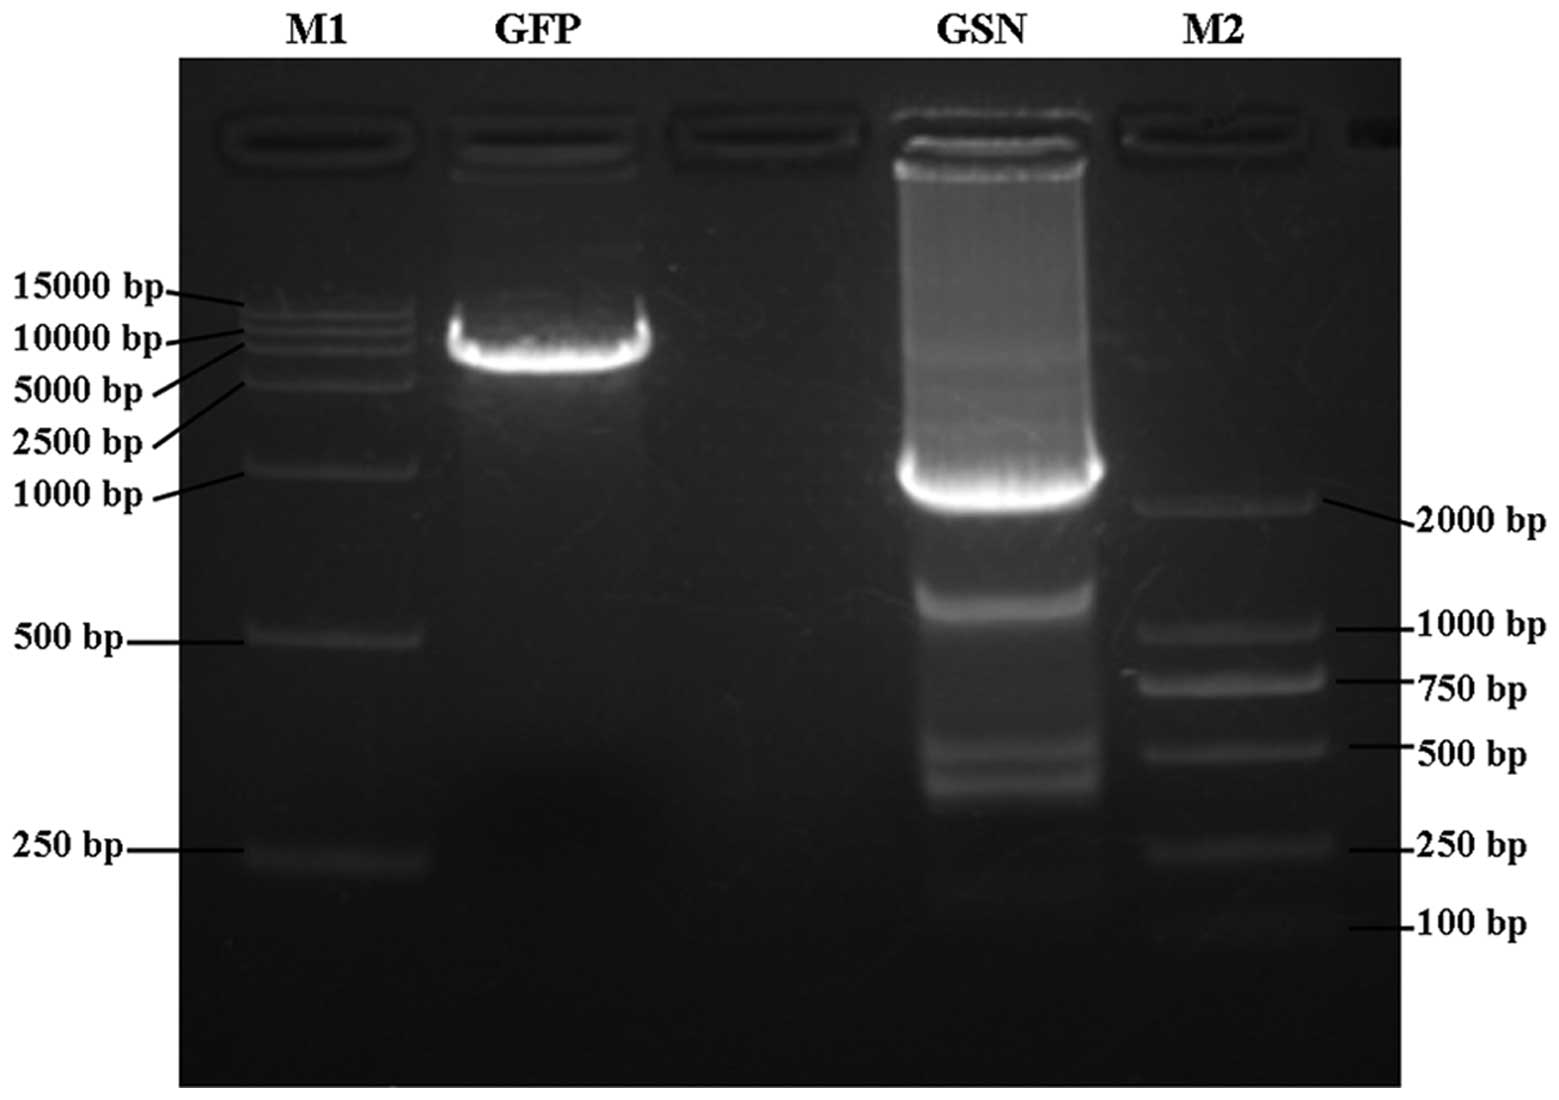
The plen0-DCE-RTP-gelsolin vector was constructed
and identified by PCR and DNA sequencing. PCR analysis demonstrated
that a single fragment was visible at ~15 kDa on 1% agarose gel
(Fig. 1). In addition, DNA
sequencing indicated that the recombinant plasmid contained the
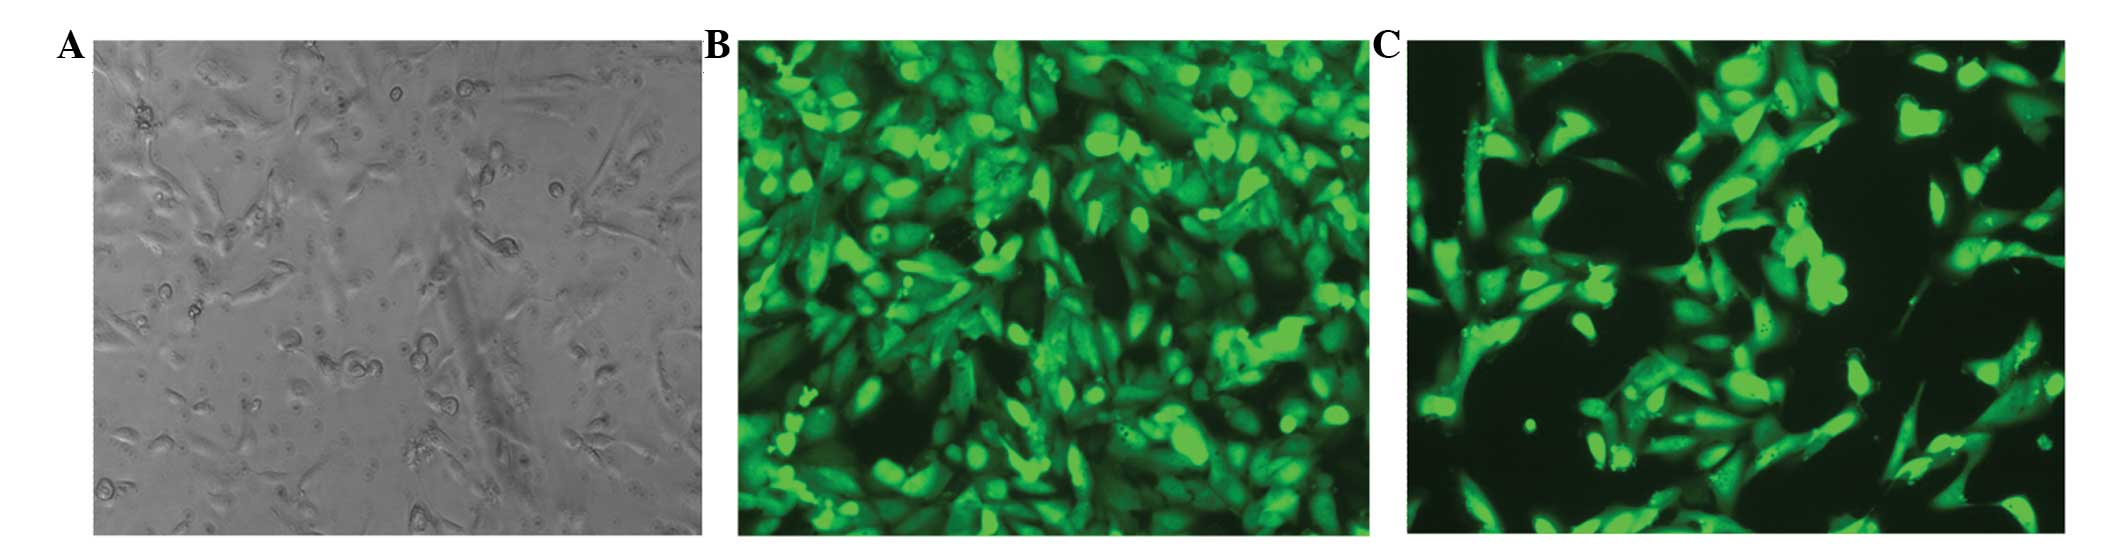
correct GSN gene fragment. The plen0-DCE-RTP-gelsolin vector (virus
titer, 2.0×10⁸ TU/ml) was transfected into the 786-0
ccRCC cells. Green fluorescence was apparent in the infected 786-0
cells, as observed under a fluorescence microscope, and indicated
successful transfection (Fig. 2).
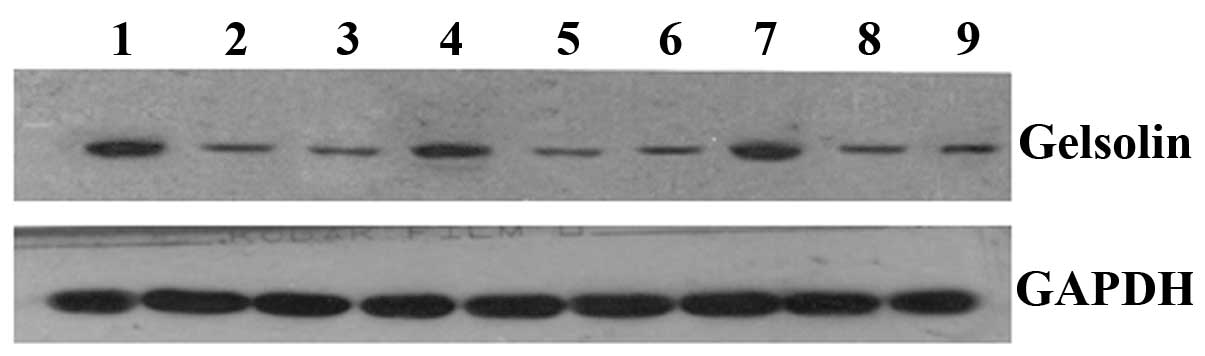
Western blot analysis demonstrated that the expression level of GSN
was markedly increased in the 786-0/GSN cells, when compared with
the 786-0/GFP and 786-0 cells (Table
II and Fig. 3).
 | Table IIGray values of the three groups of
ccRCC 786-0 cells as determined by western blotting. |
Table II
Gray values of the three groups of
ccRCC 786-0 cells as determined by western blotting.
| Groups
(t-value) | MMP-2/GAPDH | P-value | MMP-9/GAPDH | P-value |
E-cadherin/GAPDH | P-value | Gelsolin/GAPDH | P-value |
|---|
| Group 1 | 14.981 | <0.001 | 9.052 | 0.001 | 12.645 | 0.001 | 9.181 | 0.001 |
| Group 2 | 30.654 | <0.001 | 9.749 | 0.001 | 8.338 | 0.001 | 8.212 | 0.001 |
| Group 3 | 2.115 | 0.102 | 2.396 | 0.075 | 0.251 | 0.814 | 1.389 | 0.237 |
Inhibition effect of GSN on the
proliferation of 786-0 ccRCC cells
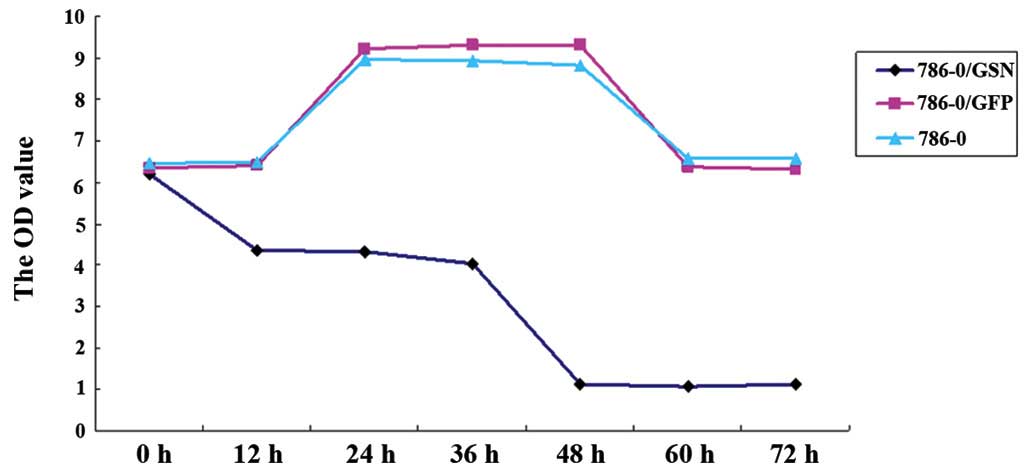
To investigate the effect of GSN on 786-0 cell
proliferation, the cell viability of the transfected and
non-transfected 786-0 cells was measured at 0, 12, 24, 36, 48, 60
and 72 h using the MTT method. As shown in Fig. 4 and Table I, the OD value of the 786-0/GSN
cells was significantly lower than that of the 786-0/GFP and 786-0
cells following culture for 24 h (P<0.05), and the difference
was more apparent following a longer culture period (P<0.001 for
36–72 h). No statistical differences were observed at the various
time points between the 786-0/GFP and 786-0 groups (P>0.05).
These results indicate that GSN may inhibit the proliferation of
786-0 cells in vitro.
| Table IOptical density values of the three
groups of 786-0 clear cell renal cell carcinoma cells following
culture for 0, 12, 24, 36, 48, 60 and 72 h (mean ± standard
deviation). |
Table I
Optical density values of the three
groups of 786-0 clear cell renal cell carcinoma cells following
culture for 0, 12, 24, 36, 48, 60 and 72 h (mean ± standard
deviation).
| Group | Optical density
|
|---|
| 0 h | 12 h | 24 h | 36 h | 48 h | 60 h | 72 h |
|---|
| 786-0/GSN | 6.2100±0.02000 | 4.3533±0.04041 | 4.3333±0.03512 | 4.0267±0.04509 | 1.1067±0.03215 | 1.0800±0.03000 | 1.1200±0.04583 |
| 786-0/GFP | 6.3433±0.03215 | 6.3900±0.02000 | 9.2333±0.03215 | 9.3067±0.02517 | 9.2967±0.04726 | 6.3667±0.03215 | 6.3100±0.02000 |
| 786-0 | 6.4533±0.02517 | 6.4733±0.02082 | 8.9500±0.03000 | 8.9200±0.02646 | 8.8300±0.02646 | 6.5567±0.03055 | 6.5567±0.04163 |
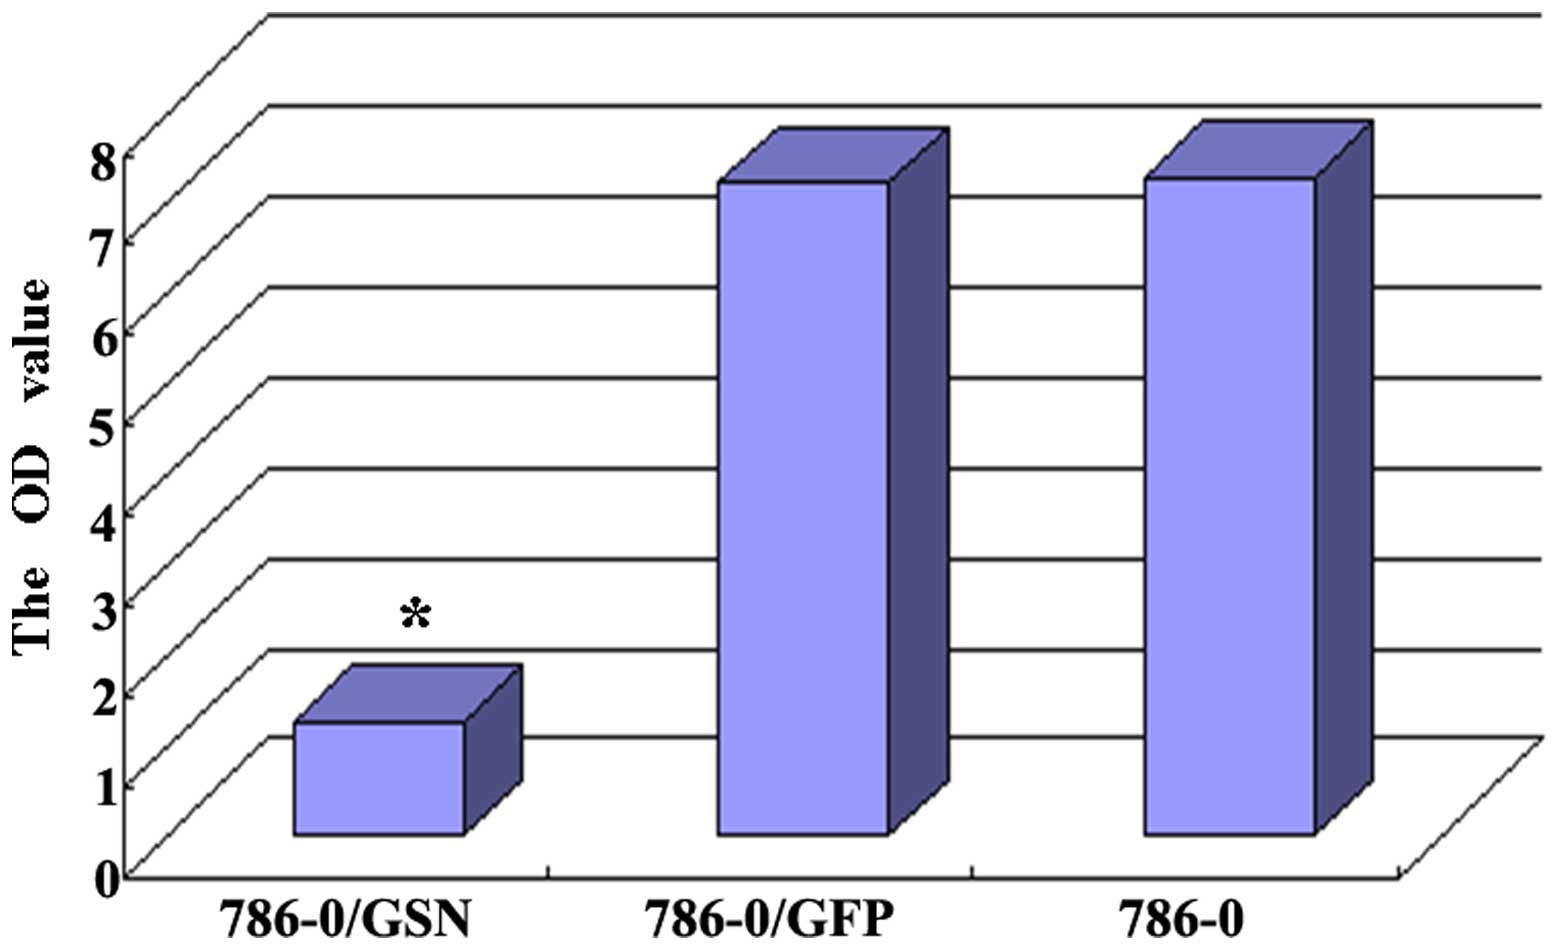
Inhibition effect of GSN on the adhesion
of 786-0 ccRCC cells
The effect of GSN on the adhesion ability of 786-0
cells was also examined using the MTT method. As shown in Fig. 5, the OD value of the 786-0/GSN
cells (1.2600±0.02646) was decreased when compared with the
786-0/GFP and 786-0 cells (7.2533±0.04041 and 7.3000±0.02646,
respectively). The difference between the 786-0/GSN group and the
other two groups (t=214.902; P<0.0001 and t=279.598; P<0.0001
compared with the 786-0/GFP and 786-0 groups, respectively). was
identified to be significant; however, no statistical difference
was observed in the OD value between the 786-0/GFP group and the
786-0 group (t=1.673; P=0.181). The result revealed that the extent
of 786-0/GSN cell adherence to the culture plates was markedly
lower than that of the 786-0/GFP and 786-0 groups.
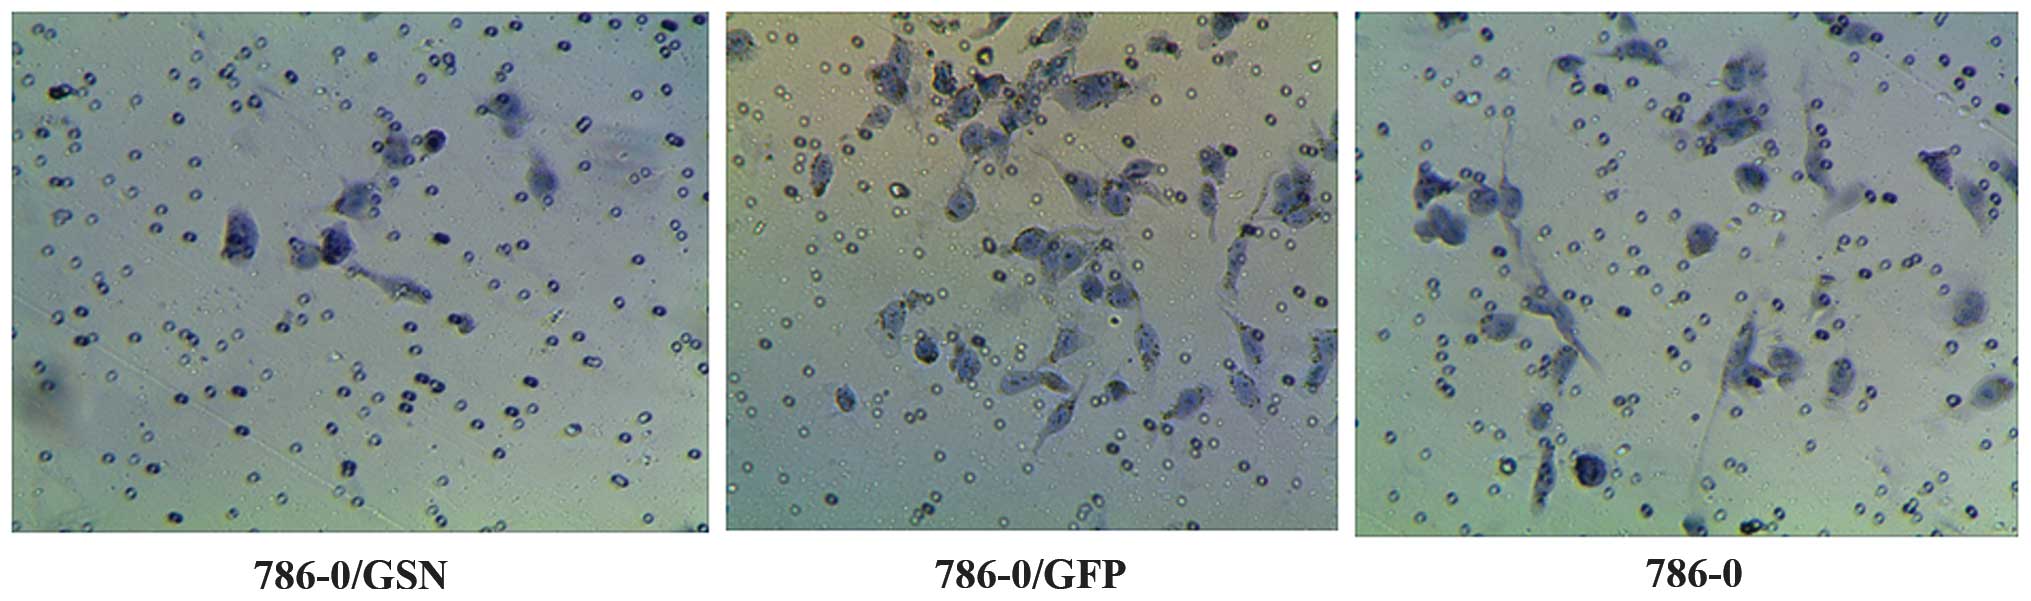
Effect of GSN on the invasion ability of
786-0 ccRCC cells
The effect of GSN on the invasion ability of 786-0
cells was observed by penetration experiments using Transwell
chambers coated in Matrigel. The cells that possess invasion
ability digest Matrigel and are able to penetrate the 8-µm
pores on the polycarbonate membrane. In the present study, fewer
cells were observed to penetrate the Matrigel in the 786-0/GSN
group, as compared with the cells of the 786-0/GFP and 786-0 groups
(Fig. 6). The average penetration
rate of the 786-0/GSN cells (6.8000±0.83666) was significantly
lower than that of the 786-0/GFP (19.2000±4.32435) and 786-0
(19.0000±4.35890) cells (t=6.295, P<0.0001; t=6.146,
P<0.0001). No statistical difference was identified in average
penetration rate between the 786-0/GFP and 786-0 groups (t=0.073;
P=0.944).
Effect of GSN on the expression levels of
MMP2, MMP9 and E-cadherin
The expression levels of MMP2 and MMP9 were detected
in the transfected and non-transfected 786-0 cells using the ELISA
method. As shown in Fig. 7, the
expression levels of MMP2 and MMP9 were significantly decreased in
the 786-0/GSN cells, and the OD value of MMP2 and MMP9 in the
786-0/GSN cells (1.0400±0.03606 and 3.6067±0.07506, respectively)
was lower than that of the 786-0/GFP (2.6633±0.08327 and
5.8633±0.03055, respectively) and 786-0 cells (2.7667±0.01528 and
5.9133±0.04509, respectively) following 48 h of transfection, with
a significant difference between the 786-0/GSN and 786-0/GFP cells
(t=30.987, P<0.0001; t=48.234, P<0.0001) and between the
786-0/GSN and 786-0 cells (t=76.375, P<0.0001; t=45.629,
P<0.0001). No statistical difference was noted between the
786-0/GFP and 786-0 cells (t=2.114, P=0.161; t=1.590, P=0.197).
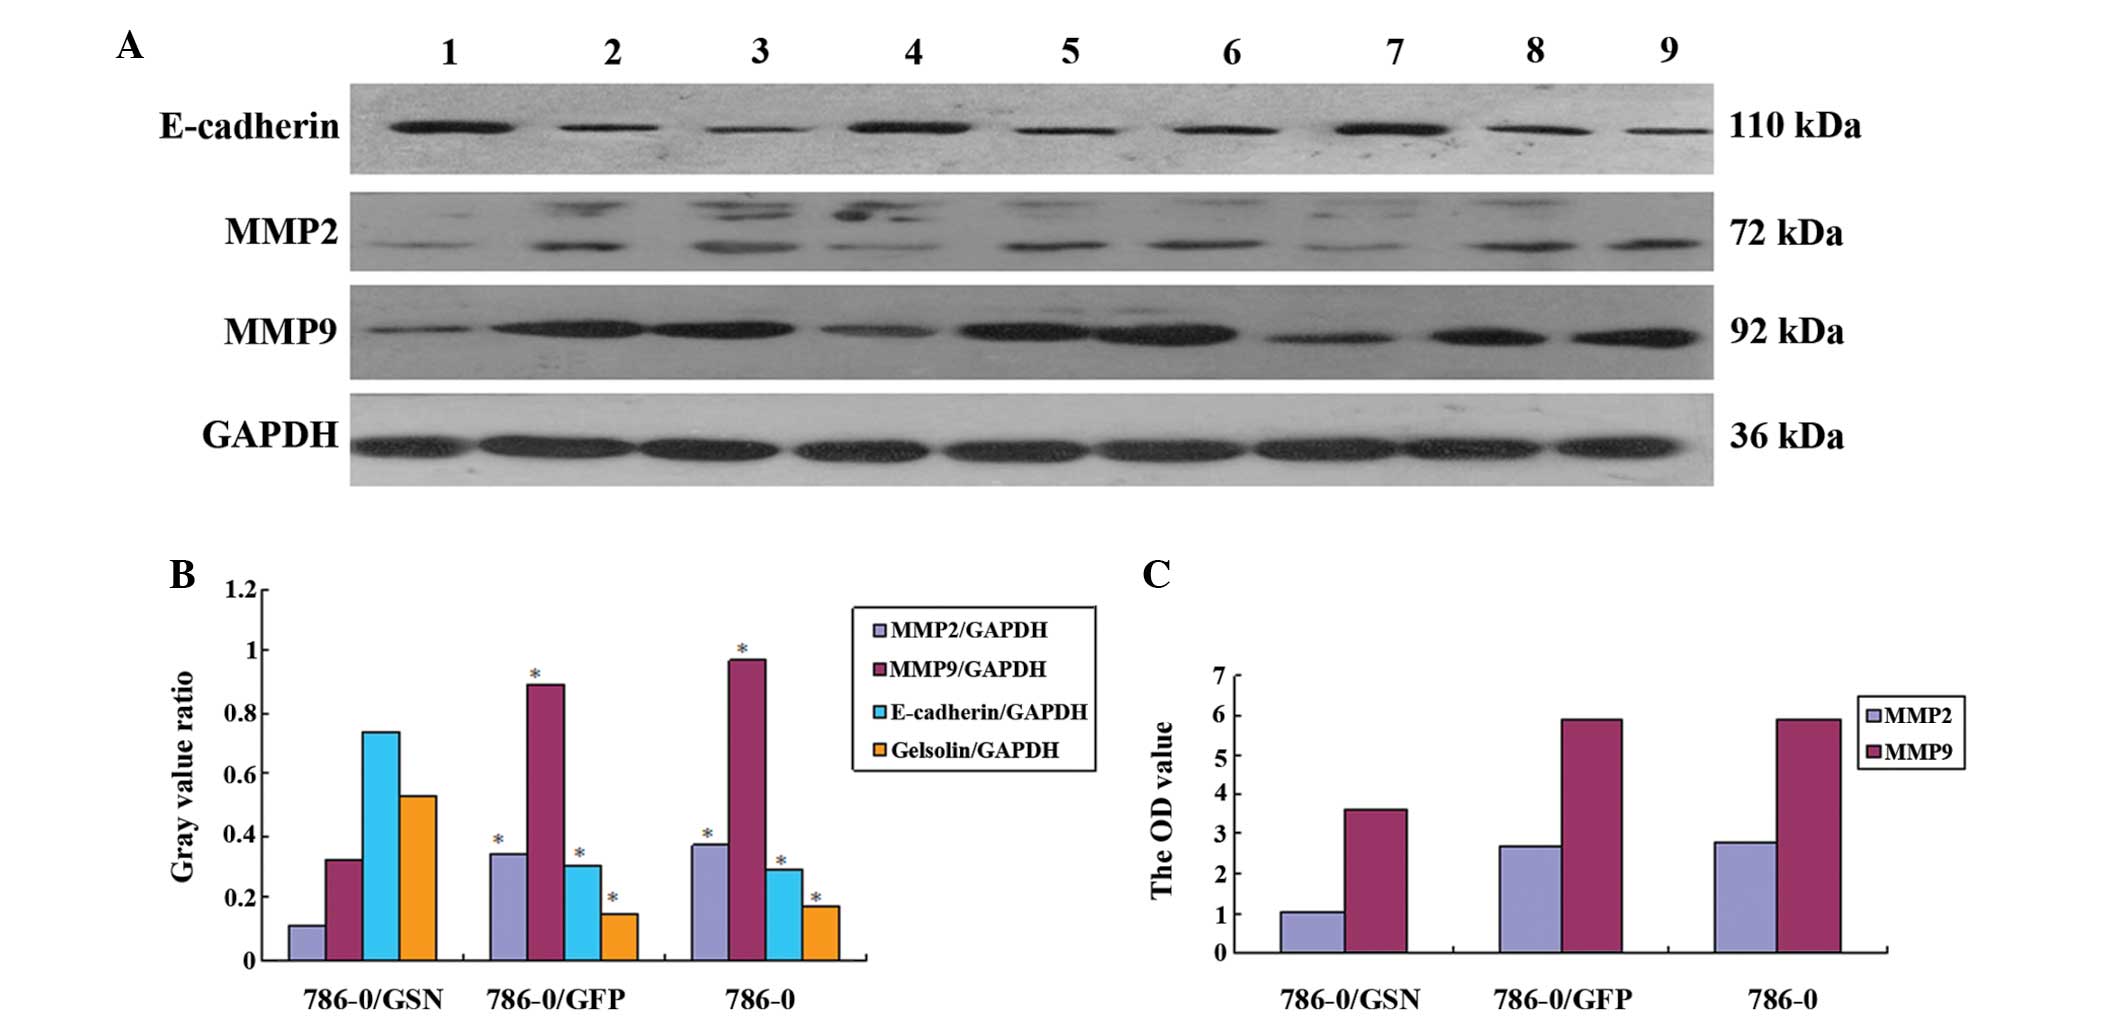 | Figure 7Effect of GSN on the level of MMP2,
MMP9 and E-cadherin. (A) Western blot analysis of MMP2, MMP9 and
E-cadherin expression levels. There were three specimens in each
group: Lanes 1, 4 and 7, 786-0/GSN; lanes 2, 5 and 8, 786-0/GFP;
lanes 3, 6 and 9, 786-0. The expression of MMP2 and MMP9 was
markedly decreased in the 786-0/GSN cells, while the expression of
E-cadherin was markedly increased. (B) Statistical differences were
analyzed with a Samples t-test between the 786-0/GSN group and the
other groups (P<0.01). 786-0/GSN, vs. 786-0/GFP: t=14.981 and
P<0.001 for MMP2; t=9.052 and P<0.001 for MMP9; t=12.645 and
P<0.001 for E-cadherin; t=9.181 and P<0.001 for Gelsolin.
786-0/GSN, vs. 786-0: t=30.654 and P<0.001 for MMP2; t=9.749 and
P<0.001 for MMP9; t=8.338 and P<0.001 for E-cadherin; t=8.212
and P<0.001 for Gelsolin. No statistical difference was found
between 786-0/GFP and 786-0: t=2.115 and P=0.102 for MMP2; t=2.396
and P=0.075 for MMP9; t=0.251 and P=0.814 for E-cadherin; t=1.389
and P=0.237 for Gelsolin. 786-0/GSN, vs. 786-0/GFP: P<0.01;
786-0/GSN, vs. 786-0: P<0.01; 786-0/GFP, vs. 786-0: P>0.05.
(C) The OD value of MMP2 and MMP9 in the three groups as assessed
using the ELISA method. The expression level and OD value of MMP2
and MMP9 were significantly decreased in the 786-0/GSN cells as
compared with the 786-0/GFP and 786-0 cells (P<0.0001). GSN,
gelsolin; GFP, green fluorescent protein; MMP, matrix
metalloproteinase. |
To further elucidate the effect of GSN on the
expression levels of MMP2 and MMP9, the expression level of the two
proteins was assessed by western blot analysis. E-cadherin was also
analyzed. It was identified that in the 786-0/GSN cells, the
expression levels of MMP2 and MMP9 were markedly decreased, while
the expression level of E-cadherin was markedly increased (Fig. 7). Significant differences were
observed between the 786-0/GSN group and the other two groups
[786-0/GSN vs. 786-0/GFP: t=14.981 (P<0.001) for MMP2; t=9.052
(P<0.001) for MMP9; and t=12.645 (P<0.001) for E-cadherin;
786-0/GSN vs. 786-0: t=30.654 (P<0.001) for MMP2; t=9.749
(P<0.001) for MMP9; and t=8.338 (P<0.001) for E-cadherin]. No
statistically significant difference was observed between the
786-0/GFP and 786-0 groups [t=2.115 (P=0.102) for MMP2; t=2.396
(P=0.075) for MMP9; and t=0.251 (P=0.814) for E-cadherin].
Discussion
RCC is the most common neoplasm of the adult kidney
and the most prevalent type of kidney tumor is the ccRCC subtype
(4). However, the exact molecular
mechanism of ccRCC remains to be elucidated. The treatment of
metastatic ccRCC continues to be a challenge for clinicians and
causes ~35% of RCC-associated mortalities (12). The majority of RCC patients already
exhibit either metastatic disease at the initial diagnosis or
distant metastases following primary tumor resection (13). Since advanced ccRCC is highly
resistant to chemotherapy and cytotoxic drugs, following tumor
resection a third of the patients will have a recurrence.
Furthermore, a quarter of the patients present locally invasive or
metastatic RCC (7). This therefore
led to the speculation that the prognosis of ccRCC is poor partly
due to the fact that certain factors correlate with its
proliferation and invasion. In recent years, particular focus has
been placed on actin-binding proteins and their participation in
the migratory process of cancer cells. Therefore, in the present
study, GSN was selected as a novel biological marker to investigate
its role in the proliferation and invasion of ccRCC.
The effect of GSN on the proliferation of 786-0
ccRCC cells was observed. An MTT assay revealed that the OD value
of 786-0/GSN cells was markedly lower than that of 786-0/GFP and
786-0 cells after being cultured for 24 h, and the difference was
more apparent with a longer culture duration. The result indicates
that GSN inhibits the proliferation of 786-0 ccRCC cells. GSN is a
Ca2+-activated actin-binding protein that severs F-actin
filaments by breaking non-covalent bonds between the actin monomers
in a polymer. It results in high-affinity complexes of GSN, which
remain bound to the barbed ends of filaments, thus inhibiting
extension ('capped' filaments) (14). On reduction of free intracellular
Ca2+ levels, and in the presence of
polyphosphoinositides, GSN is released from the barbed ends to
provide sites for rapid actin filament extension. GSN is the most
potent actin filament-severing protein that has been identified to
date (9). The data from the
present study implied that overexpression of GSN may inhibit the
proliferation of 786-0 ccRCC cells. To the best of our knowledge,
there are only a small number of relevant studies on the
association between GSN and ccRCC, therefore, the specific
pathogenesis requires further investigation.
The effect of GSN on the adhesion ability of 786-0
ccRCC cells was examined using the MTT method. The OD value of the
786-0/GSN cells was observed to be significantly decreased when
compared with the 786-0/GFP and 786-0 cells. This indicated that
GSN inhibits the adhesion ability of 786-0 cells. A previous study
proposed that actin capping, nucleation and severing are important
functions of GSN, which are required for regulation of adhesion
maturation and collagen matrix remodeling. The study demonstrated
that minor inhibition of the severing function of GSN, by binding
to non-muscle myosin IIA, may be necessary initially to prevent
actin depolymerization in the locale of adhesions (15). In addition, Ke et al
(16) identified that B cell
lymphoma-2 (BCL2) forms a complex with actin and GSN to decrease
GSN-severing activity and increase actin polymerization, which
suppresses the cell adhesion processes. The association between
increased BCL2, and actin polymerization and suppression of cell
adhesion was a novel observation that may provide a plausible
explanation to elucidate whether BCL2 overexpression in certain
tumors is correlated with improved patient survival (16). However, a fundamental
characteristic of malignant and transformed cells is the aberrant
organization of the actin cytoskeleton, resulting from the
associated disruption of the cytoskeleton (9). This may lead to the inhibitory action
of GSN overexpression on the adhesions of 786-0 cells, however, the
exact mechanisms have not been clearly elucidated.
The effect of GSN on the invasion ability of 786-0
cells was evaluated using penetration experiments with Transwell
chambers coated in Matrigel. Fewer cells had penetrated the
Matrigel in the 786-0/GSN group, when compared with the cells of
the 786-0/GFP and 786-0 groups. The average penetration rate of the
786-0/GSN cells was lower than that of the 786-0/GFP and 786-0
cells. The result indicates that over-expression of GSN may inhibit
the invasion of 786-0 ccRCC cells. These findings contrast with
those of existing studies. Zhuo et al (17) revealed novel functions of GSN in
colorectal tumor cells, where invasion was promoted via modulation
of the urokinase-type plasminogen activator cascade, with GSN
potentially exerting a significant role in colorectal tumor
dissemination to metastatic sites. The results of Zhuo et al
(17) may be marginally
attributable to the actin depolymerizing effect of GSN. However, a
recent study demonstrated that the nuclear import of GSN-like
actin-capping protein, as another GSN family member, and GSN had
been identified to be significant in non-small cell lung cancer
invasion and metastasis (18).
Furthermore, De Corte et al (19) revealed that invasion induced by GSN
was dependent on Ras activity, acting through the PI3K-Rac
signaling pathway via the Ras guanine nucleotide exchange factor,
Sos-1. These findings established a connection between GSN and the
Ras oncogenic signaling pathway (19).
In order to investigate the mechanisms of GSN
inhibiting the invasion of 786-0 ccRCC cells, the expression levels
of MMP2, MMP9 and E-cadherin were detected in the current study.
ELISA and western blot analysis revealed that GSN downregulated the
expression levels of MMP2 and MMP9 in the 786-0 cells, which was
consistent with previous studies (20,21).
Numerous molecules are involved in tumor invasion, including MMPs.
MMPs are a family of related enzymes that degrade the extracellular
matrix (ECM). The activation of these enzymes enables tumor cells
to access the vasculature, invade target organs and develop into
tumor metastases. Previous studies have indicated that full length
plasma GSN is a known substrate for the MMPs, and is cleaved most
efficiently by MMP3, followed by MMP2 and MMP9. Three sites that
are cleaved by MMP2 and MMP9 in full length plasma GSN were
identified and all were in unstructured regions (22). A recent study observed that furin
cleavage of full length D187N GSN cleaved an internal β-strand in
the G2 domains, which may lead to unfolding of the G2 domains that
are particularly susceptible to cleavage by proteases, including
the MMPs in the ECM (8). Although
MMP2 and MMP9 were associated with the structure of GSN, the
mechanisms of downregulating the expression levels of MMP2 and MMP9
in 786-0 ccRCC cells were not elucidated in the current study. The
expression level of E-cadherin was also analyzed by western
blotting in the present study; conversely, it was identified that
GSN upregulated the expression of E-cadherin. The E-cadherin gene
is a tumor suppressing gene that expresses the E-cadherin
transmembrane glycoprotein, which plays a significant role in
adhesion and differentiation of epithelial cells; an important
protective mechanism against neoplasm formation (23). Rao et al (24) reported that alterations in the
expression levels of the cytoskeletal proteins, GSN and E-cadherin,
had been implicated in urothelial carcinoma tumorigenesis.
Furthermore, GSN and E-cadherin possess distinctive expression
patterns. GSN, but not E-cadherin, provided independent prognostic
information for high-grade urothelial carcinomas. However, the
mechanism underlying how the altered expression levels were
associated with tumor progression was unclear. Therefore, it was
hypothesized in the present study that the upregulation of
E-cadherin is closely associated with GSN, so as to inhibit
invasion of 786-0 ccRCC cells; although the exact pathogenesis
remains unclear.
In conclusion, GSN was examined in vitro, and
was observed to inhibit the proliferation and invasion of 786-0
ccRCC cells. These findings contribute to the existing knowledge on
the biological functions of GSN and its effects on ccRCC. Numerous
in vivo experiments on the impact of GSN in patients with
ccRCC were not included in the results of the present study, which
may be considered as a limitation of the study. Future
investigations are required in order that more clinical samples may
be collected, and the proliferation and invasion of ccRCC may be
investigated in more depth. These findings may demonstrate whether
GSN could serve as a novel molecular target for the development of
effective therapeutic strategies to prevent the metastasis of
kidney carcinoma and, therefore, improve the survival rates of
patients with ccRCC.
Acknowledgments
The authors would like to thank Dr Xiaoling Zhu,
Professor Limin Cai, Professor Qinggang Meng and Professor Xiaoming
Jin who participated in this study, as well as their colleagues for
their cooperation. The authors would also like to thank the
laboratory of Wei Si Teng Company (Chongqing, China; www.cqwestern.com) for assisting with the
research.
Abbreviations:
|
GFP
|
green fluorescent protein
|
|
GSN
|
gelsolin
|
|
MTT
|
3-(4,5-dimethylthiazol-2-yl)-2,5-diphenyltetrazolium bromide
|
References
|
1
|
Bastola P, Stratton Y, Kellner E,
Mikhaylova O, Yi Y, Sartor MA, Medvedovic M, Biesiada J, Meller J
and Czyzyk-Krzeska MF: Folliculin contributes to VHL tumor
suppressing activity in renal cancer through regulation of
autophagy. PLoS One. 8:e700302013. View Article : Google Scholar : PubMed/NCBI
|
|
2
|
Chow WH, Dong LM and Devesa SS:
Epidemiology and risk factors for kidney cancer. Nat Rev Urol.
7:245–257. 2010. View Article : Google Scholar : PubMed/NCBI
|
|
3
|
Ferlay J, Shin HR, Bray F, Forman D,
Mathers C and Parkin DM: Estimates of worldwide burden of cancer in
2008: GLOBOCAN 2008. Int J Cancer. 127:2893–2917. 2010. View Article : Google Scholar
|
|
4
|
Kovacs G, Akhtar M, Beckwith BJ, Bugert P,
Cooper CS, Delahunt B, Eble JN, Fleming S, Ljungberg B, Medeiros
LJ, et al: The Heidelberg classification of renal cell tumours. J
Pathol. 183:131–133. 1997. View Article : Google Scholar : PubMed/NCBI
|
|
5
|
Ramakrishnan S, Ellis L and Pili R:
Histone modifications: Implications in renal cell carcinoma.
Epigenomics. 5:453–462. 2013. View Article : Google Scholar : PubMed/NCBI
|
|
6
|
Kim HL, Seligson D, Liu X, Janzen N, Bui
MH, Yu H, Shi T, Figlin RA, Horvath S and Belldegrun AS: Using
protein expressions to predict survival in clear cell renal
carcinoma. Clin Cancer Res. 10:5464–5471. 2004. View Article : Google Scholar : PubMed/NCBI
|
|
7
|
Chuang MJ, Sun KH, Tang SJ, Deng MW, Wu
YH, Sung JS, Cha TL and Sun GH: Tumor-derived tumor necrosis
factor-alpha promotes progression and epithelial-mesenchymal
transition in renal cell carcinoma cells. Cancer Sci. 99:905–913.
2008. View Article : Google Scholar : PubMed/NCBI
|
|
8
|
Solomon JP, Page LJ, Balch WE and Kelly
JW: Gelsolin amyloidosis: Genetics biochemistry pathology and
possible strategies for therapeutic intervention. Crit Rev Biochem
Mol Biol. 47:282–296. 2012. View Article : Google Scholar : PubMed/NCBI
|
|
9
|
Li GH, Arora PD, Chen Y, McCulloch CA and
Liu P: Multifunctional roles of gelsolin in health and diseases.
Med Res Rev. 32:999–1025. 2012. View Article : Google Scholar : PubMed/NCBI
|
|
10
|
Baig RM, Mahjabeen I, Sabir M, Masood N,
Ali K, Malik FA and Kayani MA: Mutational spectrum of gelsolin and
its down regulation is associated with breast cancer. Dis Markers.
34:71–80. 2013. View Article : Google Scholar : PubMed/NCBI
|
|
11
|
Visapää H, Bui M, Huang Y, Seligson D,
Tsai H, Pantuck A, Figlin R, Rao JY, Belldegrun A, Horvath S and
Palotie A: Correlation of Ki-67 and gelsolin expression to clinical
outcome in renal clear cell carcinoma. Urology. 61:845–850. 2003.
View Article : Google Scholar : PubMed/NCBI
|
|
12
|
Siegel R, Naishadham D and Jemal A: Cancer
statistics 2012. CA Cancer J Clin. 62:10–29. 2012. View Article : Google Scholar : PubMed/NCBI
|
|
13
|
Finley DS, Pantuck AJ and Belldegrun AS:
Tumor biology and prognostic factors in renal cell carcinoma.
Oncologist. 16(Suppl 2): S4–S13. 2011. View Article : Google Scholar
|
|
14
|
Nag S, Larsson M, Robinson RC and Burtnick
LD: Gelsolin: The tail of a molecular gymnast. Cytoskeleton
(Hoboken). 70:360–384. 2013. View
Article : Google Scholar
|
|
15
|
Arora PD, Wang Y, Bresnick A, Dawson J,
Janmey PA and McCulloch CA: Collagen remodeling by phagocytosis is
determined by collagen substrate topology and calcium-dependent
interactions of gelsolin with nonmuscle myosin IIA in cell
adhesions. Mol Biol Cell. 24:734–747. 2013. View Article : Google Scholar : PubMed/NCBI
|
|
16
|
Ke H, Zhang JY, Akiyama SK and French JE:
BCL2 interaction with actin in vitro may inhibit cell motility by
enhancing actin polymerization. Cell Adh Migr. 5:6–10. 2011.
View Article : Google Scholar :
|
|
17
|
Zhuo J, Tan EH, Yan B, Tochhawng L,
Jayapal M, Koh S, Tay HK, Maciver SK, Hooi SC, Salto-Tellez M, et
al: Gelsolin induces colorectal tumor cell invasion via modulation
of the urokinase-type plasminogen activator cascade. PloS One.
7:e435942012. View Article : Google Scholar : PubMed/NCBI
|
|
18
|
Zhu WY, Hunag YY, Liu XG, He JY, Chen DD,
Zeng F, Zhou JH and Zhang YK: Prognostic evaluation of CapG
gelsolin P-gp GSTP1 and Topo-II proteins in non-small cell lung
cancer. Anat Rec (Hoboken). 295:208–214. 2012. View Article : Google Scholar
|
|
19
|
De Corte V, Bruyneel E, Boucherie C,
Mareel M, Vandekerckhove J and Gettemans J: Gelsolin-induced
epithelial cell invasion is dependent on ras-rac signaling. EMBO J.
21:6781–6790. 2002. View Article : Google Scholar : PubMed/NCBI
|
|
20
|
Liao CJ, Wu TI, Huang YH, Chang TC, Wang
CS, Tsai MM, Hsu CY, Tsai MH, Lai CH and Lin KH: Overexpression of
gelsolin in human cervical carcinoma and its clinicopathological
significance. Gynecol Oncol. 120:135–144. 2011. View Article : Google Scholar
|
|
21
|
Zhan L, Zhang H, Zhang Q, Woods CG, Chen
Y, Xue P, Dong J, Tokar EJ, Xu Y, Hou Y, et al: Regulatory role of
KEAP1 and NRF2 in PPARγ expression and chemoresistance in human
non-small-cell lung carcinoma cells. Free Radic Biol Med.
53:758–768. 2012. View Article : Google Scholar : PubMed/NCBI
|
|
22
|
Park SM, Hwang IK, Kim SY, Lee SJ, Park KS
and Lee ST: Characterization of plasma gelsolin as a substrate for
matrix metalloproteinases. Proteomics. 6:1192–1199. 2006.
View Article : Google Scholar : PubMed/NCBI
|
|
23
|
Anbiaee R, Mojir Sheibani K, Torbati P and
Jaam H: Abnormal expression of e-cadherin in gastric adenocarcinoma
and its correlation with tumor histopathology and helicobacter
pylori infection. Iran Red Crescent Med J. 15:218–222. 2013.
View Article : Google Scholar : PubMed/NCBI
|
|
24
|
Rao J, Seligson D, Visapaa H, Horvath S,
Eeva M, Michel K, Pantuck A, Belldegrun A and Palotie A: Tissue
microarray analysis of cytoskeletal actin-associated biomarkers
gelsolin and E-cadherin in urothelial carcinoma. Cancer.
95:1247–1257. 2002. View Article : Google Scholar : PubMed/NCBI
|