Introduction
Pilocytic astrocytoma (PA) is one of the most common
types of tumor to emerge in the central nervous system, and occur
predominantly in childhood and adolescence. PAs are typically
relatively circumscribed astrocytomas, which most frequently
develop in the cerebellar hemispheres and in midline structures,
including the hypothalamus and optic tract (1). PAs are known as benign tumors, as
they are generally indolent with slow growing lesions, and have
favorable prognosis (2,3). The survival of rate of >80% of
patients with PAs is >10 years following surgical intervention,
with or without radiation therapy (4,5).
DNA methylation is a biological mechanism, which is
important in several cellular processes. Aberrant DNA methylation
of CpG islands, particularly the CpG island shores and first exons,
may lead to altered gene expression in human cancer (6,7),
resulting in either global hypomethylation or hypermethylation.
Gene expression and methylation may be positively and negatively
correlated. Previous integrated analysis of DNA methylation and
gene expression profiles has become a favorable method in
investigating disease pathogenesis, particularly in cancer
(8,9).
However, the molecular mechanism underlying the
invasion and development of PAs remains to be elucidated. In the
present study, the gene expression and DNA methylation profiles
were investigated together. The identified differentially expressed
genes (DEGs), differentially methylated regions (DMRs) and
associated functions may be useful for the elucidation of the
underlying mechanisms of PA, providing novel insights and potential
therapeutic strategies for the treatment of PAs.
Materials and methods
Microarray data
The microarray data, GSE44684 and GSE44971 (10), were downloaded from the Gene
Expression Omnibus (GEO) database (11,12)
(http://www.ncbi.nlm.nih.gov/geo/). The
GSE44684 data were methylation microarray data based on the
GPL13534 platform (Infinium Human Methylation 450 Bead Chips;
Illumina, San Diego, CA, USA), which included 67 samples (61 PA
samples and six normal cerebellar samples). The GSE44971 data were
of an mRNA expression microarray based on the [HG-U133_Plus_2]
Affymetrix Human Genome U133 Plus 2.0 Array GPL570 platform,
comprising 58 samples (49 PA samples and nine normal cerebellar
samples). In addition, the clinical features of the data were
summarized (Table I), indicating
that the patients with PAs were generally younger.
 | Table IClinical features of the methylation
and expression data from the Gene Expression Omnibus database. |
Table I
Clinical features of the methylation
and expression data from the Gene Expression Omnibus database.
| Feature | Methylation data
| Expression data
|
|---|
| Control group | | PA group | Control group | | PA group |
|---|
| Data | | GSE44684 | | | GSE44971 | |
| Sample size (n) | 6 | 61 | 9 | 49 |
| Gender
(male/female) | 3/3 | 36/25 | 6/3 | 26/23 |
| Age (years) | 1.5–87 | 0.5–22 | 0–26 | 2–26 |
Data preprocessing
Expression value background calibration and data
normalization were performed on the raw expression profile data,
which were in the CEL format, using the Affy Package (13) in R (www.r-project.org). The preprocessing process included
raw data format transition, missing value interpolation, background
calibration (MAS rule) and data quantile normalization (14). The digital transformation,
background signal calibration and normalization were performed on
the primary methylation signal data using the Genome Studio
Methylation Module with R (15) to
obtain the chromosome coordinates and the methylation β value in
the methylation signal profile.
DEG and DMR screening
To investigate the differentials between the PA
samples and normal control samples, the Significance Analysis of
Microarrays method (16) was used
to identify the DEGs and for circumventing false positive results
by estimating the false discovery rate (FDR) (17,18),
which occurred in the multiple tests. The FDRs were estimated using
the permutation algorithm. In addition, the fold change (FC) of the
expression values between the PA group and control group were
calculated. DEGs were identified as those meeting the criteria of
FDR <0.05 and |log2FC| >1.
The DMRs between the PA samples and normal
cerebellar samples were screened out using a paired t-test
conducted using R. FDR <0.05 and |log2FC| >0.585 were set as
the cut-off criteria. The corresponding genes and CpG islands of
the DMRs were annotated, according to the region correspondence
information in GPL13534. As a result, the DMRs, together with the
reference genes within it and regions with CpG islands, were
obtained.
Chromosome distribution analysis of the
DEGs and DMRs
The genes associated with the identified DMRs were
located to 23 human chromosomes in the hg19 human genome, according
to the corresponding differentially methylated sites. The quantity
of the located genes on each chromosome were summarized to
calculate the distribution rules of the DMRs on each chromosome,
and a chromosome map was then produced on the basis of the
distribution information using Circos 0.67 (circos.ca/software/download/circos).
Integrated analysis of DNA methylation
and gene expression
The genes, which were identified as being DEGs and
reference genes associated with DMRs were screened out. The
associations between the methylation and expression levels were
measured by the application of Pearson's correlation analysis on
the datasets, and Pearson's correlation coefficient was calculated
to indicate the correlation using R. The methylation and expression
levels of each gene were applied to the rectangular coordinate
system and plotted by R.
Construction of gene co-expression
networks based on clinical features
The gene co-expression networks were constructed
using the weighted gene co-expression network analysis (WGCNA 1.41;
labs.genetics.ucla.edu/horvath/CoexpressionNetwork/Rpackages)
(19) algorithm, which is a
typical systematic biological algorithm for constructing gene
co-expression networks. Correlation networks are constructed on the
basis of high throughput mRNA microarray data in a number of steps
Firstly, the network was required to have a scale-free topology.
The identification of the gene co-expression matrix and adjacency
function formed by the gene network was then performed, following
which the coefficient of variation of different nodes were
calculated, and gene set modules associated with disease were
identified. Finally, the association between modules and the PA
disease phenotype were determined. The outlier sample was validated
and eliminated.
Functional enrichment of the DEGs
To interpret the biological function in which the
screened DEGs were involved, functional analysis was performed by
Gene Ontology (GO) enrichment with the Database for Annotation,
Visualization and Integrated Discovery (DAVID; david.abcc.ncifcrf.gov) (20) software. This was achieved by
identifying the biological processes in which the DEGs were
involved in. The cut-off threshold was set as P<0.05.
Results
DEG and DMR screening
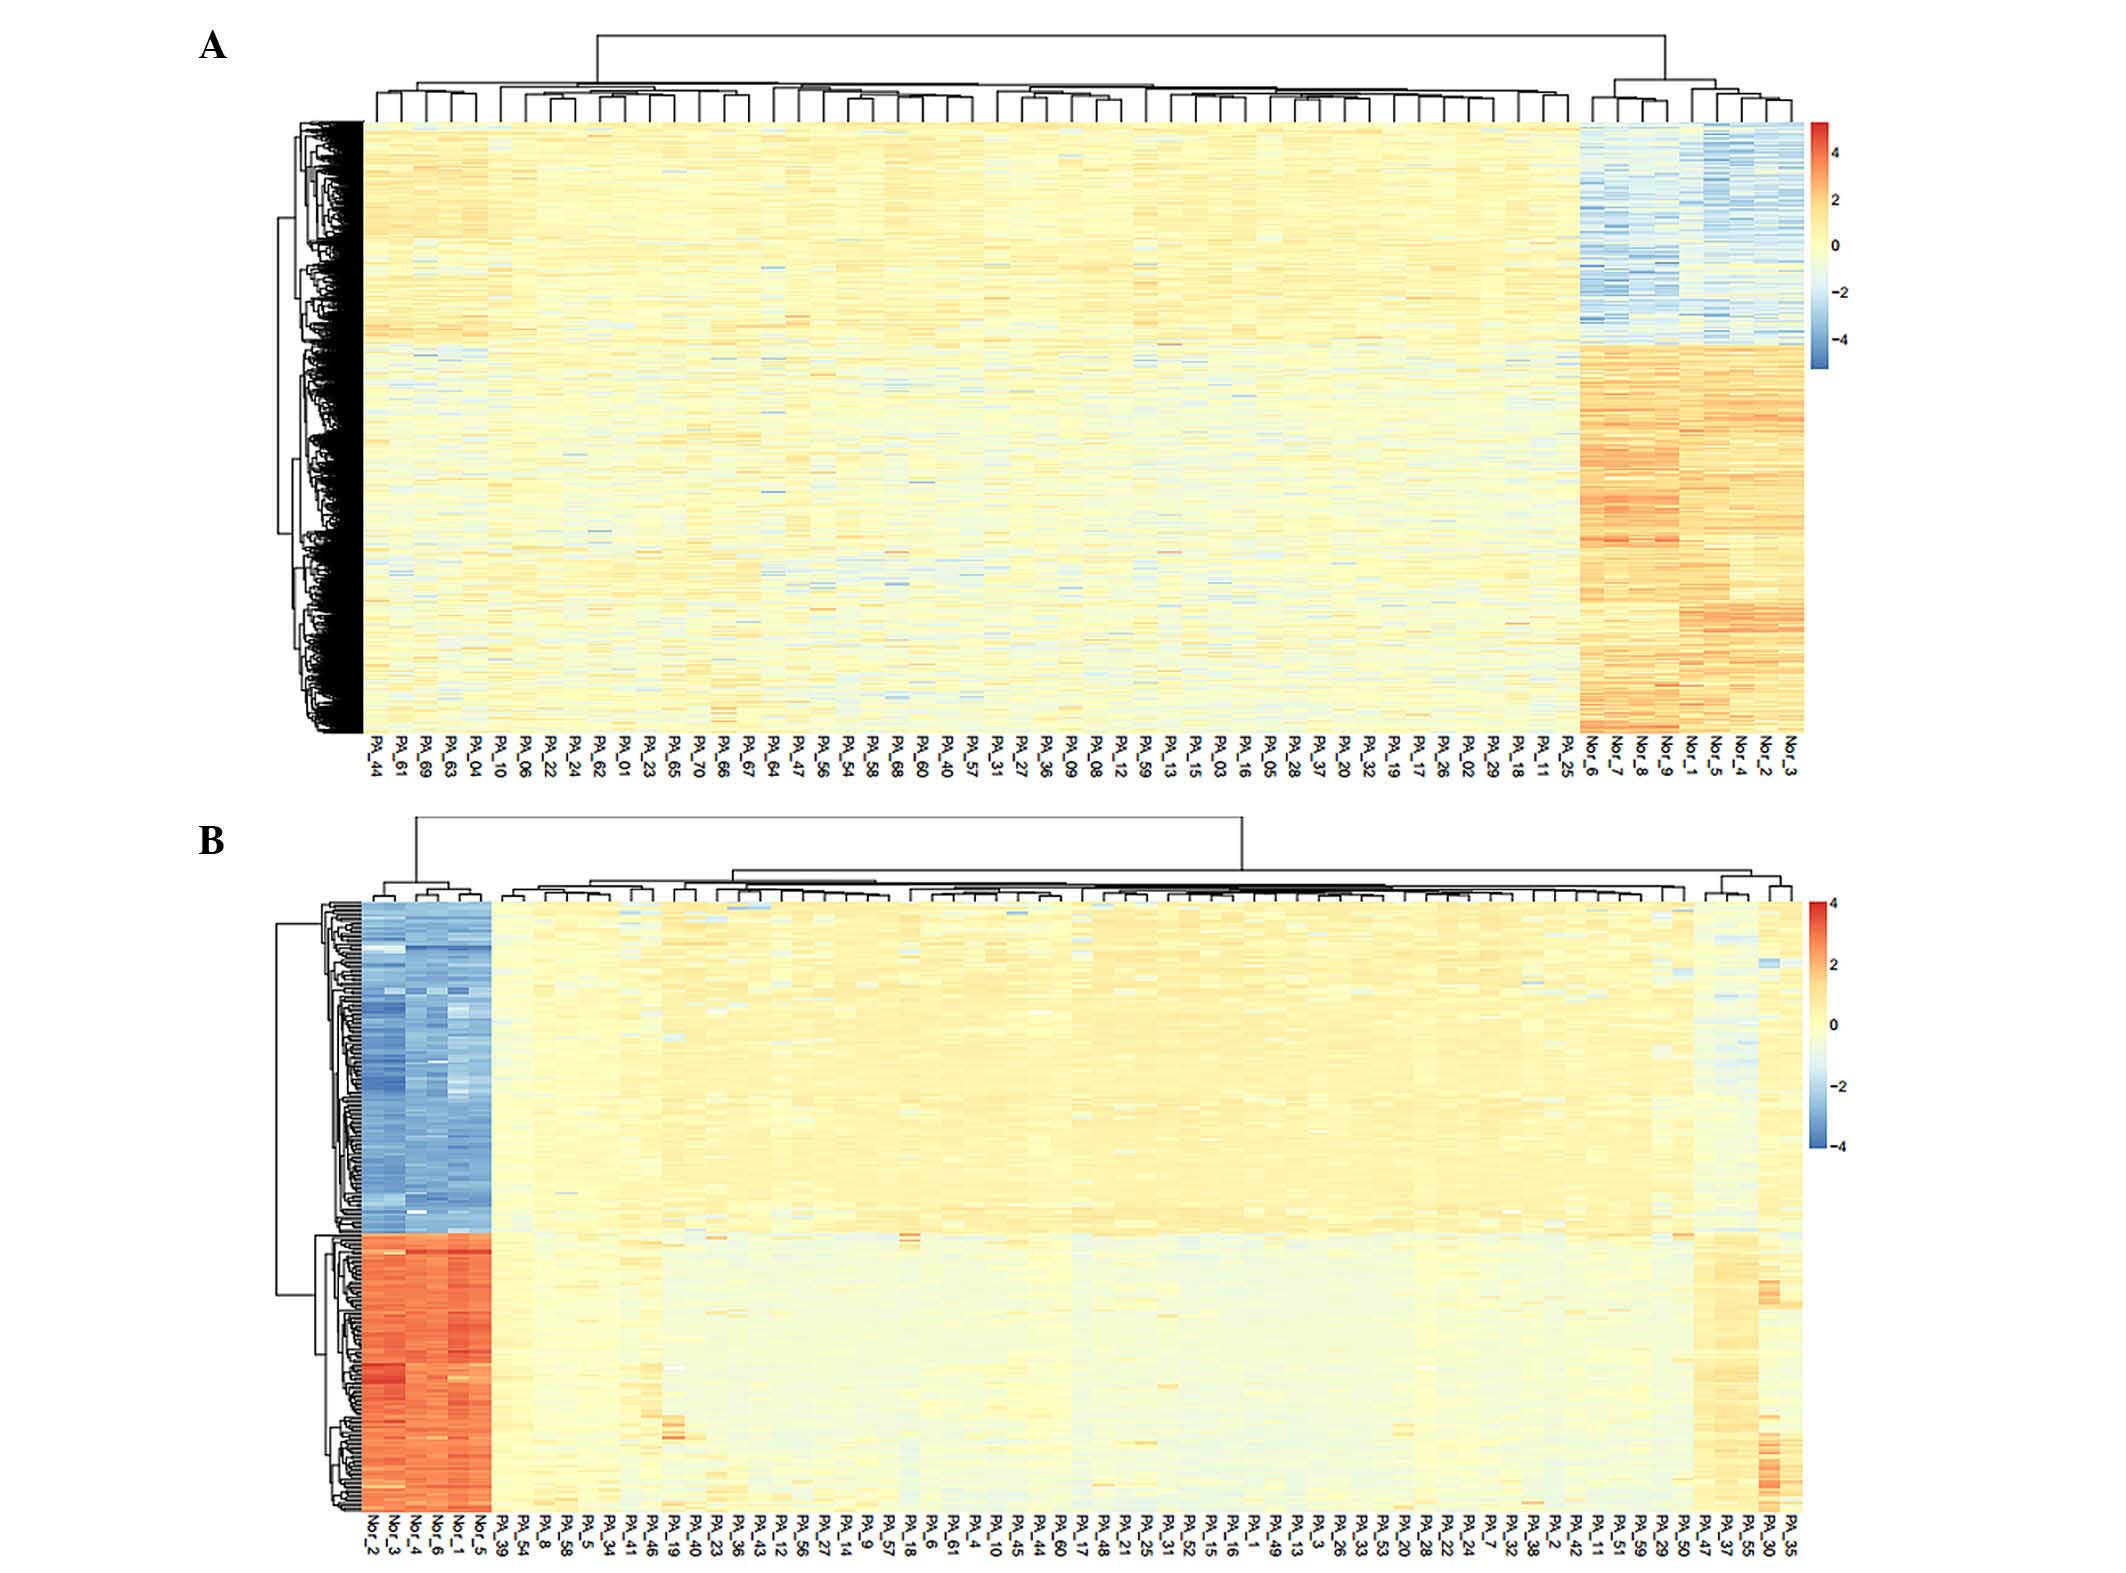
In the present study, the normalized expression data
and methylation profile were further mined to identify the DEGs and
DMRs. A total number of 2,259 DEGs and 235 DMRs were screened out,
of which 123 reference genes to all DMRs were identified, according
to the corresponding annotation information. The hierarchical
clustering heat maps of the DEGs and DMRs are shown in Fig. 1. The results revealed that the DEGs
and DMRs were able to distinguish well between the PA samples and
normal control samples.
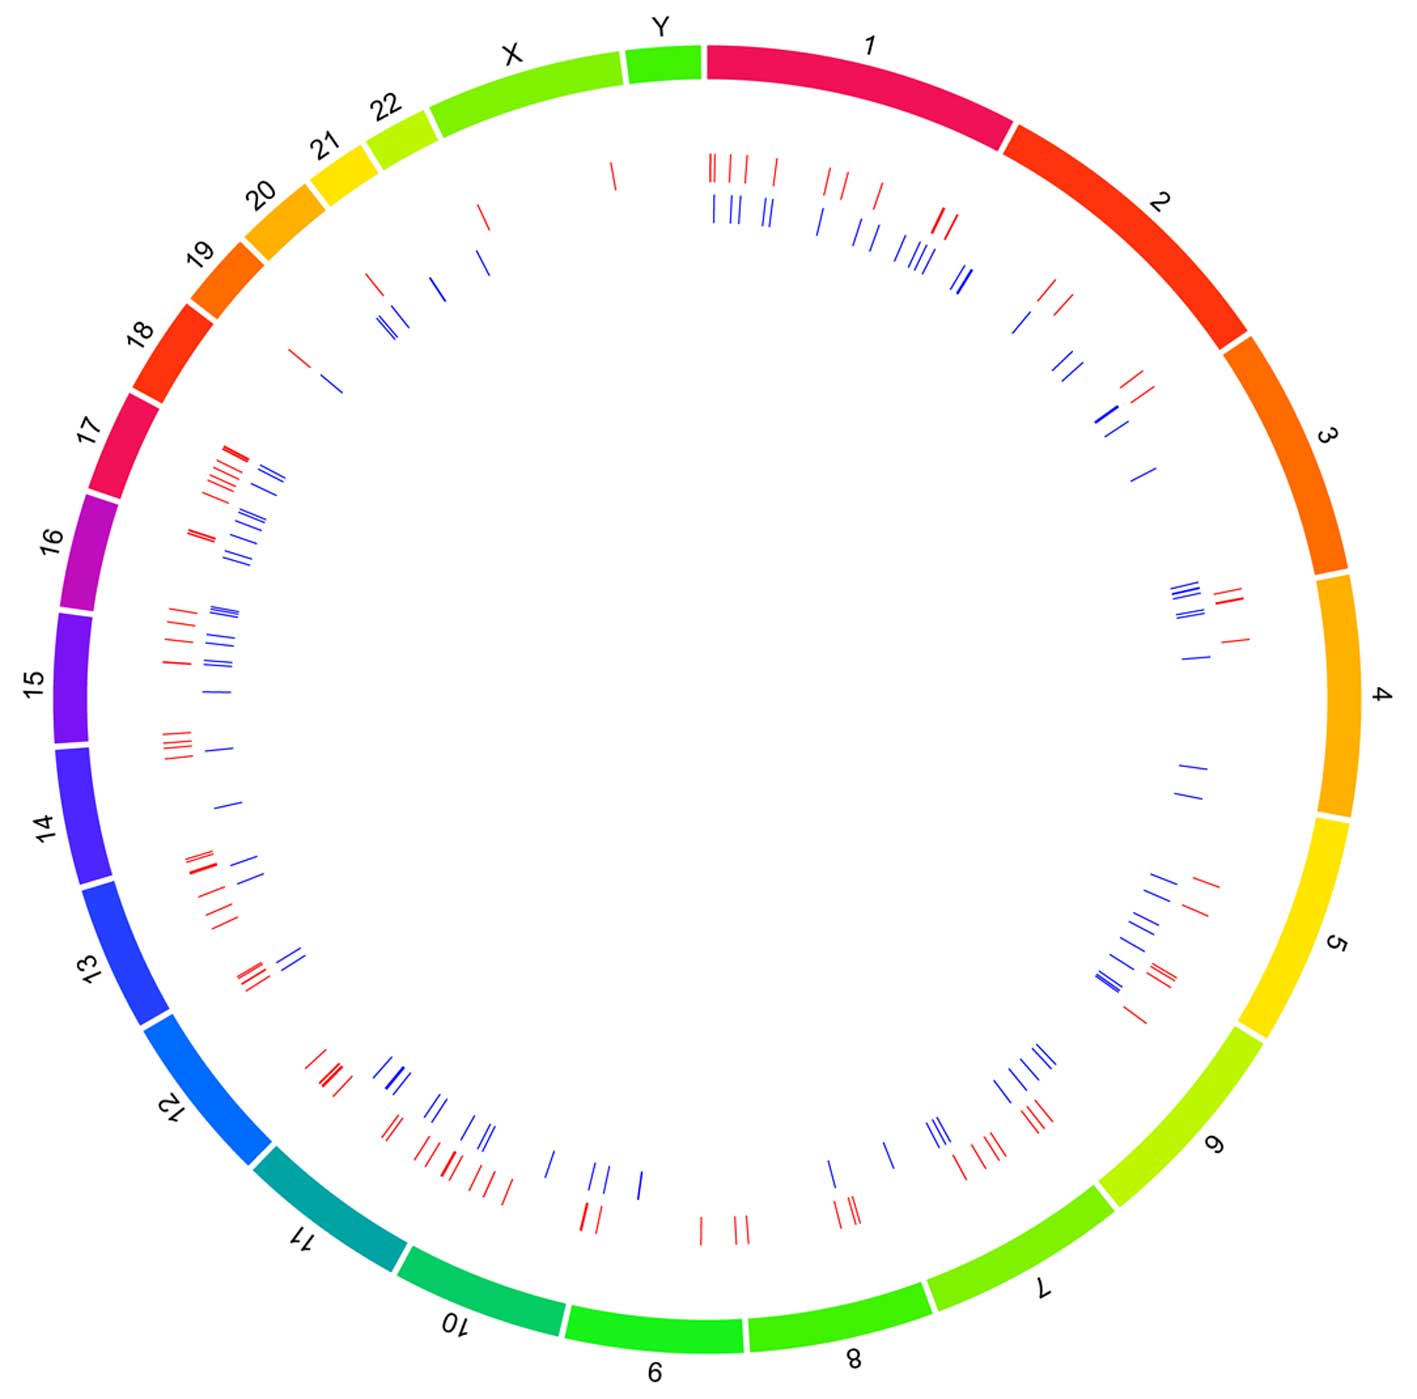
Chromosome distribution analysis of DEGs
and DMRs
A total of 123 reference genes located to the DMRs
were identified by comparing the methylation profiles of the PA
samples and normal cerebellar samples. In total, 235 DMRs were
located to 23 human chromosomes. Of these, chromosome 1 contained
the highest number of DMRs (29 regions), followed by chromosome 16
(20 regions). The upregulated and down-regulated DMRs distributed
on each chromosome are shown in Fig.
2.
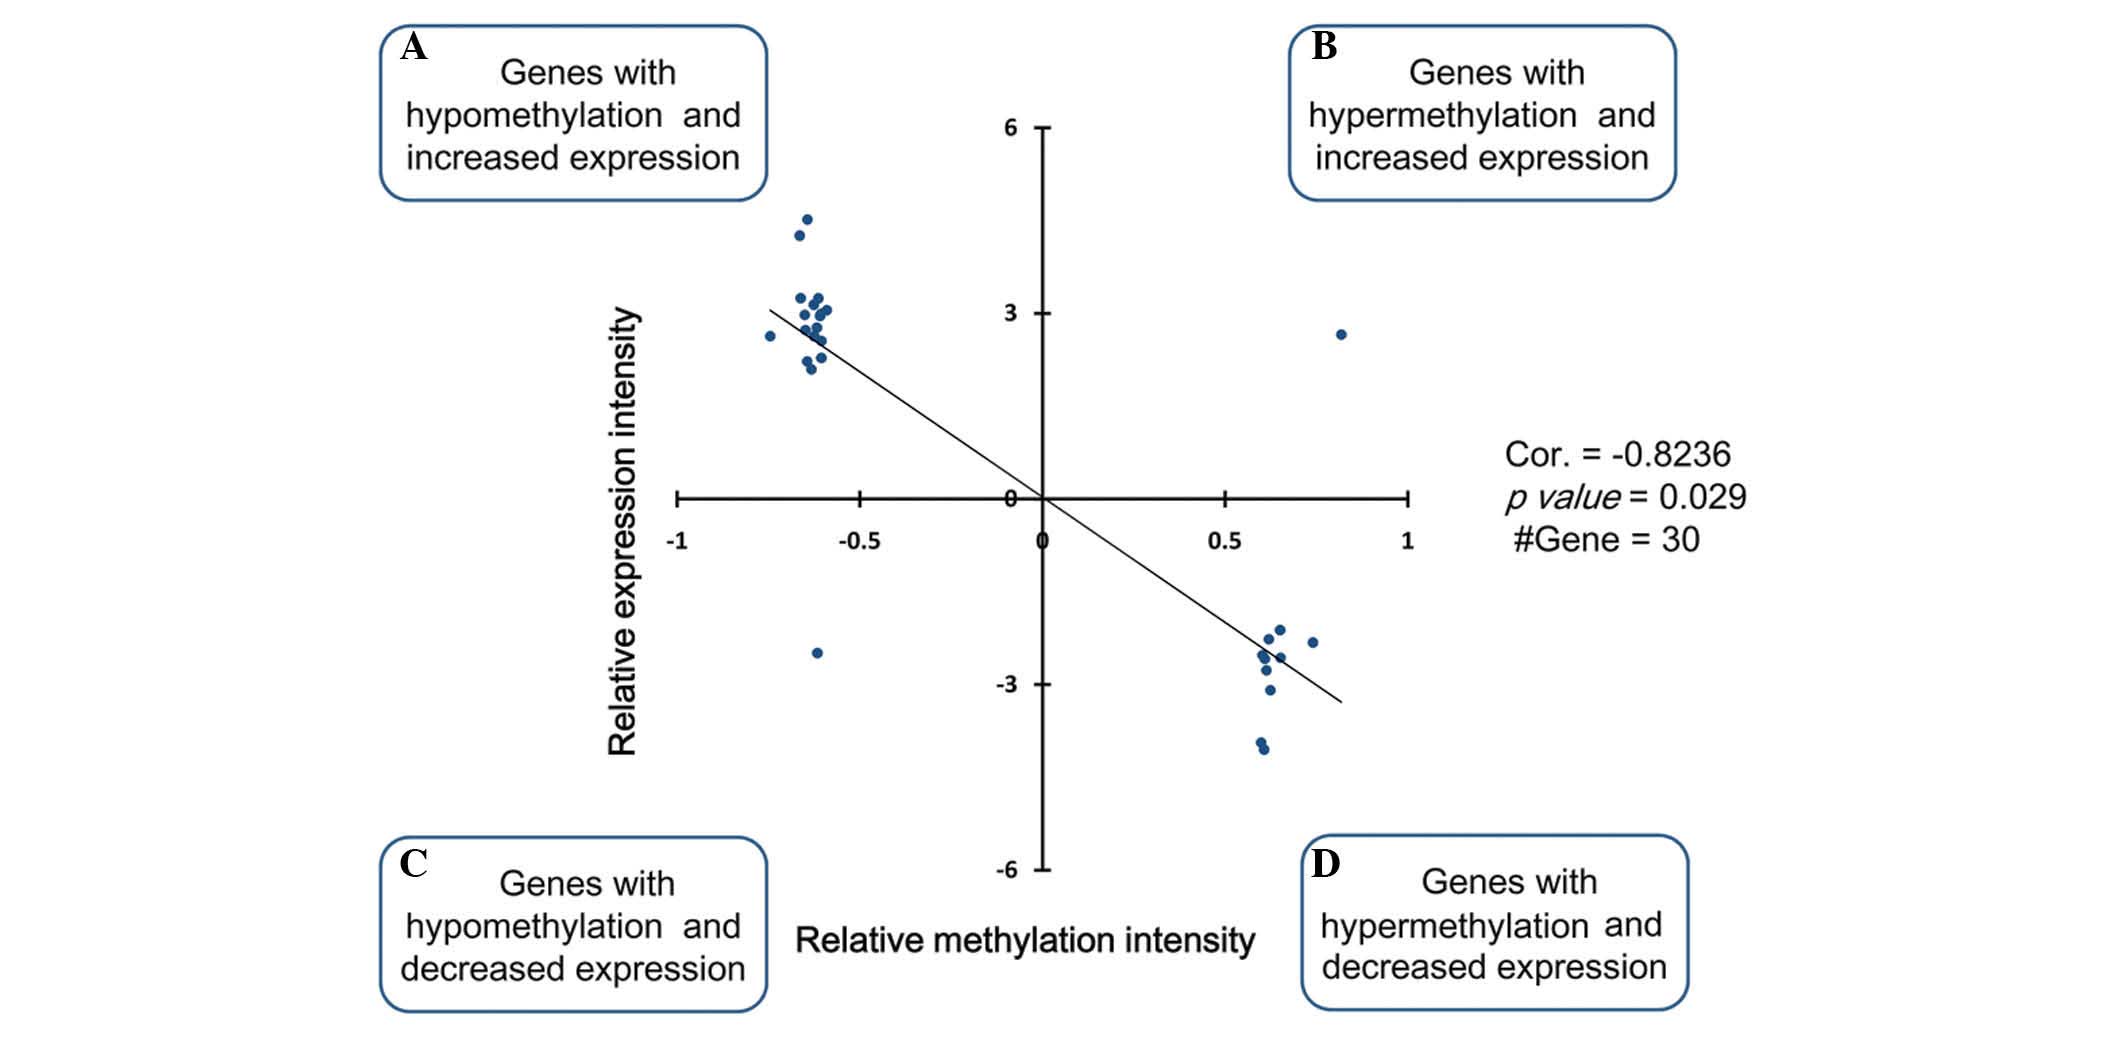
Integrated analyses of DNA methylation
and gene expression
A total of 30 genes were screened out to evaluate
the correlation between methylation and expression as a negative
correlation was observed, indicating these genes were affected by
abnormal methylation. As a result, there was a marked negative
correlation (cor=−0.82; P=0.029) between the expression level and
the methylation level (Fig.
3).
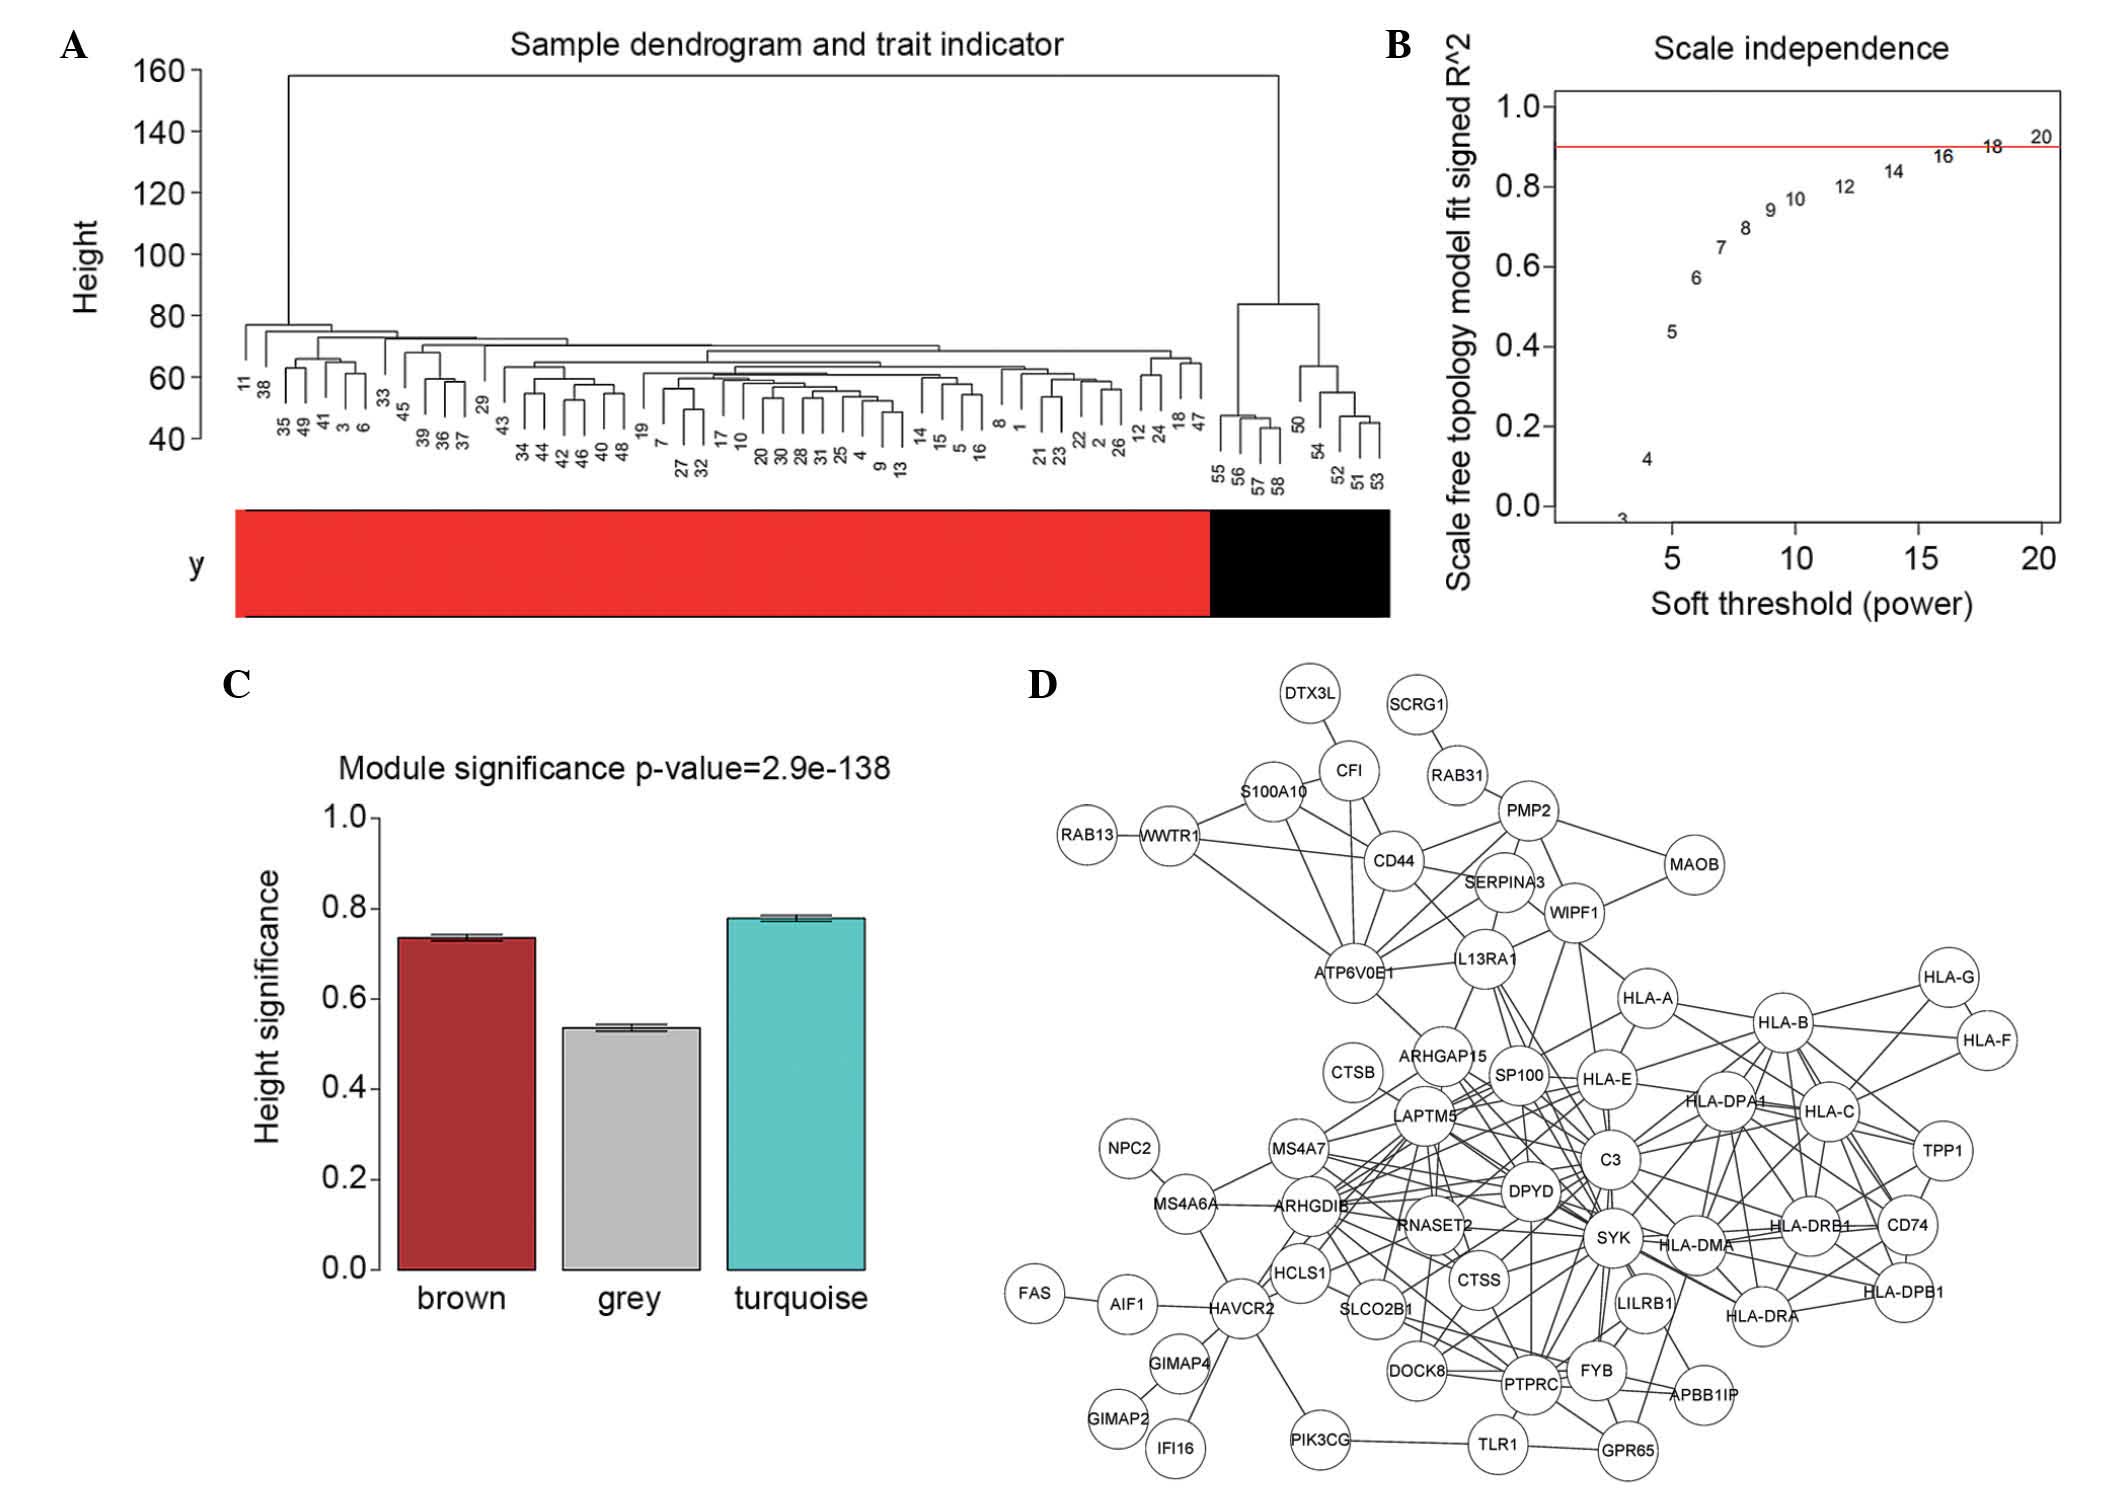
Gene co-expression networks
In order to validate the outlier in the samples, a
sample hierarchical clustering dendrogram was plotted (Fig. 4), with the states of each sample
labeled. As shown in Fig. 4A, the
PA and normal samples had their own integral polymerism, in which
no sample outliers were present. Thus, all the PA samples were
incorporated in the analysis.
In order to meet the preconditions of scale-free
network distribution, the β value weighting parameter of the
adjacency matrix was optimized for setting the ranges of network
construction parameters, and for calculating the scale-free
distribution of the topology matrix. The β value ranges were set as
1–20, and the corresponding model statistics were calculated for
graph construction (Fig. 4B). The
higher the R2 value, the closer the network is to an
ideal scale-free system. The β value of 18, at which the
R2 reached 0.9 for the first time was selected.
Initially, the dissimilarity coefficient between
genes was calculated to obtain the hierarchical clustering
dendrogram. Subsequently, the minimum number of genes in each gene
network was set as 30, in accordance to the standard of the Dynamic
Branch Cut method (21). Following
determination of the gene module using the Dynamic Branch Cut
method, the eigengenes of each module were calculated successively,
followed by cluster analysis on each module, in which the close
modules were merged into a new module. The correlation coefficient
between the eigengenes of each module and the disease status were
calculated. For the disease state variable (y), y=0 indicated a
normal group and y=1 indicated a PA group). As shown in Fig. 4C, the following three modules
showed a high degree of correlation with disease status: Brown (959
DEGs), grey (238 DEGs) and turquoise (1,062 DEGs). The genes in the
turquoise module possessed the highest correlation with disease.
Subsequently, the correlation coefficients of the genes in the
turquoise module were output, and 148 DEGs, the R2
values of which were all >0.9 m were selected to construct the
co-expression network. The co-expression network is shown in
Fig. 4D, and the WIPF1, IFI16,
GIMAP2 genes in the network possessed three common features: i)
significant differential expression; ii) involved with DMRs
exhibiting overexpression and hypomethylation; iii) closely
associated with disease.
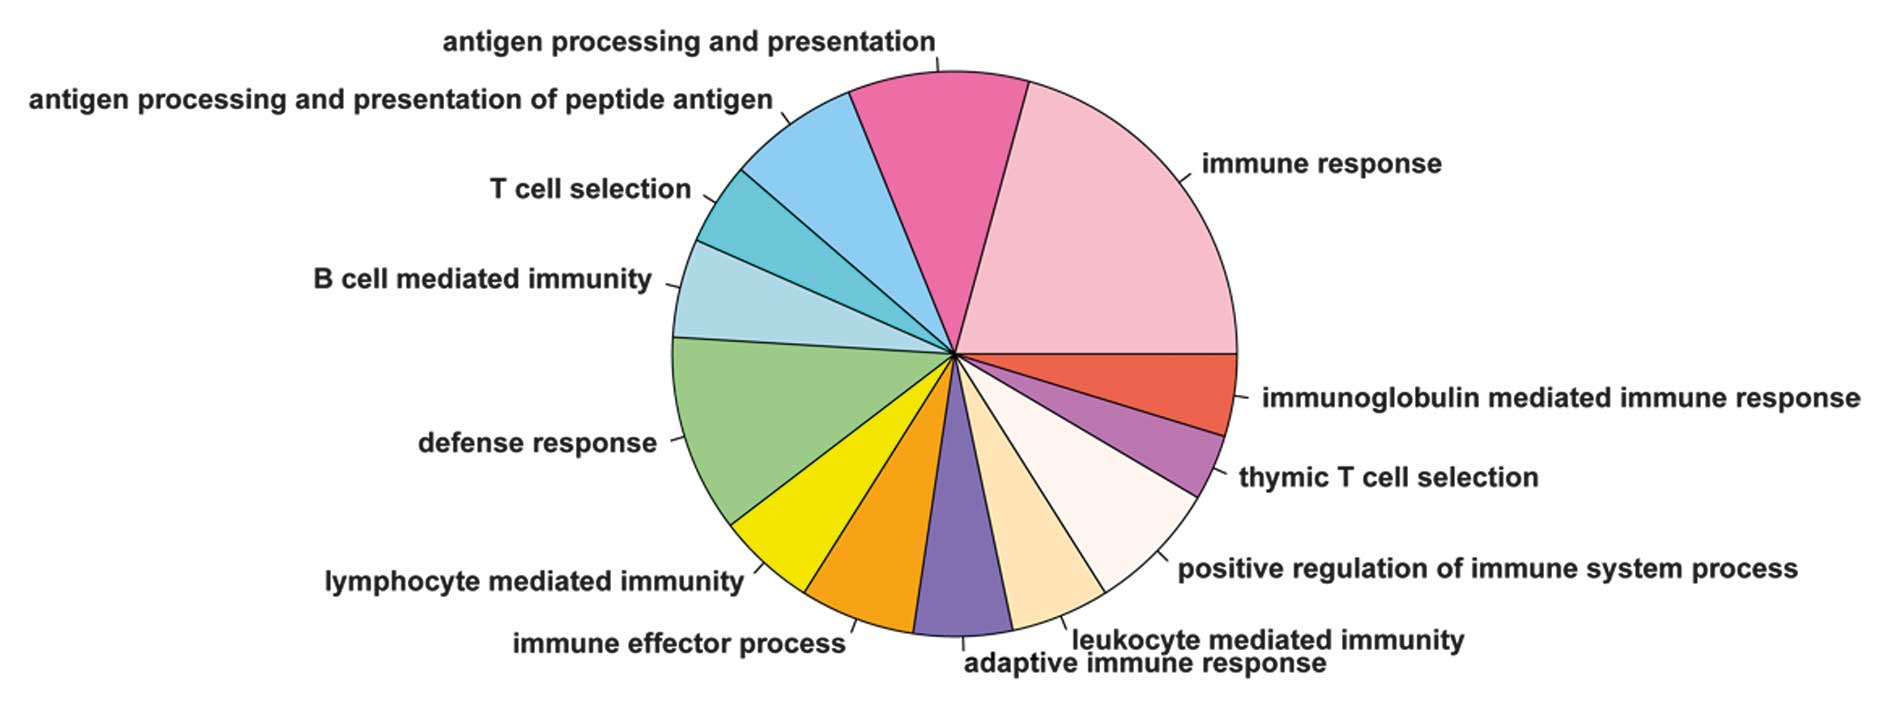
Functional enrichment of DEGs
To determine the functional features of the screened
DEGs, the PA-associated genes that were involved in the gene
co-expression network construction were uploaded to DAVID to
analyze the biological functional processes. As shown in Fig. 5, 13 significantly correlated
biological functions were identified, of which immune response was
the most enriched process, and the remaining processes were all
associated with the immune system function.
Discussion
In the present study, WGCNA was performed, selecting
the appropriate weighting coefficient to meet the scale-free
network distribution precondition. This meant that the gene
networks/modules were obtained by constructing a hierarchical
clustering dendrogram following matrix transformation, which
results in the gene network/module construction to be of a soft
threshold by transforming the correlation coefficient to a
continuous variable. The use of soft threshold, a parameter in the
WCGNA algorithm, allows the network to have increased stability and
reliability. Subsequently, the genes were clustered using the
Dynamic Branch Cut method, and genes with high expression
similarity were allocated to the same gene network/module as a
whole factor to examine their correlation with disease and each
other. Gene function analyses can be performed on the constructed
modules based on WGCNA. This analytical method is now widely used
in investigations of disease and have been reported to screen
multiple reliable target genes for various disease (22,23).
Methylation in CpG islands has been reported to
inhibit genomic binding sites of activating transcription factors
or other proteins, and shows a high level of association with gene
repression (6,24). Integrated analysis, involving the
screening of DMRs in PA samples and comparing them with normal
samples, was performed in the present study. The results revealed
that chromosome 1 contained the maximum ratio of significantly
methylated genes, and that the DEGs showed marked negative
correlation with the DMRs (cor=−0.82; P=0.029).
In the present study, integrated analysis of the
expression profile and DNA methylation profile, and identification
of PA-associated genes using the WGCNA method were performed to
investigate the pathogenesis of PAs. Previously, several pathways
and genes have been reported to be disturbed or modulated in PAs.
The mitogen-activated protein kinase (MAPK) signaling pathway is a
conserved signaling cascade, which utilizes a series of kinases to
transduce signals from the cell membrane to the nucleus, thereby
mediating cell growth, cell survival and cell differentiation. It
has been reported that BRAF gene fusion leads to MAPK pathway
activation in PAs, which is a novel oncogenic fusion gene with
diagnostic, prognostic and therapeutic potential (3). The tumor suppressor, A-kinase anchor
protein 12 (AKAP12) in human diffuse astrocytomas and PAs is
regulated by promoter methylation, and is expressed at a high level
in PAs, but at a low level in diffuse astrocytomas (25).
Based on the WGCNA of the PA expression data, three
network modules associated with PA were identified and the gene
co-expression network were constructed. Functional enrichment
analysis showed that 13 significantly correlated biological
functions, including immune response and defense response, were
associated with the immune system. It has been reported that genes,
including HLA-DRa, HLA-DPB1, HLA-DQB1, IgG3, IgGK, FCER1G, A2M,
FCRN, IFI-56K, and DAP12 are upregulated in PAs, compared with the
normal cerebellum, grade II astrocytomas and oligodendrogliomas,
and that all the genes are immune defense-associated genes
(1). These results suggested that
immunological investigations may be beneficial and offer potential
in investigating PAs.
In conclusion, integrated analyses of DNA
methylation profiles and gene expression profiles, combined with
correlation and functional enrichment analysis may provide novel
insights for further investigation of PAs, in target gene screening
and in functional process identification.
References
|
1
|
Huang H, Hara A, Homma T, Yonekawa Y and
Ohgaki H: Altered expression of immune defense genes in pilocytic
astrocytomas. J Neuropathol Exp Neurol. 64:891–901. 2005.
View Article : Google Scholar : PubMed/NCBI
|
|
2
|
Rorive S, Maris C, Debeir O, Sandras F,
Vidaud M, Bièche I, Salmon I and Decaestecker C: Exploring the
distinctive biological characteristics of pilocytic and low-grade
diffuse astrocytomas using microarray gene expression profiles. J
Neuropathol Exp Neurol. 65:794–807. 2006. View Article : Google Scholar : PubMed/NCBI
|
|
3
|
Jeuken JW and Wesseling P: MAPK pathway
activation through BRAF gene fusion in pilocytic astrocytomas; a
novel oncogenic fusion gene with diagnostic, prognostic and
therapeutic potential. J Pathol. 222:324–328. 2010. View Article : Google Scholar : PubMed/NCBI
|
|
4
|
Giannini C, Scheithauer BW, Burger PC,
Christensen MR, Wollan PC, Sebo TJ, Forsyth PA and Hayostek CJ:
Cellular proliferation in pilocytic and diffuse astrocytomas. J
Neuropathol Exp Neurol. 58:46–53. 1999. View Article : Google Scholar : PubMed/NCBI
|
|
5
|
Burkhard C, Di Patre PL, Schüler D,
Schüler G, Yaşargil MG, Yonekawa Y, Lütolf UM, Kleihues P and
Ohgaki H: A population-based study of the incidence and survival
rates in patients with pilocytic astrocytoma. J Neurosurg.
98:1170–1174. 2003. View Article : Google Scholar : PubMed/NCBI
|
|
6
|
Suzuki MM and Bird A: DNA methylation
landscapes: Provocative insights from epigenomics. Nat Rev Genet.
9:465–476. 2008. View
Article : Google Scholar : PubMed/NCBI
|
|
7
|
Gopalakrishnan S, Van Emburgh BO and
Robertson KD: DNA methylation in development and human disease.
Mutat Res. 647:30–38. 2008. View Article : Google Scholar : PubMed/NCBI
|
|
8
|
Li M, Balch C, Montgomery JS, Jeong M,
Chung JH, Yan P, Huang TH, Kim S and Nephew KP: Integrated analysis
of DNA methylation and gene expression reveals specific signaling
pathways associated with platinum resistance in ovarian cancer. BMC
Med Genomics. 2:342009. View Article : Google Scholar : PubMed/NCBI
|
|
9
|
Fan M, Yan PS, Hartman-Frey C, Chen L,
Paik H, Oyer SL, Salisbury JD, Cheng AS, Li L, Abbosh PH, et al:
Diverse gene expression and DNA methylation profiles correlate with
differential adaptation of breast cancer cells to the antiestrogens
tamoxifen and fulvestrant. Cancer Res. 66:11954–11966. 2006.
View Article : Google Scholar : PubMed/NCBI
|
|
10
|
Lambert SR, Witt H, Hovestadt V, Zucknick
M, Kool M, Pearson DM, Korshunov A, Ryzhova M, Ichimura K, Jabado
N, et al: Differential expression and methylation of brain
developmental genes define location-specific subsets of pilocytic
astrocytoma. Acta Neuropathol. 126:291–301. 2013. View Article : Google Scholar : PubMed/NCBI
|
|
11
|
Barrett T, Troup DB, Wilhite SE, Ledoux P,
Rudnev D, Evangelista C, Kim IF, Soboleva A, Tomashevsky M and
Edgar R: NCBI GEO: Mining tens of millions of expression
profiles-database and tools update. Nucleic Acids Res. 35(Database
issue): D760–D765. 2007. View Article : Google Scholar
|
|
12
|
Edgar R, Domrachev M and Lash AE: Gene
expression omnibus: NCBI gene expression and hybridization array
data repository. Nucleic. Acids Res. 30:207–210. 2002. View Article : Google Scholar
|
|
13
|
Smyth GK and Speed T: Normalization of
cDNA microarray data. Methods. 31:265–273. 2003. View Article : Google Scholar : PubMed/NCBI
|
|
14
|
Smyth GK: Limma: Linear models for
microarray data. Bioinformatics and computational biology solutions
using R and Bioconductor. Gentleman R, Carey V, Huber W, Irizarry R
and Dudoit S: Springer-Verlag; New York, NY: pp. 397–pp420. 2005,
View Article : Google Scholar
|
|
15
|
Turan N, Ghalwash MF, Katari S, Coutifaris
C, Obradovic Z and Sapienza C: DNA methylation differences at
growth related genes correlate with birth weight: A molecular
signature linked to developmental origins of adult disease? BMC Med
Genomics. 5:102012. View Article : Google Scholar : PubMed/NCBI
|
|
16
|
Zhang S: A comprehensive evaluation of
SAM, the SAM R-package and a simple modification to improve its
performance. BMC Bioinformatics. 8:2302007. View Article : Google Scholar : PubMed/NCBI
|
|
17
|
Benjamini Y and Hochberg Y: Controlling
the false discovery rate: A practical and powerful approach to
multiple testing. J R Stat Soc Series B Methodol. 57:289–300.
1995.
|
|
18
|
Benjamini Y: Discovering the false
discovery rate. J R Stat Soc Series B Stat Methodol. 72:405–416.
2010. View Article : Google Scholar
|
|
19
|
Langfelder P and Horvath S: WGCNA: An R
package for weighted correlation network analysis. BMC
Bioinformatics. 9:5592008. View Article : Google Scholar : PubMed/NCBI
|
|
20
|
Huang DW, Sherman BT and Lempicki RA:
Bioinformatics enrichment tools: Paths toward the comprehensive
functional analysis of large gene lists. Nucleic Acids Res.
37:1–13. 2009. View Article : Google Scholar :
|
|
21
|
Langfelder P, Zhang B and Horvath S:
Defining clusters from a hierarchical cluster tree: The Dynamic
Tree Cut package for. R Bioinformatics. 24:719–720
|
|
22
|
Aggarwal A, Guo DL, Hoshida Y, Yuen ST,
Chu KM, So S, Boussioutas A, Chen X, Bowtell D, Aburatani H, et al:
Topological and functional discovery in a gene coexpression
meta-network of gastric cancer. Cancer Res. 66:232–241. 2006.
View Article : Google Scholar : PubMed/NCBI
|
|
23
|
Dewey FE, Perez MV, Wheeler MT, Watt C,
Spin J, Langfelder P, Horvath S, Hannenhalli S, Cappola TP and
Ashley EA: Gene coexpression network topology of cardiac
development, hypertrophy and failure. Circ. Cardiovasc Genet.
4:26–35. 2011. View Article : Google Scholar
|
|
24
|
Jones PA and Takai D: The role of DNA
methylation in mammalian epigenetics. Science. 293:1068–1070. 2001.
View Article : Google Scholar : PubMed/NCBI
|
|
25
|
Goeppert B, Schmidt CR, Geiselhart L,
Dutruel C, Capper D, Renner M, Vogel MN, Zachskorn C, Zinke J,
Campos B, et al: Differential expression of the tumor suppressor
A-kinase anchor protein 12 in human diffuse and pilocytic
astrocytomas is regulated by promoter methylation. J Neuropathol
Exp Neurol. 72:933–941. 2013. View Article : Google Scholar : PubMed/NCBI
|