Introduction
Rheumatoid arthritis (RA) is a chronic inflammatory
disease which can lead to progressive disability, early mortality
and other systemic complications (1). RA is incurable, has high
socioeconomic costs and severely reduces the quality of life of
patients (2). Osteoarthritis (OA)
is the most common joint disease; it causes pain, disability and
the loss of joint function (3). OA
is also a chronic and incurable illness that lacks effective
treatment strategies (4). Thus,
advances in the understanding of the molecular mechanisms
underlying these two diseases may lead to the development of novel
therapeutic strategies.
RA is characterized by autoimmune and synovial
inflammation, the destruction of multiple joints and the formation
of pannus (5). OA is characterized
by an inflammatory response and progressive breakdown of the
articular cartilage of the joint (6). Genetic factors have been implicated
in the development of these diseases (7,8). The
human leukocyte antigen molecules and their relevant immunological
pathways have been associated with RA pathogenesis (9). Sun et al (10) demonstrated that paired
immunoglobin-like type receptor α was associated with inflammatory
cell infiltration and was elevated in the synovial tissue from mice
with RA. In addition, a genome-wide association and functional
study suggests that DOT1-like histone H3K79 methyltransferase is
associated with cartilage thickness and hip OA (11). Valdes et al (12) also confirmed that genetic variation
in the SMAD family member 3 gene may result in the progression of
hip and knee OA. Together, these findings indicate the importance
of genetic mechanisms in the pathogenesis of RA and OA. Despite
previous progress, the gene signatures associated with the
pathogenesis of RA and OA remain unknown, and reliable predictive
biomarkers for prognosis and treatment are lacking.
Microarray analyses have been increasingly used to
identify disease-associated genes and pathways for elucidation of
the molecular mechanisms of RA and OA (13,14).
In a previous study, the GSE7669 microarray data was used to
analyze differentially expressed genes (DEGs) between RA and OA
using a gene co-expression network (15), or to screen candidate genes
associated with RA by investigating core and periphery interaction
structures (16). By contrast, the
current study used this microarray data and comprehensive
bioinformatics methods to identify DEGs in synovial RA samples
compared with OA samples. Additionally, the present study performed
functional enrichment analysis for DEGs and functional module
analysis of the protein-protein interaction (PPI) network. The
current study aimed to identify important disease-associated genes
and the molecular mechanisms involved in RA and OA.
Materials and methods
Affymetrix microarray data
The GSE7669 gene expression profile deposited by
Pohlers et al (17) was
downloaded from Gene Expression Omnibus (www.ncbi.nlm.nih.gov/geo/), which was based on the
platform of Affymetrix Human Genome U95 Version 2 Array
(Affymetrix, Inc., Santa Clara, CA, USA). This dataset included the
gene expression profiles from the synovial fibroblasts of 6
patients with RA and 6 patients with OA.
Data preprocessing and DEG screening
All the raw expression data was preprocessed using
the Affymetrix package (18) in R
(cran.at.r-project.org) and Bioconductor
(www.bioconductor.org), and the
normalization was performed using the robust multiarray average
algorithm (19). The gene
expression matrix of samples was acquired.
DEGs in RA synovial samples compared with OA samples
were identified using the Linear Models for Microarray Analysis
(Limma; www.bioconductor.org/packages/release/bioc/html/limma.html)
package (20) in R/Bioconductor.
t-test in the Limma package was used to analyze the P-value of each
gene symbol. Only DEGs with P<0.05 and |log2 fold change|>0.5
were considered to indicate a statistically significant
difference.
Functional enrichment analysis of
DEGs
Gene Ontology (GO; www.geneontology.org) (21) is widely used in biology for the
collation of large-scale gene lists, including biological process
(BP) ontology. The Kyoto Encyclopedia of Genes and Genomes (KEGG;
www.genome.ad.jp/kegg) (22) is used for extracting the pathway
information from molecular interaction networks. To understand the
biological significance of DEGs, GO BP enrichment analysis and KEGG
pathway analysis were performed using the Database for Annotation
Visualization and Integrated Discovery (DAVID; david.abcc.ncifcrf.gov) online tool (23). The P<0.05 in the hyper-geometric
test and gene count >2 were defined as the cut-off values.
PPI network construction
The Search Tool for the Retrieval of Interacting
Genes (STRING) (24) is a database
providing information on experimentally verified and predicted
protein interactions by calculating their combined score. Based on
the information of the STRING database, DEGs with the combined
protein interaction score >0.4 were selected and used to
construct a PPI network in the present study. Hub proteins
(25) in the PPI network were
identified based on connectivity degree analysis. The PPI network
was visualized using Cytoscape software (www.cytoscape.org) (26).
Functional module analysis of PPI
network
The functional modules of the PPI network were
subsequently identified using the Molecular Complex Detection
(MCODE) (27) plugin of Cytoscape.
The parameters were set as follows: Degree cut-off, 2; node score
cut-off, 0.2; K-core, 2; and max depth, 100. Functional enrichment
analyses for DEGs in functional modules with higher degree and node
scores were subsequently performed using the DAVID tool. P<0.05
and gene count >2 were considered to indicate a statistically
significant difference.
Results
DEG screening
Comparing OA and RA samples, a total of 181 DEGs
were obtained, in which 96 genes were upregulated in RA and
downregulated in OA samples, and 85 genes were downregulated in RA
and upregulated in OA samples.
Functional enrichment analyses
The GO BP terms and KEGG pathway analyses were
conducted for functional annotation of the DEGs. The top 10 GO BP
terms are presented in Table I.
The results demonstrated that the upregulated genes were
significantly enriched in functions associated with cell adhesion,
biological adhesion and extracellular matrix (ECM) organization.
Downregulated genes were predominantly associated with the
regulation of cell death, and responses to hormone and endogenous
stimuli.
 | Table IThe top 10 significantly enriched GO
biological progress terms. |
Table I
The top 10 significantly enriched GO
biological progress terms.
| GO term | Description | No. enriched
genes | P-value |
|---|
| Upregulated | | | |
| 0007155 | Cell adhesion | 24 |
1.35×10⁻¹¹ |
| 0022610 | Biological
adhesion | 24 |
1.39×10⁻¹¹ |
| 0007166 | Cell surface
receptor linked signal transduction | 19 |
2.74×10⁻² |
| 0043062 | Extracellular
structure organization | 17 |
1.99×10⁻¹⁵ |
| 0030198 | Extracellular
matrix organization | 16 |
4.32×10⁻¹⁷ |
| 0001568 | Blood vessel
development | 12 |
2.48×10⁻⁷ |
| 0001944 | Vasculature
development | 12 |
3.16×10⁻⁷ |
| 0001501 | Skeletal system
development | 12 |
3.32×10⁻⁶ |
| 0030199 | Collagen fibril
organization | 10 |
6.38×10⁻¹⁴ |
| 0010033 | Response to organic
substance | 10 |
3.01×10⁻² |
| Downregulated | | | |
| 0010941 | Regulation of cell
death | 9 |
4.73×10⁻² |
| 0009725 | Response to hormone
stimulus | 7 |
9.50×10⁻³ |
| 0009719 | Response to
endogenous stimulus | 7 |
1.49×10⁻² |
| 0010942 | Positive regulation
of cell death | 7 |
2.05×10⁻² |
| 0001558 | Regulation of cell
growth | 6 |
2.71×10⁻³ |
| 0040008 | Regulation of
growth | 6 |
2.67×10⁻² |
| 0009615 | Response to
virus | 5 |
2.07×10⁻³ |
| 0045596 | Negative regulation
of cell differentiation | 5 |
2.22×10⁻² |
| 0032870 | Cellular response
to hormone stimulus | 4 |
2.82×10⁻² |
| 0006820 | Anion
transport | 4 |
3.39×10⁻² |
In addition, 3 and 2 KEGG pathways were
significantly enriched by up- and downregulated DEGs, respectively
(Table II). The enriched KEGG
pathways for the upregulated genes were ECM-receptor interactions,
focal adhesions and the TGF-β signaling pathway, whereas the
pathways enriched by the downregulated genes included the TGF-β
signaling pathway and vascular smooth muscle contraction (Table II).
| Table IIThe significantly enriched KEGG
pathways. |
Table II
The significantly enriched KEGG
pathways.
| KEGG pathway
term | Description | No. enriched
genes | P-value |
|---|
| Upregulated | | | |
| hsa04512 | Extracellular
matrix-receptor interaction | 11 |
3.77×10⁻¹⁰ |
| hsa04510 | Focal adhesion | 13 |
1.60×10⁻⁸ |
| hsa04350 | Transforming growth
factor-β signaling pathway | 4 |
2.84×10⁻² |
| Downregulated | | | |
| hsa04350 | Transforming growth
factor-β signaling pathway | 4 |
1.28×10⁻² |
| hsa04270 | Vascular smooth
muscle contraction | 4 |
2.51×10⁻² |
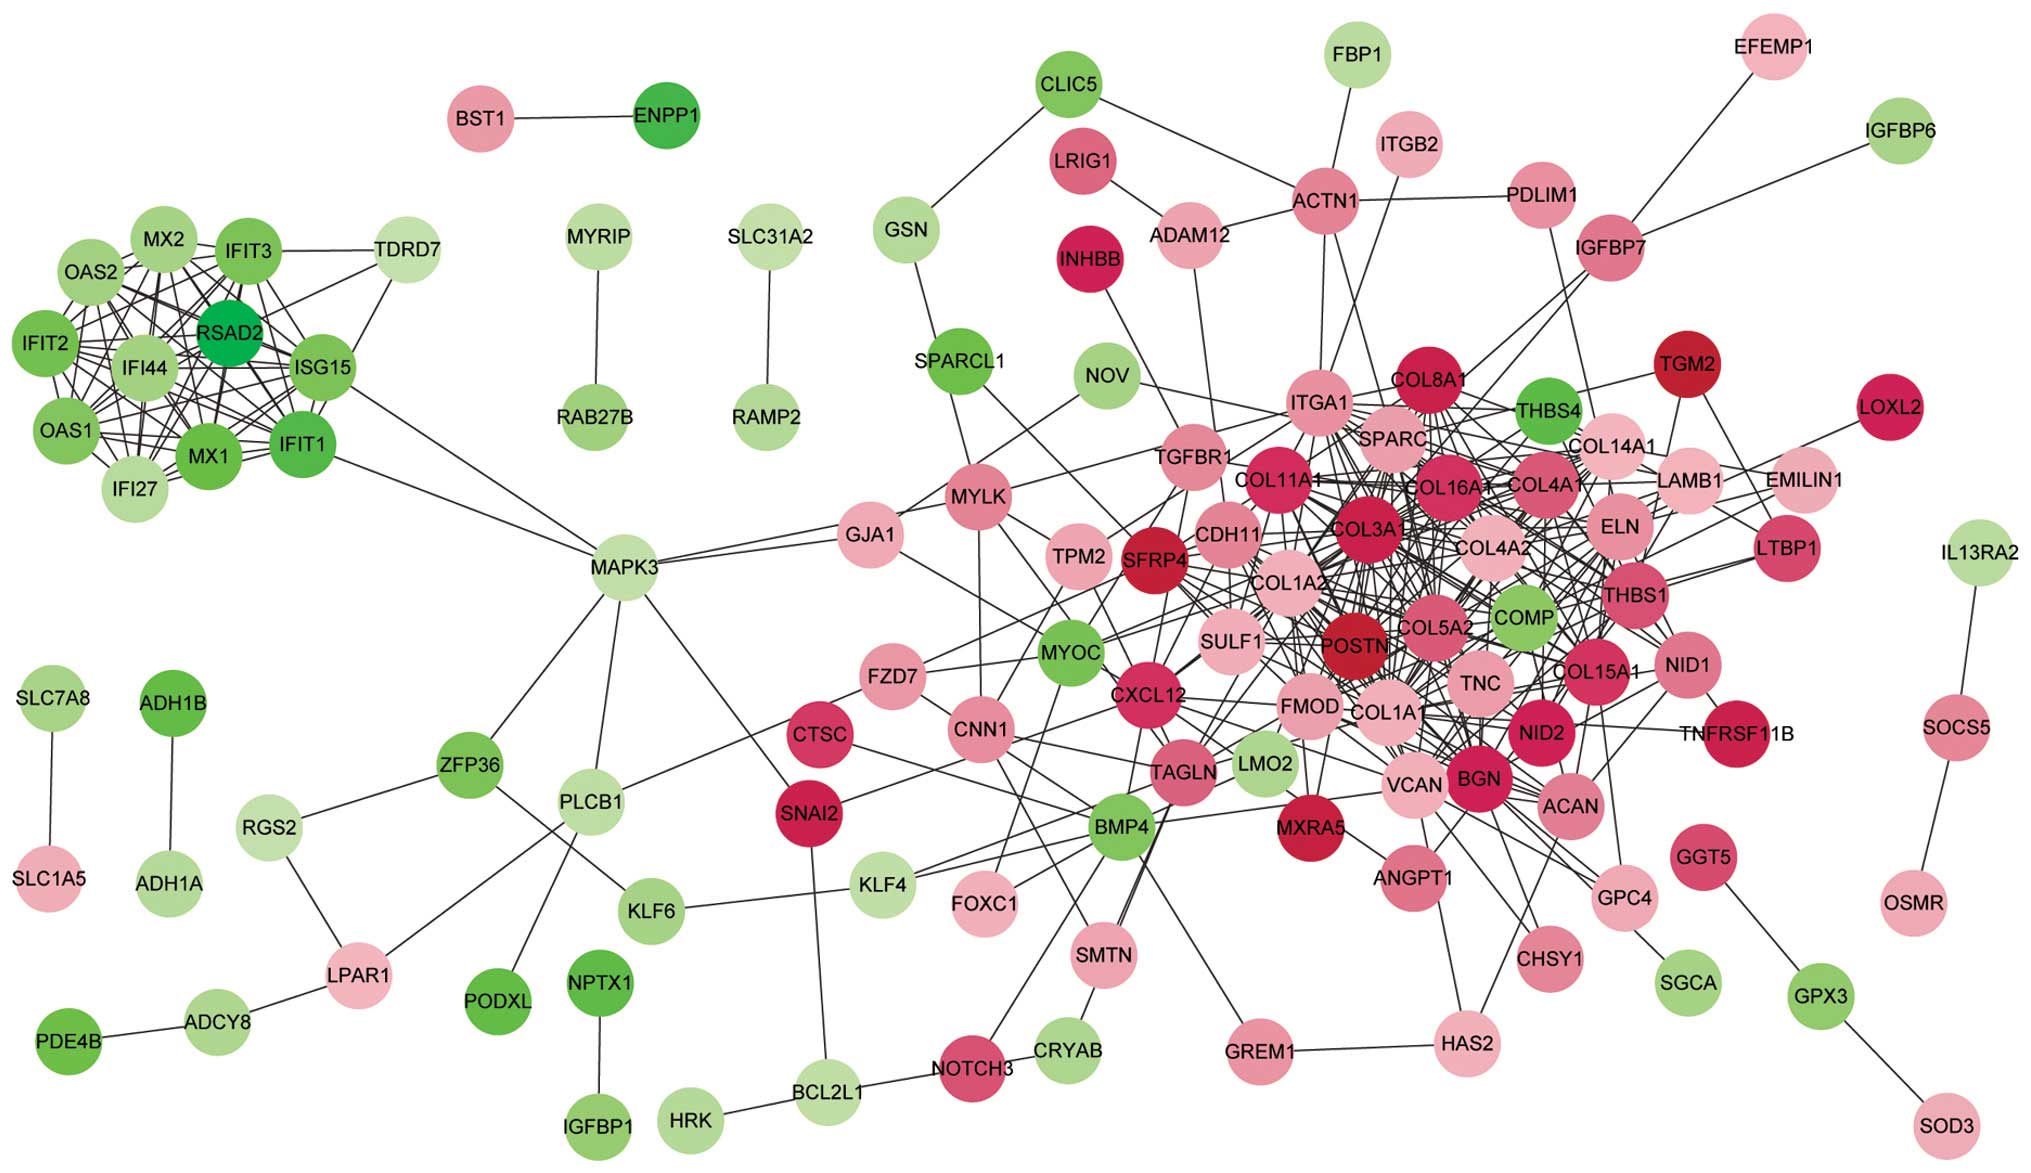
PPI network analysis
Based on the information of the STRING database, a
total of 343 protein interactions with combined scores >0.4 were
included in the PPI network (Fig.
1). The top 20 hub proteins were identified according to
connectivity degree (Table III),
including collagen type I α 1 (COL1A1), COL1A2, COL3A1, COL4A2,
integrin α 1, COL4A1, biglycan and COL11A1. Notably, in addition to
interferon-induced protein with tetratricopeptide repeats 3, these
hub nodes were upregulated and the majority of them are collagen
proteins.
| Table IIIThe top 20 differentially expressed
genes with higher connectivity degree in the protein-protein
interaction network. |
Table III
The top 20 differentially expressed
genes with higher connectivity degree in the protein-protein
interaction network.
| Gene | Degree |
|---|
| Collagen, type I, α
1 | 28 |
| Collagen, type I, α
2 | 27 |
| Collagen, type III,
α 1 | 27 |
| Collagen, type IV,
α 2 | 22 |
| Integrin subunit α
1 | 17 |
| Collagen, type IV,
α 1 | 17 |
| Biglycan | 17 |
| Collagen, type XI,
α 1 | 16 |
| Versican | 15 |
| Collagen, type IV,
α 2 | 15 |
| Secreted protein,
acidic, cysteine-rich | 15 |
| Periostin,
osteoblast specific factor | 15 |
| Elastin | 13 |
| Cadherin 11 | 12 |
| Interferon induced
protein | |
| with
tetratricopeptide repeats 1 | 12 |
| Fibromodulin | 12 |
| Collagen, type XIV,
α 1 | 12 |
| Interferon induced
protein | |
| with
tetratricopeptide repeats 3 | 11 |
| Collagen, type XV,
α 1 | 11 |
| Collagen, type XVI,
α 1 | 11 |
Functional module analysis of PPI
network
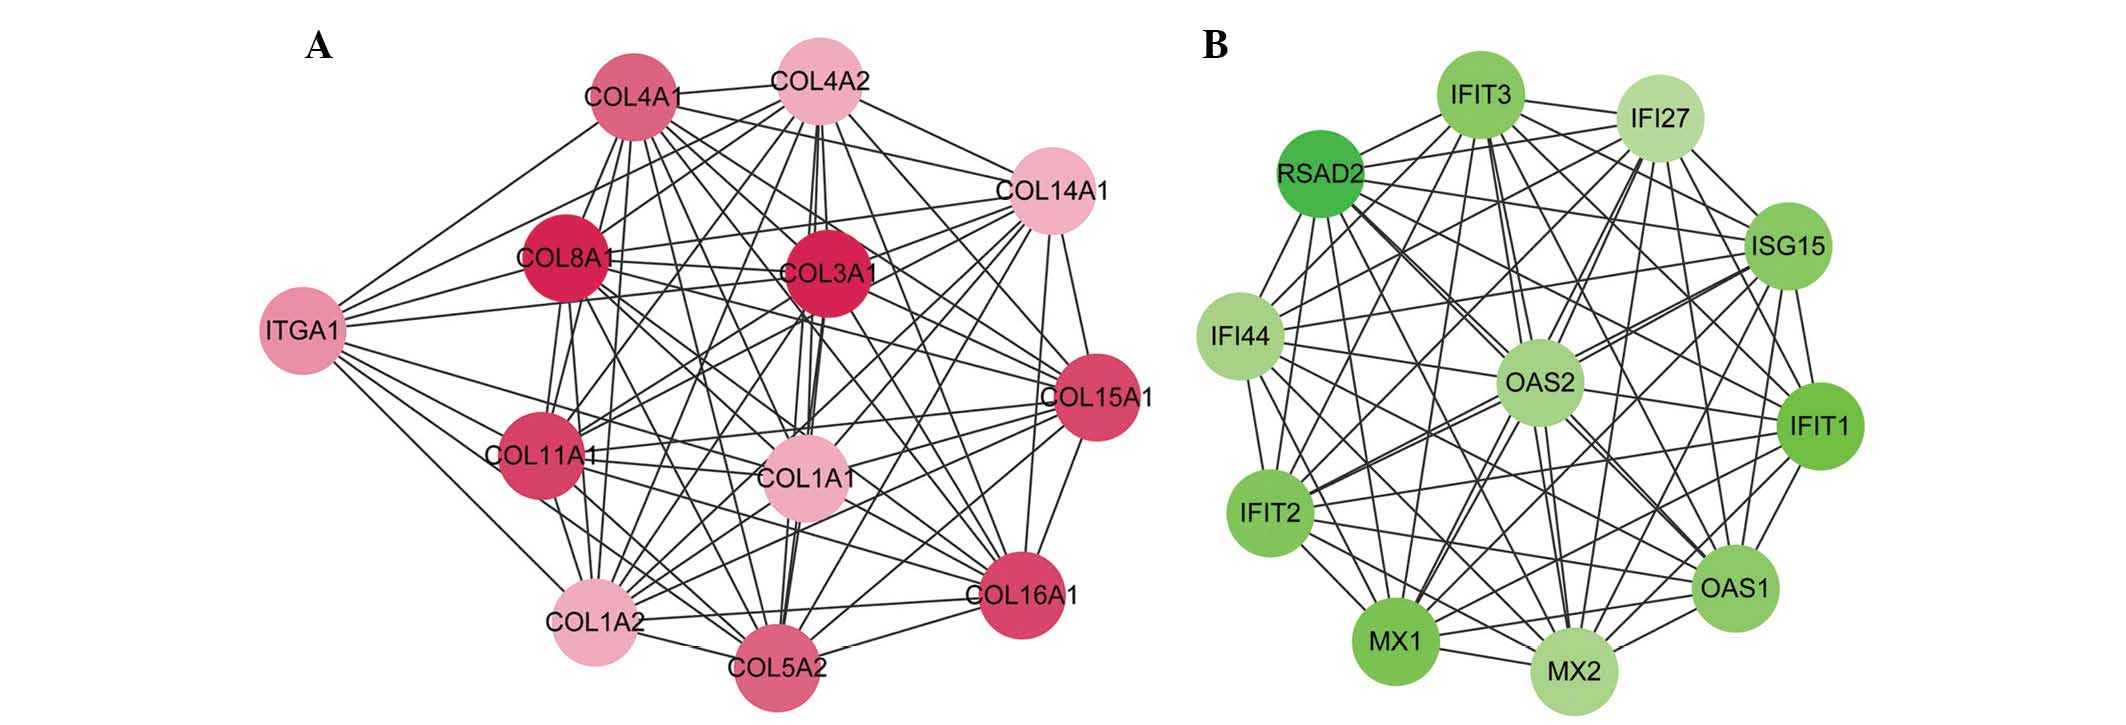
In order to improve analysis of the PPI network, 5
modules were detected using the MCODE plugin. Only 2 module scores
were >10 and the scores of other modules were not >3.5.
Module 1, with the highest node score (11.455), consisted of 12
nodes and 63 edges, in which upregulated genes, including COL3A1,
COL4A1, COL1A1 and COL11A1 were included (Fig. 2A). Module 2 (node score=11)
consisted of 11 nodes and 55 edges, in which the downregulated
genes were included (Fig. 2B). The
downregulated genes in module 2 included radical S-adenosyl
methionine domain containing 2 (RSAD2), 2′-5′-oligoadenylate
synthetase 2 (OAS2), myxovirus (influenza virus) resistance 1 (MX1)
and ISG15 ubiquitin-like modifier (ISG15).
In addition, functional enrichment analyses for DEGs
in the functional modules were performed. Module 1 was
predominantly associated with the regulation of cell proliferation,
response to wounding and wound healing (Table IV). Module 2 was predominantly
associated with immune functions, including the response to
viruses, defense response and immune response (Table IV). The significantly enriched
pathways of module 1 were ECM-receptor interaction and focal
adhesion, whereas, no pathways were significant for module 2
(Table IV).
| Table IVThe significantly enriched GO
biological progress terms for modules. |
Table IV
The significantly enriched GO
biological progress terms for modules.
| GO term | Description | No. enriched
genes | P-value |
|---|
| Module 1 | | | |
| 0042127 | Regulation of cell
proliferation | 12 |
6.47×10⁻¹⁰ |
| 0009611 | Response to
wounding | 10 |
4.98×10⁻⁹ |
| 0042060 | Wound healing | 7 |
1.89×10⁻⁷ |
| 0001666 | Response to
hypoxia | 7 |
3.28×10⁻⁷ |
| 0070482 | Response to oxygen
levels | 7 |
4.70×10⁻⁷ |
| 0009725 | Response to hormone
stimulus | 9 |
4.75×10⁻⁷ |
| 0031099 | Regeneration | 6 |
8.12×10⁻⁷ |
| 0009719 | Response to
endogenous stimulus | 9 |
1.15×10⁻⁶ |
| 0008284 | Positive regulation
of cell proliferation | 8 |
1.20×10⁻⁶ |
| 0001817 | Regulation of
cytokine production | 6 |
3.26×10⁻⁶ |
| Module 2 | | | |
| 0009615 | Response to
virus | 5 |
5.91×10⁻⁸ |
| 0006952 | Defense
response | 3 |
2.74×10⁻² |
| 0006955 | Immune
response | 3 |
3.40×10⁻² |
Discussion
There is a lack of effective treatments for RA and
OA, and exploring the gene signatures associated with the diseases
may elucidate the molecular pathogenesis and provide opportunities
for biomarker development. The results of the present study
demonstrated that the significant DEGs of module 1, including
COL3A1, COL4A1, COL1A1 and COL11A1, were predominantly enriched in
the ECM-receptor interaction and focal adhesion pathways.
Additionally, the DEGs of module 2, including RSAD2, OAS2, MX1 and
ISG15, were predominantly associated with immune responses. All
these DEGs and pathways may be important mechanisms in the
development of RA and OA.
In a previous study, Olex et al (28) identified the ECM-receptor
interaction pathway to be an important signaling and metabolic
pathway during the progression of OA. Koelling et al
(29) also demonstrated that
several dysregulated genes in OA samples were associated with
ECM-receptor interactions and focal adhesions. In the present
study, DEGs, including COL3A1, COL4A1, COL1A1 and COL11A1, were
predominantly enriched in the ECM-receptor interaction and focal
adhesion pathways. It can, therefore, be speculated that the these
pathways may contribute to OA progression. Additionally, COL3A1 is
a gene important for cartilage function, and its expression was
previously observed to be correlated with the radiographic severity
of canine elbow OA (30). Cui
et al (31) demonstrated
that COL3A1 expression was enriched in the focal adhesion pathway,
which may suggest a molecular mechanism of OA. Furthermore, COL4A1
was previously identified as an OA-associated gene involved in the
development of the disease (32).
Gene expression analysis also indicated that COL1A1 was
dysregulated in TGF-β-stimulated OA samples (33). COL11A1 was demonstrated to be an OA
susceptibility gene in human joint tissues and is important in the
development of this degenerative musculoskeletal disease (34). Additionally, a previous
investigation demonstrated that multiple collagen genes (COL1A1,
COL2A1, COL3A1 and COL4A1) were associated with the progression of
OA (28). Collagen derivatives are
candidates for disease-modifying OA drugs and are marketed as
having therapeutic effects on reducing the symptoms of OA (35). Therefore, it is speculated that
these collagens may be important gene signatures of OA and have
implications in the progression of this disease through effects on
ECM-receptor interactions and focal adhesions.
Furthermore, the innate immune response is
understood to cause inflammation and joint destruction in RA, and a
genome-wide association study has demonstrated that immune
regulatory factors underlie this disease (36). Additionally, the potential of
Tank-binding kinase 1 as a therapeutic target in RA suggests that
there is an association between the synoviocyte innate immune
responses and RA development (37). McInnes and Schett (1) also investigated the importance of
immune responses in the pathogenesis of RA. In the current study,
GO functions associated with the immune response were enriched.
Thus, the results of the present study support previous findings
and suggest that immune responses may contribute to RA
development.
Additionally, functional enrichment analysis
performed in the present study demonstrated that DEGs in RA
samples, including RSAD2, OAS2, MX1 and ISG15, were significantly
enriched in the immune response pathway. RSAD2 is a type I
interferon (IFN) response gene, and has been used in the clinic for
the prediction of RA development (38,39).
OAS2 is involved in the IFN β signaling pathway, and investigation
of core and periphery interaction structures previously identified
it as a candidate gene associated with RA (16). MX1 is also an IFN response gene and
was previously demonstrated to be correlated with disease activity
in fibroblast cells of RA synovial tissue (40). ISG15 sensitizes the IFN-activated
JAK-STAT pathway, which is established to be important in RA
development (41). Additionally,
type I IFN has been demonstrated to enhance immune responses in
vivo and acts as a signal linking innate and adaptive immunity
(42). Smith et al
(43) demonstrated that, as type I
IFN signatures, RSAD2, OAS2 and MX1 may be important for predicting
treatment response in RA. Therefore, the DEGs identified in the
present study may be crucial gene signatures for elucidating the
molecular pathogenesis of RA.
In conclusion, the results of the current study
indicate that RSAD2, OAS2, MX1 and ISG15 may be RA gene signatures,
and may be associated with RA development via effects on immune
responses. COL3A1, COL4A1, COL1A1 and COL11A1 may be important gene
signatures contributing to OA development via involvement in
ECM-receptor interactions and focal adhesion. The present findings
aid the clarification of the molecular mechanisms of RA and OA.
However, the sample size used in the current study was small.
Additional experiments, including reverse
transcription-quantitative polymerase chain reaction and western
blot analysis, were not performed to confirm the mRNA and protein
expression levels of these gene signatures. Thus, further studies
are required to investigate the potential clinical applications of
these gene signatures.
Acknowledgments
The current study was supported by 5010 Clinical
Research Project of Sun Yat-sen University (no. 2010005) and the
National Natural Science Foundation of China (nos. 81371941 and
81301558).
References
|
1
|
McInnes IB and Schett G: The pathogenesis
of rheumatoid arthritis. N Engl J Med. 365:2205–2219. 2011.
View Article : Google Scholar : PubMed/NCBI
|
|
2
|
Wong JB, Ramey DR and Singh G: Long-term
morbidity, mortality, and economics of rheumatoid arthritis.
Arthritis Rheum. 44:2746–2749. 2001. View Article : Google Scholar
|
|
3
|
Loeser RF, Goldring SR, Scanzello CR and
Goldring MB: Osteoarthritis: A disease of the joint as an organ.
Arthritis Rheum. 64:1697–1707. 2012. View Article : Google Scholar : PubMed/NCBI
|
|
4
|
Wang HJ, Yu CL, Kishi H, Motoki K, Mao ZB
and Muraguchi A: Suppression of experimental osteoarthritis by
adenovirus-mediated double gene transfer. Chin Med J (Engl).
119:1365–1373. 2006.
|
|
5
|
Huber R, Hummert C, Gausmann U, Pohlers D,
Koczan D, Guthke R and Kinne RW: Identification of intra-group,
inter-individual, and gene-specific variances in mRNA expression
profiles in the rheumatoid arthritis synovial membrane. Arthritis
Res Ther. 10:R982008. View
Article : Google Scholar : PubMed/NCBI
|
|
6
|
van den Berg WB: Osteoarthritis year 2010
in review: Pathomechanisms. Osteoarthritis Cartilage. 19:338–341.
2011. View Article : Google Scholar : PubMed/NCBI
|
|
7
|
Knevel R, Gröndal G, Huizinga TW, Visser
AW, Jónsson H, Víkingsson A, Geirsson AJ, Steinsson K and van der
Helm-van Mil AH: Genetic predisposition of the severity of joint
destruction in rheumatoid arthritis: A population-based study. Ann
Rheum Dis. 71:707–709. 2012. View Article : Google Scholar : PubMed/NCBI
|
|
8
|
Bian Q, Wang YJ, Liu SF and Li YP:
Osteoarthritis: Genetic factors, animal models, mechanisms, and
therapies. Front Biosci (Elite Ed). 4:74–100. 2012. View Article : Google Scholar
|
|
9
|
Bax M, van Heemst J, Huizinga TW and Toes
RE: Genetics of rheumatoid arthritis: What have we learned?
Immunogenetics. 63:459–466. 2011. View Article : Google Scholar : PubMed/NCBI
|
|
10
|
Sun Y, Caplazi P, Zhang J, Mazloom A,
Kummerfeld S, Quinones G, Senger K, Lesch J, Peng I, Sebrell A, et
al: PILRα negatively regulates mouse inflammatory arthritis. J
Immunol. 193:860–870. 2014. View Article : Google Scholar : PubMed/NCBI
|
|
11
|
Castaño Betancourt MC, Cailotto F, Kerkhof
HJ, Cornelis FM, Doherty SA, Hart DJ, Hofman A, Luyten FP,
Maciewicz RA, Mangino M, et al: Genome-wide association and
functional studies identify the DOT1L gene to be involved in
cartilage thickness and hip osteoarthritis. Proc Natl Acad Sci USA.
109:8218–8223. 2012. View Article : Google Scholar : PubMed/NCBI
|
|
12
|
Valdes AM, Spector TD, Tamm A, Kisand K,
Doherty SA, Dennison EM, Mangino M, Tamm A, Kerna I, Hart DJ, et
al: Genetic variation in the SMAD3 gene is associated with hip and
knee osteoarthritis. Arthritis Rheum. 62:2347–2352. 2010.
View Article : Google Scholar : PubMed/NCBI
|
|
13
|
Yoshida S, Arakawa F, Higuchi F, Ishibashi
Y, Goto M, Sugita Y, Nomura Y, Niino D, Shimizu K, Aoki R, et al:
Gene expression analysis of rheumatoid arthritis synovial lining
regions by cDNA microarray combined with laser microdis-section:
Up-regulation of inflammation-associated STAT1, IRF1, CXCL9,
CXCL10, and CCL5. Scand J Rheumatol. 41:170–179. 2012. View Article : Google Scholar : PubMed/NCBI
|
|
14
|
Chanalaris A: Identification of a gene
signature for osteoarthritis by comparing microarray data from
rodent and human cartilage studies. Osteoarthritis Cartilage.
22:S348–S349. 2014. View Article : Google Scholar
|
|
15
|
Lu QY, Han QH, Li X, Li ZC, Pan YT, Liu L
and Fu QG: Analysis of differentially expressed genes between
rheumatoid arthritis and osteoarthritis based on the gene
co-expression network. Mol Med Rep. 10:119–124. 2014.PubMed/NCBI
|
|
16
|
Singh S, Snijesh V and Vennila JJ:
Rheumatoid arthritis candidate genes identification by
investigating core and periphery interaction structures.
Computational Intelligence in Medical Informatics. Muppalaneni NB
and Gunjan VK: 1st edition. Springer-Verlag; Singapore: pp. 87–96.
2015
|
|
17
|
Pohlers D, Beyer A, Koczan D, Wilhelm T,
Thiesen HJ and Kinne RW: Constitutive upregulation of the
transforming growth factor-beta pathway in rheumatoid arthritis
synovial fibroblasts. Arthritis Res Ther. 9:R592007. View Article : Google Scholar : PubMed/NCBI
|
|
18
|
Gautier L, Cope L, Bolstad BM and Irizarry
RA: Affy - analysis of Affymetrix GeneChip data at the probe level.
Bioinformatics. 20:307–315. 2004. View Article : Google Scholar : PubMed/NCBI
|
|
19
|
Irizarry RA, Hobbs B, Collin F,
Beazer-Barclay YD, Antonellis KJ, Scherf U and Speed TP:
Exploration, normalization, and summaries of high density
oligonucleotide array probe level data. Biostatistics. 4:249–264.
2003. View Article : Google Scholar : PubMed/NCBI
|
|
20
|
Smyth GK: Limma: Linear models for
microarray data. Bioinformatics and Computational Biology Solutions
Using R and Bioconductor. Gentleman R, Carey V, Huber W, Irizarry R
and Dudoit S: Springer-Verlag; New York, NY: pp. 397–420. 2005,
View Article : Google Scholar
|
|
21
|
Ashburner M, Ball CA, Blake JA, Botstein
D, Butler H, Cherry JM, Davis AP, Dolinski K, Dwight SS, Eppig JT,
et al: Gene Ontology: Tool for the unification of biology. Nat
Genet. 25:25–29. 2000. View
Article : Google Scholar : PubMed/NCBI
|
|
22
|
Kanehisa M and Goto S: KEGG: Kyoto
encyclopedia of genes and genomes. Nucleic Acids Research.
28:27–30. 2000. View Article : Google Scholar
|
|
23
|
Huang DW, Sherman BT, Tan Q, Collins JR,
Alvord WG, Roayaei J, Stephens R, Baseler MW, Lane HC and Lempicki
RA: The DAVID Gene Functional Classification Tool: A novel
biological module-centric algorithm to functionally analyze large
gene lists. Genome Biol. 8:R1832007. View Article : Google Scholar : PubMed/NCBI
|
|
24
|
von Mering C, Huynen M, Jaeggi D, Schmidt
S, Bork P and Snel B: STRING: A database of predicted functional
associations between proteins. Nucleic Acids Res. 31:258–261. 2003.
View Article : Google Scholar : PubMed/NCBI
|
|
25
|
He X and Zhang J: Why do hubs tend to be
essential in protein networks? PLoS Genet. 2:e882006. View Article : Google Scholar : PubMed/NCBI
|
|
26
|
Shannon P, Markiel A, Ozier O, Baliga NS,
Wang JT, Ramage D, Amin N, Schwikowski B and Ideker T: Cytoscape: A
software environment for integrated models of biomolecular
interaction networks. Genome Res. 13:2498–2504. 2003. View Article : Google Scholar : PubMed/NCBI
|
|
27
|
Bader GD and Hogue CW: An automated method
for finding molecular complexes in large protein interaction
networks. BMC Bioinformatics. 4:22003. View Article : Google Scholar : PubMed/NCBI
|
|
28
|
Olex AL, Turkett WH, Fetrow JS and Loeser
RF: Integration of gene expression data with network-based analysis
to identify signaling and metabolic pathways regulated during the
development of osteoarthritis. Gene. 542:38–45. 2014. View Article : Google Scholar : PubMed/NCBI
|
|
29
|
Koelling S, Kruegel J, Irmer M, Path JR,
Sadowski B, Miro X and Miosge N: Migratory chondrogenic progenitor
cells from repair tissue during the later stages of human
osteoarthritis. Cell Stem Cell. 4:324–335. 2009. View Article : Google Scholar : PubMed/NCBI
|
|
30
|
Clements DN, Fitzpatrick N, Carter SD and
Day PJ: Cartilage gene expression correlates with radiographic
severity of canine elbow osteoarthritis. Vet J. 179:211–218. 2009.
View Article : Google Scholar
|
|
31
|
Cui S, Zhang X, Hai S, Lu H, Chen Y, Li C,
Tong P, Lu F and Yuan Z: Molecular mechanisms of osteoarthritis
using gene microarrays. Acta Histochemica. 117:62–68. 2015.
View Article : Google Scholar
|
|
32
|
Rao ZT, Wang SQ and Wang JQ: Exploring the
osteoarthritis-related genes by gene expression analysis. Eur Rev
Med Pharmacol Sci. 18:3056–3062. 2014.PubMed/NCBI
|
|
33
|
Remst DF, Blom AB, Vitters EL, Bank RA,
van den Berg WB, Blaney Davidson EN and Kraan PM: Gene expression
analysis of murine and human osteoarthritis synovium reveals
elevation of transforming growth factor β-responsive genes in
osteoarthritis-related fibrosis. Arthritis Rheum. 66:647–656. 2014.
View Article : Google Scholar
|
|
34
|
Raine EV, Dodd AW, Reynard LN and Loughlin
J: Allelic expression analysis of the osteoarthritis susceptibility
gene COL11A1 in human joint tissues. BMC Musculoskelet Disord.
14:852013. View Article : Google Scholar : PubMed/NCBI
|
|
35
|
Van Vijven JP, Luijsterburg PA, Verhagen
AP, Van Osch GJ, Kloppenburg M and Bierma-Zeinstra SM: Symptomatic
and chon-droprotective treatment with collagen derivatives in
osteoarthritis: A systematic review. Osteoarthritis Cartilage.
20:809–821. 2012. View Article : Google Scholar : PubMed/NCBI
|
|
36
|
Burton PR, Clayton DG, Cardon LR, Craddock
N, Deloukas P, Duncanson A, Kwiatkowski DP, McCarthy MI, Ouwehand
WH, Samani NJ, et al: Genome-wide association study of 14,000 cases
of seven common diseases and 3,000 shared controls. Nature.
447:661–678. 2007. View Article : Google Scholar
|
|
37
|
Hammaker D, Boyle DL and Firestein GS:
Synoviocyte innate immune responses: TANK-binding kinase-1 as a
potential therapeutic target in rheumatoid arthritis. Rheumatology
(Oxford). 51:610–618. 2012. View Article : Google Scholar
|
|
38
|
Lübbers J, Brink M, van de Stadt LA,
Vosslamber S, Wesseling JG, van Schaardenburg D, Rantapää-Dahlqvist
S and Verweij CL: The type I IFN signature as a biomarker of
preclinical rheumatoid arthritis. Arthritis Res Ther. 72:776–780.
2013.
|
|
39
|
Raterman HG, Vosslamber S, de Ridder S,
Nurmohamed MT, Lems WF, Boers M, van de Wiel M, Dijkmans BA,
Verweij CL and Voskuyl AE: The interferon type I signature towards
prediction of non-response to rituximab in rheumatoid arthritis
patients. Arthritis Res Ther. 4:R952012. View Article : Google Scholar
|
|
40
|
Galligan CL, Baig E, Bykerk V, Keystone EC
and Fish EN: Distinctive gene expression signatures in rheumatoid
arthritis synovial tissue fibroblast cells: Correlates with disease
activity. Genes Immun. 8:480–491. 2007. View Article : Google Scholar : PubMed/NCBI
|
|
41
|
Boyle DL, Soma K, Hodge J, Kavanaugh A,
Mandel D, Mease P, Shurmur R, Singhal AK, Wei N, Rosengren S, et
al: The JAK inhibitor tofacitinib suppresses synovial JAK1-STAT
signalling in rheumatoid arthritis. Ann Rheum Dis. 74:1311–1316.
2015. View Article : Google Scholar :
|
|
42
|
Le Bon A and Tough DF: Links between
innate and adaptive immunity via type I interferon. Curr Opin
Immunol. 14:432–436. 2002. View Article : Google Scholar : PubMed/NCBI
|
|
43
|
Smith SL, Plant D, Eyre S and Barton A:
The potential use of expression profiling: Implications for
predicting treatment response in rheumatoid arthritis. Ann Rheum
Dis. 72:1118–1124. 2013. View Article : Google Scholar : PubMed/NCBI
|