Introduction
Nonalcoholic fatty liver disease (NAFLD) is a common
cause of chronic liver disease, and comprises a wide range of
pathological changes in the liver, from non-progressive steatosis
to nonalcoholic steatohepatitis (NASH), advanced fibrosis and
cirrhosis, ultimately leading to hepatocellar carcinoma (HCC)
(1). NASH is characterized by
lobular inflammation, hepatocellular ballooning and fibrosis, and
is key in the progression to cirrhosis and HCC (2). Day and James described a two-hit
theory (3), regarding the hepatic
triglyceride accumulation as the first hit and mitochondrial
dysfunction, oxidative stress and inflammatory factors as the
second hit (4). Substantial
evidence has indicated that mitochondrial dysfunction is directly
associated with the pathogenesis of NASH and has suggested that
NASH is a mitochondrial disease (5,6).
Mitochondrial dysfunction impairs lipid metabolism and induces the
overproduction of reactive oxygen species (ROS), which triggers the
peroxidation of lipids and apoptosis of hepatocytes (7). In addition, this can decrease the
activity of the mitochondrial respiratory chain (MRC), which
further impairs adenosine triphosphate (ATP) synthesis and enhances
oxidative stress (7). However, the
alterations in mitochondrial proteomics in response to NASH remain
to be fully elucidated.
In our previous study, a high fat and high
cholesterol diet (HFD) was used to establish a NASH rat model,
which is more similar to dietary conditions, compared with the
methionine-choline-deficient diet in humans (8). To date, using the NASH rat model,
there has been no attempt to establish a comparative proteome
profile of liver mitochondria using isobaric tags for relative and
absolute quantitation (iTRAQ) technology coupled with
two-dimensional liquid chromatography-tandem mass spectrometry (2-D
LC-MS/MS) analysis.
Compared with traditional 2-D gel electrophoresis,
it is easier to analyze eight samples simultaneously using iTRAQ
technology, thus enhancing throughput, and increasing sensibility
and accuracy (9). To the best of
our knowledge, the present study using the NASH rat model is the
first to perform proteomic analysis of liver mitochondria using
iTRAQ technology, to provide novel insights into the pathogenesis
and progression of NASH via mitochondrial protein profiling.
Materials and methods
Animal models of NASH
Eight-week-old male Sprague-Dawley rats weighing
~320 g were purchased from the Laboratory Animal Centre of Wenzhou
Medical University (Wenzhou, China). Under a 12-h light-dark cycle
and controlled temperature (23±2°C), all rats were raised under
specific pathogen-free conditions with free access to water and
food. The animals were acclimatized to the laboratory conditions
for 1 week prior to the experiments and were randomly divided into
two groups: Control group (n=6) and HFD group (n=10). The rats in
the control group and the HFD group were respectively fed with a
standard chow diet (SCD) and a high fat diet (1% cholesterol, 19%
lard and 80% SCD) for 16 weeks. The body weights of the rats were
measured weekly. The rats were sacrificed following overnight
fasting. All protocols and procedures conformed to the guidelines
of the Laboratory Animal Ethics Committee of Wenzhou Medical
University, and all efforts were made in order to minimize the
suffering and the number of animals used.
Blood and liver sample
preparation
Following sacrifice, blood samples from the
abdominal vein of the rats were collected in coagulation-promoting
tubes and centrifuged at 1,500 g for 15 min at 4°C (Eppendorf
5810R; Eppendorf, Hamburg, Germany) to obtain the serum for
biochemical analysis, which was stored at −80°C prior to analysis.
The levels of glucose, total cholesterol (TC), triglyceride (TG),
low-density lipoprotein (LDL-C) and high-density lipoprotein
(HDL-C) were measured using an automated biochemistry analyzer
(Hitachi, Tokyo, Japan). The livers were excised, cleaned with
ice-cold phosphate-buffered saline and weighed immediately. The
left lobes of each liver were then fixed in 4% paraformaldehyde
solution for further morphological analysis using hematoxylin and
eosin (H&E) staining, with images captured using a Nikon
microscope (Nikon E-100 A12.0705; Nikon Corporation, Tokyo, Japan).
Additionally, sections of the liver tissue were added to a volume
of storage medium containing 20% dimethyl sulfoxide, 0.21 M
mannitol and 0.07 M sucrose (pH 7.5) for mitochondrial separation,
and other sections were directly snap frozen in liquid nitrogen and
then preserved at −80°C until use (10).
Determination of relative mtDNA copy
number
Total DNA from the liver tissues was extracted using
a Blood and Cell Culture DNA Mini kit (Qiagen GmbH, Hilden,
Germany). Reverse transcription-quantitative polymerase chain
reaction (RT-qPCR) analysis was used to determine the relative
mtDNA copy number. The RT-qPCR amplification reaction was performed
via SYBR-Green chemistry using Bio-Rad CFX Manage 2.1 (Bio-Rad
Laboratories, Inc., Hercules, CA, USA). The mtDNA was synthesized
and amplified using the following primers: ND1 forward,
5′-ATTCTAGCCACATCAAGTCTTT-3′ and reverse,
5′-GGAGGACGGATAAGAGGATAAT-3′; β-actin forward,
5′-GAAATCGTGCGTGACATTAAAG-3′ and reverse, 5′-ATCGGAACCGCTCATTG-3′.
Each sample was analyzed in triplicate with a 20 µl final volume
containing SYBR-Green Supermix PCR 1X Master mix (Bio-Rad
Laboratories, Inc.), 0.5 µM forward and reverse primes and 100 ng
DNA template. Following 3 min denaturation at 95°C, amplification
was performed for 39 cycles, including 95°C for 10 sec for
denaturation, and 55°C for 30 sec for annealing and extension.
Melting curve analysis was performed at the end of each run to
validate the specificity of the PCR products. The quantification of
the relative mtDNA copy number was performed using the
2ΔΔCq method (11),
normalized to β-actin.
Isolation of liver mitochondria
The frozen liver tissues of the rats were rapidly
thawed using a preheated medium of 0.4% BSA (Beyotime Institute of
Biotechnology, Haimen, China), 0.25 M sucrose and 0.01 M Tris-HCl
(pH 7.5) at 45°C in a 4:1 ratio of medium to tissue. The
mitochondria were isolated as described previously (12). In brief, the liver tissues were
weighed, washed and homogenized at 4°C in isolation buffer
containing 0.5% BSA, 225 mM mannitol, 75 mM sucrose, 30 mM Tris/HCl
and 0.5 mM EGTA (pH 7.4). The homogenate was centrifuged twice at
4°C and 740 g for 10 min to remove unbroken cells and nuclei, and
at 4°C and 9,000 g for 10 min three times to precipitate the
mitochondrial pellet and obtain the crude mitochondria. The pellet
was resuspended in MRB buffer containing 250 mM mannitol, 5 mM
HEPES and 0.5 mM EGTA (pH 7.4), and gently layered on top of 30%
(v/v) percoll. Following 50 min of centrifugation at 4°C and 95,000
× g, collection and washing of the mitochondrial fraction twice,
centrifugation was performed at 4°C and 6,300 × g for 10 min with
MRB to remove the residual percoll. Using the BCA protein assay kit
(Thermo; Fisher Scientific, Inc., Waltham, MA, USA) the
concentration of mitochondrial protein was measured. Mitochondria
were stored in −80°C for proteomic analysis.
MRC enzymatic assays
As described above, the pellet (crude mitochondria)
was resuspended in MRB and freeze-thawed three times using liquid
nitrogen. All samples were measured in triplicate using a Varioskan
Flash reader (Thermo Fisher Scientific, Inc.).
The specific activity of complex I, ubiquinone
oxidoreductase (NADH) was analyzed according to the decrease in
absorbance at 340 nm due to the oxidation of NADH. The isolated
mitochondria (25 µg) were added into 200 µl of the reaction buffer
(195 µM NADH, 50 mM potassium phosphate buffer, 10 µg/ml antimycin,
10 µM decylubiquinone and 5 mM NaN3) in a 96-well plate.
Under the conditions of 340 nm and 30°C, the rate of oxidation of
NADH was measured for 90 sec.
The specific activity of complex II (succinate
dehydrogenase) was assessed by the decrease of absorbance at 600 nm
due to reduction of dichlorophenol indophenols. The 200 µl reaction
buffer (270 mM potassium phosphate buffer, 200 mM succinate, 12 µM
rotenone, 7.5 µM NaN3, 5 µg/ml antimycin, 100 mM
2,6-dichlorophenolindophenolsodium salt and 20 µg mitochondria
protein) was equilibrated for 10 min at 30°C. Following the
addition of 4 µl of 1 mM decylubiquinone, the reaction was
initiated and absorbance was measured at 600 nm for 90 sec at
30°C.
Complex III (decylubiquinol cytochrome
coxidoreductase) was measured by the increase of absorbance at 550
nm due to the reduction of cytochrome c. The 200 µl reaction
buffer (250 mM sucrose, 100 mM Tris/Hcl, 1 mM EDTA, 50 µM
cytochrome c, 50 µM decylubiquinol, 45 µM
n-dodecyl-β-d-maltoside and 7.5 µM NaN3) was incubated
for 60 sec and the reaction was induced by adding 20 µg of
mitochondrial protein. The absorbance was measured at 550 nm for 90
sec at 30°C.
Complex IV (cytochrome c oxidase) was
measured by the decrease of absorbance at 550 nm due to oxidization
of the reduced cytochrome c. The mitochondria (20 µg) were
added into 200 µl reaction buffer, containing 9.4 mM potassium
phosphate buffer, 50 µM reduced cytochrome c and 450 µm
n-dodecyl-β-d-maltoside. The reaction was detected at 550 nm for
135 sec at 30°C.
The activity of citrate synthase was assessed by
alterations of thionitrobenzoate anion formation. The mitochondrial
protein (20 µg) was added to 200 µl reaction buffer (0.1 M
Tris/Hcl, 0.1 M 5,5′-dithiobis-2-nitrobenzoate, 0.3 mM acetyl-CoA,
450 µM n-dodecyl-β-d-maltoside and 500 µM oxaloacetate). The
absorbance was then measured at 412 nm for 270 sec. The activity of
CS was expressed in nmol/min/mg, and normalized to total tissue
protein content.
ATP synthase activity
According to the manufacturer's protocol of the ATP
Synthase Enzyme Activity Microplate Assay kit (Abcam, Cambridge,
UK), ADP and phosphate are produced by ATP synthase hydrolyzing
ATP. The oxidation of NADH is coupled with the production of ADP
and ultimately becomes NAD+. The reaction was detected
at 340 nm for 90 sec at 30°C.
Mitochondrial membrane potential (MMP)
analysis using JC-1
MMP was determined in the crude mitochondria freshly
isolated from liver tissues using a JC-1 Mitochondrial Membrane
Potential Detection kit (Beyotime Institute of Biotechnology).
According to the manufacturer's protocol, 50 µg of mitochondria
were stained by JC-1 and scanned at 490 nm excitation/530 nm
emission and at 525 nm excitation/590 nm emission to detect green
and red JC-1 fluorescence, respectively, using the Varioskan Flash
reader.
Quantitative proteomics using the
iTRAQ technique
Mitochondria were solubilized in lysis buffer (7 M
urea, 2 M thiourea, 40 mM Tris, 2 mM EDTA, 1 mM PMSF, 0.2% SDS and
4% CHAPS), and sonicated at 200 W for 15 min on ice, followed by
centrifugation at 4°C and 25,000 g for 20 min. The supernatant was
added to 10 mM DTT (final concentration) and maintained at 56°C for
1 h, this step was for reducing the disulfide bonds in the
proteins. The mixture was kept in the dark, and 55 mM IAM (final
concentration) was added and incubated for 1 h in order to block
the cysteines. To remove detergents, which may interfere with
iTRAQ™ labeling, the protein was precipitated by the addition of
five volumes of chilled acetone for 2 h at −20°C. Following
centrifugation at 4°C at 25,000 g for 20 min, the pellet was
dissolved in 500 µl of 0.5 M triethylammonium bicarbonate (Applied
Biosystems; Thermo Fisher Scientific, Inc.) and sonicated again.
The samples were then centrifuged at 25,000 g for 20 min at 4°C.
The Bradford method (Thermo Fisher Scientific, Inc.) was used to
quantify the supernatant. Protein of each sample (100 µg) was
digested with trypsin (Promega Corporation, Madison, WI, USA), at
20:1 protein to trypsin ratio, overnight at 37°C. Vacuum
centrifugation was performed to dry the peptides following the
digestion with trypsin. According to the iTRAQ™ reagents protocol,
using 8-plex iTRAQ reagent (Applied Biosystems; Thermo Fisher
Scientific, Inc.), the peptides were dissolved and samples labeled
as follows: Control (CON)-2 (117 tag), CON-4 (114 tag), CON-5 (119
tag), CON-8 (116 tag), HFD-1 (113 tag), HFD-2 (118 tag), HFD-4 (115
tag) and HFD-8 (121 tag) randomly selected from the control group
and HF group, respectively. Vacuum centrifugation at 4°C and 12,000
g for 10 min was performed to pool and dry the labeled peptide
mixtures.
The peptide mixtures were added to 4 ml solvent A,
which contained 25 mM NaH2PO4 dissolved in
25% can (pH 2.7) and then injected into a 4.6×250 mm Ultremex SCX
column, which worked with the LC-20AB HPLC Pump system (Shimadzu
Corporation, Kyoto, Japan) and contained 5 µm particles
(Phenomenex, Inc., Torrence, CA, USA). A gradient of solvents was
used to elute the peptides at a 1 ml/min flow rate: 10 min of 100%
solvent A, 7 min of 5% solvent B, which contained 1 M KCl and 25 mM
NaH2PO4 dissolved in 25% ACN (pH 2.7), 20 min
of 5–60% solvent B and 1 min of 60–100% buffer B. Finally, washing
was performed for 1 min of 100% buffer B and equilibrated for 10
min in buffer A prior to the next loading. The absorbance of
elution was monitored at 214 nm and the fractions were collected
every 1 min. In total, 20 fractions were collected, which were
desalted in a Strata X C18 column (Phenomenex, Inc.) and
then dried them completely in a vacuum centrifuge.
Fractions were reconstituted with solvent A (2% CAN,
0.1% FA) and centrifuged for 10 min at 4°C and 20,000 g to remove
the insoluble substance, and the final concentration of peptide was
adjusted to 0.5 µg/µl. In each fraction, using the autosampler, 5
µg of peptide mixture was injected into a Shimadzu LC-20AD nano
HPLC (Shimadzu Corporation), which had a 2 cm C18 trap
column. Subsequently, an in-house packed analytical column (75 µm ×
10 cm, C18) was used to elute the peptides. The peptides
were loaded at 8 µl/min for 4 min and separated at a flow of 300
nl/min over 44 min with a gradient of solvent B (98% ACN and 0.1
FA). Subsequently, the linear gradient was increased to 80% within
2 min and maintained at 80% for 4 min, followed by a return to 5%
for 1 min. The effluent was analyzed using a Q-Exactive mass
spectrometer (Thermo Fisher Scientific, Inc.) with nanoelectrospray
and voltage set at 1.6 KV. At a resolution of 7,000 in an Orbitrap
mass analyzer, full MS scans were acquired from 350–2,000 m/z for
the detection. A fragment ion spectrum was produced via high-energy
collision dissociation and the mass range of 100–1,800 m/z was
detected in by Orbitrap mass analyzer at a resolution of 17,500. In
the MS survey scan, following a dynamic exclusion duration of 15
sec, MS/MS data were obtained through data-dependent acquisition,
which used the 15 most abundant precursor ions above the threshold
ion count of 20,000. The automatic gain control target for full MS
was 3e6 and for MS/MS was 1e5, and were used
to optimize the spectra generated by the Orbitrap analyzer.
Protein identifications were performed using
Discoverer 1.2 (Thermo Electron, San Jose, CA, USA), compared with
a database containing the UniprotRat sequences, using the Mascot
search engine (version 2.3.02; Matric Science, London, UK). In the
identification of proteins, which allowed for one missed cleavage
in the trypsin digestion, the tolerance of the peptide mass in MS
was 20 ppm and for fragmented ions was 0.05 Da. The conversion of
N-terminal glutamine to pyroglutamic acid, oxidation of methionine
and tyrosine labeled by iTRAQ-8-plex were set as the potential
variable modifications. The carbamidomethylation of cysteine at the
N-terminal of peptides and lysine labeled by iTRAQ-8-plex were
considered to fix these modifications. Peptides with significance
scores (≥20; P<0.01) were counted as identified in order to
reduce false peptide identification. At least one unique peptide
was involved in the identification of each confident protein and at
least two unique peptides were required to quantify protein.
Significant changes in the quantitative protein ratios were
identified by setting cut off values of a fold change >1.2 and
P<0.05. Using the Blast2GO program (www.blast2go.com), compared with the non-redundant
protein database (NR; NCBI), functional annotations, which had
differential proteins, were performed. The Kyoto Encyclopedia of
Genes and Genomes (KEGG; http://www.genome.jp/kegg/) and Cluster of Orthologous
groups (http://www.ncbi.nlm.nih.gov/COG/) databases were used
to classify and group these identified proteins.
Western blot analysis
The proteins levels of NADH dehydrogenase 1α
subcomplex subunit 5 (Ndufa5), NADH dehydrogenase iron-sulfur
protein 6 (Ndufs6), ATP synthase α subunit (ATP5A), transcription
factor A, mitochondrial (TFAM) and cytochrome b (CytB) from the
liver mitochondria of the control and HFD groups were measured
using western blot analysis. The proteins were extracted as
described above in the ‘Isolation of liver mitochondria’ section
and quantified by BCA Protein assay kit (Thermo Fisher Scientific,
Inc.). The proteins (20 µg) were separated on an SDS-PAGE gel and
transferred onto nitrocellulose membranes (Bio-Rad Laboratories,
Inc.), and then blocked with 5% nonfat milk buffer for 1.5 h. The
membranes were then incubated overnight with anti-Ndufa5 (1:1,000;
cat. no. 16640-1-AP; ProteinTech Group, Inc., Chicago, USA),
anti-Ndufs6 (1:1,000; cat. no 14417-1-AP; ProteinTech Group, Inc.),
anti-ATP5A (1:1,000; cat. no. 14676-1-AP; ProteinTech Group, Inc.),
anti-TFAM (1:1,000; cat. no. ab131607; Abcam) and CytB (1:1,000;
cat. no. 55090-1-AP; ProteinTech Group, Inc.) at 4°C. The membranes
were washed once with TBST buffer and incubated with horseradish
peroxidase-conjugated anti-rabbit secondary antibodies (1:3,000;
cat. no. A0208; Beyotime Institute of Biotechnology) at room
temperature for 1 h. The intensity of the bands was detected using
ECL Western Blotting Substrate (Thermo Fisher Scientific,
Inc.).
Statistical analysis
All results are presented as the mean ± standard
deviation and data were analyzed using Student's t-test.
Statistical analyses were performed with SPSS 20.0 (IMB SPSS,
Armonk, NY, USA). P<0.05 was considered to indicate a
statistically significant difference.
Results
Characterization of the NASH rat
model
The 16 weeks of HFD feeding successfully induced
hepatic steatohepatitis. The body weights of the rats, compared
with those in the control group, were significantly increased in
the HFD group (P<0.05; Table
I). Of note, HFD chow resulted in a marked increase in the
liver weight and hepatic index (liver weight/body weight %). Higher
levels (P<0.01) of serum TC and LDL-C were also found in the
HFD-fed rats, compared with those in the controls, although no
significant differences were found in the TG, HDL-C or glucose
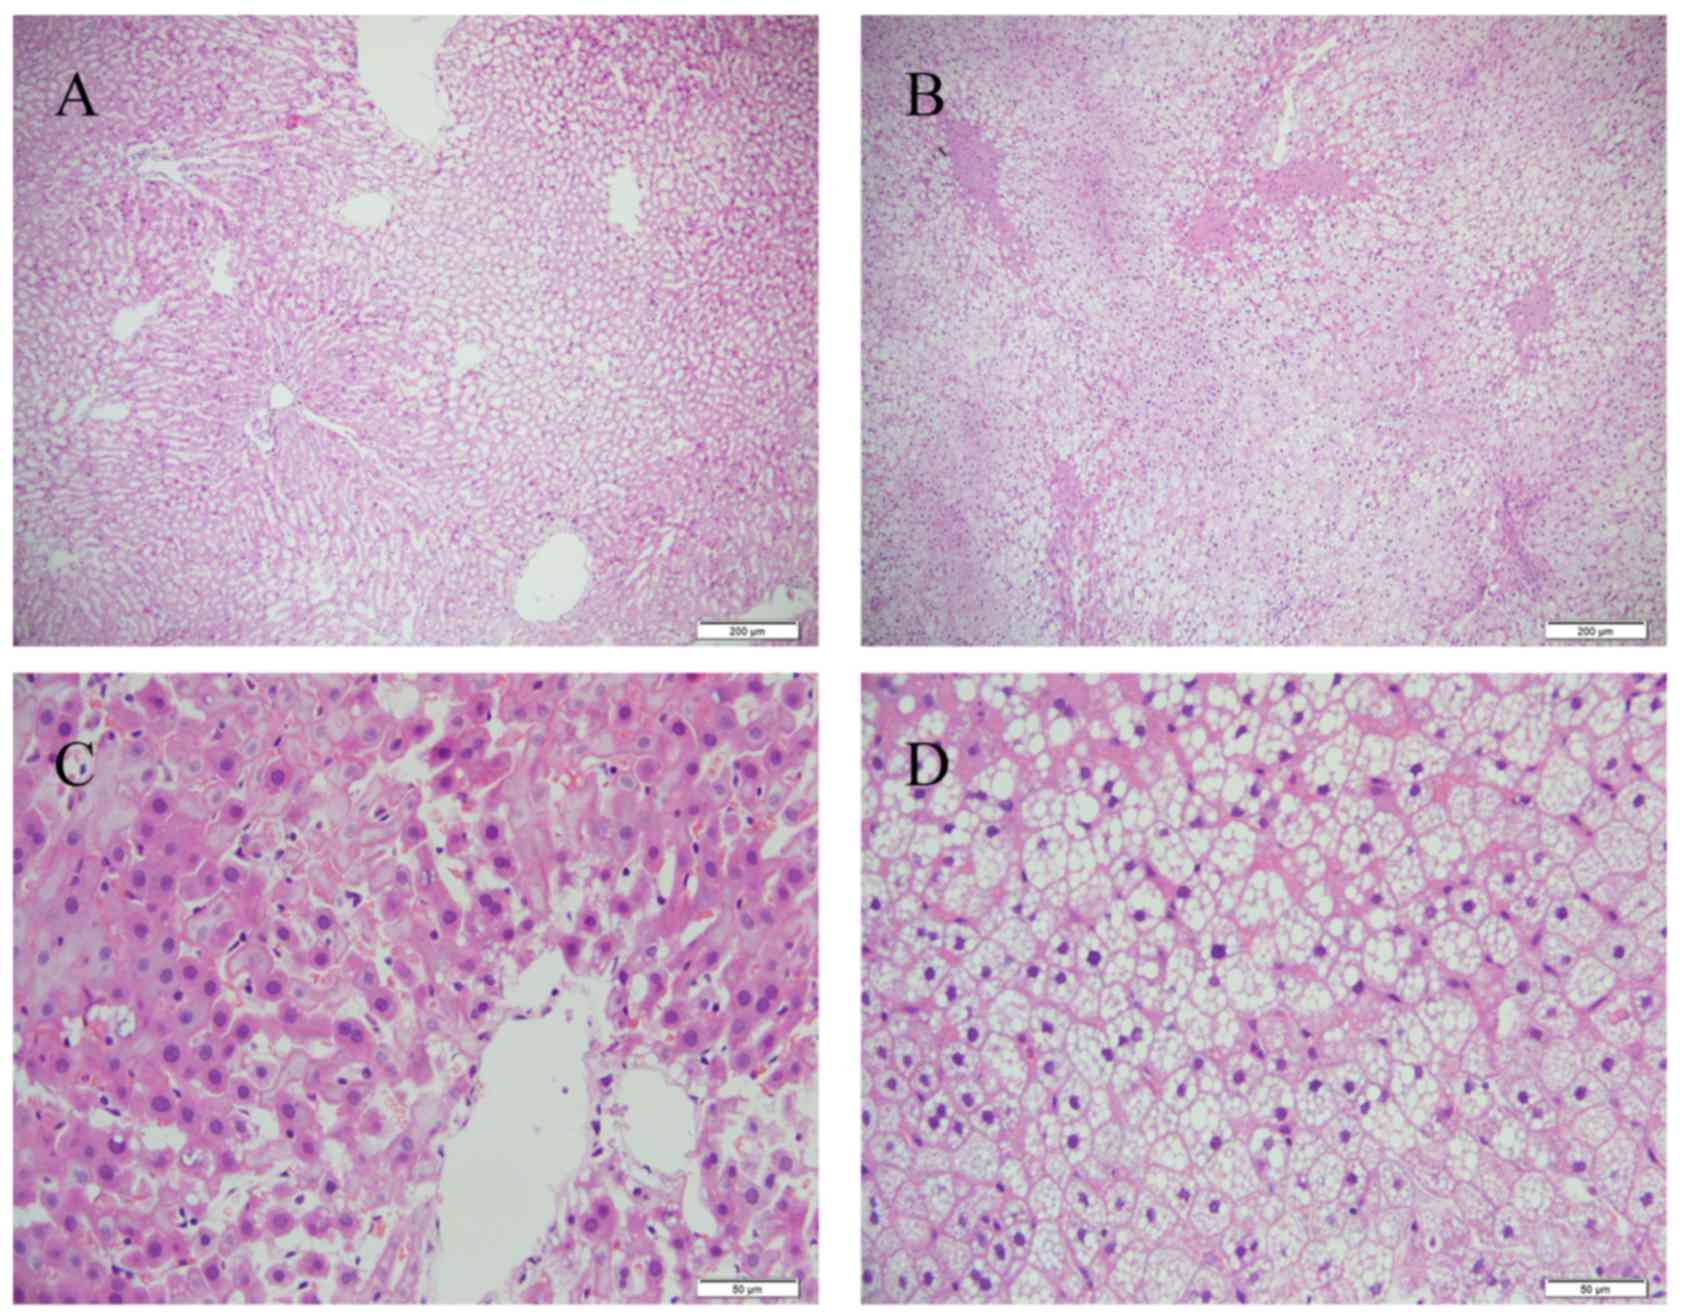
levels (Table II). Following 16
weeks of HFD feeding, the livers sections showed that there were
abundant macrovesicular fat droplets in the hepatocytes and
increased quantities of ballooned hepatocytes in the centrilobular
parenchyma, leading to destruction of the normal structure of
numerous hepatic lobules (Fig. 1).
Furthermore, foci of necrosis and infiltration of inflammatory
cells were identified in the centrilobular region. The liver
tissues of the control group showed no histological abnormalities
(Fig. 1).
 | Table I.Body weights and liver weights or
rats. |
Table I.
Body weights and liver weights or
rats.
| Parameter | Con (n=6) | HFD (n=10) |
|---|
| Initial body weight
(g) | 318.83±19.31 | 321.30±15.25 |
| Final body weight
(g) | 516.50±37.07 |
548.20±22.23a |
| Liver weight
(g) | 11.71±1.17 |
16.56±3.26b |
| Liver weight/body
weight (%) | 2.26±0.22 |
3.02±0.57b |
| Table II.Serum biochemical parameters. |
Table II.
Serum biochemical parameters.
| Parameter (mM) | Con (n=6) | HFD (n=10) |
|---|
| Glucose | 10.92±0.90 | 10.49±2.10 |
| TG |
0.56±0.13 |
0.64±0.10 |
| TC |
1.66±0.41 |
2.44±0.48a |
| LDL-C |
1.07±0.35 |
1.86±0.43a |
| HDL-C |
0.34±0.11 |
0.29±0.13 |
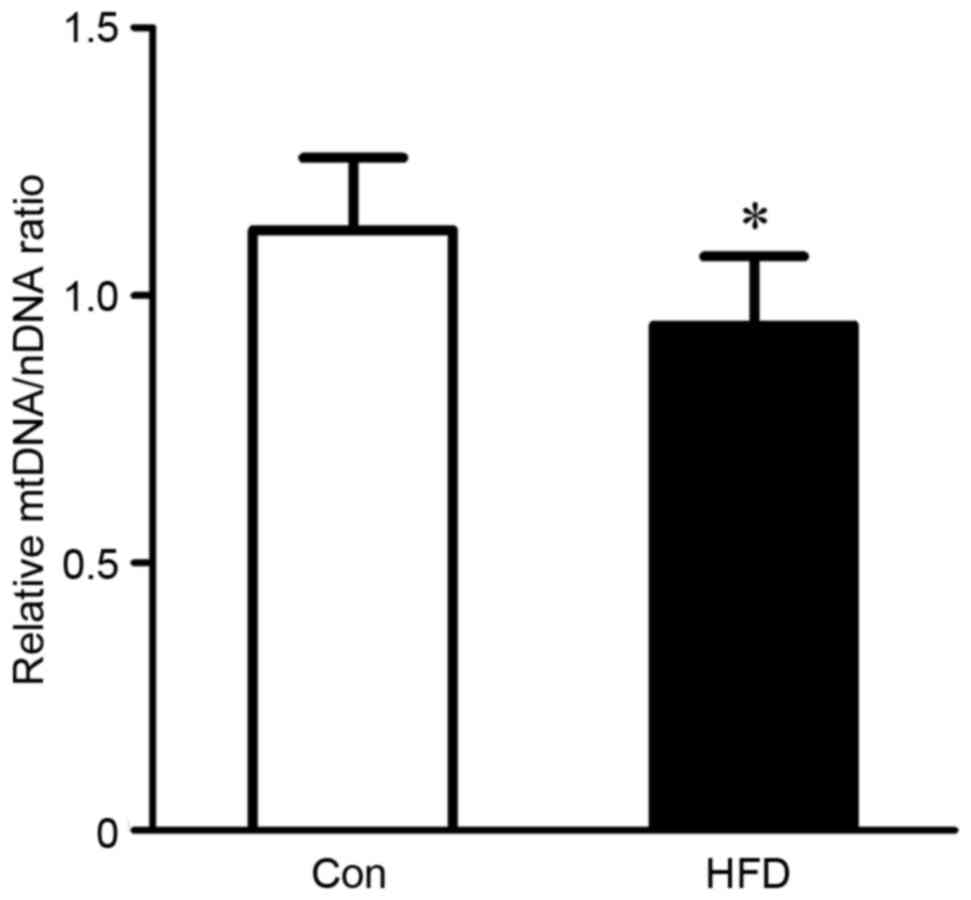
Effect of mtDNA copy number
The present study also evaluated alterations of
mitochondrial biogenesis in rats with HFD-induced NASH using
information on mtDNA copy number. HFD feeding induced a significant
decrease (P<0.05) in mtDNA copy number, which was reflected in
the ratio of ND1 DNA to actin DNA in the liver (Fig. 2).
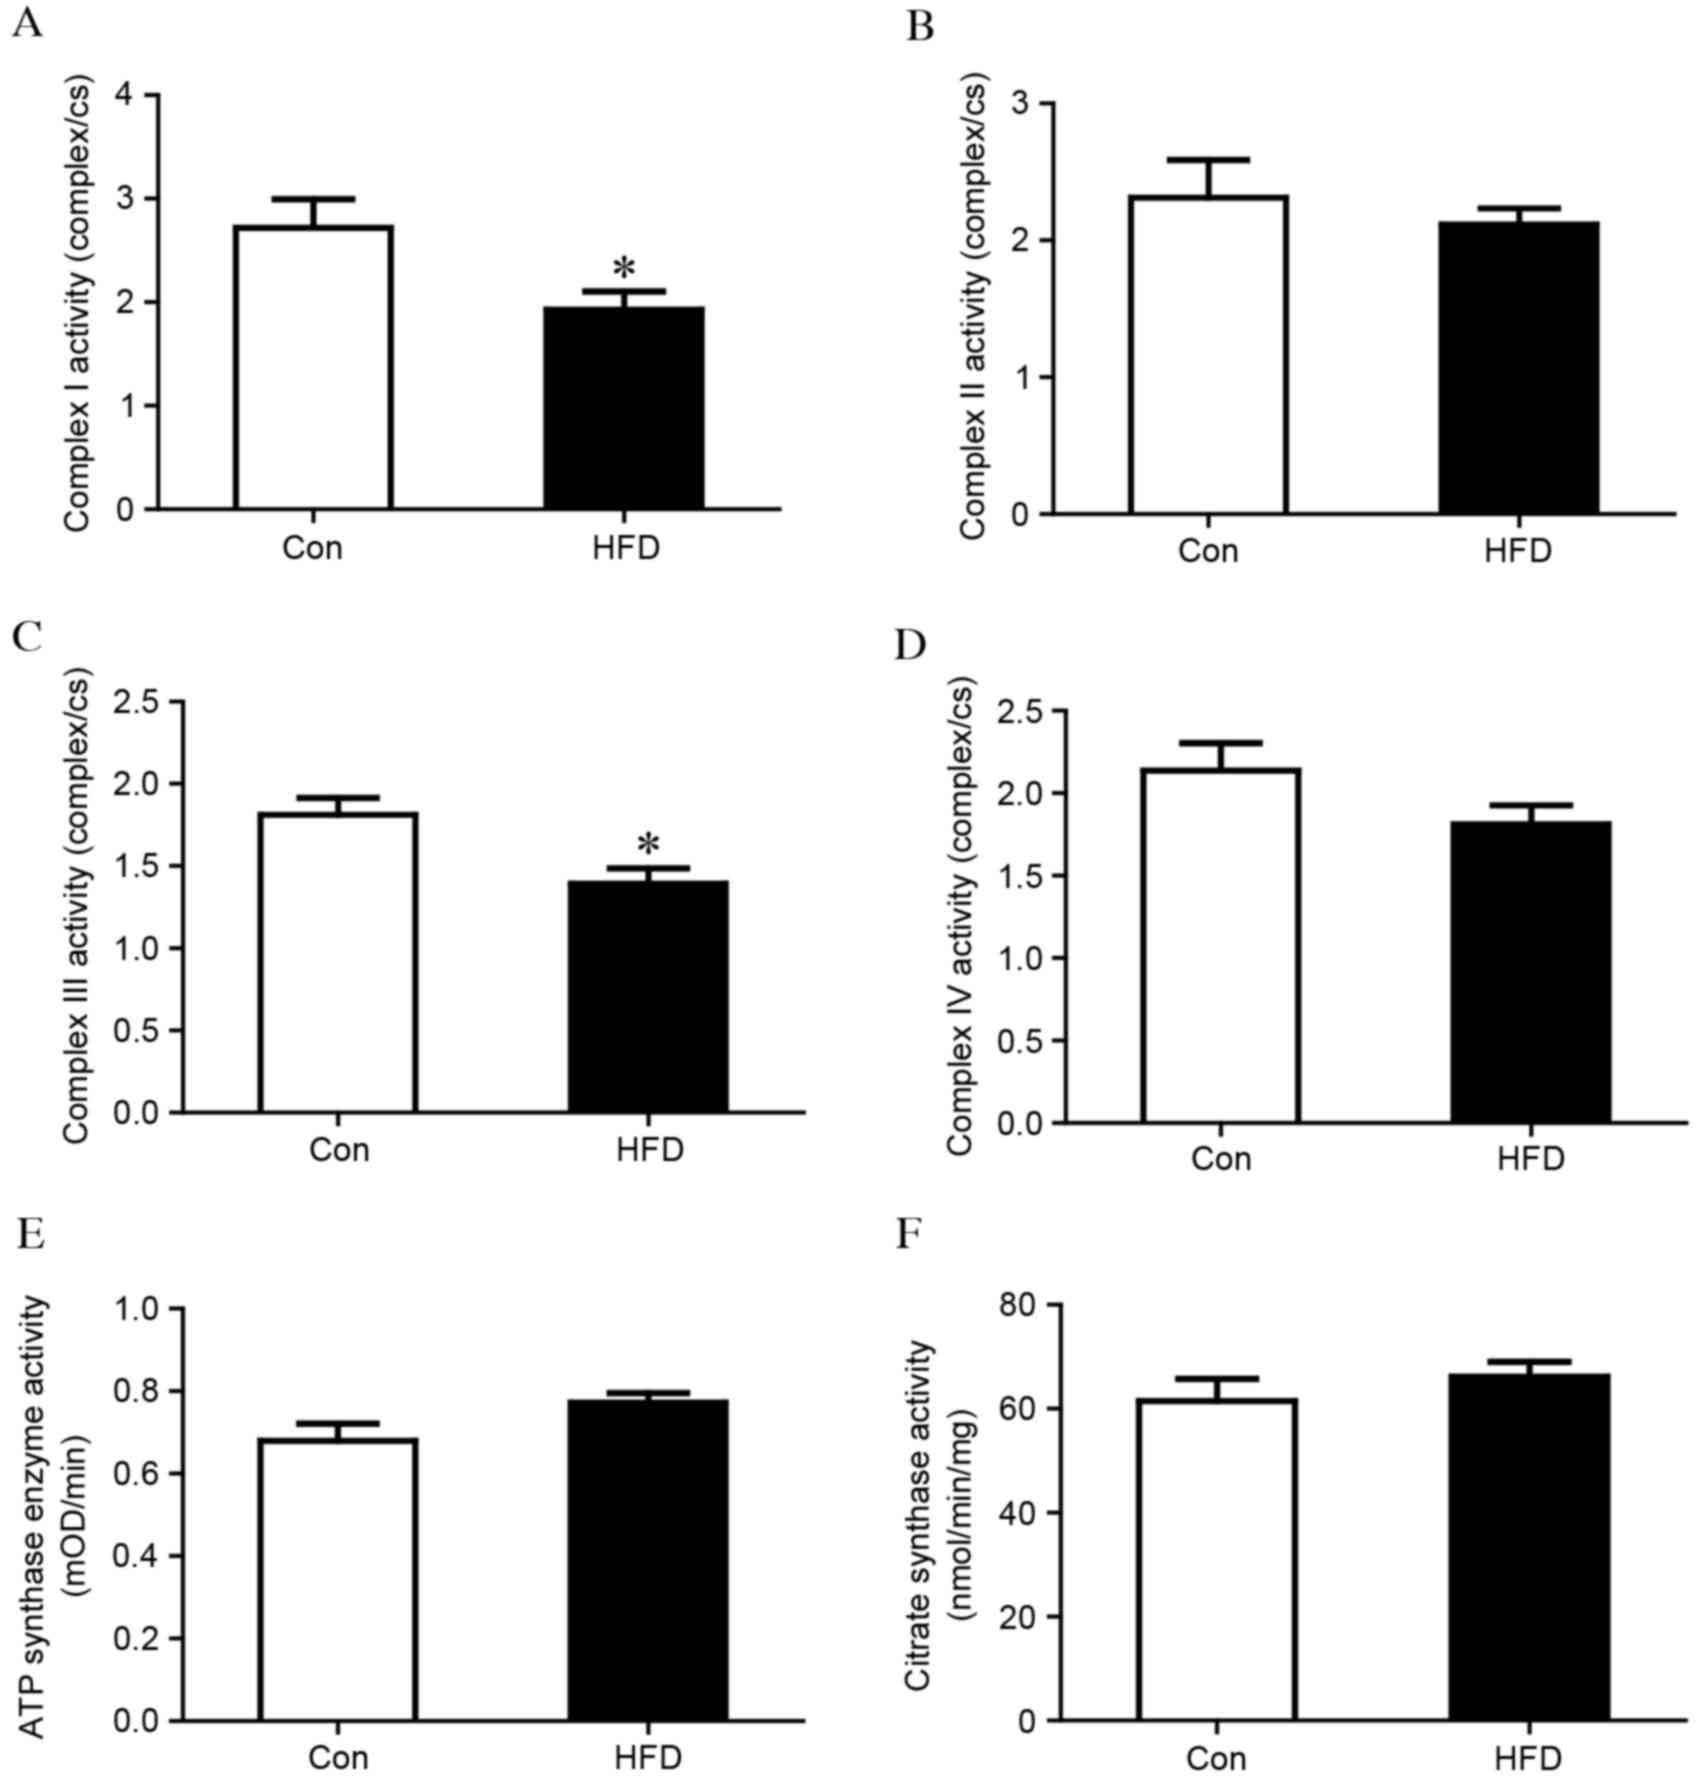
Evaluation of MRC and MMP
As MRCs are pivotal in the generation of energy by
oxidative phosphorylation, the present study measured whether the
activity of the MRC was affected in the liver tissues of the HFD
group. As shown in Fig. 3A, the
activity of complex I was significantly reduced in the HFD group,
compared with that in the control group (complex I/CS, 1.93±0.56
vs. 2.72±0.67; P<0.05). No difference was observed in complex II
(Fig. 3B), however, the activity
of complex III was also significantly lower in the HFD group,
compared with that in the control group (complex III/CS, 1.39±0.29
vs. 1.81±0.24; P<0.05), as shown in Fig. 3C. No significant differences were
observed in complex IV or ATP synthase (Fig. 3D and E). Citrate synthase is
usually regarded as a quantitative marker enzyme for the content of
intact mitochondria, and no significant change was detected between
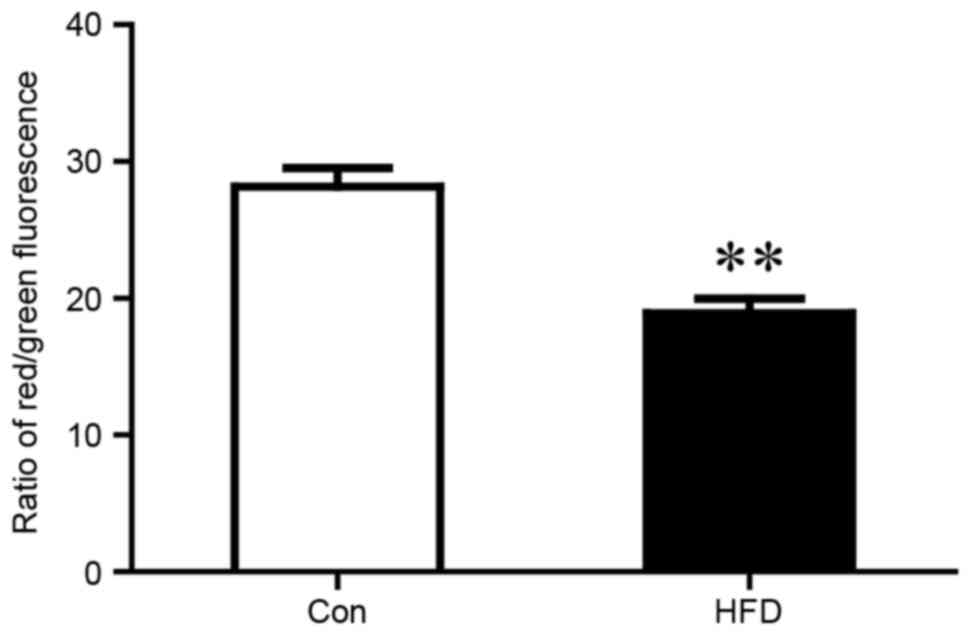
the HFD group and the control group (Fig. 3F). HFD chow also led to loss of
MMP, which was associated with mitochondrial dysfunction (Fig. 4).
Mitochondrial proteomic profiling
analysis
In order to fully understand the pivotal role of
mitochondria dysfunction in NASH, the present study measured the
mitochondrial protein profiles of the liver from the HFD group
model using iTRAQ labeling technology. A total of 61 significantly
differentially expressed proteins were identified and were
synchronous with the comparisons of liver mitochondrial samples
isolated from the control and HFD groups. Compared with the control
group, 30 upregulated proteins with a fold change >1.0 and 31
downregulated proteins with a fold change <1.0 were observed in
the HFD group, subsequently, 18 upregulated (Table III) with a fold change >1.2
and 13 downregulated proteins (Table
IV) with a fold change ≤0.8 were selected. The biological
processes were found to be associated with dysregulated proteins
using the GO database. Of note, the majority of these
differentially expressed proteins were closely involved, including
mitochondrial oxidative phosphorylation, lipid metabolic process,
acyl-CoA metabolic process and fatty acid β-oxidation (Table V). In the HFD group, proteins
involved in mitochondrial oxidative phosphorylation were almost
unanimously downregulated, compared with the control group. Among
the dysregulated proteins, seven decreased proteins, including
Ndufc2, Ndufs6, Ndufb3, Ndufa2, Ndufa5, Ndufb5 and NADH-ubiquinone
oxidoreductase chain 5 (ND5), were component parts of mitochondrial
complex II and the decreased proteins, ubiquinol-cytochrome c
reductase, complex III subunit X (UQCR10) and cytochrome B (CytB)
were the subunits of mitochondrial complex III. In the inner
mitochondrial membrane, these proteins form the middle segment of
the respiratory chain. The decrease in these proteins coincided
with the significant decline in the activities of complexes I and
III (Fig. 3A and B). These
proteomics may provide novel insights into pathogenesis of NASH,
although further functional investigations are required to specify
proteins.
| Table III.Identification of 18 mitochondrial
proteins upregulated in the high fat and high cholesterol diet
group, compared with the control group, using isobaric tags for
relative and absolute quantitation labeling technology. |
Table III.
Identification of 18 mitochondrial
proteins upregulated in the high fat and high cholesterol diet
group, compared with the control group, using isobaric tags for
relative and absolute quantitation labeling technology.
| Accession no. | Protein name | Gene name | Fold change |
|---|
|
tr|Q5U2U5|Q5U2U5_RAT | Perilipin 2 | Plin2 | 3.61 |
|
sp|O70490|ACSM2_RAT | Acyl-coenzyme A
synthetase | ACSM2 | 2.02 |
|
sp|P61354|RL27_RAT | 60S ribosomal
protein L27 | Rpl27 | 1.94 |
|
sp|Q5EB77|RAB18_RAT | Ras-related protein
Rab-18 | Rab18 | 1.90 |
|
tr|D3ZSY4|D3ZSY4_RAT | Eosinophil
peroxidase | Epx | 1.68 |
|
tr|F1LRE2|F1LRE2_RAT | Insulin-like growth
factor-binding protein complex acid labile subunit | Igfals | 1.68 |
|
sp|P55159|PON1_RAT | Serum
paraoxonase/arylesterase 1 | Pon1 | 1.64 |
|
sp|P11915|NLTP_RAT | Non-specific
lipid-transfer protein | Scp2 | 1.47 |
|
sp|P07687|HYEP_RAT | Epoxide hydrolase
1 | Ephx1 | 1.45 |
|
sp|P07871|THIKB_RAT | 3-ketoacyl-CoA
thiolase B | Acaa1b | 1.44 |
|
tr|G3V743|G3V743_RAT | Glucosidase 1 | Mogs | 1.35 |
|
sp|Q5BJY9|K1C18_RAT | Keratin, type I
cytoskeletal 18 | Krt18 | 1.32 |
|
tr|D4ABM5|D4ABM5_RAT | Mitochondrial
ribosomal protein S34 | Mrps34 | 1.31 |
|
sp|Q4FZX5|MSRB2_RAT |
Methionine-R-sulfoxide reductase B2 | Msrb2 | 1.30 |
|
sp|P63095|GNAS2_RAT | Guanine
nucleotide-binding protein G(s) subunit α isoforms | Gnas | 1.27 |
|
sp|P41034|TTPA_RAT | α-tocopherol
transfer protein | Ttpa | 1.25 |
|
sp|Q5U3Z3|ISOC2_RAT | Isochorismatase
domain-containing protein 2 | Isoc2 | 1.24 |
|
tr|F6Q5K7|F6Q5K7_RAT | Mitochondrial
ribosomal protein S18B | Mrps18b | 1.22 |
| Table IV.Identification of 13 mitochondrial
proteins downregulated in the high fat and high cholesterol diet
group, compared with the control group, using isobaric tags for
relative and absolute quantitation labeling technology. |
Table IV.
Identification of 13 mitochondrial
proteins downregulated in the high fat and high cholesterol diet
group, compared with the control group, using isobaric tags for
relative and absolute quantitation labeling technology.
| Accession no. | Protein name | Gene name | Fold change |
|---|
|
tr|F1LMQ2|F1LMQ2_RAT | Farnesyl
pyrophosphate synthase | FPPS | 0.46 |
|
sp|O35760|IDI1_RAT |
Isopentenyl-diphosphate δ-isomerase 1 | Idi1 | 0.47 |
|
tr|Q5PQZ9|Q5PQZ9_RAT | NADH dehydrogenase
[ubiquinone] 1 subunit C2 | Ndufc2 | 0.64 |
|
sp|P11951|CX6C2_RAT | Cytochrome c
oxidase subunit 6C-2 | Cox6c2 | 0.64 |
|
tr|B2RYX1|B2RYX1_RAT | Cytochrome b-c1
complex subunit 9 | Uqcr10 | 0.65 |
|
tr|D3ZCZ9|D3ZCZ9_RAT | NADH dehydrogenase
[ubiquinone] iron-sulfur protein 6 | Ndufs6 | 0.65 |
|
sp|Q63362|NDUA5_RAT | NADH dehydrogenase
[ubiquinone] 1α subcomplex subunit 5 | Ndufa5 | 0.66 |
|
tr|D4A4P3|D4A4P3_RAT | NADH dehydrogenase
[ubiquinone] 1β subcomplex subunit 3 | Ndufb3 | 0.69 |
|
tr|B0M1Q8|B0M1Q8_RAT | Cytochrome b | CytB | 0.72 |
|
tr|D3ZS58|D3ZS58_RAT | NADH dehydrogenase
[ubiquinone] 1α subcomplex subunit 2 | Ndufa2 | 0.72 |
|
tr|D4A565|D4A565_RAT | NADH dehydrogenase
(ubiquinone) 1β subcomplex, 5 | Ndufb5 | 0.72 |
|
tr|Q06QA1|Q06QA1_RAT | NADH-ubiquinone
oxidoreductase chain 5 | ND5 | 0.76 |
|
sp|Q6PCT8|DHSD_RAT | Succinate
dehydrogenase [ubiquinone] cytochrome b small subunit | Sdhd | 0.80 |
| Table V.Dysregulated proteins involved in
biological processes, according to the Gene Ontology database. |
Table V.
Dysregulated proteins involved in
biological processes, according to the Gene Ontology database.
| Biological
process | Change in
expression |
|---|
| Mitochondrial
oxidative phosphorylation |
|
| NADH
dehydrogenase [ubiquinone] 1 subunit C2 | Downregulated |
| NADH
dehydrogenase [ubiquinone] iron-sulfur protein 6 | Downregulated |
| NADH
dehydrogenase [ubiquinone] 1β subcomplex subunit 3 | Downregulated |
| NADH
dehydrogenase [ubiquinone] 1α subcomplex subunit 2 | Downregulated |
|
NADH-ubiquinone oxidoreductase
chain 5 | Downregulated |
| NADH
dehydrogenase [ubiquinone] 1α subcomplex subunit 5 | Downregulated |
|
Succinate dehydrogenase
[ubiquinone] cytochrome b small subunit | Downregulated |
|
Cytochrome b | Downregulated |
|
Cytochrome b-c1 complex
subunit 9 | Downregulated |
| Lipid metabolic
process |
|
|
Perilipin2 | Upregulated |
|
Acyl-coenzyme A
synthetase | Upregulated |
|
Arylsulfatase B | Upregulated |
|
Estradiol 17-β-dehydrogenase
11 | Upregulated |
|
Non-specific lipid-transfer
protein | Upregulated |
|
3-ketoacyl-CoA thiolase B | Upregulated |
|
Farnesyl pyrophosphate
synthase | Downregulated |
|
Isopentenyl-diphosphate
δ-isomerase 1 | Downregulated |
|
Cytochrome P450 2D18 | Downregulated |
|
Acyl-CoA-binding protein | Downregulated |
| Acyl-CoA metabolic
process |
|
|
Acyl-coenzyme A
synthetase | Upregulated |
|
Non-specific lipid-transfer
protein | Upregulated |
|
Acyl-CoA-binding protein | Downregulated |
|
α-aminoadipic semialdehyde
synthase | Downregulated |
| Fatty acid
β-oxidation |
|
|
Non-specific lipid-transfer
protein | Upregulated |
|
3-ketoacyl-CoA thiolase B | Upregulated |
Western blot analysis
The western blot analysis confirmed the
differentially expressed proteins identified using iTRAQ
technology. For the analysis, four proteins of interested were
selected (Ndufa5, CytB, ATP5A and TFAM). Voltage-dependent
anion-selective channel 1 (VDAC1) was used as the loading control.
The expression levels of Ndufa5 and CytB were significantly
decreased in the HFD group, compared with the control group,
whereas no significant differences were observed in the levels of
TFAM and ATP5A between the HFD group and control group. These
findings were in accordance with the results obtained using iTRAQ
technology (Fig. 5).
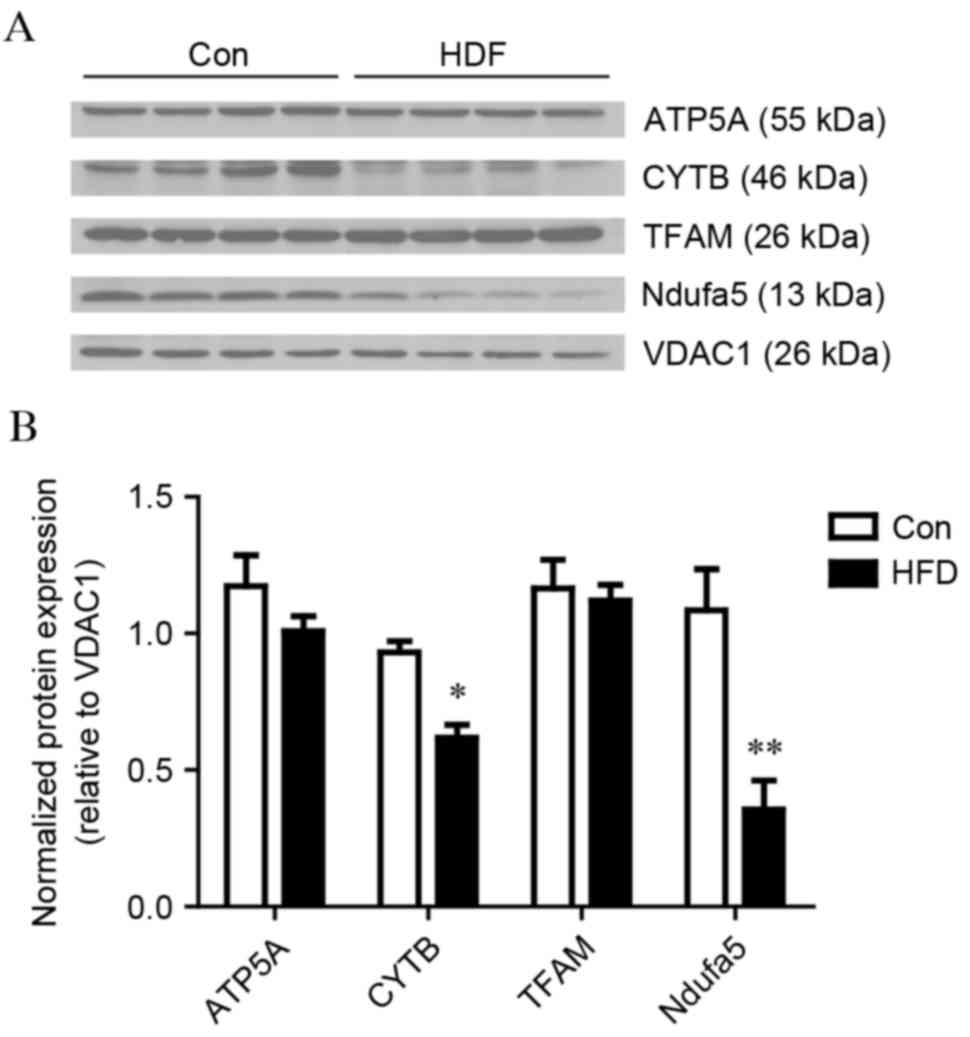 | Figure 5.Western blot analysis validation of
mitochondrial proteins. Liver mitochondrial expression levels of
ATP5A, CytB, TFAM and Ndufa5 between the Con and HFD groups.
VDAC1 was used as a loading control. (A) Images of the
western blots from four biological replicates. (B) Bar graphs of
the results of the western blot analysis. The values are presented
as the mean ± standard deviation. *P<0.05 and **P<0.01, vs.
Con group. HFD, high fat and high cholesterol diet; Con, control;
ATP5A, ATP synthase α subunit; CYTB, cytochrome b; TFAM,
transcription factor A, mitochondrial; Ndufa5, NADH dehydrogenase
[ubiquinone] 1α subcomplex subunit 5; VDAC1,
voltage-dependent anion-selective channel 1. |
Discussion
NASH is considered to be important in the
progression of NAFLD, which can progress into cirrhosis and
subacute liver failure (1).
However, the primary underlying mechanism contributing to the
pathogenesis of NASH remains to be fully elucidated. The principal
function of the mitochondria is to provide energy to maintain
several cell functions. Previous studies have linked mitochondrial
dysfunction and oxidative stress to the pathogenesis of NASH
(7). Furthermore, mitochondrial
structural abnormalities and decreased activity of MRCs have been
reported in the livers of patients with NASH (13). In the present study, comprehensive
analysis of liver mitochondrial proteomics was performed to provide
a novel perspective for the pathophysiology of the condition.
In the proteomic analysis, a number of proteins
involved in mitochondrial oxidative phosphorylation and the
metabolism of lipids were significantly dysregulated, which may
have contributed to the progression of NASH. For example, proteins
in MRC complexes decreased significantly, including Ndufc2, Ndufs6,
Ndufb3, Ndufa2, Ndufa5, Ndufb5, ND5 (complex I), Sdhd
(complex II), Cox6c2, Uqcr10 and CytB (complex III). Ndufc2 is one
of the accessory subunits of complex I. The downregulation of
Ndufc2 can decrease MMP and interfere with complex I integrity
(13). The expression of Ndufb3
and Ndufb5, which are members of mitochondrial complex I, can be
decreased by HFD, resulting in the dysfunction of mitochondrial
oxidative phosphorylation in skeletal muscle (14). Ndufa5 localizes to the inner
mitochondrial membrane, and its expression is reduced in the brains
of patients with autism and in ischemic heart failure (15,16),
involving organs with high energy demand. The expression levels of
ND5- and cytochrome b-encoded mtDNA were decreased,
which can be correlated with mtDNA depletion. The changes of 10
proteins in the mitochondrial complex was consistent with decreased
activities of complex II and III. However, the downregulation of
Sdhd did not decrease the activity of complex II. Mitochondria
complex I is critical in transferring electrons to ubiquinone.
Complex I deficiency has been reported in several diseases,
including heart failure, myopathies, encephalomyopathies and
neurodegenerative disorders (17,18).
Furthermore, complex I and III are two sites of ROS generation in
cells (19). It is well
established that the administration of a HFD in rats leads to the
profound modification of mitochondrial lipid composition, causes
the inhibition of fatty acid oxidation and the generation of
mitochondrial ROS (20). In terms
of MRC activity, ROS are overproduced following any significant
reduction, which triggers oxidative stress (7). ROS has been implicated in the hepatic
tissue injury associated with NASH (5). The depletion of mtDNA in the HFD
group may be associated with ROS, which leads to the degradation of
mtDNA nucleases. Complex I abnormality may result in increasing ROS
production, and ROS conversely affects the activity of
mitochondrial complex I through the oxidative damage of cardiolipin
(21), which can exacerbate
oxidative stress and potentially contribute to the pathogenesis of
NASH. In the present study, the decrease in components of complex I
and III were expected to decrease complex activity with increasing
ROS, which may be relevant to the decrease of MMP and be involved
in the progression of NASH.
The present study also found several dysregulated
proteins associated with preventing the progression of NASH.
Non-specific lipid transfer protein (Scp2) is located in the
cytoplasm and mitochondria (22).
It has high affinity to several lipid species, including fatty
acid, fatty acyl CoAs, lysophosphatidic acid, and
phosphatidylinositol, and is also involved in the mitochondrial
oxidation of cholesterol in cells (23). Tumor necrosis factor and Fas,
released by mitochondrial-free cholesterol, also induces NASH
(24). Therefore, the upregulation
of Scp2 may be a protective response to excess lipids in NASH.
Medium-chain length fatty acids and xenobiotic carboxylic acids
were catalyzed by the upregulation of acyl CoA synthetase (ACSM2)
in the HFD group. In the liver, the decreased expression of ACSM2
can lead to an increase of free medium-chain fatty acids. Following
treatment with medium-chain fatty acids, the protein level of the
transcription factor, SREBP-1, is reduced and has a contrasting
reaction to that of insulin in primary chicken hepatocytes
(25). NASH is associated with
insulin resistance, including lipolysis increase, free fatty acid
delivery and hepatic fatty acid β oxidation, which lead to an
increase in oxidative stress (6).
Therefore, ACSM2 may indirectly enhance insulin function in
hepatocytes, which may be a protective response to insulin
resistance in the liver. However, the specific generating process
requires further investigation.
Among the downregulated proteins, farnesyl
pyrophosphate synthase and Isopentenyl-diphosphate δ-isomerase 1
are two enzymes of the mevalonate pathway, which catalyzes the
synthesis of farnesyl pyrophosphate (FPP) in mitochondria (26). As with ubiquinones in the electron
transport chain, mitochondrial isoprenoids are synthesized by FPP.
However, the detailed association between FPP and the development
of NASH remains to be fully elucidated.
In conclusion, the present study reports the protein
profiling in NASH liver mitochondria using iTRAQ technology to
perform detailed analysis of the pathogenesis of NASH for the first
time. The results revealed 31 differentially expressed proteins in
the NASH rat model, compared with the control rats. The
dysregulation of proteins in NASH were predominantly associated
with the MRC and lipid metabolic process. However, these proteins
require further investigation for elucidating the molecular
mechanism underlying the pathogenesis of NASH.
Acknowledgements
The present study was supported by a grant from the
National Basic Research Program of China (grant no.
2013CB531702).
Glossary
Abbreviations
Abbreviations:
|
NASH
|
nonalcoholic steatohepatitis
|
|
HFD
|
high fat and high cholesterol diet
|
|
iTRAQ
|
isobaric tags for relative and
absolute quantitation
|
|
2D LC-MS/MS
|
two-dimensional liquid
chromatography-tandem mass spectrometry
|
|
KEGG
|
Kyoto Encyclopedia of Genes and
Genomes
|
|
NAFLD
|
nonalcoholic fatty liver disease
|
|
HCC
|
hepatocellar carcinoma
|
|
ROS
|
reactive oxygen species
|
|
ATP
|
adenosine triphosphate
|
|
SCD
|
standard chow diet
|
|
TC
|
total cholesterol
|
|
TG
|
triglyceride
|
|
LDL-C
|
low-density lipoprotein
|
|
HDL-C
|
high-density lipoprotein
|
|
H&E
|
hematoxylin and eosin
|
|
RT-qPCR
|
reverse transcription-quantitative
polymerase chain reaction
|
|
NADH
|
ubiquinone oxidoreductase
|
|
CS
|
citrate synthase
|
|
MMP
|
mitochondrial membrane potential
|
|
mtDNA
|
mitochondrial DNA
|
|
MRC
|
mitochondrial respiratory complex
|
|
ACSM2
|
acyl CoA synthetase
|
|
FPP
|
farnesyl pyrophosphate
|
References
|
1
|
Melin Patrick AJ, Kalinski MI, Kelly KR,
Haus JM, Solomon TP and Kirwan JP: Nonalcoholic fatty liver
disease: Biochemical and therapeutic considerations. Ukr Biokhim Zh
(1999). 81:16–25. 2009.PubMed/NCBI
|
|
2
|
Masuoka HC and Chalasani N: Nonalcoholic
fatty liver disease: An emerging threat to obese and diabetic
individuals. Ann N Y Acad Sci. 1281:106–122. 2013. View Article : Google Scholar : PubMed/NCBI
|
|
3
|
Day CP and James OF: Steatohepatitis: A
tale of two ‘hits’? Gastroenterology. 114:842–845. 1998. View Article : Google Scholar : PubMed/NCBI
|
|
4
|
Day CP: From fat to inflammation.
Gastroenterology. 130:207–210. 2006. View Article : Google Scholar : PubMed/NCBI
|
|
5
|
Pessayre D and Fromenty B: NASH: A
mitochondrial disease. J Hepatol. 42:928–940. 2005. View Article : Google Scholar : PubMed/NCBI
|
|
6
|
Sanyal AJ, Sargent Campbell C, Mirshahi F,
Rizzo WB, Contos MJ, Sterling RK, Luketic VA, Shiffman ML and Clore
JN: Nonalcoholic steatohepatitis: Association of insulin resistance
and mitochondrial abnormalities. Gastroenterology. 120:1183–1192.
2001. View Article : Google Scholar : PubMed/NCBI
|
|
7
|
Begriche K, Igoudjil A, Pessayre D and
Fromenty B: Mitochondrial dysfunction in NASH: Causes, consequences
and possible means to prevent it. Mitochondrion. 6:1–28. 2006.
View Article : Google Scholar : PubMed/NCBI
|
|
8
|
Anstee QM and Goldin RD: Mouse models in
non-alcoholic fatty liver disease and steatohepatitis research. Int
J Exp Pathol. 87:1–16. 2006. View Article : Google Scholar : PubMed/NCBI
|
|
9
|
Ye H, Sun L, Huang X, Zhang P and Zhao X:
A proteomic approach for plasma biomarker discovery with 8-plex
iTRAQ labeling and SCX-LC-MS/MS. Mol Cell Biochem. 343:91–99. 2010.
View Article : Google Scholar : PubMed/NCBI
|
|
10
|
Pallotti F and Lenaz G: Isolation and
subfractionation of mitochondria from animal cells and tissue
culture lines. Methods Cell Biol. 80:3–44. 2007. View Article : Google Scholar : PubMed/NCBI
|
|
11
|
Livak KJ and Schmittgen TD: Analysis of
relative gene expression data using real-time quantitative PCR and
the 2(−Delta Delta C(T)) method. Methods. 25:402–408. 2001.
View Article : Google Scholar : PubMed/NCBI
|
|
12
|
Wieckowski MR, Giorgi C, Lebiedzinska M,
Duszynski J and Pinton P: Isolation of mitochondria-associated
membranes and mitochondria from animal tissues and cells. Nat
Protoc. 4:1582–1590. 2009. View Article : Google Scholar : PubMed/NCBI
|
|
13
|
Carreras M Pérez, Del Hoyo P, Martin MA,
Rubio JC, Martin A, Castellano G, Colina F, Arenas J and Herruzo
Solis JA: Defective hepatic mitochondrial respiratory chain in
patients with nonalcoholic steatohepatitis. Hepatology.
38:999–1007. 2003. View Article : Google Scholar : PubMed/NCBI
|
|
14
|
Sparks LM, Xie H, Koza RA, Mynatt R,
Hulver MW, Bray GA and Smith SR: A high-fat diet coordinately
downregulates genes required for mitochondrial oxidative
phosphorylation in skeletal muscle. Diabetes. 54:1926–1933. 2005.
View Article : Google Scholar : PubMed/NCBI
|
|
15
|
Anitha A, Nakamura K, Thanseem I,
Matsuzaki H, Miyachi T, Tsujii M, Iwata Y, Suzuki K, Sugiyama T and
Mori N: Downregulation of the expression of mitochondrial electron
transport complex genes in autism brains. Brain Pathol. 23:294–302.
2013. View Article : Google Scholar : PubMed/NCBI
|
|
16
|
Liu T, Chen L, Kim E, Tran D, Phinney BS
and Knowlton AA: Mitochondrial proteome remodeling in ischemic
heart failure. Life Sci. 101:27–36. 2014. View Article : Google Scholar : PubMed/NCBI
|
|
17
|
Kang PT, Chen CL, Ren P, Guarini G and
Chen YR: BCNU-induced gR2 defect mediates S-glutathionylation of
Complex I and respiratory uncoupling in myocardium. Biochem
Pharmacol. 89:490–502. 2014. View Article : Google Scholar : PubMed/NCBI
|
|
18
|
Finsterer J, Rauschka H, Segal L, Kovacs
GG and Rolinski B: Affection of the respiratory muscles in combined
complex I and IV deficiency. Open Neurol J. 11:1–6. 2017.
View Article : Google Scholar : PubMed/NCBI
|
|
19
|
Murphy MP: How mitochondria produce
reactive oxygen species. Biochem J. 417:1–13. 2009. View Article : Google Scholar : PubMed/NCBI
|
|
20
|
Vial G, Dubouchaud H, Couturier K,
Rousselle Cottet C, Taleux N, Athias A, Galinier A, Casteilla L and
Leverve XM: Effects of a high-fat diet on energy metabolism and ROS
production in rat liver. J Hepatol. 54:348–356. 2011. View Article : Google Scholar : PubMed/NCBI
|
|
21
|
Paradies G, Petrosillo G, Pistolese M and
Ruggiero FM: Reactive oxygen species affect mitochondrial electron
transport complex I activity through oxidative cardiolipin damage.
Gene. 286:135–141. 2002. View Article : Google Scholar : PubMed/NCBI
|
|
22
|
Gallegos AM, Atshaves BP, Storey SM,
Starodub O, Petrescu AD, Huang H, McIntosh AL, Martin GG, Chao H,
Kier AB and Schroeder F: Gene structure, intracellular
localization, and functional roles of sterol carrier protein-2.
Prog Lipid Res. 40:498–563. 2001. View Article : Google Scholar : PubMed/NCBI
|
|
23
|
Schroeder F, Atshaves BP, McIntosh AL,
Gallegos AM, Storey SM, Parr RD, Jefferson JR, Ball JM and Kier AB:
Sterol carrier protein-2: New roles in regulating lipid rafts and
signaling. Biochim Biophys Acta. 1771:700–718. 2007. View Article : Google Scholar : PubMed/NCBI
|
|
24
|
Mari M, Caballero F, Colell A, Morales A,
Caballeria J, Fernandez A, Enrich C, Checa Fernandez JC and Ruiz
Garcia C: Mitochondrial free cholesterol loading sensitizes to TNF-
and Fas-mediated steatohepatitis. Cell Metab. 4:185–198. 2006.
View Article : Google Scholar : PubMed/NCBI
|
|
25
|
Zhang Y, Yin L and Hillgartner FB: SREBP-1
integrates the actions of thyroid hormone, insulin, cAMP, and
medium-chain fatty acids on ACCalpha transcription in hepatocytes.
J Lipid Res. 44:356–368. 2003. View Article : Google Scholar : PubMed/NCBI
|
|
26
|
Martin D, Piulachs MD, Cunillera N, Ferrer
A and Bellés X: Mitochondrial targeting of farnesyl diphosphate
synthase is a widespread phenomenon in eukaryotes. Biochim Biophys
Acta. 1773:419–426. 2007. View Article : Google Scholar : PubMed/NCBI
|