Introduction
Chronic kidney disease is increasing worldwide at an
annual rate of 8%, with the prevalence higher in developing
countries (1). Diabetic
nephropathy (DN) is a common underlying cause (2). DN is one of the most common
microvascular complications of type 1 and type 2 diabetes mellitus
(3), and is characterized by
persistent proteinuria, progressive loss of renal function and
morphological alterations, including glomerular hypertrophy,
mesangial expansion, glomerular basement membrane thickening and
interstitial fibrosis (4).
Although metabolic and hemodynamic alterations, inflammation and
activation of the renin-angiotensin system are involved in the
pathogenesis of DN, the precise cause remains unclear. Emerging
evidence suggests that oxidative stress serves a crucial role in
the occurrence and development of DN (5).
The nuclear factor erythroid 2-related factor 2
(Nrf2) signaling pathway is a crucial cytoprotective regulator in
mammalian cells in response to endogenous and exogenous stress
(6). Under physiological
conditions, Nrf2 is inactivated by its inhibitory cytosolic
protein, Kelch-like ECH-associated protein 1 (Keap1). When cells
are exposed to redox modulators, Nrf2 is released from Keap1 and
translocates into the nucleus (7).
Nrf2, which binds to antioxidant response elements in the nucleus,
regulates the transcription of antioxidant genes, including heme
oxygenase 1 (HO-1) and NAD(P)H:quinone oxidoreductase 1 (NQO1). The
induction of HO-1 and NQO1 has been considered to be adaptive
cellular responses to oxidative stress (8).
Oxidative stress is defined as a disturbance in the
balance between the production of reactive oxygen species (ROS) and
antioxidant defenses (9). Diabetes
may increase ROS production through a variety of pathways,
including strengthening the autoxidation of glucose and increasing
the formation of superoxides and advanced glycation end products
(10). Excess amounts of ROS
induce the activation of various transcription factors that
increase the synthesis of extracellular matrix (ECM) and renal
fibrosis, eventually leading to end-stage renal disease (11). A previous study demonstrated that
renal fibrosis is one of the main pathological alterations in DN
(12). Another report suggested
that excess ROS may upregulate transforming growth factor-β (TGF-β)
expression, which leads to over-production of ECM, thickening of
the glomerular basement membrane and renal fibrosis (13). Therefore, the TGF-β family is
considered an important pro-fibrotic mediator in fibrotic diseases
(14).
Genistein (GEN) is a major isoflavone in soybeans
that interacts with estrogen receptors in vivo and is a
phytoestrogen (15). GEN has
attracted considerable attention in previous years owing to its
reported beneficial health effects, such as the prevention of a
number of chronic diseases, including osteoporosis, cardiovascular
diseases, diabetes and cancer (16–19).
Previous studies have demonstrated that GEN has anti-inflammatory,
anti-oxidative, anti-apoptotic and anti-proliferative effects
(20–22). Our previous study demonstrated that
GEN attenuated myocardial fibrosis in rats with streptozotocin
(STZ)-induced type 1 DM (T1DM) by inhibiting the overexpression of
collagen I and collagen III, and by suppressing the TGF-β/mothers
against decapentaplegic homolog 3 (Smad3) pathway (23). A recent study demonstrated that GEN
reduces renal ischemia/reperfusion-induced cell death by inhibiting
apoptosis (24). In addition, in
high fructose-fed rats, GEN significantly inhibited the production
of inflammatory cytokines and reduced the deposition of collagen in
renal tissue (13).
Although the positive effects of GEN on renal
function are well known, the effects of GEN on renal fibrosis in
T1DM remain unclear. Therefore the present study aimed to
investigate whether GEN exerts an antifibrogenic effect on T1DM
kidney and to determine its associated mechanism.
Materials and methods
Animals
A total of 24 male Sprague-Dawley rats (age, 6–7
weeks; weight, 160–200 g) were obtained from the Animal
Administration Center of Bengbu Medical College (Bengbu, China).
The rats were housed in conventional animal facility with a 12-h
light/dark cycle at a constant temperature of 21–23°C and 50–60%
relative humidity. All the rats were fed with normal laboratory
rodent diet and water ad libitum. The present study was
approved by the Animal Ethics Committee of Bengbu Medical
College.
Study design
Rats were randomized into four groups (n=6
rats/group): i) Normal control group (N); ii) STZ group (S); iii)
STZ + low-dose GEN group (L); and iv) STZ + high-dose GEN group
(H). T1DM was induced as previously described (18). Briefly, rats were deprived of food
but had free access to water for 12 h, and subsequently received a
single intraperitoneal (i.p.) injection of STZ (55 mg/kg body
weight; Sigma-Aldrich, Merck KGaA, Darmstadt, Germany) freshly
dissolved in 0.1 mol/l citrate buffer. Rats in the N group received
an i.p. injection of a similar volume of citrate buffer. Rats with
fasting blood glucose (FBG) level >16.7 mmol/l (3 days
post-injection) indicated successful establishment of the T1DM
model. From the fifth week following model establishment, rats in
groups L and H received a daily gavage with 5 and 25 mg/kg GEN
(Sigma-Aldrich; Merck KGaA) freshly dissolved in
carboxymethylcellulose sodium (CMC-Na) solution (Sangon Biotech,
Co., Ltd., Shanghai, China), respectively, up to the end of the
week 8. Rats in groups N and S were received a daily gavage with a
similar volume of CMC-Na solution over the same time period.
Determination of FBG, 24-h urine
protein, blood urea nitrogen (BUN) and serum creatinine (SCr)
levels
At 8 weeks post-induction, the rats were placed in
metabolic cages for 24-h urine collection and consequent
albuminuria measurement prior to being anesthetized with chloral
hydrate (400 mg/kg; i.p.). Blood was obtained from the tail vein to
measure FBG using a portable glucometer (Accu-Chek, Roche,
Mannheim, Germany). Then, 4 ml blood from abdominal aorta was
collected. The fresh blood was placed in serum tubes and
centrifuged at 765 × g for 20 min at 4°C. The serum was collected
and the levels of 24-h urine protein, BUN and SCr were measured
using a Urine Protein Test Kit (cat. no. C035-2), Urea Assay Kit
(cat. no. C013-2) and Creatinine Assay Kit (cat. no. C011-2;
Jiancheng Bioengineering Institute, Nanjing, Jiangsu, China)
according to the manufacturer's protocols.
Detection of body weight (BW), kidney
weight (KW) and renal index
Rats were sacrificed and their bilateral kidneys
were excised and placed in ice-cold normal saline, and the ratio of
kidney weight to body weight (renal index) was calculated.
Determination of total antioxidant
capacity (T-AOC), superoxide dismutase (SOD), lipid peroxidation
(LPO), malondialdehyde (MDA) and hydroxyproline (Hyp) levels
Renal tissue (0.1 g) was homogenized in 0.9 ml
normal saline. The supernatant fluid was collected following
centrifugation for 20 min (825 × g at 4°C). Following measurement
of the protein concentration using a Bicinchoninic Acid (BCA)
Protein Assay kit (cat. no. P0010; Beyotime Institute of
Biotechnology, Shanghai, China), the renal T-AOC, SOD, LPO, MDA and
Hyp levels were measured according to the protocols of Total
Antioxidant Capacity Assay kit (cat. no. A015-2), Total Superoxide
Dismutase Assay kit (cat. no. A001-1-1), Lipid Peroxidation Assay
kit (cat. no. A106), Malondialdehyde Assay kit (cat. no. A003-1)
and Hydroxyproline Assay kit (cat. no. A030-3; Nanjing Jiancheng
Bioengineering Institute, Nanjing, China).
Histological examination
For histological analysis, fresh left renal tissue
collected from each group was fixed using 4% paraformaldehyde for
12 h at 4°C. Tissues were embedded in paraffin, cut into 5-µm thick
section and stained using hematoxylin for 5 min and 0.5% eosin for
2 min (H&E) at room temperature. For Masson's trichrome
staining, paraffin sections were dewaxed with xylene, rehydrated
with graded ethanol at room temperature and stained with Regaud dye
hematoxylin for 10 min at room temperature. Following rinsing with
water, sections were stained with Ponceau Fuchsin acid solution for
10 min at room temperature, immersed in 2% acetic acid aqueous
solution and treated with a 1% aqueous solution of phosphomolybdic
acid for 5 min at room temperature. Without rinsing with water, the
sections were stained with 2% aniline blue for 5 min at room
temperature, immersed in 0.2% acetic acid aqueous solution, in 95%
alcohol, anhydrous alcohol, permeabilized with xylene and mounted
with neutral resin. The sections were observed and images were
captured using a NanoZoomer 2.0 RS Digital Pathology slide scanner
(Hamamatsu Photonics K.K., Hamamatsu, Japan). Renal collagen volume
fraction (CVF) was analyzed using Image-Pro Plus 6.0 analysis
software (Media Cybernetics, Inc., Rockville, MD, USA). A total of
five fields of view per sample were randomly chosen and the average
was determined for analysis.
Ultrastructure observation
Fresh left kidneys were cut into 1×1×1 mm cubes and
fixed using 2.5% glutaraldehyde for 4–6 h at 4°C. Tissues were
washed with 0.1 mol/l phosphate buffer and post-fixed in 1% osmium
tetroxide for 1 h at room temperature. Tissues were embedded in
Epon812 for 2 h at room temperature, put into an oven at 45°C for
12 h and at 65°C for 48 h then cut into 70-nm thick ultrathin
sections and stained with uranyl acetate for 30 min and lead
citrate for 15 min at room temperature. These sections were
examined using a JEM-1230 JEOL transmission electron microscope
(TEM; Tokyo, Japan).
Semi-quantitative reverse
transcription-polymerase chain reaction (RT-PCR)
The mRNA expression levels of TGF-β1 in renal tissue
were determined by RT-PCR. Briefly, total RNA was extracted from
renal tissue (0.1 g) using TRIzol® (Invitrogen; Thermo
Fisher Scientific, Inc., Waltham, MA, USA), according to the
manufacturer's protocol. cDNA was synthesized according to the
protocol of RevertAid First Strand cDNA Synthesis kit (cat. no.
K1622; Invitrogen; Thermo Fisher Scientific, Inc.). TGF-β1 and
β-actin genes were amplified using PCR Master Mix (cat. no. K0171;
Thermo Fisher Scientific, Inc.). All PCR reactions were performed
with a T-Gradient thermocycler (Biometra GmbH, Göttingen, Germany).
The primer sequences were as follows: TGF-β1, forward
5′-CCAAGGAGACGGAATACAGG-3′, reverse 5′-ATGAGGAGCAGGAAGGGTC-3′
(expected size, 156 bp); β-actin, forward
5′-GATGGTGGGTATGGGTCAGAAGGAGG-3′, reverse
5′-GCTCATTGCCGATAGTGATGACC-3′ (expected size, 632 bp). The
thermocycling conditions were as follows: Initial denaturation at
95°C for 3 min; followed by 32 cycles of denaturation at 95°C for
50 sec; annealing at 54.5°C (TGF-β1) or 59.4°C (β-actin) for 50
sec; and extension at 72°C for 60 sec; followed by final extension
at 72°C for 10 min. The PCR products were electrophoresed in 1.5%
agarose gel and stained with ethidium bromide. Densitometric
analysis of TGF-β1 gene expression was normalized to the
corresponding β-actin gene using Tanon 3.1.2 software (Tanon
Science and Technology, Co., Ltd., Shanghai, China).
Western blotting
Rat renal tissue (0.1 g) was lysed using Cell Lysis
Buffer for western blotting and IP (cat. no. P0013; Beyotime
Institute of Biotechnology) with phenylmethanesulfonyl fluoride
(cat. no. ST506; Beyotime Institute of Biotechnology). The protein
concentration was measured using the BCA Protein Assay kit. A total
of 50 µg protein was separated by 10% SDS-PAGE and subsequently
electroblotted onto polyvinylidene difluoride membranes. Membranes
used for Nrf2, HO-1, NQO1, TGF-β1, Smad3, collagen-IV and GAPDH
detection were blocked in TBS + 0.1% Tween 20 (TBST) containing 5%
nonfat dry milk at 37°C for 2 h, and membranes used for
phosphorylated (p)-Smad3 were blocked in TBST containing 5% bovine
serum albumin (cat. no. B2064; Sigma-Aldrich; Merck KGaA) at 37°C
for 2 h. The membranes were incubated with primary antibodies
against the following proteins: Nrf2 (1:1,000; cat. no. ab137550;
Abcam, Cambridge, MA, USA), HO-1 (1:1,000; cat. no. ab52947;
Abcam), NQO1 (1:300; cat. no. PB0526; Wuhan Boster Biological
Technology, Ltd., Wuhan, China), TGF-β1 (1:1,000; cat. no. ab92486;
Abcam), Smad3 (1:1,000; cat. no. ab40854; Abcam), p-Smad3 (1:1,000;
cat. no. ab52903; Abcam), collagen IV (1:300; cat. no. A01411;
Wuhan Boster Biological Technology, Ltd.) and GAPDH (1:2,000; cat.
no. ab181602; Abcam) at 4°C overnight, followed by incubation with
horseradish peroxidase-conjugated goat anti-rabbit immunoglobulin G
secondary antibody (1:2,000; cat. no. BL003A; Biosharp
Biotechnology, Hefei, China) for 1 h at room temperature. The blots
were detected using an enhanced chemiluminescent reagent (cat. no.
WBKLS0100; Millipore Corporation, Billerica, MA, USA) and scanned
with ChemiDoc XRS system (Bio-Rad Laboratories, Inc., Hercules, CA,
USA). The intensities of the protein bands were quantified and
normalized to GAPDH using Quantity One Software Version 4.6.6
(Bio-Rad Laboratories, Inc.).
Statistical analysis
All statistical analysis was conducted using SPSS
Software, version 17.0 (SPSS, Inc., Chicago, IL, USA). All tests
were repeated three times. Data are expressed as the mean ±
standard deviation. Statistical comparisons were analyzed using
one-way analysis of variance followed by the Newman-Keuls test.
P<0.05 was considered to indicate a statistically significant
difference.
Results
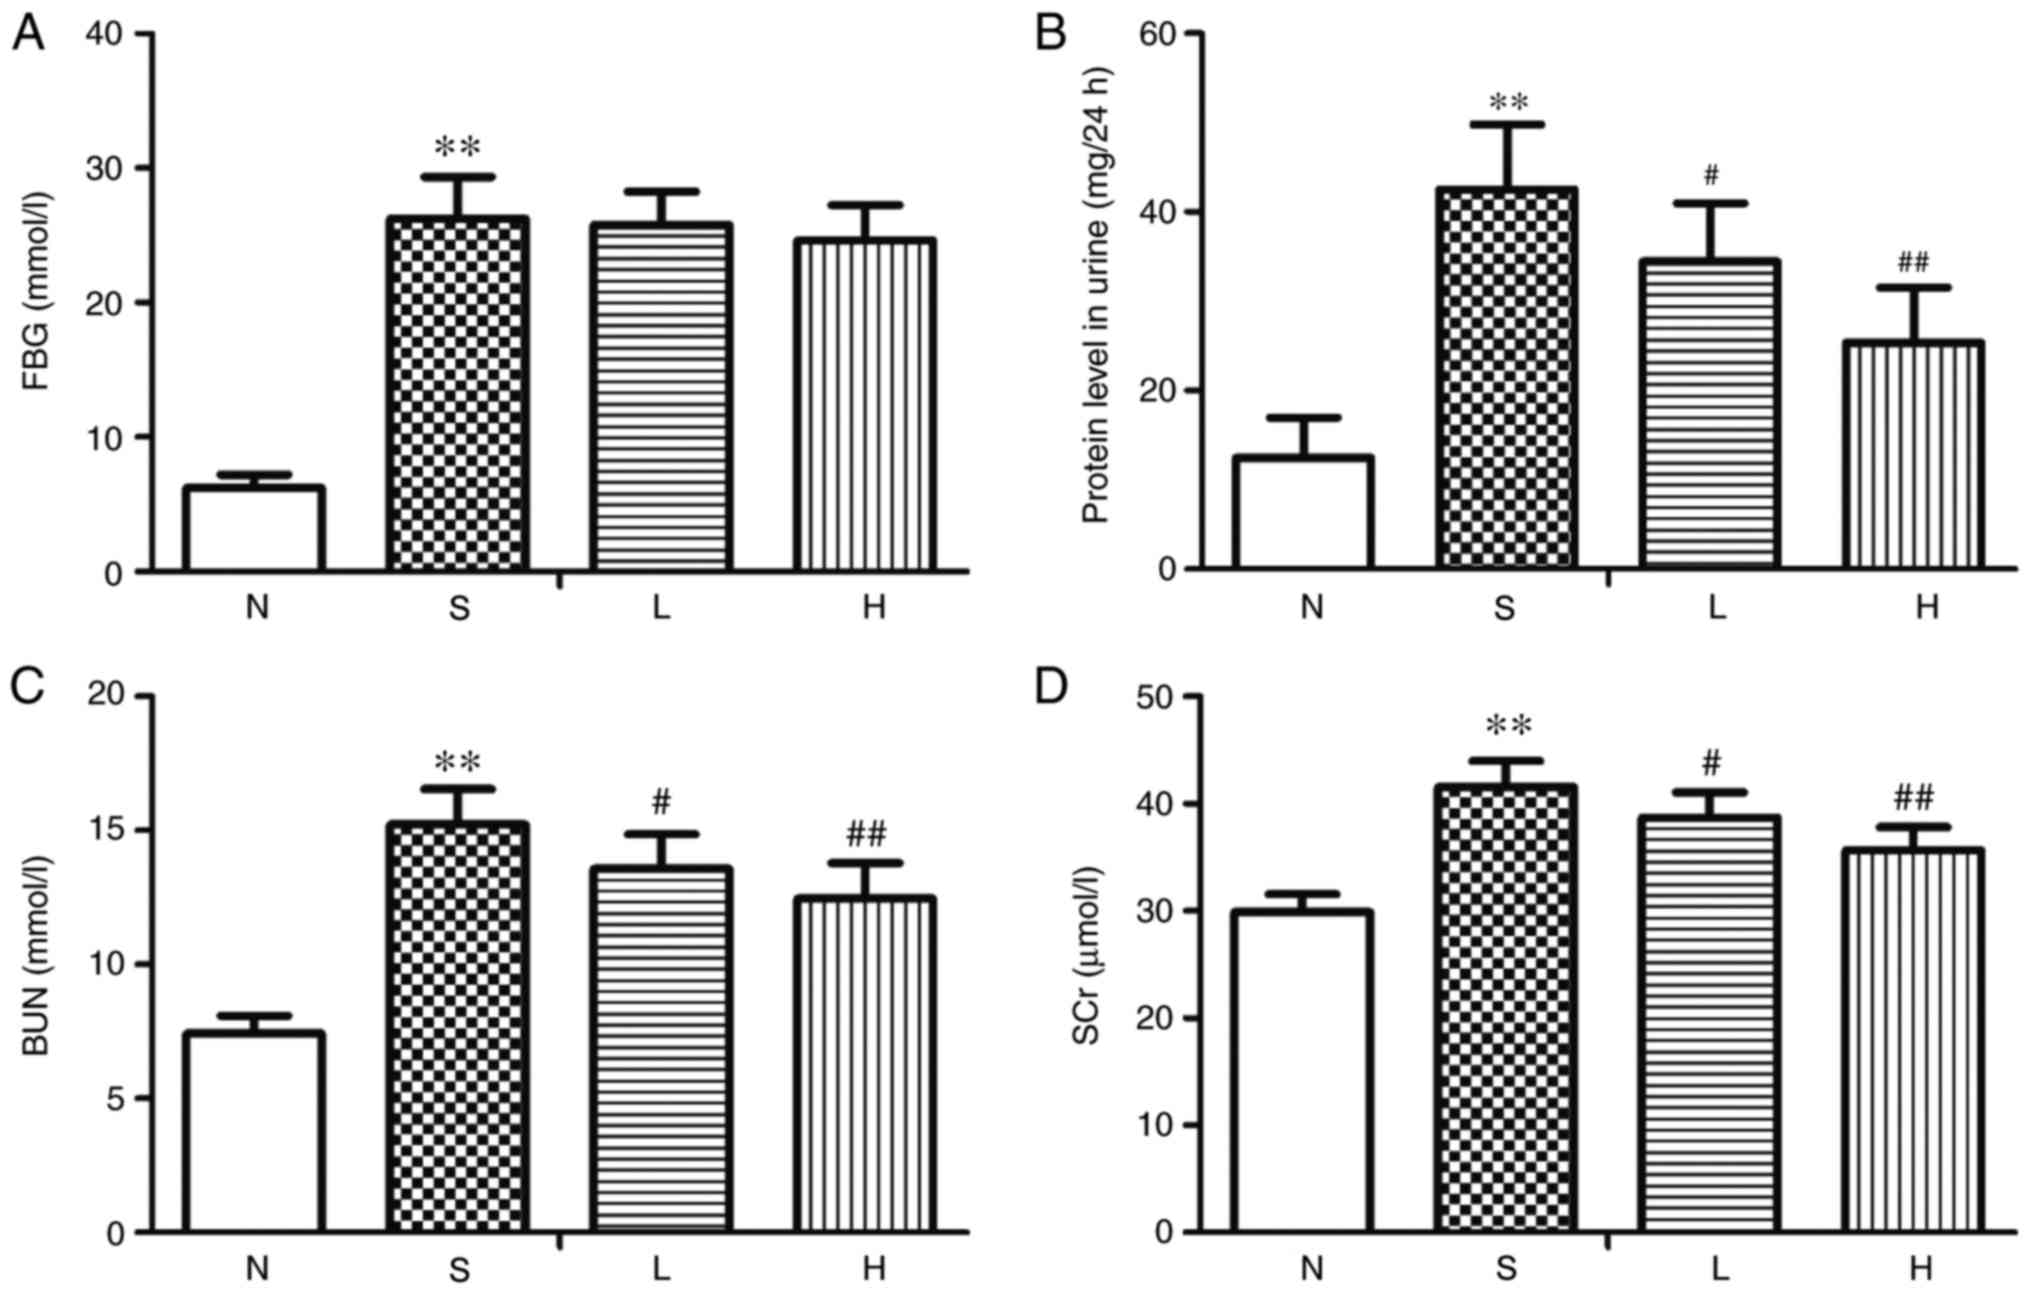
Alterations of FBG, 24-h urine
protein, BUN and SCr levels
The levels of FBG, 24-h urine protein, BUN and SCr
were significantly increased in the S group compared with the
respective levels in the N group (P<0.01; Fig. 1A-D). No significant differences
were identified in FBG levels between rats in the L or H group
compared with those in the S group (Fig. 1A); conversely, BUN, 24-h urine
protein and SCr levels were significantly decreased in the L and H
groups compared with the S group (P<0.05, P<0.01; Fig. 1B-D).
Effects on BW, KW and renal index
Compared with group N, BW was significantly
decreased (P<0.01; Table I),
whereas KW and renal index were significantly increased in the S
group (P<0.01). Compared with group S, there were no significant
differences in BW and KW in group L, whereas renal index was
significantly decreased (P<0.05). BW was significantly increased
(P<0.01), KW and renal index were significantly decreased
(P<0.05 and P<0.01, respectively) in group H compared with
group S (Table I).
 | Table I.Alterations of BW, KW and renal index
in diabetic model rats. |
Table I.
Alterations of BW, KW and renal index
in diabetic model rats.
| Group | BW (g) | KW (mg) | Renal
indexa (mg/g) |
|---|
| N | 421.54±33.62 | 2.92±0.22 | 7.02±0.56 |
| S |
232.15±23.07b |
3.52±0.15b |
13.70±0.64b |
| L | 257.46±27.94 | 3.42±0.12 |
12.78±0.62c |
| H |
290.30±31.28d |
3.28±0.14c |
11.88±0.46d |
Effects on T-AOC, SOD, LPO, MDA and
Hyp content
The levels of T-AOC and SOD in renal tissue were
significantly decreased (P<0.01; Table II), whereas the LPO, MDA and Hyp
content were significantly increased (P<0.01) in group S,
compared with the N control group. Rats in the L and H groups
exhibited significantly increased levels of T-AOC and SOD
(P<0.05) and significantly decreased LPO, MDA and Hyp content
compared with group S (P<0.05 and P<0.01, respectively;
Table II).
| Table II.Levels of T-AOC, SOD, LPO, MDA and
Hyp in renal tissues of diabetic model rats. |
Table II.
Levels of T-AOC, SOD, LPO, MDA and
Hyp in renal tissues of diabetic model rats.
| Group | T-AOC (U/mg) | SOD (U/mg) | LPO (µmol/g) | MDA (nmol/mg) | Hyp (µg/mg) |
|---|
| N | 87.55±6.97 | 64.10±7.95 | 15.24±2.62 | 3.78±0.49 | 2.95±0.28 |
| D |
51.65±5.52a |
31.22±4.70a |
31.46±3.41a |
6.92±0.72a |
5.67±0.55a |
| L |
60.12±5.68b |
39.56±5.24b |
27.19±3.23b |
6.18±0.54b |
5.13±0.43b |
| H |
67.49±6.11c |
47.83±5.58c |
22.65±2.87c |
5.72±0.53c |
4.46±0.41c |
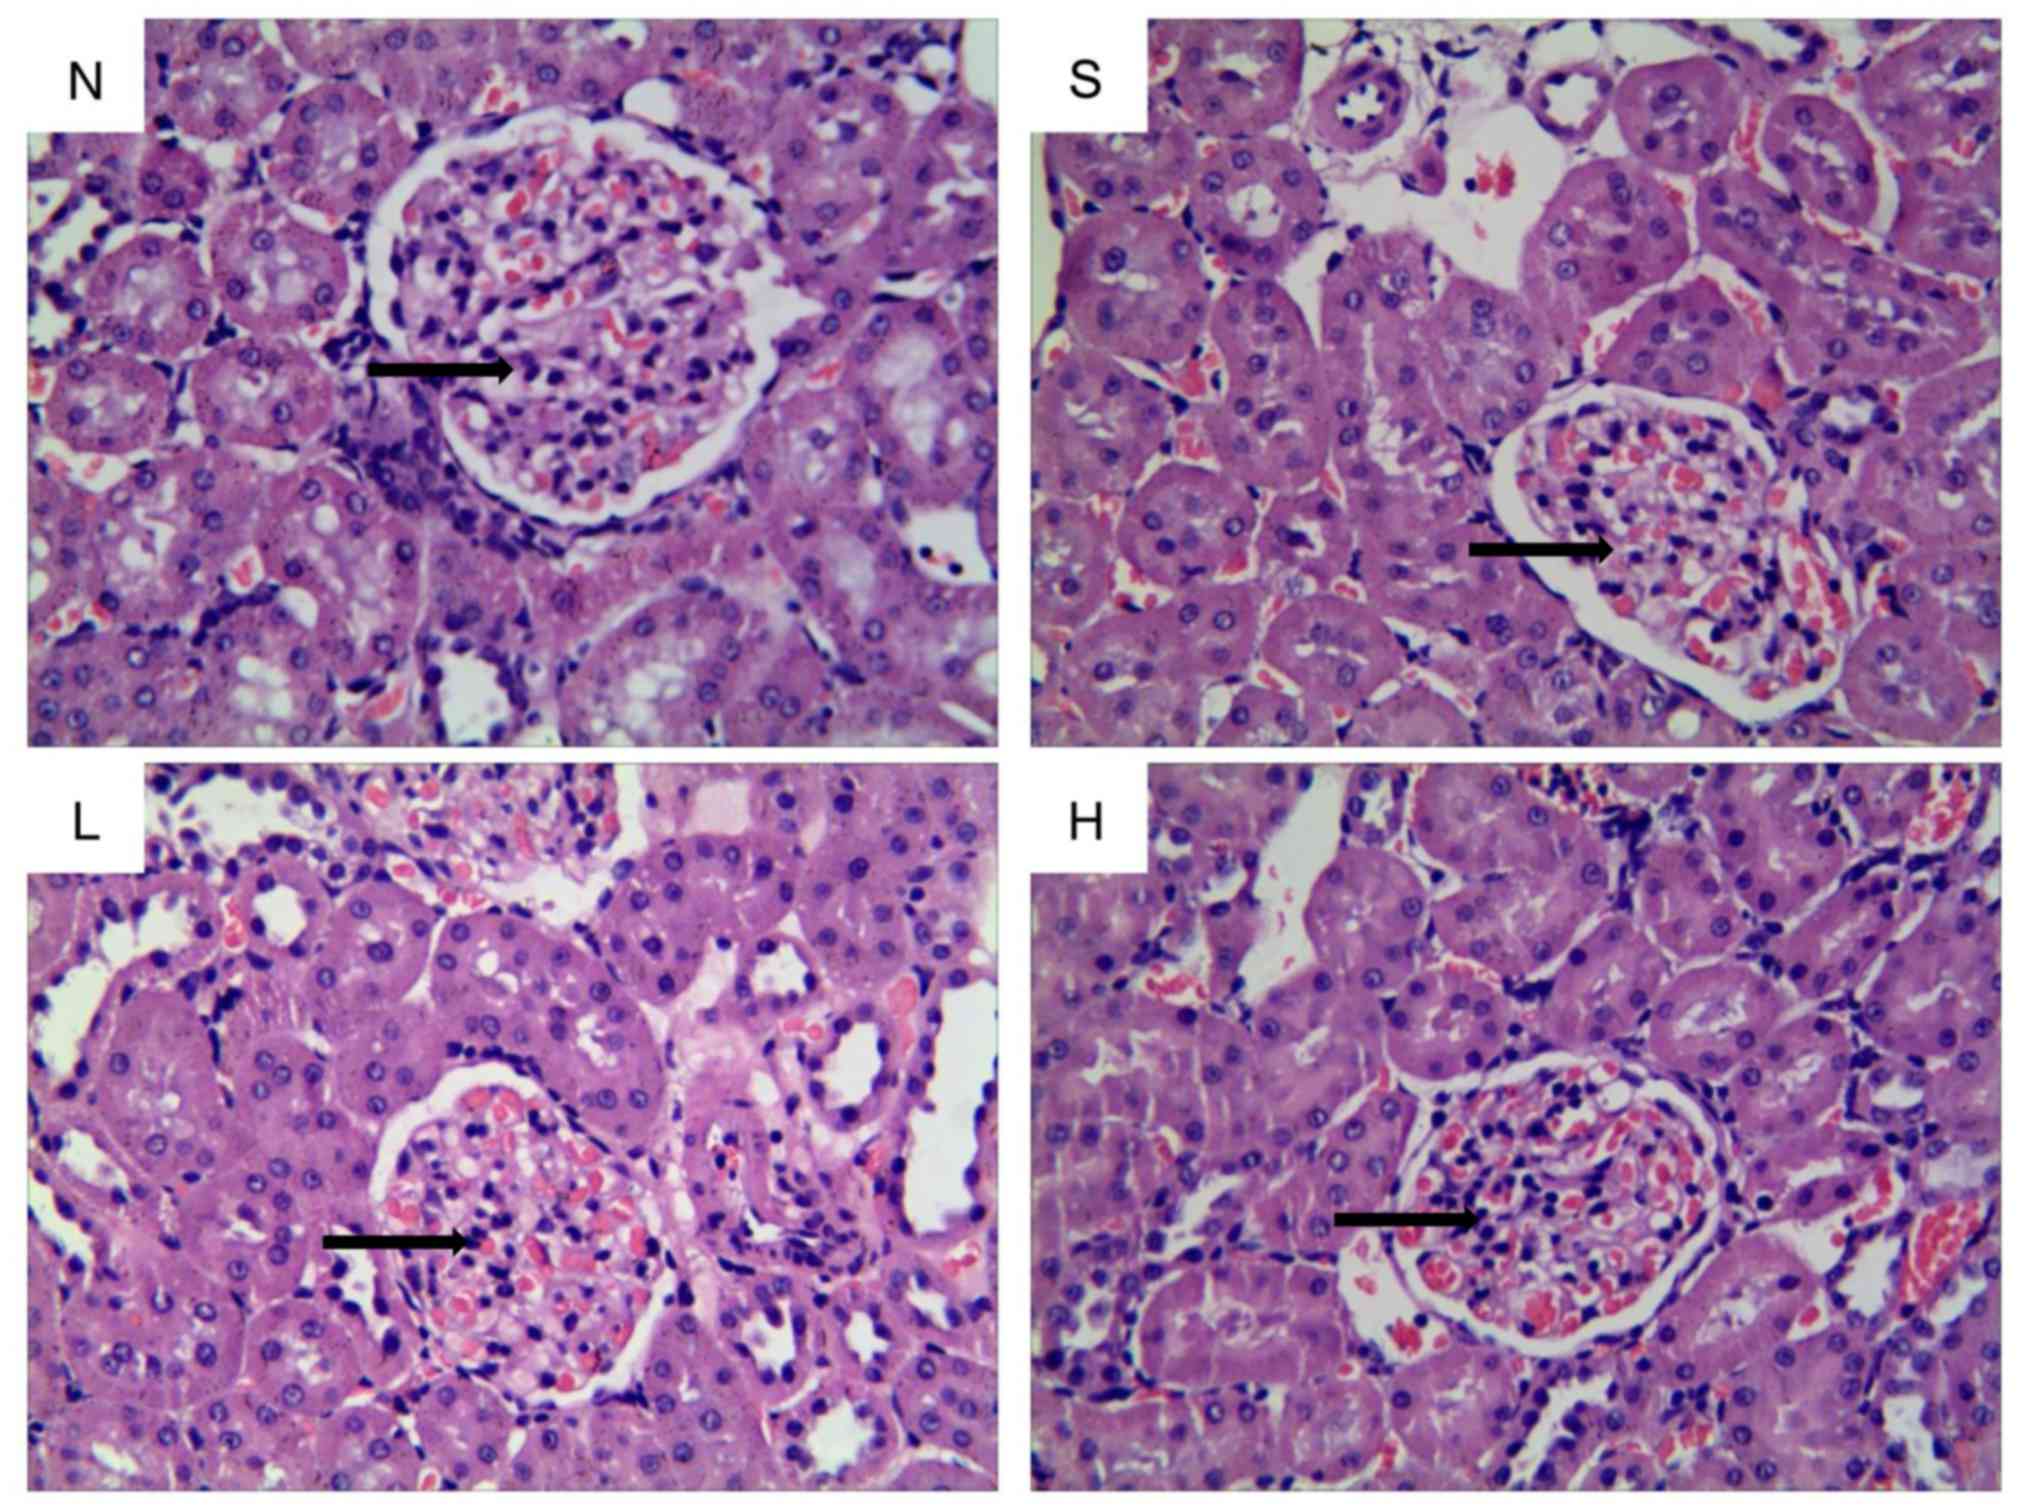
Histological alterations in renal
tissue
H&E staining indicated that the glomerular
structure was normal and the thickness of glomerular basement
membrane was uniform in the kidneys of rats in group N (Fig. 2). Conversely, the glomerular
basement membrane was thickened and the mesangial matrix was
increased in group S. Similarly, glomerular basement membrane
thickening and mesangial matrix expansion were observed in group L.
In group H, the glomerular morphology was improved and pathological
alterations were notably decreased compared with group S (Fig. 2).
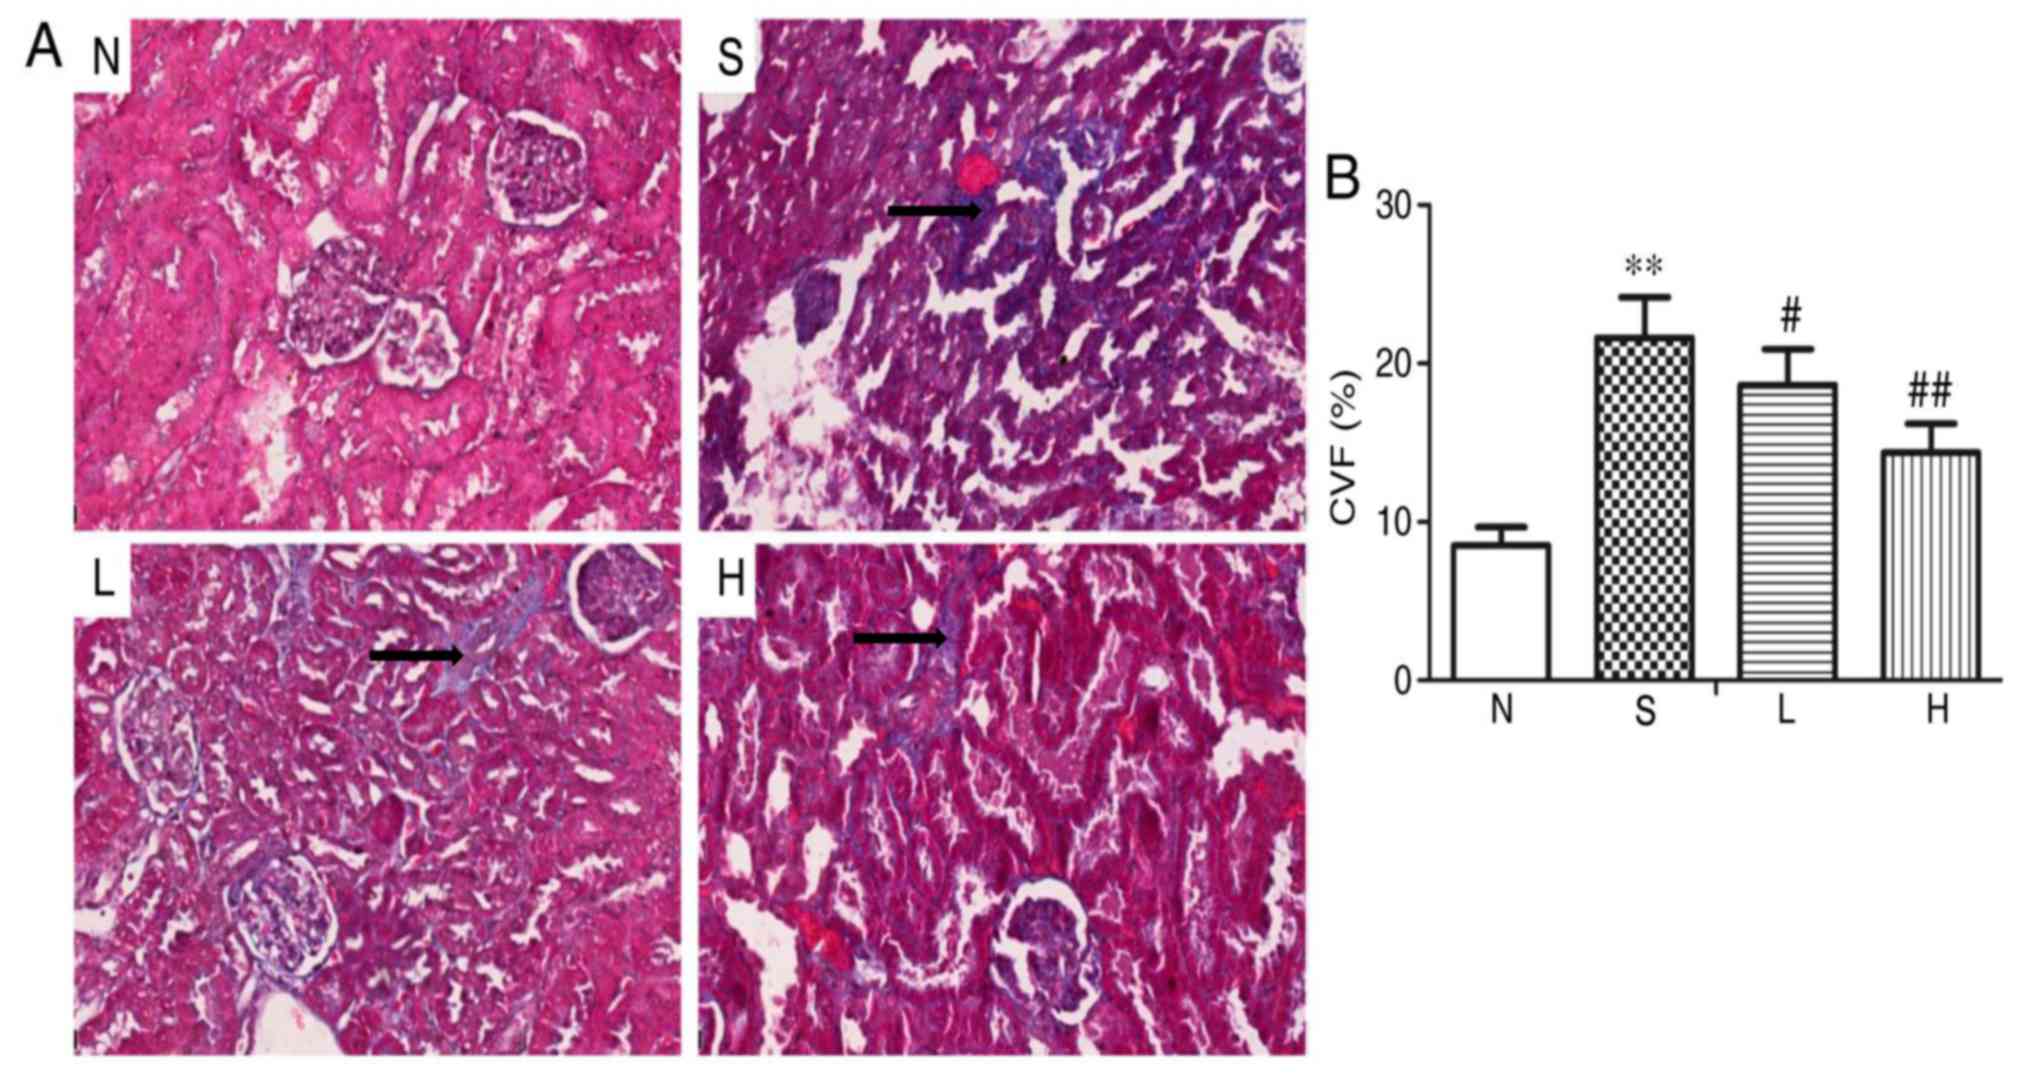
Morphology of collagen deposition in
renal tissue
Masson's trichrome staining demonstrated normal
glomerular and renal tubules with less collagen deposition in group
N kidneys (Fig. 3A). A number of
collagen deposits in the glomerular perivasular region and
intraglomerular region were observed in group S. Compared with
group S, collagen deposition was decreased in groups L and H
(Fig. 3A). Quantitative analysis
indicated that the content of CVF was significantly increased in
group S compared with group N (P<0.01; Fig. 3B). However, compared with group S,
CVF content was significantly decreased in groups L and H
(P<0.05 and P<0.01, respectively; Fig. 3B).
Alterations in renal
ultrastructure
In group N kidneys, TEM demonstrated that the normal
glomerular basement membrane and mesangial matrix, as well the
podocyte foot processes were neatly arranged (Fig. 4). In the S group, the basement
membrane of the cortex was thickened, the mesangial matrix was
increased and a number of foot processes were fused. The glomerular
basement membrane was thickened and a few foot processes were fused
in group L; whereas, in group H, the glomerular basement membrane
and fusion of foot processes were notably improved compared with
group S (Fig. 4).
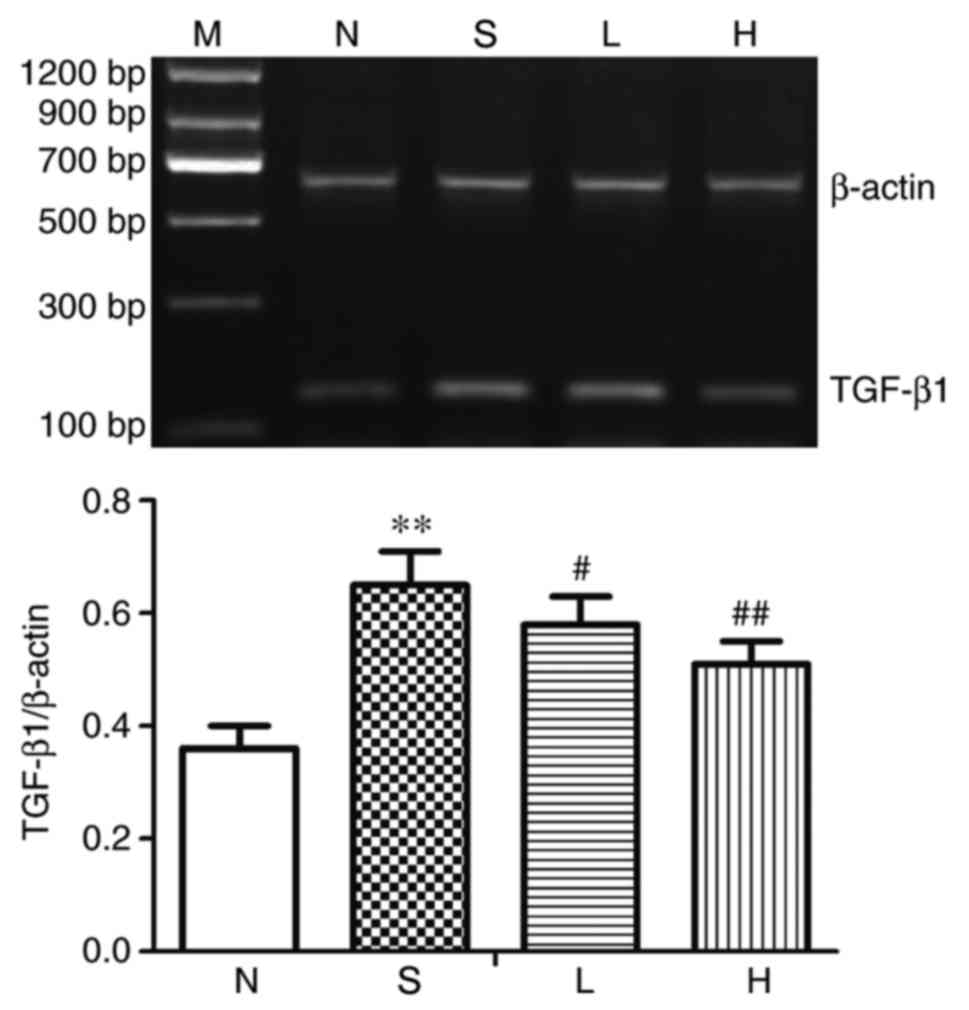
Alterations in renal TGF-β1 at the
mRNA level
The mRNA expression levels of TGF-β1 in renal tissue
were significantly upregulated in group S compared with group N
(P<0.01; Fig. 5). Compared with
group S, TGF-β1 mRNA expression was significantly decreased in
groups L and H (P<0.05 and P<0.01, respectively; Fig. 5).
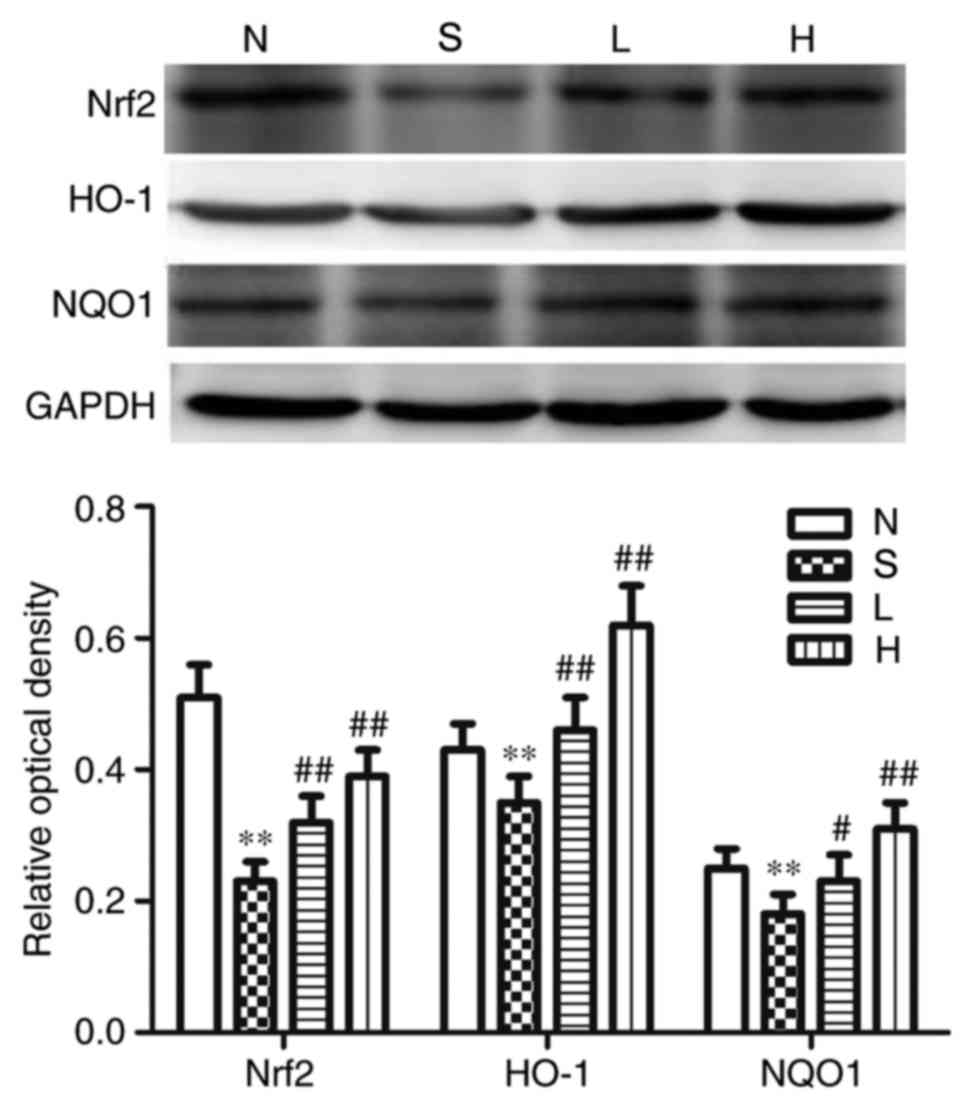
Effects on renal Nrf2, HO-1, NQO1,
TGF-β1, Smad3, p-Smad3 and collagen-IV at protein expression
levels
The protein expression levels of renal Nrf2, HO-1
and NQO1 were significantly reduced compared with the respective
expression levels in the N group (P<0.01; Fig. 6), whereas the protein expression
levels of TGF-β1, Smad3, p-Smad3 and collagen IV, as well as the
p-Smad3/Smad3 ratio were significantly elevated in group S,
compared with the N group (P<0.01; Fig. 7). Compared with group S, the
protein expression levels of Nrf2, HO-1 and NQO1 were significantly
elevated (P<0.05; Fig. 6), and
the protein expression levels of TGF-β1, Smad3, p-Smad3 and
collagen IV were significantly reduced (P<0.05; Fig. 7) in group L; no significant
difference in p-Smad3/Smad3 ratio was identified between the L and
S groups. In group H, the protein expression levels of Nrf2, HO-1,
and NQO1 were significantly elevated (P<0.01; Fig. 6), and the protein expression levels
of TGF-β1, Smad3, p-Smad3 and collagen-IV, as well as the
p-Smad3/Smad3 ratio were significantly reduced compared with S
(P<0.05; Figs. 6 and 7).
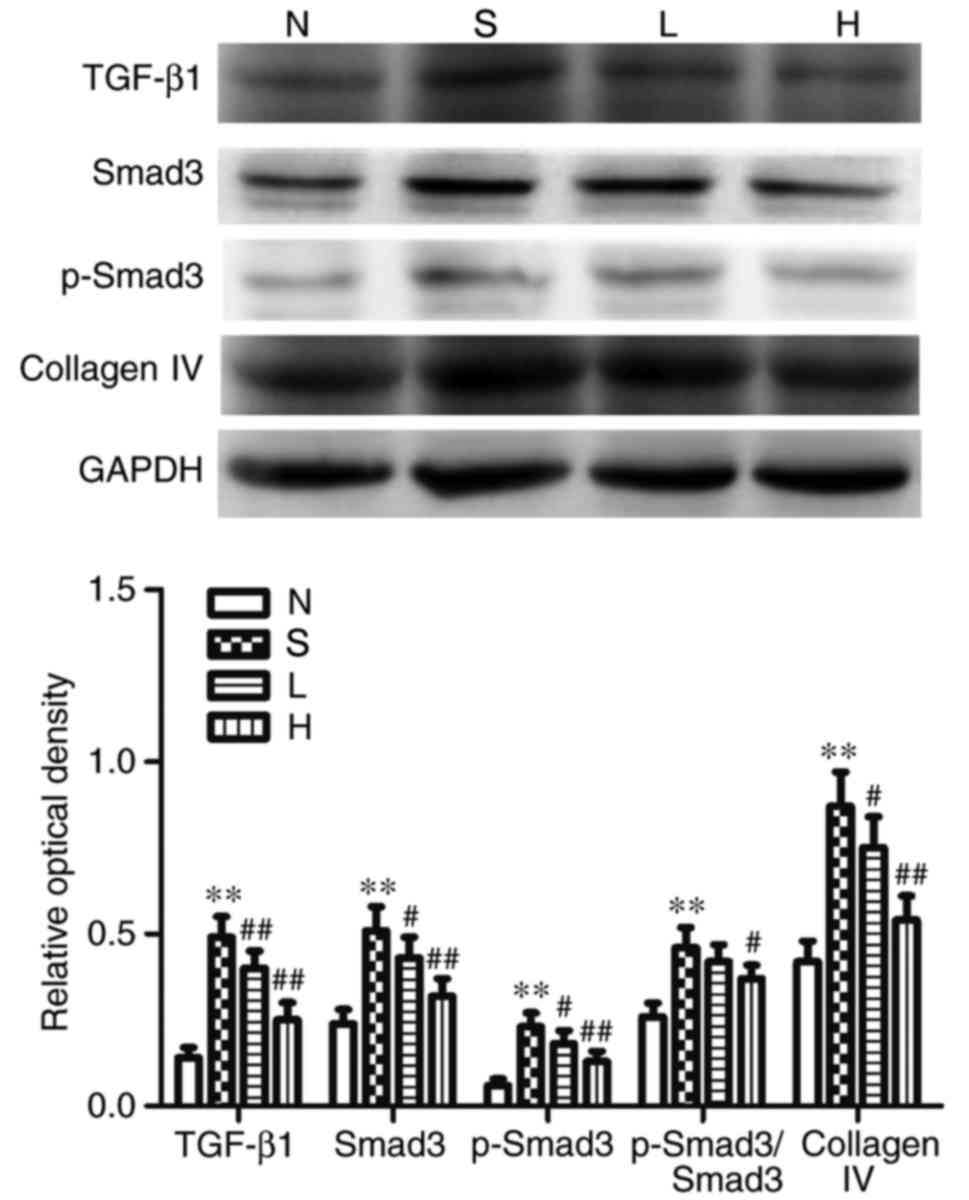 | Figure 7.Protein expression of TGF-β1, Smad3,
p-Smad3 and collagen IV in the different groups. Representative
western blotting images and semi-quantitative analysis of TGF-β1,
Smad3, p-Smad3, p-Smad3/Smad3 and collagen IV proteins; GAPDH was
used as a loading control. Data are presented as the mean ±
standard deviation; n=6; **P<0.01 vs. N; #P<0.05
and ##P<0.01 vs. S. H, streptozotocin + high-dose
genistein group; L, streptozotocin + low-dose genistein group; N,
normal control group; p, phosphorylated; S, streptozotocin group;
Smad3, mothers against decapentaplegic homolog 3; TGF-β1,
transforming growth factor-β1. |
Discussion
DN is a major diabetic microvascular complication
and is the leading cause of chronic renal failure and end-stage
renal disease (25). The main
pathological alterations in DN are increased mesangial matrix in
the glomerulus, basement membrane thickening and interstitial
fibrosis (26). In the present
study, rats received a large i.p. dose of STZ to induce a T1DM
model. The results demonstrated that BW was reduced, and the FBG,
KW, renal index, 24-h urine protein, BUN and SCr levels were
increased in group S. In addition, H&E staining and
ultrastructure observations demonstrated that glomerular basement
membrane thickening and the mesangial matrix increased in the
diabetic renal tissue, which indicated that the DN model was
successfully established, and that renal hypertrophy and
dysfunction were aggravated in the diabetic model rats.
Oxidative stress serves a pivotal role in the
occurrence and development of DN (27). The imbalance between oxidation and
anti-oxidant systems, and excess ROS generation are the main
pathogenic factors in renal disease (28). It has been reported that
hyperglycemia may induce the glomerular mesangial cells and tubular
epithelial cells to produce excess ROS, which destroy tissue
proteins, produces a large quantity of lipid peroxides and further
aggravates renal oxidative damage (29). T-AOC reflects the total antioxidant
capacity of the body's defense system, and LPO and MDA reflect the
levels of tissue lipid peroxidation. SOD functions to scavenge
superoxide products, which reflects the intracellular reductive
capacity. In the present study, the results demonstrated that
compared with normal control rats, diabetic rats exhibited reduced
T-AOC and SOD activities and their LPO and MDA contents were
increased. These results indicated that diabetes may decrease renal
total antioxidant capacity and increase the production of lipid
peroxides, which may lead to renal oxidative stress injury. In
addition, western blotting results demonstrated that the protein
expression of Nrf2, HO-1 and NQO1 were reduced, which suggested
that the Nrf2-HO-1/NQO1 pathway may be involved in diabetes-induced
oxidative stress.
GEN is a plant phytoestrogen that has an
anti-oxidative effect. For example, a previous study reported that
GEN prevents cisplatin-induced renal injury by reducing ROS levels
and inhibiting nuclear factor-κB activation (30). The present study aimed to
investigate the reno-protective effects of low- and high-dose GEN
treatment in T1DM model rats. The results of the present study
demonstrated that the renal index was decreased in rats receiving a
low-dose of GEN, although there were no significant differences in
BW and KW; KW and renal index were decreased in rats treated with a
high dose of GEN. BUN, 24-h urine protein, SCr, LPO and MDA were
decreased, while T-AOC and SOD activities were increased in
low-dose GEN-treated rats, and further improvements were observed
in rats receiving a higher dose. In addition, western blotting
results also demonstrated that GEN increased the protein expression
of Nrf2, HO-1 and NQO1. These results suggested that GEN treatment
may protect the diabetic kidney from oxidative stress by activating
the Nrf2/HO-1/NQO1 signaling pathway. However, GEN treatment
exhibited no effects on FBG levels in this model. Taken together,
these results indicated that GEN may have reno-protective effects
in diabetic rats by alleviating renal hypertrophic alterations,
inhibiting lipid peroxidation and restoring balance to the
anti-oxidant system, and this effect is not relevant to reducing
the FBG level in STZ-induced diabetic rats.
Previous studies have revealed that GEN treatment
inhibits tyrosine kinase and has an anti-proliferative effect on
many types of cells (31–33). GEN was reported to inhibit aortic
smooth muscle cell proliferation in vivo and to abolish
nucleoside uptake by cardiac fibroblasts in vitro (22,34).
GEN also inhibits the expression of connective tissue growth factor
and epithelial-to-mesenchymal transition, which indicated that GEN
may have an antifibrogenic effect in parathyroid hormone-induced
renal disease (35). However,
there is no obvious evidence that GEN exerts its antifibrogenic
activity in the diabetic kidney. Therefore, an attempt was made to
determine the anti-fibrotic effects of GEN on renal fibrosis in
subsequent experiments.
Renal fibrosis, characterized by the continuous
accumulation and excessive deposition of ECM, is a major
pathological feature of chronic kidney diseases (36). Excess ECM, which is caused by an
imbalance between synthesis and degradation, serves a key role in
the pathogenesis of renal fibrosis (37). In renal fibrosis, the major
components of ECM are interstitial collagens, including collagen
IV, and its increased biosynthesis or reduced degradation leads to
glomerular basement membrane thickening and renal insufficiency
(38). Masson's trichrome staining
is a conventional method for the detection of collagen deposition.
In addition, the Hyp residue is the main component of collagen IV
formation. The results of the present study demonstrated that renal
CVF, Hyp content and collagen IV protein expression were increased
in diabetic model rat kidney tissues, which suggested that diabetes
may induce renal fibrosis. In GEN-treated diabetic model rats CVF,
Hyp content and collagen IV protein expression were decreased,
which indicated that GEN may be able to attenuate the pathogenesis
of renal fibrosis in diabetic rats.
In fibrotic diseases, TGF-β1 is synthesized by all
cell types in the kidney and is a crucial pro-fibrotic mediator;
the expression of TGF-β1 is significantly upregulated in damaged
kidneys in both animal models and patients (39,40).
TGF-β1 directly induces the activation of ECM genes and suppresses
the degradation of ECM (41).
Futhermore, TGF-β1 may induce tubular endothelial-to-myofibroblast
differentiation and directly promote the proliferation of mesangial
cells (42,43). Active TGF-β1 exerts its biological
and pathological effects through the Smad-dependent pathway in
kidney disease (44). Smads are
crucial intracellular nuclear effectors of TGF-β family members. Of
these, Smad3 is phosphorylated by TGF-β1, which regulates
transcription of downstream target gene (45). Smad3 is highly phosphorylated
during renal fibrosis (46). A
number of studies have demonstrated that TGF-β1/Smad3 signaling is
a central pathway leading to fibrotic diseases, including liver
fibrosis (47), myocardial
fibrosis (48) and pulmonary
fibrosis (49). The results of the
present study also demonstrated that the mRNA expression levels of
TGF-β1, as well as the protein expression levels of TGF-β1, Smad3
and p-Smad3, and the p-Smad3/Smad3 ratio were increased in
STZ-induced diabetic rats, which indicated that the TGF-β1/Smad3
pathway may be activated in renal fibrosis, and this result was
consistent with previous studies (50–52).
Following either low- or high-dose GEN treatment, the expression
levels of TGF-β1, Smad3 and p-Smad3 were decreased. Therefore, the
present study hypothesized that GEN treatment may downregulate the
TGF-β1/Smad3 pathway to attenuate renal fibrosis in diabetic
rats.
In summary, results from the present study
demonstrated that GEN may attenuate renal fibrosis and exhibit
reno-protective effects in T1DM model rats. The beneficial effects
of GEN treatment on kidney injury may be attributed to its ability
to suppress oxidative stress by activating the Nrf2/HO-1/NQO1
pathway and to downregulate the TGF-β1/Smad3 pathway to regulate
collagen IV protein expression.
Acknowledgements
Not applicable.
Funding
The present study was supported by The Natural
Science Research Project of The Education Commission of Anhui
Province (grant nos. KJ2017A216 and KJ2018A0994) and The Natural
Science Research Project of Bengbu Medical College (grant nos.
BYKY1621ZD and BYKF1706).
Availability of data and materials
The analyzed data sets generated during the study
are available from the corresponding author on reasonable
request.
Authors' contributions
QJ, RY and LW produced substantial contributions to
the conception and design of the present study. QJ, XFL and SFM
performed the experiments. QJ and RY analyzed the data and wrote
the manuscript. All authors read and approved the manuscript.
Ethics approval and consent to
participate
The present study was approved by the Animal Ethics
Committee of Bengbu Medical College (Bengbu, China).
Patient consent for publication
Not applicable.
Competing interests
The authors declare they have no competing
interests.
References
|
1
|
Thompson CS: Diabetic nephropathy:
Treatment with phosphodiesterase type 5 inhibitors. World J
Diabetes. 4:124–129. 2013. View Article : Google Scholar : PubMed/NCBI
|
|
2
|
Luyckx VA, Tonelli M and Stanifer JW: The
global burden of kidney disease and the sustainable development
goals. Bull World Health Organ. 96:414–422. 2018. View Article : Google Scholar : PubMed/NCBI
|
|
3
|
Shields J and Maxwell AP: Managing
diabetic nephropathy. Clin Med. 10:500–504. 2010. View Article : Google Scholar
|
|
4
|
Tominaga T, Abe H, Ueda O, Goto C,
Nakahara K, Murakami T, Matsubara T, Mima A, Nagai K, Araoka T, et
al: Activation of bone morphogenetic protein 4 signaling leads to
glomerulosclerosis that mimics diabetic nephropathy. J Biol Chem.
286:20109–20116. 2011. View Article : Google Scholar : PubMed/NCBI
|
|
5
|
Fernandes SM, Cordeiro PM, Watanabe M,
Fonseca CD and Vattimo MF: The role of oxidative stress in
streptozotocin-induced diabetic nephropathy in rats. Arch
Endocrinol Metab. 60:443–449. 2016. View Article : Google Scholar : PubMed/NCBI
|
|
6
|
Yu JB, Shi J, Gong LR, Dong SA, Xu Y,
Zhang Y, Cao XS and Wu LL: Role of Nrf2/ARE pathway in protective
effect of electroacupuncture against endotoxic shock-induced acute
lung injury in rabbits. PLoS One. 9:e1049242014. View Article : Google Scholar : PubMed/NCBI
|
|
7
|
Ansari MA: Sinapic acid modulates
Nrf2/HO-1 signaling pathway in cisplatin-induced nephrotoxicity in
rats. Biomed Pharmacother. 93:646–653. 2017. View Article : Google Scholar : PubMed/NCBI
|
|
8
|
Lv S, Zhou Q, Xia Y, You X, Zhao Z, Li Y
and Zou H: The association between oxidative stress alleviation via
sulforaphane-induced Nrf2-HO-1/NQO-1 signaling pathway activation
and chronic renal allograft dysfunction improvement. Kidney Blood
Press Res. 43:191–205. 2018. View Article : Google Scholar : PubMed/NCBI
|
|
9
|
Ilkun O and Boudina S: Cardiac dysfunction
and oxidative stress in the metabolic syndrome: An update on
antioxidant therapies. Curr Pharm Des. 19:4806–4817. 2013.
View Article : Google Scholar : PubMed/NCBI
|
|
10
|
Rochette L, Zeller M, Cottin Y and Vergely
C: Diabetes, oxidative stress and therapeutic strategies. Biochim
Biophys Acta. 1840:2709–2729. 2014. View Article : Google Scholar : PubMed/NCBI
|
|
11
|
Arora MK and Singh UK: Oxidative stress:
Meeting multiple targets in pathogenesis of diabetic nephropathy.
Curr Drug Targets. 15:531–538. 2014. View Article : Google Scholar : PubMed/NCBI
|
|
12
|
Liu L, Shi M, Wang Y, Zhang C, Su B, Xiao
Y and Guo B: SnoN upregulation ameliorates renal fibrosis in
diabetic nephropathy. PLoS One. 12:e01744712017. View Article : Google Scholar : PubMed/NCBI
|
|
13
|
Palanisamy N, Kannappan S and Anuradha CV:
Genistein modulates NF-κB-associated renal inflammation, fibrosis
and podocyte abnormalities in fructose-fed rats. Eur J Pharmacol.
667:355–364. 2011. View Article : Google Scholar : PubMed/NCBI
|
|
14
|
Meng XM, Tang PM, Li J and Lan HY:
TGF-β/Smad signaling in renal fibrosis. Front Physiol. 6:822015.
View Article : Google Scholar : PubMed/NCBI
|
|
15
|
Guo TL, Germolec DR, Zheng JF, Kooistra L,
Auttachoat W, Smith MJ, White KL and Elmore SA: Genistein protects
female nonobese diabetic mice from developing type 1 diabetes when
fed a soy- and alfalfa-free diet. Toxicol Pathol. 43:435–448. 2015.
View Article : Google Scholar : PubMed/NCBI
|
|
16
|
Maulik SK, Prabhakar P, Dinda AK and Seth
S: Genistein prevents isoproterenol-induced cardiac hypertrophy in
rats. Can J Physiol Pharmacol. 90:1117–1125. 2012. View Article : Google Scholar : PubMed/NCBI
|
|
17
|
Zhou P, Wang C, Hu Z, Chen W, Qi W and Li
A: Genistein induces apoptosis of colon cancer cells by reversal of
epithelial-to-mesenchymal via a Notch1/NF-κB/slug/E-cadherin
pathway. BMC Cancer. 17:8132017. View Article : Google Scholar : PubMed/NCBI
|
|
18
|
Bhattarai G, Poudel SB, Kook SH and Lee
JC: Anti-inflammatory, anti-osteoclastic and antioxidant activities
of genistein protect against alveolar bone loss and periodontal
tissue degradation in a mouse model of periodontitis. J Biomed
Mater Res A. 105:2510–2521. 2017. View Article : Google Scholar : PubMed/NCBI
|
|
19
|
Rajput MS and Sarkar PD: Modulation of
neuro-inflammatory condition, acetylcholinesterase and antioxidant
levels by genistein attenuates diabetes associated cognitive
decline in mice. Chem Biol Interact. 268:93–102. 2017. View Article : Google Scholar : PubMed/NCBI
|
|
20
|
Mirahmadi SM, Shahmohammadi A, Rousta AM,
Azadi MR, Fahanik-Babaei J, Baluchnejadmojarad T and Roghani M: Soy
isoflavone genistein attenuates lipopolysaccharide-induced
cognitive impairments in the rat via exerting anti-oxidative and
anti-inflammatory effects. Cytokine. 104:151–159. 2017. View Article : Google Scholar : PubMed/NCBI
|
|
21
|
Gupta SK, Dongare S, Mathur R, Mohanty IR,
Srivastava S, Mathur S and Nag TC: Genistein ameliorates cardiac
inflammation and oxidative stress in streptozotocin-induced
diabetic cardiomyopathy in rats. Mol Cell Biochem. 408:63–72. 2015.
View Article : Google Scholar : PubMed/NCBI
|
|
22
|
Yu JY, Lee JJ, Lim Y, Kim TJ, Jin YR,
Sheen YY and Yun YP: Genistein inhibits rat aortic smooth muscle
cell proliferation through the induction of p27kip1. J
Pharmacol Sci. 107:90–98. 2008. View Article : Google Scholar : PubMed/NCBI
|
|
23
|
Yang R, Jia Q, Liu XF and Ma SF: Effect of
genistein on myocardial fibrosis in diabetic rats and its
mechanism. Mol Med Rep. 17:2929–2936. 2018.PubMed/NCBI
|
|
24
|
Li WF, Yang K, Zhu P, Zhao HQ, Song YH,
Liu KC and Huang WF: Genistein ameliorates
ischemia/reperfusion-induced renal injury in a SIRT1-dependent
manner. Nutrients. 9:4032017. View Article : Google Scholar :
|
|
25
|
Elmarakby AA and Sullivan JC: Relationship
between oxidative stress and inflammatory cytokines in diabetic
nephropathy. Cardiovasc Ther. 30:49–59. 2012. View Article : Google Scholar : PubMed/NCBI
|
|
26
|
Lan HY: Transforming growth factor-β/Smad
signalling in diabetic nephropathy. Clin Exp Pharmacol Physiol.
39:731–738. 2012. View Article : Google Scholar : PubMed/NCBI
|
|
27
|
Al Hroob AM, Abukhalil MH, Alghonmeen RD
and Mahmoud AM: Ginger alleviates hyperglycemia-induced oxidative
stress, inflammation and apoptosis and protects rats against
diabetic nephropathy. Biomed Pharmacother. 106:381–389. 2018.
View Article : Google Scholar : PubMed/NCBI
|
|
28
|
Sifuentes-Franco S, Padilla-Tejeda DE,
Carrillo-Ibarra S and Miranda-Díaz AG: Oxidative stress, apoptosis,
and mitochondrial function in diabetic nephropathy. Int J
Endocrinol. 2018:18758702018. View Article : Google Scholar : PubMed/NCBI
|
|
29
|
Mahmoodnia L, Aghadavod E, Beigrezaei S
and Rafieian-Kopaei M: An update on diabetic kidney disease,
oxidative stress and antioxidant agents. J Renal Inj Prev.
6:153–157. 2017. View Article : Google Scholar : PubMed/NCBI
|
|
30
|
Sung MJ, Kim DH, Jung YJ, Kang KP, Lee AS,
Lee S, Kim W, Davaatseren M, Hwang JT, Kim HJ, et al: Genistein
protects the kidney from cisplatin-induced injury. Kidney Int.
74:1538–1547. 2008. View Article : Google Scholar : PubMed/NCBI
|
|
31
|
Sobhy MM, Mahmoud SS, El-Sayed SH, Rizk
EM, Raafat A and Negm MSI: Impact of treatment with a protein
tyrosine kinase inhibitor (Genistein) on acute and chronic
experimental Schistosoma mansoni infection. Exp Parasitol.
185:115–123. 2018. View Article : Google Scholar : PubMed/NCBI
|
|
32
|
Shafiee G, Saidijam M, Tavilani H,
Ghasemkhani N and Khodadadi I: Genistein induces apoptosis and
inhibits proliferation of HT29 colon cancer cells. Int J Mol Cell
Med. 5:178–191. 2016.PubMed/NCBI
|
|
33
|
Qi W, Weber CR, Wasland K and Savkovic SD:
Genistein inhibits proliferation of colon cancer cells by
attenuating a negative effect of epidermal growth factor on tumor
suppressor FOXO3 activity. BMC Cancer. 11:2192011. View Article : Google Scholar : PubMed/NCBI
|
|
34
|
Pillai MS and Shivakumar K: Genistein
abolishes nucleoside uptake by cardiac fibroblasts. Mol Cell
Biochem. 332:121–125. 2009. View Article : Google Scholar : PubMed/NCBI
|
|
35
|
Guo Y, Zhang A, Ding Y, Wang Y and Yuan W:
Genistein ameliorates parathyroid hormone-induced
epithelial-to-mesenchymal transition and inhibits expression of
connective tissue growth factor in human renal proximal tubular
cells. Arch Med Sci. 9:724–730. 2013. View Article : Google Scholar : PubMed/NCBI
|
|
36
|
Nogueira A, Pires MJ and Oliveira PA:
Pathophysiological mechanisms of renal fibrosis: A review of animal
models and therapeutic strategies. In Vivo. 31:1–22. 2017.
View Article : Google Scholar : PubMed/NCBI
|
|
37
|
Wang Z, Han Z, Tao J, Wang J, Liu X, Zhou
W, Xu Z, Zhao C, Tan R and Gu M: Role of endothelial-to-mesenchymal
transition induced by TGF-β1 in transplant kidney interstitial
fibrosis. J Cell Mol Med. 21:2359–2369. 2017. View Article : Google Scholar : PubMed/NCBI
|
|
38
|
Diez-Marques L, Ortega-Velazquez R, Langa
C, Rodriguez-Barbero A, Lopez-Novoa JM, Lamas S and Bernabeu C:
Expression of endoglin in human mesangial cells: Modulation of
extracellular matrix synthesis. Biochim Biophys Acta. 1587:36–44.
2002. View Article : Google Scholar : PubMed/NCBI
|
|
39
|
Sutariya B and Saraf M: Betanin, isolated
from fruits of Opuntia elatior Mill attenuates renal fibrosis in
diabetic rats through regulating oxidative stress and TGF-β
pathway. J Ethnopharmacol. 198:432–443. 2017. View Article : Google Scholar : PubMed/NCBI
|
|
40
|
Song JH, Cha SH, Lee HJ, Lee SW, Park GH
and Kim MJ: Effect of low-dose dual blockade of renin-angiotensin
system on urinary TGF-β in type 2 diabetic patients with advanced
kidney disease. Nephrol Dial Transplant. 21:683–689. 2006.
View Article : Google Scholar : PubMed/NCBI
|
|
41
|
Samarakoon R, Overstreet JM, Higgins SP
and Higgins PJ: TGF-β1 → SMAD/p53/USF2 → PAI-1 transcriptional axis
in ureteral obstruction-induced renal fibrosis. Cell Tissue Res.
347:117–128. 2012. View Article : Google Scholar : PubMed/NCBI
|
|
42
|
Wu CF, Chiang WC, Lai CF, Chang FC, Chen
YT, Chou YH, Wu TH, Linn GR, Ling H, Wu KD, et al: Transforming
growth factor β-1 stimulates profibrotic epithelial signaling to
activate pericyte-myofibroblast transition in obstructive kidney
fibrosis. Am J Pathol. 182:118–131. 2013. View Article : Google Scholar : PubMed/NCBI
|
|
43
|
López-Hernández FJ and López-Novoa JM:
Role of TGF-β in chronic kidney disease: An integration of tubular,
glomerular and vascular effects. Cell Tissue Res. 347:141–154.
2012. View Article : Google Scholar : PubMed/NCBI
|
|
44
|
Lan HY: Diverse roles of TGF-β/Smads in
renal fibrosis and inflammation. Int J Biol Sci. 7:1056–1067. 2011.
View Article : Google Scholar : PubMed/NCBI
|
|
45
|
Hata A and Chen YG: TGF-β signaling from
receptors to smads. Cold Spring Harb Perspect Biol. 8(pii):
a0220612016. View Article : Google Scholar : PubMed/NCBI
|
|
46
|
Zhao K, He J, Zhang Y, Xu Z, Xiong H, Gong
R, Li S, Chen S and He F: Activation of FXR protects against renal
fibrosis via suppressing Smad3 expression. Sci Rep. 6:372342016.
View Article : Google Scholar : PubMed/NCBI
|
|
47
|
Fan K, Wu K, Lin L, Ge P, Dai J, He X, Hu
K and Zhang L: Metformin mitigates carbon tetrachloride-induced
TGF-β1/Smad3 signaling and liver fibrosis in mice. Biomed
Pharmacother. 90:421–426. 2017. View Article : Google Scholar : PubMed/NCBI
|
|
48
|
Li X, Han D, Tian Z, Gao B, Fan M, Li C,
Wang Y, Ma S and Cao F: Activation of cannabinoid receptor type II
by AM1241 ameliorates myocardial fibrosis via Nrf2-mediated
inhibition of TGF-β1/Smad3 pathway in myocardial infarction mice.
Cell Physiol Biochem. 39:1521–1536. 2016. View Article : Google Scholar : PubMed/NCBI
|
|
49
|
Qu Y, Zhang L, Kang Z, Jiang W and Lv C:
Ponatinib ameliorates pulmonary fibrosis by suppressing
TGF-β1/Smad3 pathway. Pulm Pharmacol Ther. 34:1–7. 2015. View Article : Google Scholar : PubMed/NCBI
|
|
50
|
Wang W, Zhou PH, Hu W, Xu CG, Zhou XJ,
Liang CZ and Zhang J: Cryptotanshinone hinders renal fibrosis and
epithelial transdifferentiation in obstructive nephropathy by
inhibiting TGF-β1/Smad3/integrin β1 signal. Oncotarget.
9:26625–26637. 2017.PubMed/NCBI
|
|
51
|
Feng J, Xie L, Kong R, Zhang Y, Shi K, Lu
W and Jiang H: RACK1 silencing attenuates renal fibrosis by
inhibiting TGF-β signaling. Int J Mol Med. 40:1965–1970.
2017.PubMed/NCBI
|
|
52
|
Liu R, Das B, Xiao W, Li Z, Li H, Lee K
and He JC: A novel inhibitor of homeodomain interacting protein
kinase 2 mitigates kidney fibrosis through inhibition of the
TGF-β1/Smad3 pathway. J Am Soc Nephrol. 28:2133–2143. 2017.
View Article : Google Scholar : PubMed/NCBI
|