Introduction
Mild cognitive impairment (MCI) is characterized by
mild impairment in cognitive function or memory, however, its
clinical features are not entirely consistent with the diagnostic
criteria for dementia. Patients with MCI retain the ability to
manage the majority of aspects of daily life. MCI is a transitional
state between normal cognitive function and dementia. Its etiology
and pathogenesis remain to be fully elucidated.
Previous studies have shown that there is a close
association between MCI and type 2 diabetes (1–3).
Glucolipotoxicity, insulin resistance, hypoglycemia and
Ca2+ homeostasis failure may markedly contribute to the
complex pathogenesis of diabetic MCI (4–6).
Investigating the pathogenesis and identifying novel therapeutic
targets are key to understanding cognitive function in
diabetes.
Irisin is a type of peroxisome
proliferator-activated receptor γ coactivator-1α (PGC-1α)-dependent
muscle factor. PGC-1α mediates energy metabolism, and regulates the
expression of uncoupling protein (UCP) 1 and heat production in
brown adipose tissue. In addition, it controls mitochondrial
biosynthesis and oxidative metabolism in multiple cells (7). PGC-1α stimulates the expression of
fibronectin type III domain-containing protein 5 in muscle tissue
(8). Following proteolysis, this
protein becomes irisin, which is released into the blood (8). Irisin enables the development of
brown adipose tissue from white adipose tissue via the activation
of UCP1 (9). UCP is a
mitochondrial inner membrane protein, which can eliminate the
transmembrane proton concentration difference on both sides of the
mitochondrial inner membrane, slowing down oxidative
phosphorylation driven by proton concentration difference, and
hindering the normal production of adenosine triphosphate (9). A previous report revealed that irisin
influenced the expression of UCP2-5 in different regions of the
brain, including the hypothalamus, pituitary gland, hippocampus,
cerebellum, striatum and cortex, which may have an effect on
certain brain functions (9). At
present, irisin is reported to have the following characteristics:
i) Exercise can increase the expression level of irisin (8,10,11);
ii) irisin can promote energy release in vitro and in
vivo (12); iii) irisin can
effectively reduce obesity and insulin resistance (13); and iv) irisin is involved in
glycolipid metabolism and is closely associated with brain tissue
(14,15).
Therefore, irisin may be involved in the
pathogenesis of diabetic MCI. In the present study, in order to
confirm this hypothesis and elucidate the associated mechanisms, a
diabetic animal model was established. The effects of irisin on the
levels of glycosylated hemoglobin A1c (GHbA1c), brain-derived
neurotrophic factor (BDNF) and advanced glycated end products
(AGEs) in serum, and on the level of BDNF in hippocampal tissues,
were investigated using gene silencing and via overexpressing
irisin. In addition, primary hippocampal nerve cells were isolated
from rats, in order to investigate the effects of irisin on cell
viability and the association between glucose concentration and
expression levels of BDNF in these cells.
Materials and methods
Materials and animals
Cy3-conjugated goat anti-rabbit IgG (cat. no.
CW0159), TRIzol reagent (cat. no. CW0580), the HiFiScript cDNA
synthesis kit (cat. no. CW2569) and UltraSYBR mixture (cat. no.
CW0957) were purchased from CWBio (Beijing, China). Fetal bovine
serum (FBS) was purchased from Biological Industries (Kibbutz Beit
Haemek, Israel; cat. no. 04-007-1A). High-carbohydrate and high-fat
diets were purchased from Hunan SLAC Jingda Laboratory Animal Co.,
Ltd. (Hunan, China; cat. no. M01-20170128). Horseradish
peroxidase-conjugated anti-rabbit immunoglobulin G (IgG) was
purchased from Boster Biological Technology (Pleasanton, CA, USA;
cat. no. SV0002). Neurobasal™ medium (cat. no.
21103049), serum-free B-27™ supplement (50X, cat. no.
17504044) and SuperSignal® chemiluminescent substrate
(cat. no. 34077) were purchased from Thermo Fisher Scientific, Inc.
(Waltham, MA, USA). Rabbit anti-BDNF monoclonal antibody (cat. no.
ab108319) and rabbit anti-microtubule-associated protein-2 (MAP-2)
polyclonal antibody (cat. no. ab32454) were purchased from Abcam
(Cambridge, MA, USA). Rat BDNF ELISA kit (cat. no. ml302829), rat
irisin ELISA kit (cat. no. ml0373721), rat GHbA1c ELISA kit (cat.
no. ml024079) and rat AGEs ELISA kit (cat. no. ml003305) were
obtained from Shanghai Enzyme-linked Biotechnology Co., Ltd.,
(Shanghai, China). Recombinant mouse β-nerve growth factor was
obtained from Sino Biological, Inc., (Beijing, China; cat. no.
50385-MNAC). Streptozotocin (STZ; cat. no. 415G0316) and
L-glutamine (cat. no. G0200) were purchased from Beijing Solarbio
Science & Technology Co., Ltd. (Beijing, China).
A total of 24 male Sprague-Dawley (SD) rats (4 weeks
old) were obtained from Shanghai Super-B&K Laboratory Animal
Co., Ltd. [License no. SCXK(HU)2013-0016; Shanghai, China]. The
animals were fed in a room at 18–26°C, with 40–70% relative
humidity, and a natural light/dark cycle. The animals had free
access to food and water. The study protocol was reviewed and
approved by the Institutional Animal Care and Use Committee of the
First Affiliated Hospital of Fujian Medical University (Fuzhou,
China).
Establishment of the type 2 diabetes
animal model
The 24 SD rats were provided with a normal diet for
1 week. Following acclimatization, the rats were randomly divided
into two groups (normal diet group, and high-carbohydrate and
high-fat diet group) according to the proportion of 1:3. The rats
in the latter group (n=18) were administered with the
high-carbohydrate and high-fat diet for 3 months. Subsequently, 1%
STZ was intraperitoneally injected into the rats at a dosage of 35
mg/kg. The rats in the former group (n=6) were administered with a
normal diet for 3 months, following which normal saline was
intraperitoneally injected into the rats. The blood glucose levels
were measured and rats were considered to be diabetic when levels
were >16.7 mmol/l.
Construction of overexpression and
interference vectors
The gene sequences of irisin were searched on NCBI
(https://www.ncbi.nlm.nih.gov/nuccore/?term=irisin) and
restriction enzyme sites (ClaI/ClaI) were introduced
into the sequences. The irisin genes were ligated to a
PDS166_pAd-CMV-GFPa1- IRES vector (Huayueyang Bio Technology Co.,
Ltd., Beijing, China) to construct an irisin overexpression vector.
In addition, a pair of short hairpin (sh)-RNA primers were designed
as follows, according to the gene sequences of irisin: Forward
5′-GATCCCCCTCTGTGAACATCATCAAACTCGAGTTTGATGATGTTCACAGAGGGTTTTTG-3′
and reverse
5′-AATTCAAAAACCCTCTGTGAACATCATCAAACTCGAGTTTGATGATGTTCACAGAGGGG-3′.
The interference segment was ligated to a pGenesil-1.2-irisin-shRNA
plasmid (Huayueyang Bio Technology Co., Ltd.), following which the
pShuttle-Basic-EGFP-irisin-shRNA recombinant shuttle and
pAdxsi-GFP-irisin- shRNA adenovirus vector (Huayueyang Bio
Technology Co., Ltd.) were constructed successively.
Animal grouping
The 24 rats were randomly divided into four groups
(n=6): Control, Model, Irisin and Irisin-shRNA. Normal diet-fed
rats served as the Control group. The Irisin and Irisin-shRNA
groups contained diabetic rats injected with the irisin
overexpression and interference vectors, respectively. The Model
group contained diabetic rats that had not undergone vector
injection. The rats in the Control and Model groups were injected
with normal saline. Following anesthesia via an intraperitoneal
injection of 1% pentobarbital sodium, the skin on the head of the
rats was shaved and smeared with iodophor. The skin was then cut
open. Subsequently, the hippocampal region was identified according
to the coordinates AP=4.8, 5 and 4.9, marked and then drilled. The
irisin overexpression and interference vectors were injected using
a microinjector at a dose of 5 µl per rat. The skin was then
sutured and the rats were raised for a further 3 weeks prior to
sample collection. Blood from the heart was collected and
centrifuged at 2,000 × g and room temperature for 10 min to prepare
the serum. The weights of the rats at the onset and end of the
experiments are presented in Table
I.
 | Table I.Weights of rats at the onset and end
of experiments. |
Table I.
Weights of rats at the onset and end
of experiments.
|
| Onset (g) | End (g) |
|---|
|
|
|
|
|---|
|
|
|
|
|---|
| Group | 1 | 2 | 3 | 4 | 5 | 6 | 1 | 2 | 3 | 4 | 5 | 6 |
|---|
| Control | 230 | 240 | 230 | 240 | 240 | 230 | 410 | 460 | 378 | 460 | 425 | 492 |
| Model | 230 | 220 | 230 | 230 | 230 | 240 | 258 | 264 | 311 | 294 | 328 | 301 |
| Irisin | 220 | 220 | 220 | 220 | 230 | 220 | 323 | 302 | 289 | 295 | 309 | 311 |
| Irisin-shRNA | 210 | 210 | 220 | 230 | 220 | 220 | 348 | 321 | 329 | 301 | 353 | 301 |
ELISA assay
The reagents in the ELISA kits were incubated at
room temperature for 30 min prior to use. The ELISA assay was
performed according to the manufacturer's protocol. Briefly, 50 µl
of standard and diluted serum were added into the respective wells
of plates. Subsequently, 100 µl of enzyme-linked reagents were
added into each well. The plates were incubated at 37°C for 60 min.
The mixture in each well was discarded and the developing agents
were added. The plates were placed in the dark for 20 min and the
absorbance of each well was determined at 450 nm using a microplate
reader (RT-6100; Rayto Life And Analytical Sciences Co., Ltd.,
Shenzhen, China). Zero was set based on blank control wells, which
were not exposed to standards, samples or enzyme-linked
reagents.
Immunohistochemical analysis
The hippocampal tissues were collected, fixed in
paraformaldehyde at 4°C overnight, embedded with paraffin and cut
into slices (4 µm) on a microtome (BQ-318D; Bona Medical
Technology, Hubei, China). Following incubation at 75°C for 1.5 h,
the slices were immersed in xylene for 10 min and then in fresh
xylene for a further 10 min. The slices were then successively
incubated in 100, 95 or 80% ethanol and purified water for 3 min
each. Following this, the slices were incubated in citrate buffer
solution (antigen retrieval buffer) in a box. Once the antigen
retrieval buffer was discarded, the slices were eluted with
phosphate buffer solution (PBS) and incubated in fresh 3% hydrogen
peroxide in a wet box at room temperature for 10 min to remove
endogenous peroxidase blocking buffer. The slices were sufficiently
eluted with PBS and normal goat serum (Thermo Fisher Scientific,
Inc.) was added dropwise onto the slices at room temperature for 30
min. Excess solution was discarded. Diluted BDNF antibody (1:1,000)
was added dropwise onto each slice. Following incubation at 4°C
overnight, the slices were sufficiently rinsed with PBS. Secondary
antibody buffer (1:2,000) was added dropwise onto each slice.
Following incubation at room temperature for 1 h, the slices were
rinsed, stained, dehydrated, mounted and examined under a
microscope (CX41; Olympus Corporation, Tokyo, Japan). Quantitative
analysis was performed using Image-Pro Plus 6.0 software (Media
Cybernetics, Inc., Rockville, MD, USA).
Isolation and culture of primary
hippocampal nerve cells
The diabetic rats were disinfected with 75% ethanol.
The brain was collected following decapitation and immersed in
precooled Hank's balanced salt solution (HBSS). The bilateral
hippocampus was isolated and the pia mater and blood vessels were
removed microscopically. The isolated hippocampus was immersed in
0.125% trypsin and agitated in a water bath at 37°C for 15 min.
Once trypsin was removed, the hippocampus was washed twice with
HBSS and suspended in DMEM (Nanjing KeyGen Biotech Co., Ltd.,
Nanjing, China) containing 10% FBS (Biological Industries). The
cell suspension was sieved using a 70-µm sieve and then seeded into
high-carbohydrate DMEM containing 10% FBS, 1% sodium pyruvate and
1% glutamine. Following culture at 37°C for 4 h, the medium was
replaced by Neurobasal™ medium containing 2%
B-27™ and 1% glutamine for further culture. Half of the
medium was replaced every 3 days.
Immunofluorescent analysis
Coverslips with growing cells in plates were washed
three times in PBS for 3 min each time. The cells growing on the
coverslips were fixed in 4% paraformaldehyde for 15 min and washed
in PBS. They were then incubated in 0.5% Triton X-100 at room
temperature for 20 min. Following washing with PBS, residual PBS
was blotted using absorbent paper and normal goat serum was added
dropwise onto the coverslips at room temperature for 30 min. The
blocking buffer was also blotted using absorbent papers. Diluted
primary antibodies (MAP-2 antibody, 1:200) were added dropwise.
Following incubation at 4°C overnight, the coverslips were washed
in PBS- 0.05% Tween-20 (PBST) and the residual solution was blotted
with absorbent papers. Diluted secondary antibody buffer (1:200)
was added dropwise. Following incubation at 37°C for 1 h, the
coverslips were washed in PBST and incubated with
4′,6-diamidino-2-phenylindole (DAPI) in the dark for 5 min. The
coverslips were subsequently washed in PBST and the residual
solution was blotted with absorbent papers. The coverslips were
mounted with fluorescent mounting medium and evaluated using a
fluorescence microscope (742BR1154; Bio-Rad Laboratories, Inc.,
Hercules, CA, USA).
Cell viability
The cells were seeded in 96-well plates. When cell
confluence reached 80%, 50 µl of methyl thiazolyl tetrazolium (MTT,
0.5 mg/ml) was added into each well. Following culture for a
further 4 h, the culture media was discarded and 200 µl DMSO was
added. Once the crystal was fully dissolved by vibration for 10
min, the absorbance was determined at 490 nm using a microplate
reader (Infinite F200/M200; Tecan Group, Ltd., Männedorf,
Switzerland). The relative cell viability was then calculated.
Fluorogenic reverse
transcription-quantitative polymerase chain reaction (RT-qPCR)
analysis
When the cells grew to 80% confluence, they were
cultured for 48 h in media containing different concentrations of
glucose: 0 (Control), 5.5, 15 and 25 mmol/l. Total RNA from
multiple cells was extracted using TRIzol reagent and reverse
transcribed into cDNA using the HiFiScript cDNA synthesis kit,
according to the manufacturer's protocol. The primer sequences of
the BDNF and Glyceraldehyde-3-phosphate dehydrogenase (GAPDH)
primers are listed in Table II.
PCR system (25 µl) included RNase free dH2O 9.5 µl, cDNA 1 µl,
forward primer 1 µl, reverse primer 1 µl, and 2XULtraSYBR Mixture
12.5 µl (cat. no. CW0957; CWBIO, Beijing, China). The reaction
parameters were set as follows: Pre-denaturation for 10 min at
95°C, denaturation for 10 sec at 95°C, annealing for 30 sec at
51.5°C, elongation for 30 sec at 72°C, for 40 cycles. The
dissociation curve was analyzed as follows: 15 sec at 95°C, 1 min
at 51.5°C, 15 sec at 95°C, 15 sec at 51.5°C, 15 sec at 51.5°C, and
measured stepwise from 95°C every 0.5°C. The analysis was
eventually performed on a fluorogenic qPCR detection system (CFX
Connect™; Bio-Rad Laboratories, Inc.). GAPDH served as
the internal control.
| Table II.Primers for polymerase chain reaction
analysis. |
Table II.
Primers for polymerase chain reaction
analysis.
| Gene | Primer (5′-3′) |
|---|
| BDNF | Forward:
GCTTATCCTGGTCTTCGG |
|
| Reverse:
CTGGGTTGAATGACCTGTT |
| Irisin | Forward:
AAGTGGTCATTGGCTTTGC |
|
| Reverse:
GTTGTTATTGGGCTCGTTGT |
| GAPDH | Forward:
GCAAGTTCAACGGCACAG |
|
| Reverse:
CGCCAGTAGACTCCACGAC |
The level of irisin in primary hippocampal nerve
cells was also determined. Total RNA from the primary hippocampal
nerve cells was extracted using TRIzol reagent and reverse
transcribed into cDNA using the HiFiScript cDNA synthesis kit,
according to the manufacturer's protocol. The primer sequences of
irisin and GAPDH are listed in Table
II. The reaction parameters were set as follows:
Pre-denaturation for 10 min at 95°C, denaturation for 10 sec at
95°C, annealing for 30 sec at 57°C, elongation for 30 sec at 72°C,
for 40 cycles. The dissociation curve was analyzed as follows: 15
sec at 95°C, 1 min at 57°C, 15 sec at 95°C, 15 sec at 57°C, 15 sec
at 57°C, and measured stepwise from 95°C every 0.5°C. The analysis
was performed on a fluorogenic qPCR detection system (CFX
Connect™; Bio-Rad Laboratories, Inc.). GAPDH served as
the internal control. Relative expression levels of genes were
calculated by using the 2−ΔΔCq method (16).
Western blot analysis
The cells were 37°C cultured for 48 h in media
containing different concentrations of glucose: 0 (Control), 5.5,
15 and 25 mmol/l. The cells were incubated in a lysis buffer in an
ice-bath for 30 min, and the resulting lysate was centrifuged at
9,000 × g and 4°C for 10 min. The supernatant was carefully
collected to acquire total protein. A BCA protein assay kit was
used to measure protein concentration. The protein was denatured
and 10 µl protein was loaded into gel lanes to perform SDS-PAGE
(12%) for 1–2 h. Polyvinylidene fluoride membrane transfer was
performed using the wet transfer method for 30–50 min, and the
membrane was subsequently incubated in anti-BDNF antibody buffer
(1:2,000) at 4°C overnight. It was then rinsed and incubated in
secondary antibody buffer (dilution 1:2,000) at room temperature
for 1–2 h. Following the addition of chemiluminescent substrate,
the membrane was exposed on a gel imaging system
(ChemiDoc™ XRS+; Bio-Rad Laboratories, Inc.).
Quantitative analysis was performed using Quantity One software
(v4.62, Bio-Rad Laboratories, Inc.). GAPDH served as the internal
control.
Statistical analysis
The experiments were repeated in triplicate. Data
are presented as the mean ± standard deviation. Statistical
analysis was performed by one-way analysis of variance followed by
a Tukey's post hoc test, using SPSS software (version 19.0, IBM
Corps., Armonk, NY, USA). P<0.05 was considered to indicate a
statistically significant difference.
Results
Blood glucose levels
The blood glucose levels of rats in the Control,
Model, Irisin and Irisin-shRNA groups are presented in Table III. The glycemic concentration in
all rats in the Model, Irisin and Irisin-shRNA groups was >16.7
mmol/l, suggesting the successful establishment of the diabetic
model.
| Table III.Blood glucose levels in the rats of
the control, Model, Irisin, and Irisin-shRNA groups. |
Table III.
Blood glucose levels in the rats of
the control, Model, Irisin, and Irisin-shRNA groups.
|
| Blood glucose level
(mmol/l) |
|---|
|
|
|
|---|
| Group | 1 | 2 | 3 | 4 | 5 | 6 |
|---|
| Control | 4.6 | 4.5 | 3.4 | 3.1 | 3.4 | 3.7 |
| Model | 23.9 | 21.6 | 31.0 | 25.9 | 28.6 | 27.4 |
| Irisin | 25.3 | 26.0 | 25.1 | 26.4 | 28.6 | 29.1 |
| Irisin-shRNA | 32.9 | 30.2 | 21.6 | 25.6 | 29.2 | 24.3 |
Serum levels of irisin, BDNF, GHbA1c
and AGEs
The levels of irisin, BDNF, GHbA1c and AGEs in the
serum of the rats in the Control, Model, Irisin and Irisin-shRNA
groups, as determined by ELISA assays, are shown in Fig. 1. It was revealed that, compared
with the Control group, the levels of irisin and BDNF in the Model
and Irisin-shRNA groups were significantly decreased, and the
levels of GHbA1c and AGEs were significantly increased (all
P<0.05). However, the levels of irisin and BDNF in the Irisin
group were significantly higher than those in the Model group, and
the levels of GHbA1c and AGEs in the Irisin group were
significantly lower (all P<0.05). Irisin-shRNA significantly
downregulated the expression levels of irisin and BDNF and
upregulated those of GHbA1c and AGEs, compared with those in the
Model group (all P<0.05).
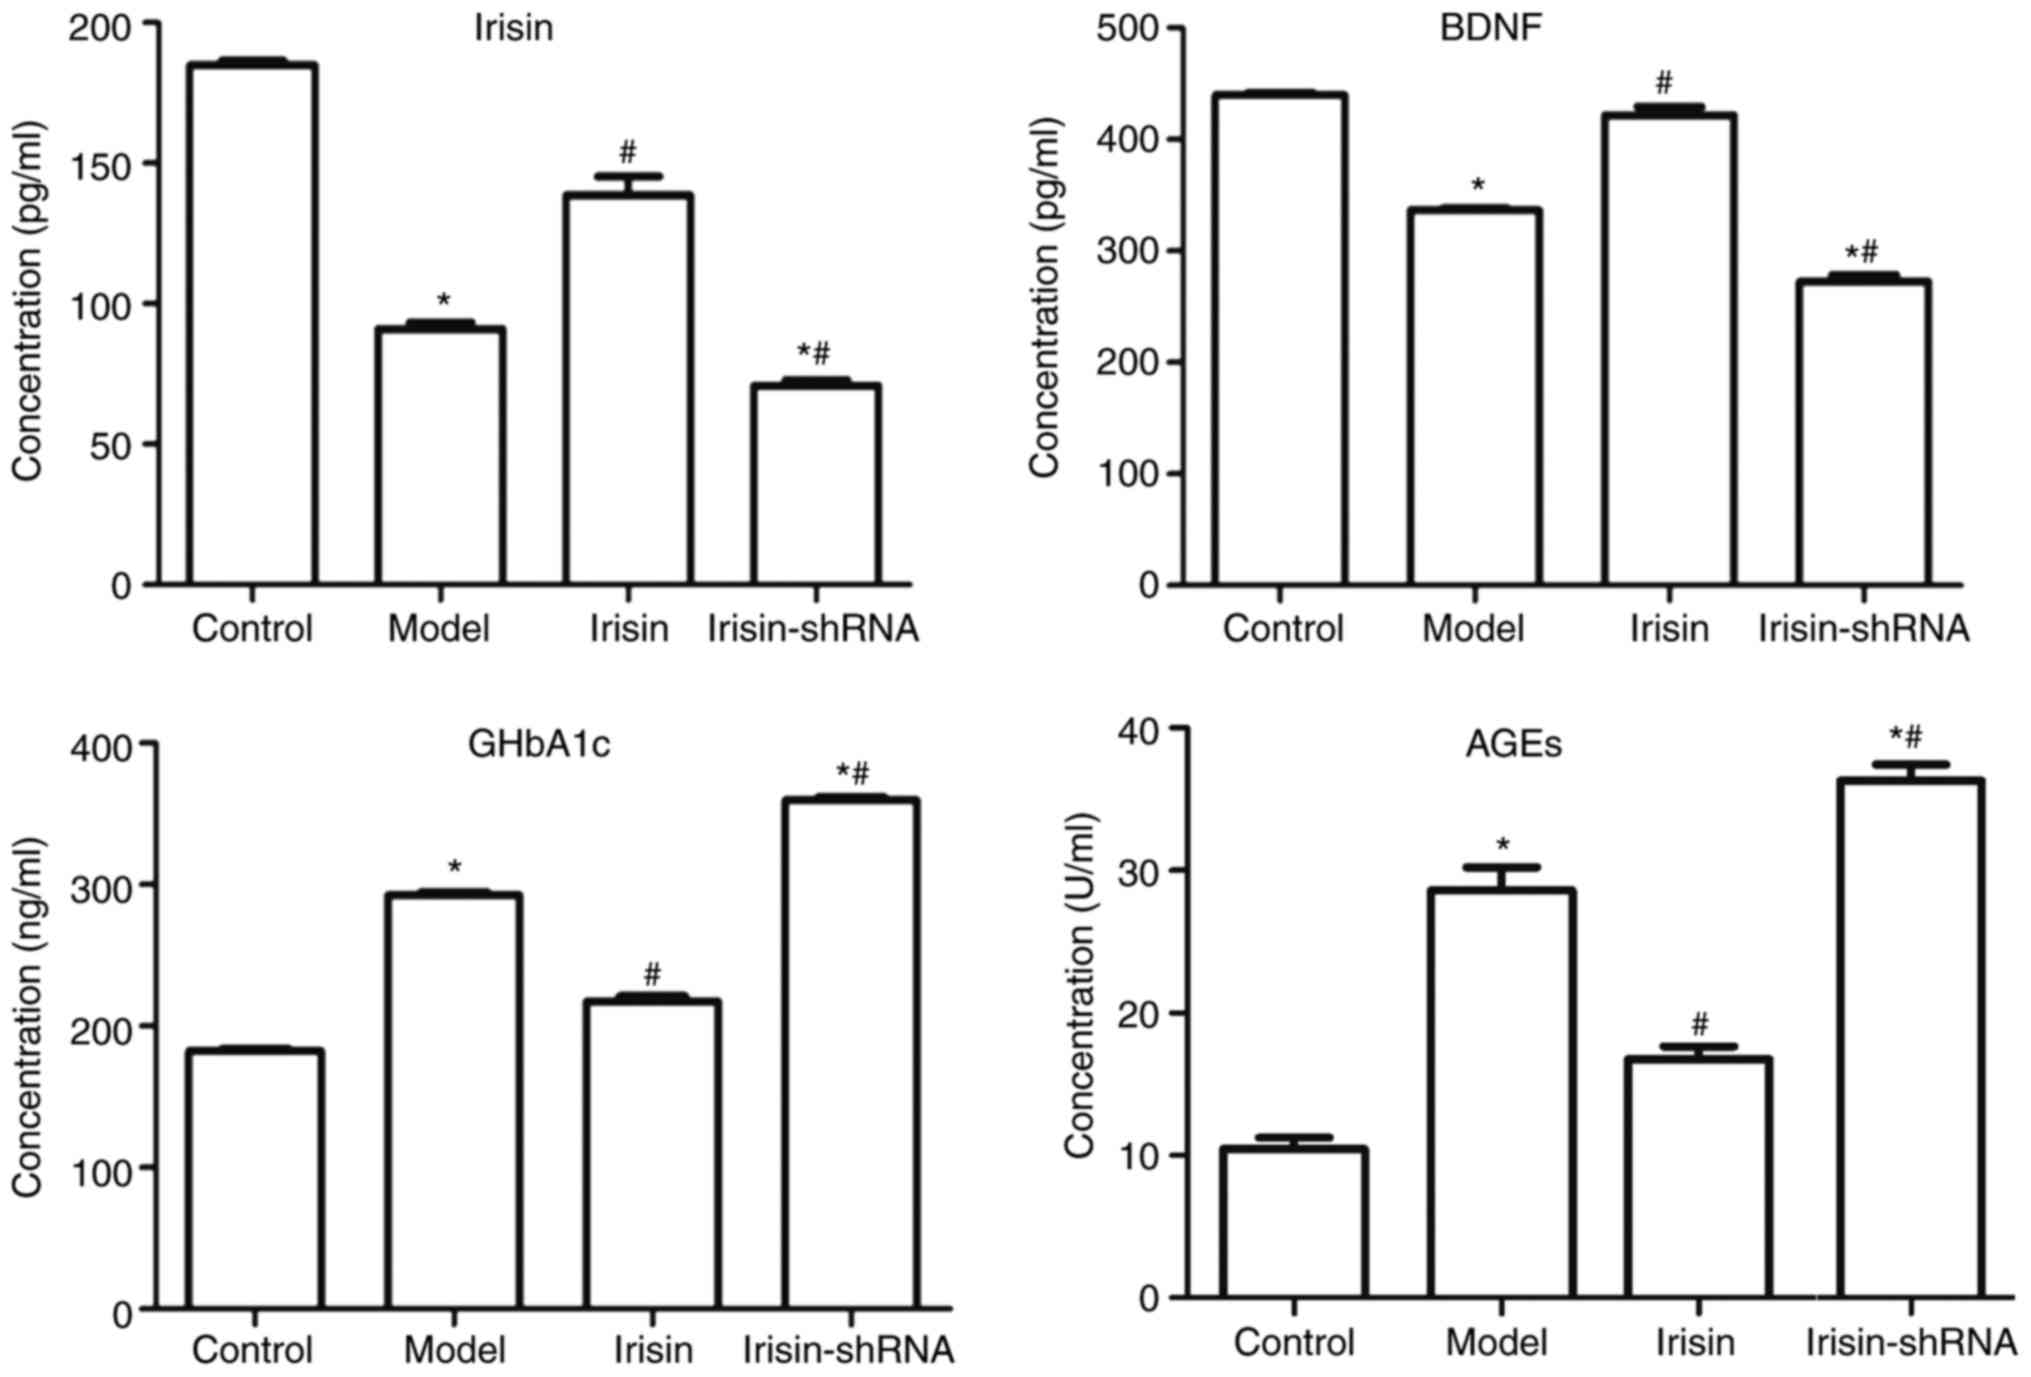 | Figure 1.Levels of irisin, BDNF, GHbA1c and AGE
in the serum of rats in the Control, Model, Irisin and Irisin-shRNA
groups, as determined by ELISA. *P<0.05, vs. the Control group;
#P<0.05, vs. the Model group. BDNF, brain-derived
neurotrophic factor; GHbA1c, glycosylated hemoglobin A1c; AGE,
advanced glycated end product; shRNA, short hairpin RNA. |
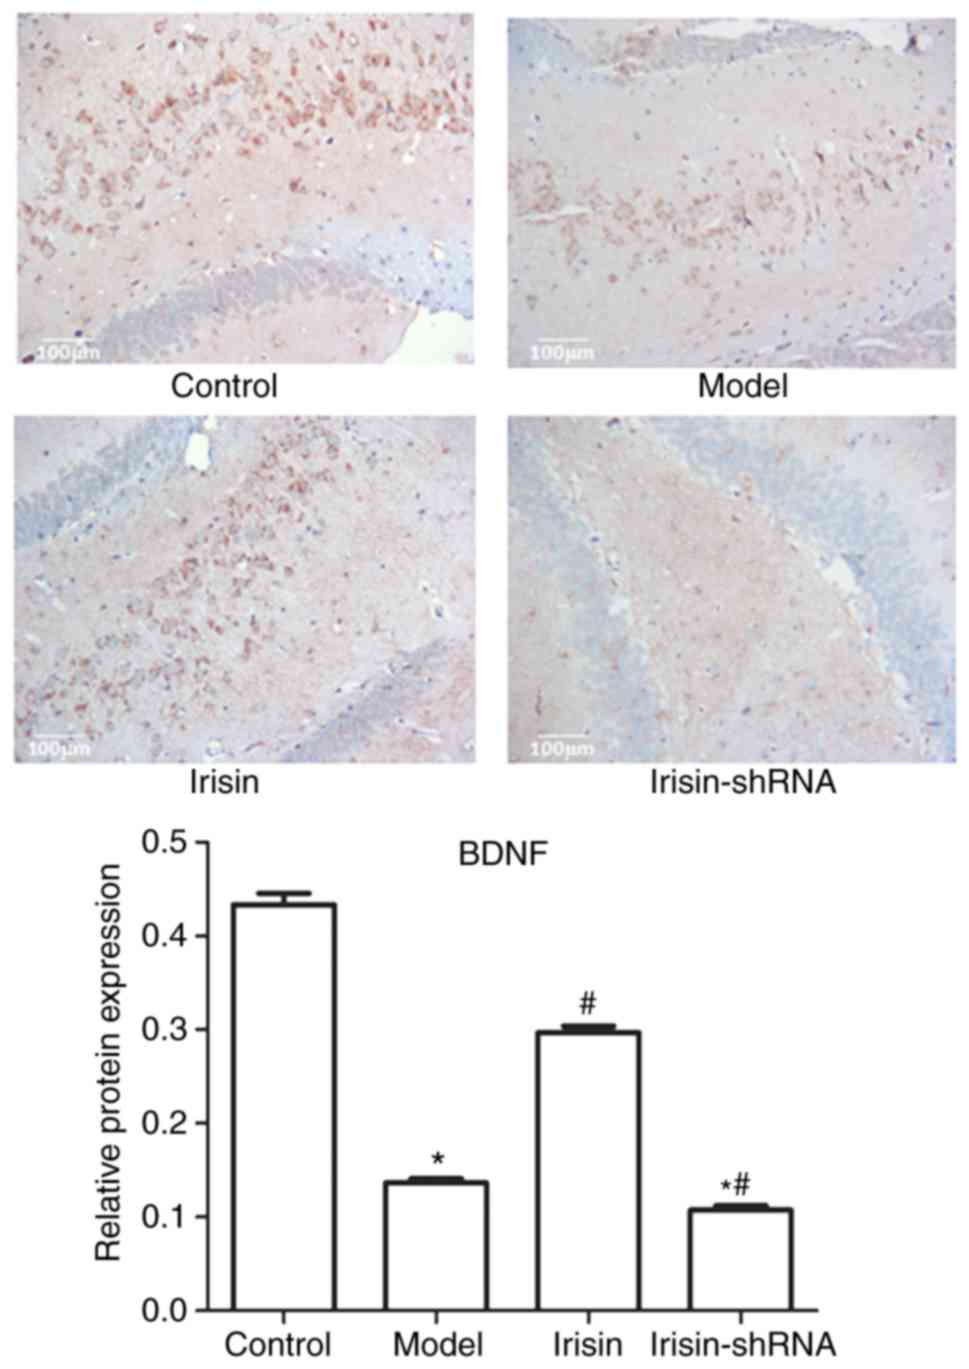
Expression of BDNF in the hippocampal
tissue
The expression of BDNF in the hippocampal tissues of
rats in the Control, Model, Irisin and Irisin-shRNA groups, as
evaluated by immunohistochemical analysis, is shown in Fig. 2. Brown staining represents the
expression of BDNF. High expression of BDNF was observed in the
Control and Irisin groups, whereas expression was low in the Model
and Irisin-shRNA groups. The quantitative result in the hippocampal
tissue was consistent with that observed in the serum. Compared
with the Control group, the expression levels of BDNF in the Model
and Irisin-shRNA groups were markedly downregulated (P<0.05).
However, compared with that in the Model group, the expression of
BDNF in the Irisin group was markedly upregulated (P<0.05).
Following irinsin-shRNA treatment, the expression of BDNF was
significantly downregulated, compared with that in the Model group
(P<0.05).
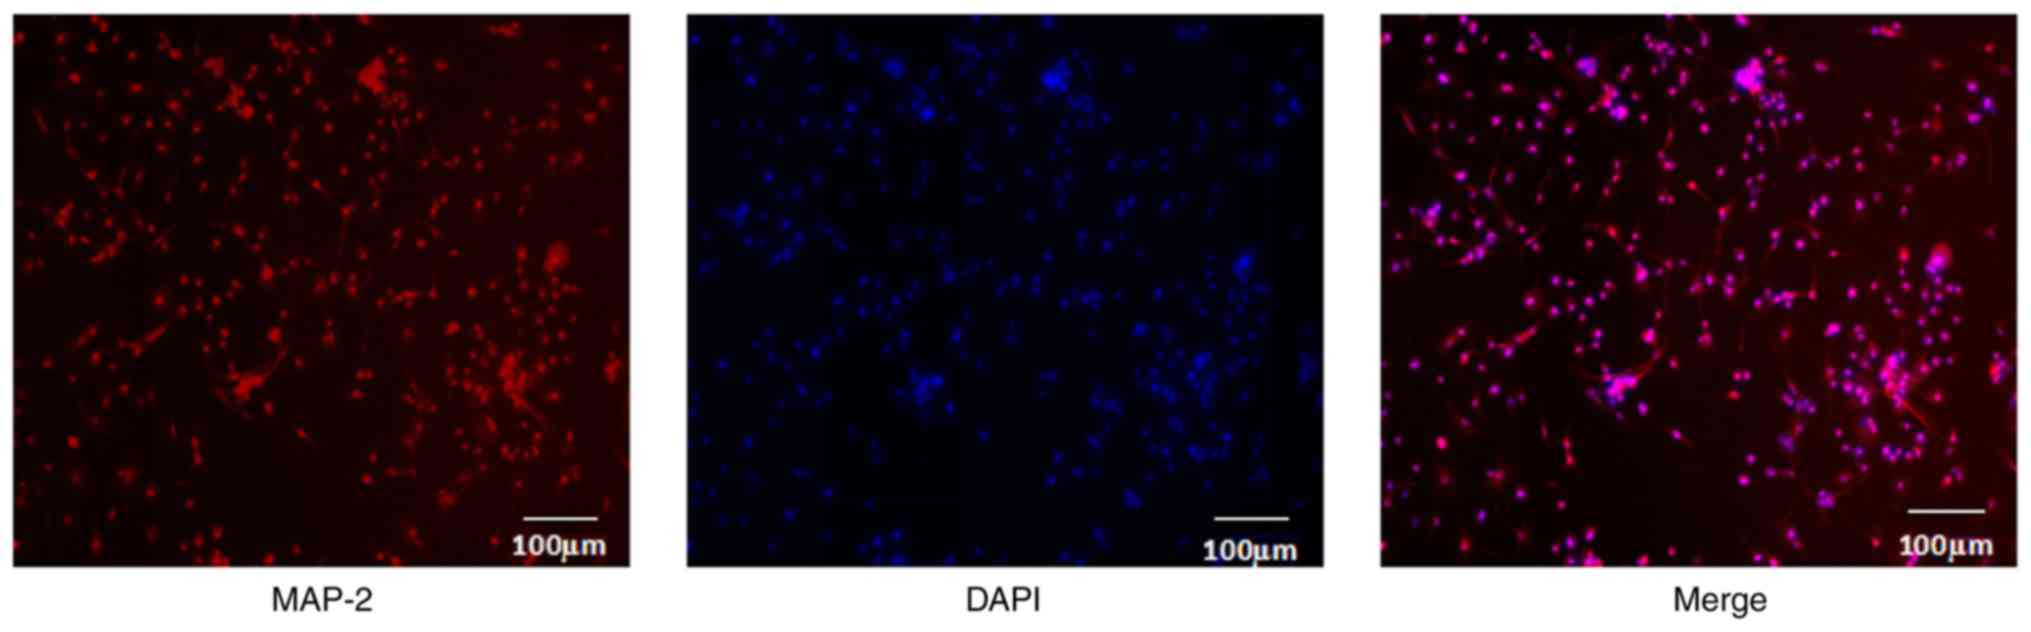
Isolation and identification of
primary hippocampal nerve cells
Images of the isolated primary hippocampal nerve
cells from diabetic rats, as identified by immunofluorescent
analysis, are shown in Fig. 3. The
isolated primary cells grew well. MAP-2 protein is a specific
protein of the hippocampal neuron. Red fluorescence indicates
positive protein expression of MAP-2, and DAPI-emitted blue
fluorescence indicates the cellular nuclei. It was demonstrated
that there was >98% overlap (pink) of red and blue fluorescence
following merging, indicating that the purity of the primary
hippocampal nerve cells was >98%. Therefore, primary hippocampal
nerve cells were successfully isolated and cultured.
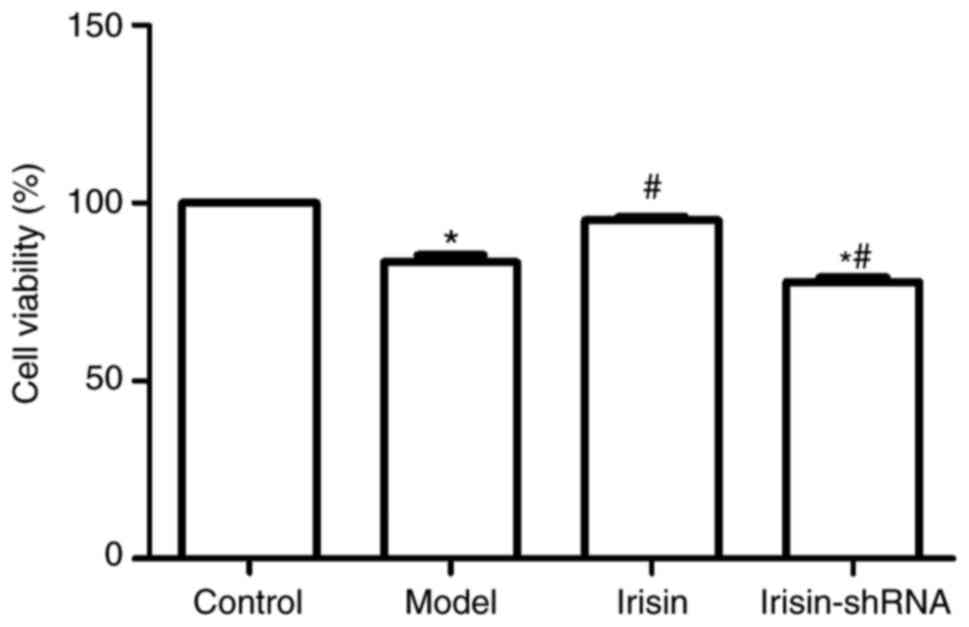
Cell viability
Cell viability in the various groups, as determined
by the MTT assay, is shown in Fig.
4. The viability of primary hippocampal nerve cells from the
diabetic rats was markedly decreased (P<0.05), and was further
reduced following the irisin-shRNA injection (P<0.05). However,
a marked improvement in cell viability was observed following
irisin treatment (P<0.05).
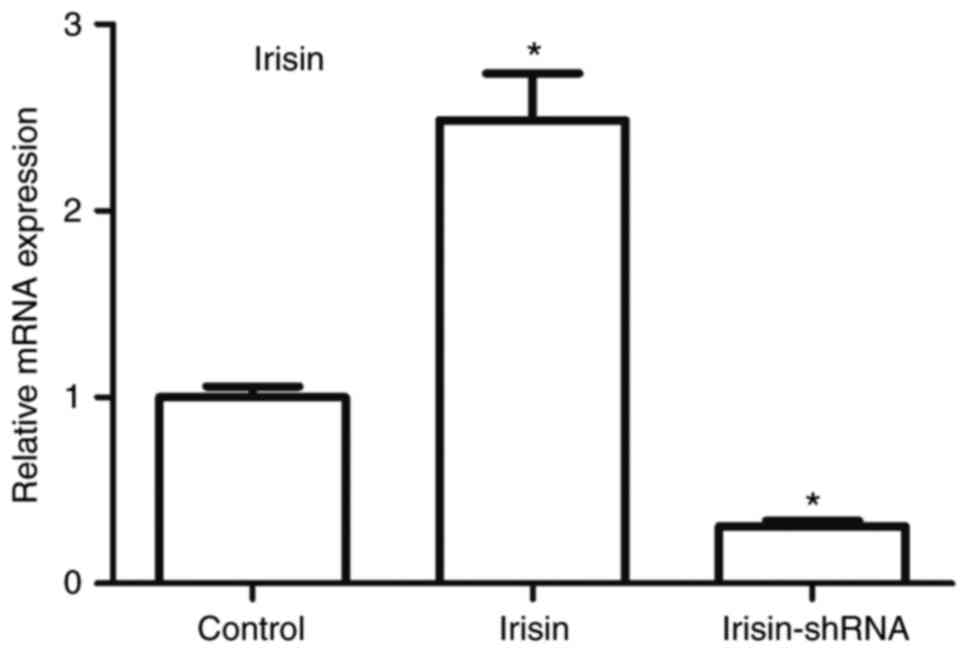
Irisin levels in primary hippocampal
nerve cells
Irisin levels in the primary hippocampal nerve
cells, as determined by fluorogenic RT-qPCR analysis, is shown in
Fig. 5. Following the
administration of irisin and irisin-shRNA, the levels of irisin in
the primary hippocampal nerve cells were markedly increased and
decreased, respectively (P<0.05). This indicated the successful
transfection of irisin and irisin-shRNA genes.
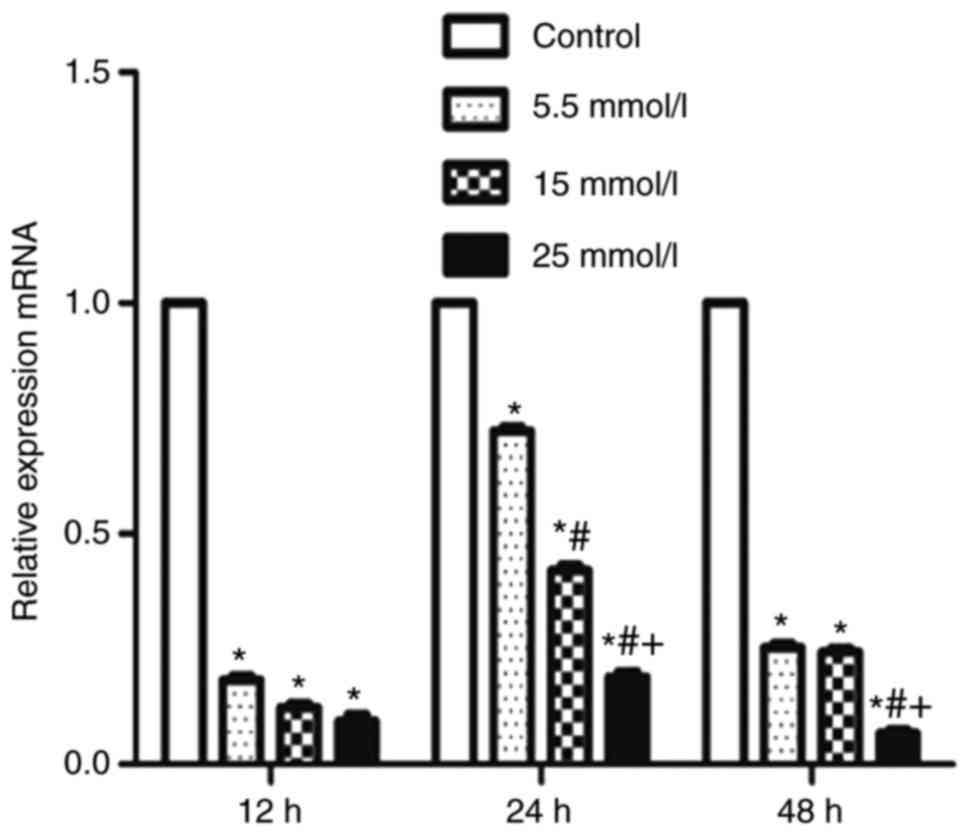
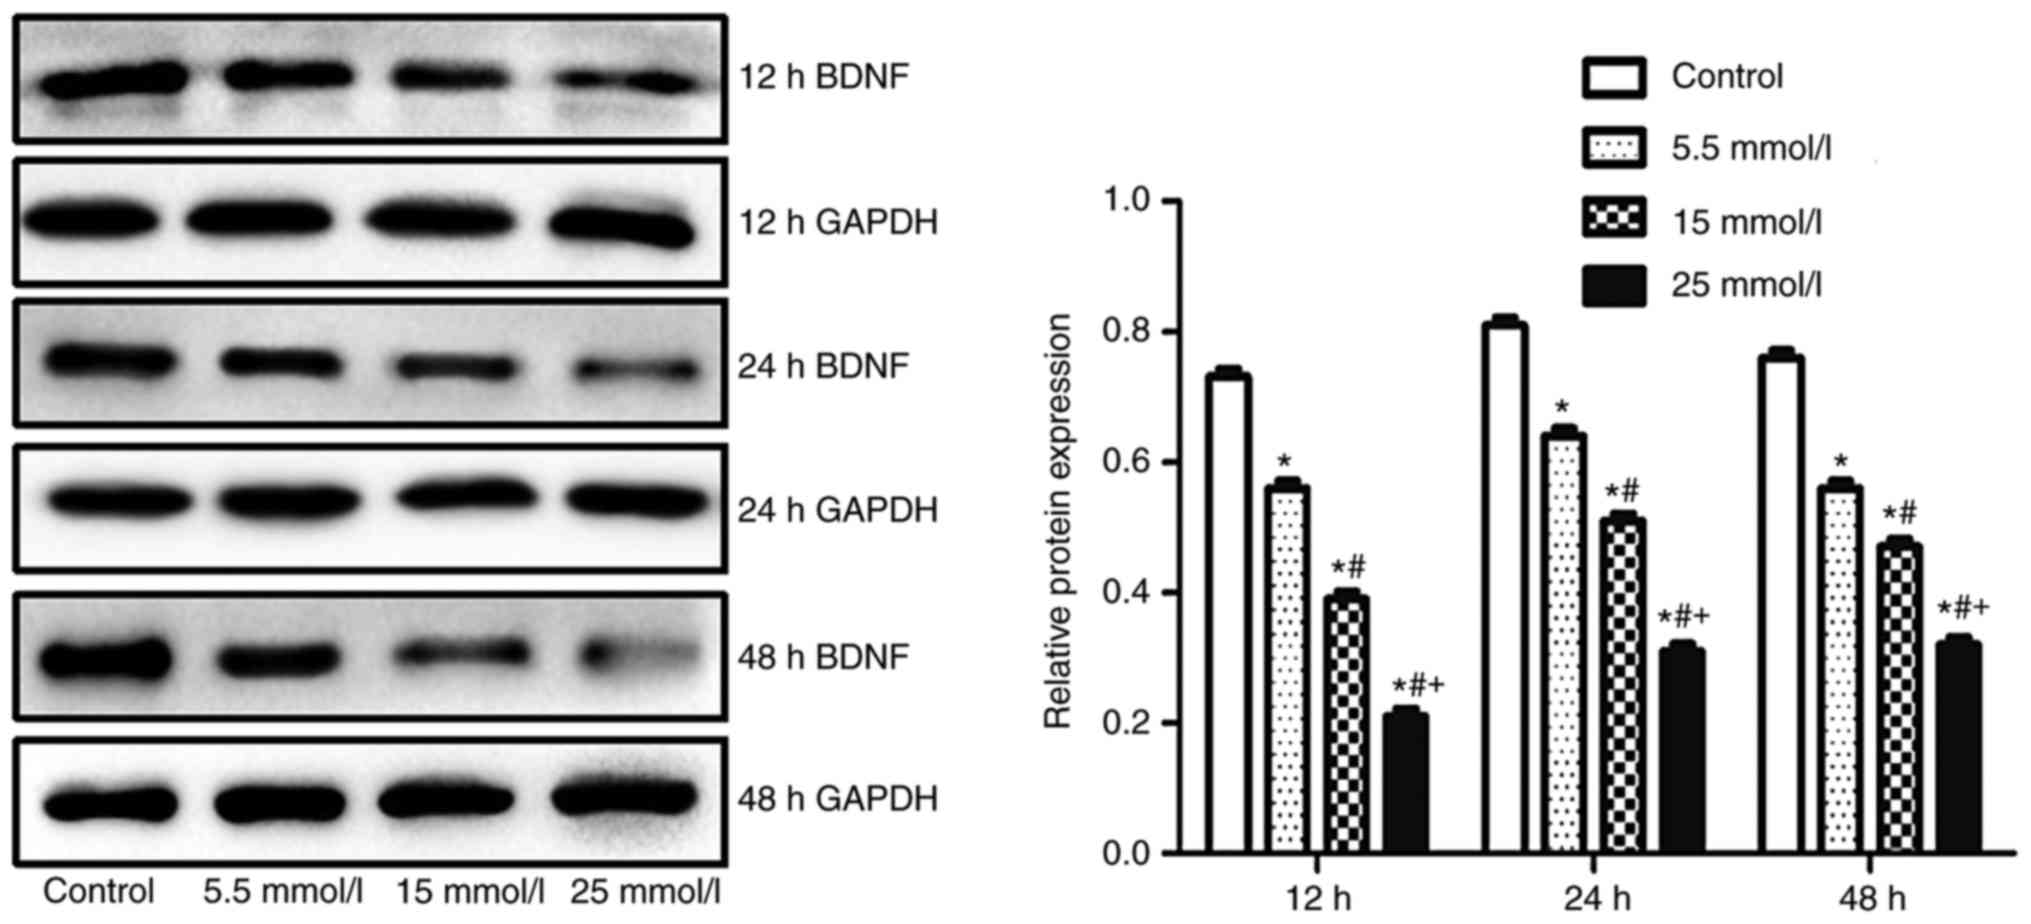
Expression of BDNF in primary
hippocampal nerve cells
The expression of BDNF in the primary hippocampal
nerve cells of diabetic rats, as determined by fluorogenic RT-qPCR
and western blot analyses, is presented in Figs. 6 and 7, respectively. The primary hippocampal
nerve cells were exposed to different concentrations of glucose: 0
(Control), 5.5, 15 and 25 mmol/l for 12, 24 and 48 h. Data from
fluorogenic RT-qPCR analysis exhibited that, compared with the
control, glucose exposure (5.5, 15 and 25 mmol/l) for 12, 24 and 48
h markedly decreased the mRNA production of BDNF in the primary
hippocampal nerve cells of rats (all P<0.05). In addition, the
mRNA level of BDNF was significantly reduced with the increase of
glucose concentration, particularly at the 24- and 48-h time-points
(P<0.05). Similar results were observed by the qualitative and
quantitative western blot analyses. The protein expression of BDNF
in the primary hippocampal nerve cells of rats following glucose
exposure (5.5, 15 and 25 mmol/l) for 12, 24 and 48 h was observed
to be significantly lower than that of the control (all P<0.05).
Further glucose exposure for 12, 24 and 48 h was shown to
significantly decrease the protein expression of BDNF (all
P<0.05).
Discussion
MCI is a cognitive disorder syndrome. Compared with
normal individuals of a similar age and educational background,
patients with MCI exhibit mild cognitive decline, although this
does not have an apparent effect on their daily lives (17). The main symptom of MCI is the
impairment of cognitive function. According to etiology or
location, brain damage can affect one or more cognitive functions,
including memory, executive function, language, application and
visuospatial structure. As a member of the neurotrophin family,
BDNF maintains the integrity of adult neurons and provides
important neurotrophic support. It is important in the regulation
of synaptic structure, neurotransmission, and the maintenance and
consolidation of long-term potentiation, thereby affecting the
processes of learning and memory (18). Under normal circumstances, it is
abundant in the hippocampus and cerebral cortex (18). An autopsy study indicated that the
protein level of BDNF was clearly decreased in the hippocampus and
cortex of patients with MCI (19),
and an animal study confirmed that the level of BDNF in the brain
tissue of humans was positively correlated with that in the serum
(20). The expression level of
BDNF in the serum of patients with Alzheimer's disease was observed
to be decreased, suggesting that a change in BDNF levels in the
serum can, to a certain extent, reflect its change in the brain
tissue (21). Exercise can not
only increase the expression of irisin, but also effectively
improve cognitive dysfunction, which has been revealed to be
associated with the upregulation of BDNF (22).
GHbA1c is a binding product of hemoglobin in red
blood cells and blood glucose. The level of GHbA1c can usually
reflect the blood glucose control of patients from the past 8–12
weeks. The generation of GHbA1c from the binding of blood glucose
and hemoglobin is irreversible and directly proportional to blood
glucose concentration (23). In
elderly patients with type 2 diabetic MCI, the levels of irisin and
BDNF in the serum were decreased and, with the exception of
hypertension and age, GHbA1c was identified as an independent risk
factor for cognitive impairment (24,25).
GHbA1c usually serves as a biomarker for cognitive impairment
(24,25). Therefore, in the present study, the
level of GHbA1c was investigated in order to determine cognitive
impairment.
AGEs are known to be associated with cognitive
function in patients with diabetes mellitus. The non-enzymatic
glycosylation of various proteins in the body, induced by
continuous hyperglycemia and the resulting AGEs, are important in
the pathogenesis of chronic diabetes complications (26). The level of AGEs in diabetic rats
is increased (26). AGEs cause
changes in the molecular structure and composition of extracellular
matrix, resulting in alterations in matrix function (27). In a previous study,
immunohistochemical analysis indicated the appearance of AGEs in
thickened mesangium and glomerular basement membrane (27).
In the present study, the diabetic model in SD rats
was established by an intraperitoneal injection of STZ combined
with a high-carbohydrate and high-fat diet; a glycemic
concentration >16.7 mmol/l confirmed successful establishment of
the diabetic model. The levels of BDNF and irisin in the serum of
diabetic rats were decreased, whereas the levels of GHbA1c and AGEs
were increased. In addition, it was found that, when the irisin
level was enhanced, the above results were reversed. The results
from gene silencing and overexpression technologies indicated that
irisin was able to positively regulate the expression of BDNF and
negatively influence the levels of GHbA1c and AGEs, suggesting that
irisin influences cognitive dysfunction in rats with type 2
diabetes by regulating the expression of BDNF and glycometabolism.
Of note, not injecting control (scrambled) RNA into the rats of the
Model group was a limitation of the present study.
In order to further elucidate the mechanism
underlying the effect of irisin on cognitive dysfunction in rats
with type 2 diabetes, the effects of irisin on the viability of the
primary hippocampal nerve cells was investigated, and the
association between glucose concentration and the expression of
BDNF in primary hippocampal nerve cells of diabetic rats was
examined. The primary hippocampal nerve cells were successfully
isolated and identified through the double-labeling of specific
protein MAP-2 and cellular nuclei. The vitality of the primary
hippocampal nerve cells from diabetic rats was markedly decreased;
however, marked improvement was observed following irisin
treatment. Furthermore, the expression of BDNF in the primary
hippocampal nerve cells was observed to decrease as glucose
concentration and glucose exposure time increased. The results of
the present study were consistent with those of a previous report
which revealed that, when glucose concentration increased, the
ratio of paraventricular nucleus (PVN) neurons decreased, resulting
in a decrease in the expression of BDNF (28). BDNF had direct independent effects
on PVN neurons, which were regulated by local glucose concentration
(28). These results demonstrated
that irisin in the serum enhance the vitality of primary
hippocampal nerve cells and affect glycometabolism in rats with
type 2 diabetes.
However, certain signaling pathways may differ
between rats and humans, therefore, investigations on human serum
are required. The repetition and validation of the findings of the
present study are also required, due to possible rat reactivity to
specific factors. In addition, the western blot analysis results
were semiquantitative and, as ELISA is an example of a quantitative
technique, future investigations on human serum require
quantification using ELISA rather than western blot analysis.
In conclusion, irisin was shown to regulate the
expression of BDNF and glycometabolism in rats with type 2
diabetes. Irisin may serve as a promising novel target for the
treatment of diabetic MCI. The development of irisin-targeting
drugs and therapies may assist in preventing the occurrence of MCI
in type 2 diabetes. The results of the present study are of
positive significance for the prevention of diabetic dementia.
Acknowledgements
Not applicable.
Funding
The present study was financially supported by the
Youth Training Programs of the Health System of Fujian Province
(grant no. 2014-ZQN-JC-16).
Availability of data and materials
The datasets used and/or analyzed during the present
study are available from the corresponding author on reasonable
request.
Authors' contributions
LH and LY designed study and wrote paper. SY and LL
collected and analyzed data. All authors performed study. All
authors read and approved the final manuscript.
Ethics approval and consent to
participate
The study protocol was reviewed and approved by the
Institutional Animal Care and Use Committee of the First Affiliated
Hospital of Fujian Medical University.
Patient consent for publication
Not applicable.
Competing interests
The authors declare that they have no competing
interests.
References
|
1
|
Schnaider Beeri M, Goldbourt U, Silverman
JM, Noy S, Schmeidler J, Ravona-Springer R, Sverdlick A and
Davidson M: Diabetes mellitus in midlife and the risk of dementia
three decades later. Neurology. 63:1902–1907. 2004. View Article : Google Scholar : PubMed/NCBI
|
|
2
|
Su J, Li H and Yang W: Diabetes associated
cognitive impairment: A problem should not be ignored. Chin J
Endocrinol Metab. 24:476–479. 2008.
|
|
3
|
Qu MH, Fang CY, Zhang XR, Zhao CZ, Mao SM
and Gao ZQ: Type 2 diabetes and mild cognitive impairment. Prog
Biochem Biophys. 39:791–795. 2012. View Article : Google Scholar
|
|
4
|
Munshi M, Grande L, Hayes M, Ayres D, Suhl
E, Capelson R, Lin S, Milberg W and Weinger K: Cognitive
dysfunction is associated with poor diabetes control in older
adults. Diabetes Care. 29:1794–1799. 2006. View Article : Google Scholar : PubMed/NCBI
|
|
5
|
Prada PO, Zecchin HG, Gasparetti AL,
Torsoni MA, Ueno M, Hirata AE, Corezola do Amaral ME, Höer NF,
Boschero AC and Saad MJ: Western diet modulates insulin signaling,
c-Jun N-terminal kinase activity and insulin receptor
substrate-1ser307 phosphorylation in a tissue-specific fashion.
Endocrinology. 146:1576–1587. 2005. View Article : Google Scholar : PubMed/NCBI
|
|
6
|
Irie F, Fitzpatrick AL, Lopez OL, Kuller
LH, Peila R, Newman AB and Launer LJ: Enhanced risk for Alzheimer
disease in persons with type 2 diabetes: The Cardiovascular Health
Study Cognition Study. Arch Neural. 65:89–93. 2008. View Article : Google Scholar
|
|
7
|
De Matteis R, Lucertini F, Guescini M,
Polidori E, Zeppa S, Stocchi V, Cinti S and Cuppini R: Exercise as
a new physiological stimulus for brown adipose tissue activity.
Nutr Metab Cardiovasc Dis. 23:582–590. 2013. View Article : Google Scholar : PubMed/NCBI
|
|
8
|
Timmons JA, Baar K, Davidsen PK and
Atherton PJ: Is irisin a human exercise gene? Nature. 488:E9–E11.
2012. View Article : Google Scholar : PubMed/NCBI
|
|
9
|
Erden Y, Tekin S, Sandal S, Onalan EE,
Tektemur A and Kirbag S: Effects of central irisin administration
on the uncoupling proteins in rat brain. Neurosci Lett. 618:6–13.
2016. View Article : Google Scholar : PubMed/NCBI
|
|
10
|
Boström P, Wu J, Jedrychowski MP, Korde A,
Ye L, Lo JC, Rasbach KA, Boström EA, Choi JH, Long JZ, et al: A
PGC1-α-dependent myokine that drives brown-fat-like development of
white fat and thermogenesis. Nature. 481:463–468. 2012. View Article : Google Scholar : PubMed/NCBI
|
|
11
|
Huh JY, Panagiotou G, Mougios V,
Brinkoetter M, Vamvini MT, Schneider BE and Mantzoros CS: FNDC5 and
irisin in humans: I. Predictors of circulating concentrations in
serum and plasma II. mRNA expression and circulating concentrations
in response to weight loss and exercise. Metabolism. 61:1725–1738.
2012. View Article : Google Scholar : PubMed/NCBI
|
|
12
|
Castillo-Quan JI: From white to brown fat
through the PGC-1α-dependent myokine irisin: Implications for
diabetes and obesity. Dis Model Mech. 5:293–295. 2012. View Article : Google Scholar : PubMed/NCBI
|
|
13
|
Sharma N, Castorena CM and Cartee GD:
Greater insulin sensitivity in calorie restricted rats occurs with
unaltered circulating levels of several important myokines and
cytokines. Nutr Metab (Lond). 9:902012. View Article : Google Scholar : PubMed/NCBI
|
|
14
|
Teufel A, Malik N, Mukhopadhyay M and
Westphal H: Frcp1 and Frcp2, two novel fibronectin type III repeat
containing genes. Gene. 297:79–83. 2002. View Article : Google Scholar : PubMed/NCBI
|
|
15
|
Ferrer-Martínez A, Ruiz-Lozano P and Chien
KR: Mouse PeP: A novel peroxisomal protein linked to myoblast
differentiation and development. Dev Dyn. 224:154–167. 2002.
View Article : Google Scholar : PubMed/NCBI
|
|
16
|
Livak KJ and Schmittgen TD: Analysis of
relative gene expression data using real-time quantitative PCR and
the 2(-Delta Delta C(T)) method. Methods. 25:402–408. 2001.
View Article : Google Scholar : PubMed/NCBI
|
|
17
|
Takayama Y: Mild cognitive impairment
(MCI) and visual symptoms. Neuro-Ophthalmol Japan. 30:259–266.
2013.
|
|
18
|
Failla MD, Conley YP and Wagner AK:
Brain-derived neurotrophic factor (BDNF) in traumatic brain
injury-related mortality: Interrelationships between genetics and
acute systemic and central nervous system BDNF profiles.
Neurorehabil Neural Repair. 30:83–93. 2016. View Article : Google Scholar : PubMed/NCBI
|
|
19
|
Schneider B, Prvulovic D, Oertel-Knöchel
V, Knöchel C, Reinke B, Grexa M, Weber B and Hampel H: Biomarkers
for major depression and its delineation from neurodegenerative
disorders. Prog Neurobiol. 95:703–717. 2011. View Article : Google Scholar : PubMed/NCBI
|
|
20
|
Zou Y, Qing L, Zeng X, Shen Y, Zhong Y,
Liu J, Li Q, Chen K, Lv Y, Huang D, et al: Cognitive function and
plasma BDNF levels among manganese-exposed smelters. Occup Environ
Med. 71:189–194. 2014. View Article : Google Scholar : PubMed/NCBI
|
|
21
|
Laske C, Stransky E, Leyhe T, Eschweiler
GW, Maetzler W, Wittorf A, Soekadar S, Richartz E, Koehler N,
Bartels M, et al: BDNF serum and CSF concentrations in Alzheimer's
disease, normal pressure hydrocephalus and healthy controls. J
Psychiatr Res. 41:387–394. 2007. View Article : Google Scholar : PubMed/NCBI
|
|
22
|
Butt ZD, Hackett JD and Volkoff H: Irisin
in goldfish (Carassius auratus): Effects of irisin injections on
feeding behavior and expression of appetite regulators, uncoupling
proteins and lipoprotein lipase, and fasting-induced changes in
FNDC5 expression. Peptides. 90:27–36. 2017. View Article : Google Scholar : PubMed/NCBI
|
|
23
|
Esposito K, Chiodini P, Maiorino MI,
Capuano A, Cozzolino D, Petrizzo M, Bellastella G and Giugliano D:
A nomogram to estimate the HbA1c response to different DPP-4
inhibitors in type 2 diabetes: A systematic review and
meta-analysis of 98 trials with 24 163 patients. BMJ Open.
5:e0058922015. View Article : Google Scholar : PubMed/NCBI
|
|
24
|
Belviranli M, Okudan N, Kabak B, Erdoğan M
and Karanfilci M: The relationship between brain-derived
neurotrophic factor, irisin and cognitive skills of endurance
athletes. Phys Sportsmed. 44:290–296. 2016. View Article : Google Scholar : PubMed/NCBI
|
|
25
|
Geijselaers SLC, Sep SJS, Stehouwer CDA
and Biessels GJ: Glucose regulation, cognition, and brain MRI in
type 2 diabetes: A systematic review. Lancet Diabetes Endocrinol.
3:75–89. 2015. View Article : Google Scholar : PubMed/NCBI
|
|
26
|
Luo J, Xue H, Chen Y, Wu F, Meng G and Xu
J: Effect of Ganoderma lucidum polysaccharides on expression
of AGEs and AGER in myocardium of T2DM rats. Pharmacol Clin Chin
Materia Medica. 27:40–43. 2011.
|
|
27
|
Yurchenco PD and Schittny JC: Molecular
architecture of basement membranes. FASEB J. 4:1572–1590. 1990.
View Article : Google Scholar
|
|
28
|
McIsaac W and Ferguson AV: Glucose
concentrations modulate brain-derived neurotrophic factor
responsiveness of neurones in the paraventricular nucleus of the
hypothalamus. J Neuroendocrinol. 29:2017. View Article : Google Scholar : PubMed/NCBI
|