Introduction
Sepsis is a serious healthcare concern due to its
high costs and mortality rate (1).
It is triggered mainly by Gram-negative bacteria (2) and lipopolysaccharides (LPS) are the
main component of the outer membrane of Gram-negative bacteria.
Previous studies have demonstrated that LPS serve an important role
in sepsis, and can stimulate the mononuclear phagocytic system to
produce a large number of inflammatory factors and cause systemic
inflammatory response, sepsis, infectious shock and multiple organ
dysfunctions (3). It has been
reported that following low-dose LPS stimulation, the host can
survive a second lethal dose of LPS treatment, indicating a
phenomenon known as endotoxin tolerance (ET) (4). ET is characterized as the reduced
capacity of a cell or organ to respond to LPS stimulation after an
initial exposure to endotoxin (5,6), and
it is an adaptive host response as a self-protective regulatory
mechanism of the body (7). The
main characteristics of ET are downregulation of inflammatory
factors including tumor necrosis factor (TNF)-α, interleukin
(IL)-6, and upregulation of anti-inflammatory mediators such as
IL-10 (8). Macrophages serve an
important role in innate and acquired immunity, with ET
representing an M2-like phenotype, and the characteristic cell
surface markers cluster of differentiation (CD)206 and CD163 of the
macrophages are significantly induced, and the genes associated
with phagocytosis also were markedly upregulated (9). A previous study demonstrated that LPS
significantly induced the apoptosis of immune cells to prevent
hypernomic inflammation in patients with sepsis, and T-cell and
B-cell deficient mice were more likely to develop ET than wild-type
mice (10). Previous studies have
identified that the Toll-like receptor (TLR)-4 pathway is involved
in the formation of ET (6,11). Toll interacting protein (Tollip),
as a negative regulator of TLR4 signaling pathway, which complexes
with IL-1 receptor-associated kinase (IRAK) and suppressed
activation of IRAK as molecular hallmarks of ET, were shown to have
increased expression in ET (12).
ET inhibited the phosphorylation of extracellular signal-regulated
kinases 1/2 (ERK1/2), Jun N-terminal kinases (JNK), and showed
decreased expression of P38MAPK (13). miRNAs regulate inflammatory factors
and mediate ET through binding to mRNA or acting on the relevant
members of the TLRs pathway (14).
miR-146 is significant for LPS-induced tolerance and may be the
most important miRNA in ET (15).
It has been reported that miR-146 negatively regulated the TLRs
pathway by repressing the expression of IRAK1 and TNF receptor
associated factor 6 (TRAF6), thereby resulting in ET (16,17).
Although ET has been extensively studied, its
mechanism remains unclear. A previous study suggested that almost
all sepsis gene expression is closely associated with ET signaling,
and these signals may serve an important role in predicting organ
damage and the prognosis of patients with sepsis (18). Few comprehensive studies on
ET-associated proteins have been reported; thus, the present study
focused on protein complexes. In the present study, proteomics
analysis using isobaric tags for relative and absolute quantitation
(iTRAQ) was performed to explore the mechanism of ET, and key
proteins were analyzed by bioinformatics analysis.
Materials and methods
Cell culture and ET cell model
establishment
Mouse macrophage RAW264.7 cells (American Type
Culture Collection, Manassas, VA, USA) were cultured in Dulbecco's
modified Eagle's medium (DMEM; Hyclone; GE Healthcare Life
Sciences, Logan, UT, USA) containing 10% fetal bovine serum (FBS;
Hyclone; GE Healthcare Life Sciences) at 37°C in incubator with 5%
CO2. The ET group was cultured as follows: RAW264.7
cells (5×10⁵/ml) were cultured in DMEM containing 10
ng/ml LPS (Sigma-Aldrich; Merck KGaA) at 37°C for 24 h, followed by
100 ng/ml LPS for 4 h at 37°C. The LPS group was cultured as
follows: RAW264.7 (5×10⁵/ml) cells were cultured in DMEM
with 100 ng/ml LPS for 4 h at 37°C. Subsequently, the RAW264.7
cells of the 2 groups were harvested for analysis.
Enzyme-linked immunosorbent assays
(ELISAs)
The concentration of tumor necrosis factor (TNF)-α,
interleukin (IL)-6 and IL-10 in the cell supernatant of the ET and
LPS groups was measured using ELISA kits (TNF-α, cat. no. EK0527;
IL-6, cat. no EK0411; IL-10, cat. no. EK04167; Wuhan Boster
Biological Technology, Ltd.) according to the manufacturer's
instructions. The assay was performed in triplicate, and the
absorbance in each well was measured with a microplate reader at
450 nm.
Flow cytometric analysis
RAW264.7 cells in the ET and LPS groups were treated
with 100 ng/ml LPS for 4 or 24 h as aforementioned, then washed
twice with PBS and centrifuged at 1,000 × g for 3 min at room
temperature. The cell precipitate was resuspended in PBS and
adjusted to a concentration of 1×10⁶/ml. Cells were
stained with fluorescein isothiocyanate tagged monoclonal
anti-CD-16/32 kit (cat. no. 561728, BD Biosciences Pharmingen),
diluted with PBS, for 30 min at room temperature in the dark in
accordance with the manufacturer's protocol, then washed two times
with PBS and resuspended in PBS. Analysis was performed using the
BD FACSVerse system flow cytometer and BD FACSuite version 1.0
software (BD Biosciences).
iTRAQ proteomics analysis
Lysis buffer containing 8 M carbamide (Gibco; Thermo
Fisher Scientific, Inc.), 30 mM HEPES (Wuhan Boster Biological
Technology, Ltd.), 1 mM PMSF (Amresco, LLC), 2 mM EDTA (Amresco,
LLC), and 10 mM DTT (Promega Corporation) was added to cells and
centrifuged at 20,000 × g and 4°C for 30 min to collect the
supernatant. Protein concentrations were determined using the
Bradford method. For digestion, each sample was reduced with 10 mM
dithiothreitol for 60 min at 56°C and alkylated using 55 mM
iodoacetamide for 60 min at room temperature in the dark. The
proteins were digested with 1 µg/µl trypsin at a weight ratio of
1:30 (trypsin:protein) overnight at 37°C. Tryptic peptides were
lyophilized and resuspended in 0.5 M Triethylammonium bicarbonate.
Following trypsin digestion, each iTRAQ reagent was dissolved in
isopropanol and added to the appropriate peptide mixture. A total
of 3 biological replicates of the ET group were labelled with iTRAQ
tags 113, 114 and 115, respectively. Similarly, 3 biological
replicates of the LPS group were labelled with iTRAQ tags 118, 117
and 116, respectively. The labelled peptide mixtures were incubated
at room temperature for 2 h and obtained by vacuum-drying. Then,
peptides were desalted using a Strata X C18 SPE column (Phenomenex,
Torrance, CA, USA), and analyzed using a mass spectrometer
(TripleTOF 6600; SCIEX, Framingham, MA, USA). The instrument
parameters were as follows: Mass range, 350–2,000 m/z for
time-of-flight mass spectrometry (TOF MS) and 100–1,500 m/z for TOF
MS/MS; dynamic exclusion, 12.0 sec. Mass spectra raw data were
analyzed with ProteinPilotä software (version 5.0; SCIEX). The
parameters for the analysis were set as follows: Cys alkylation,
iodoacetamide; digestion, trypsin; species, Mus musculus.
Peptides were identified using a false discovery rate of <1%.
Proteins were considered differentially expressed if they differed
in at least 2 of the 3 biological replicates. The criteria of
P<0.05 and fold change (ET/LPS)>1.2 or <0.833 were
selected to identify up- and down-regulated proteins.
Bioinformatics analysis
Functional enrichment analysis for the
differentially expressed proteins was performed using the Database
for Annotation, Visualization and Integrated Discovery (DAVID
version 6.7; david.ncifcrf.gov) for Gene Ontology
annotation and Kyoto Encyclopedia of Genes and Genomes (KEGG;
www.genome.jp/kegg/) pathway analysis.
P<0.05 was selected as the cut-off criterion. A protein-protein
interaction network was constructed using the inBio Map database
(www.intomics.com/inbio/map). Key
genes located in the center of the network were subsequently
verified.
Western blot analysis
Cell lysates were obtained using a lysis buffer
containing phosphatase inhibitor and the protease inhibitor
phenylmethanesulfonyl fluoride (100 mM; cat. no. KGP250; Nanjing
KeyGen Biotech Co., Ltd.) and the protein concentration in the
lysates determined by Bradford assay. A total of 100 µg lysate was
separated by 10% SDS-PAGE and then transferred to a polyvinylidene
difluoride (PVDF) membrane at 250 mA for 1 h. The PVDF membranes
were blocked with 5% FBS for 1.5 h at 37°C and incubated overnight
at 4°C with rabbit anti-mouse antibodies against high mobility
group (HMG)A1 (1:10,000; cat. no. ab129153; Abcam), HMGA2 (1:1,000;
cat. no. D1A7; Cell Signaling Technology, Inc.), HMGB1 (1:10,000;
cat. no. ab79823; Abcam), HMGB2 (1:10,000; cat. no. ab124670;
Abcam) and β-actin (1:1,000; cat. no. BM0627; Wuhan Boster
Biological Technology, Ltd.). The PVDF membranes were washed three
times with TBST (0.1% Tween) and incubated with goat anti-rabbit
Immunoglobulin G-HRP (1:1,000; cat. no. BA1054; Wuhan Boster
Biological Technology, Ltd.) for 1.5 h at 37°C, followed by the
3,3′-diaminobenzidine (EMD Millipore) method at room temperature
for 15 sec. PVDF membranes were subjected to densitometry analysis
(chemiDox.XRS+; Bio-Rad Laboratories, Inc.), then the image was
analyzed using Quantity One 4.0 software (Bio-Rad Laboratories,
Inc.).
Statistical analysis
Data are expressed as the mean ± standard error of
the mean. SPSS version 21.0 (IBM Corp., Armonk, NY, USA) was used
for data analysis. Statistical analysis was performed using an
independent sample Student's t-test. P<0.05 was considered to
indicate a statistically significant difference.
Results
Different concentrations of TNF-α,
IL-6 and IL-10 between the ET and LPS groups
To determine the concentrations of cytokines in the
ET and LPS groups, the supernatants of the cells were analyzed by
ELISA. As indicated in Fig. 1A and
B, TNF-α and IL-6 were significantly downregulated in the ET
group when compared with the LPS group (P<0.05). The expression
of IL-10 in the ET group was higher when compared with in the LPS
group, but the difference was not statistically significant
(P>0.05; Fig. 1C). These
results indicated that the ET model had been successfully
constructed.
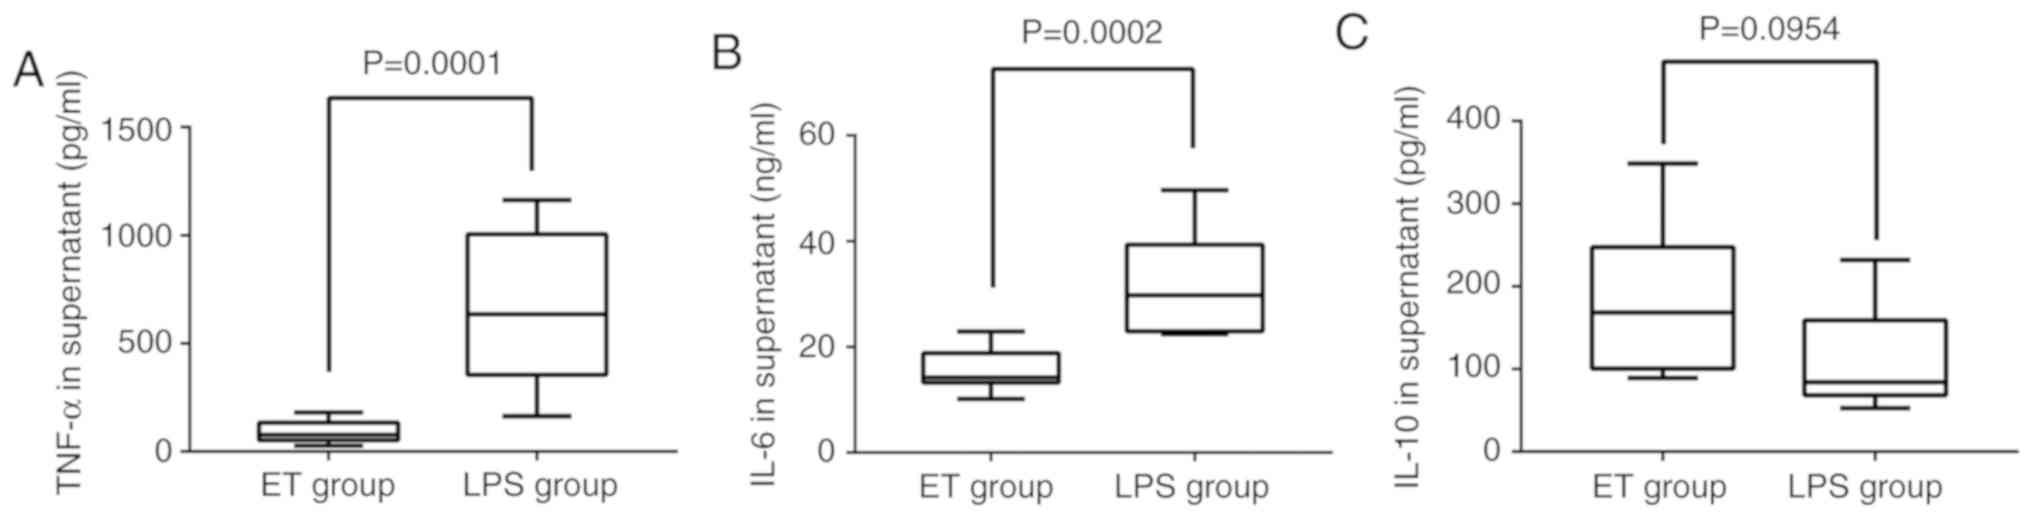 | Figure 1.Concentration of TNF-α, IL-6 and IL-10
in the 2 groups as detected by ELISA. Following stimulation with
high-dose LPS (100 ng/ml) for 4 h, (A) the level of TNF-α in the
supernatant of the ET group (18,273.5±101,54.4 pg/ml) was lower
compared with that in the LPS group (133,233.7±689, 55.9 pg/ml) and
(B) the level of IL-6 in the supernatant of the ET group
(1,549.8±399.2 pg/ml) was lower compared with that in the LPS group
(3,175.8±959.0 pg/ml). (C) The level of IL-10 in the supernatant of
the ET group (351.1±184.2 pg/ml) was higher when compared the LPS
group (220.3±121.4 pg/ml), but the difference was not statistically
significant. LPS, lipopolysaccharide; ET, endotoxin tolerance; IL,
interleukin; TNF, tumor necrosis factor. |
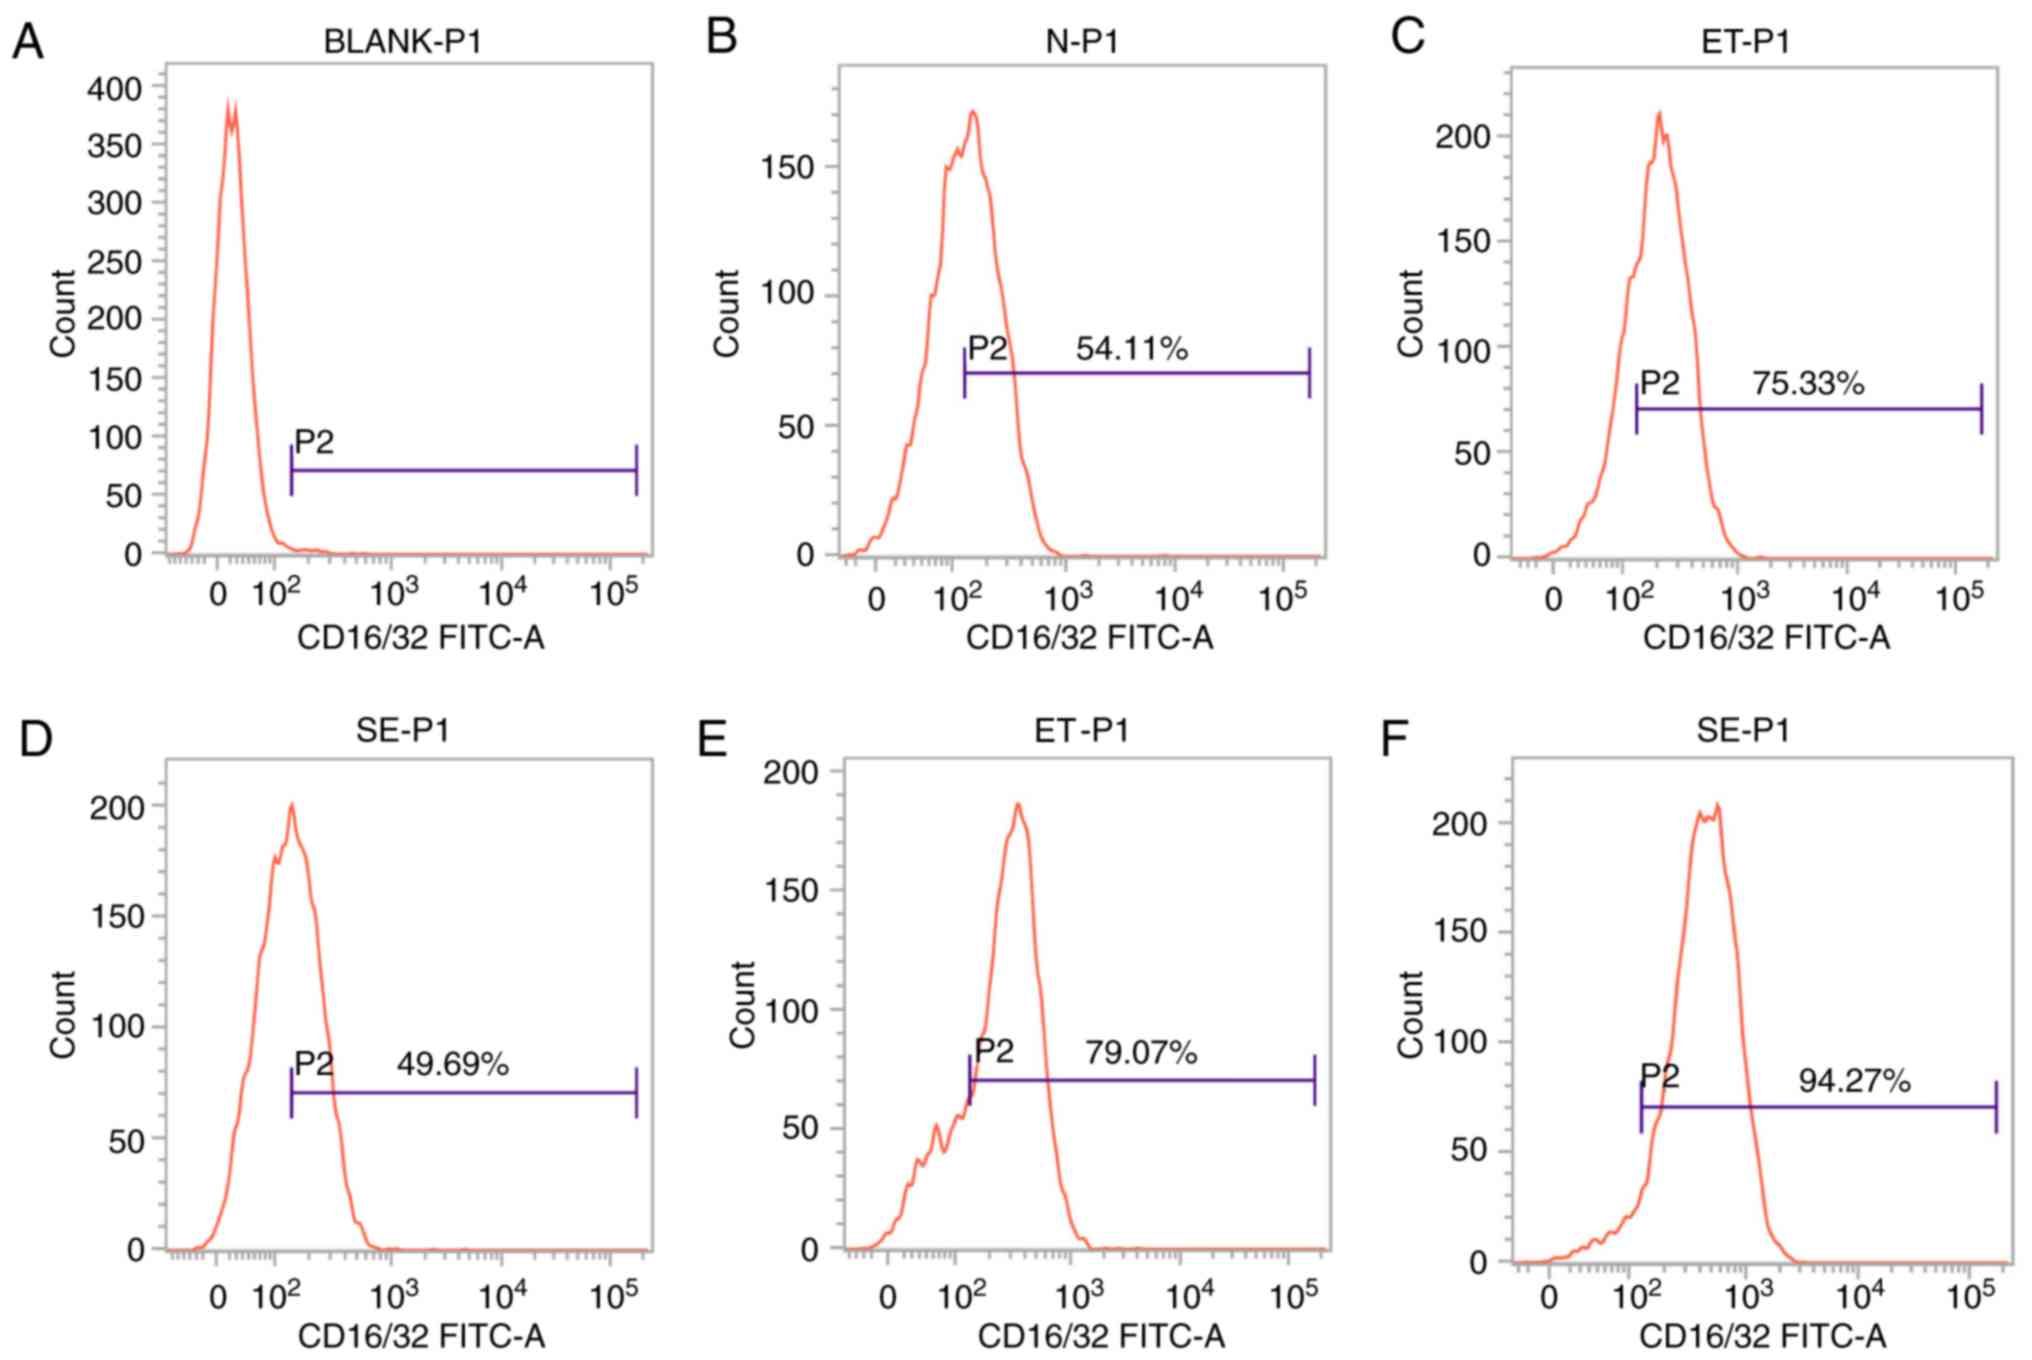
Expression of CD16/32 on the cell
surface in the ET and LPS groups
CD16/32 is the cell surface marker that is induced
in M1-polarized cells. Based on the theory that ET skews cell
polarization into an M2-like phenotype, and the number of
M1-polarized cells will not continue to increase (8), cell surface marker analysis was
performed to determine the expression level of CD16/32 by flow
cytometry. As shown in Fig. 2,
following stimulation with high-dose LPS for 4 h, CD16/32 was
induced in the ET group compared with the LPS group or untreated
sample (P<0.05; Fig. 2C and D),
but following stimulation with LPS for 24 h, significant
downregulation of this marker was observed in the ET group compared
with the LPS group (P<0.05; Fig. 2E
and F). The results indicated that there were more M1-polarized
cells in the ET group compared with in the LPS group at the early
stage (4 h), and the ET model was successfully constructed.
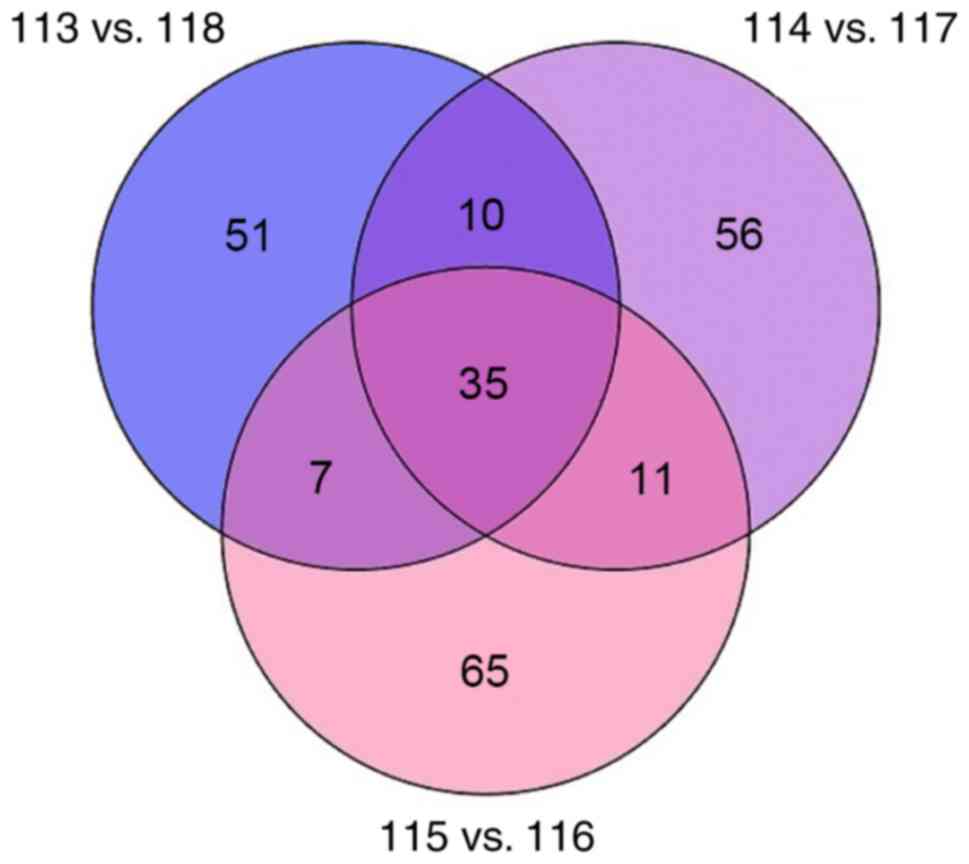
iTRAQ analysis of differentially
expressed proteins
A total of 3 biological replicates were performed
for the ET and LPS groups (n=3). A total of 235 different proteins
were identified by iTRAQ, and there were 63 differentially
expressed proteins identified in at least 2 of the experiments. Of
the 63 differentially expressed proteins, 36 upregulated proteins
with >1.2-fold difference and 27 downregulated proteins with
<0.833-fold difference were selected between the ET and LPS
groups (Fig. 3). Specific
upregulated proteins are presented in Table I and downregulated proteins are
presented in Table II.
 | Table I.The 36 upregulated proteins in the
present study. |
Table I.
The 36 upregulated proteins in the
present study.
| Number | Code no. | Symbol | Name | Ratio |
|---|
| 1 | P10923 | Spp1 | Osteopontin | 2.168 |
| 2 | P52927 | Hmga2 | High mobility group
protein HMGI-C | 1.907 |
| 3 | P25085 | Il1rn | Interleukin-1
receptor antagonist protein | 1.854 |
| 4 | Q07797 | Lgals3bp | Galectin-3-binding
protein | 1.843 |
| 5 | Q64339 | Isg15 | Ubiquitin-like
protein ISG15 | 1.832 |
| 6 | P54987 | Acod1 | Cis-aconitate
decarboxylase | 1.641 |
| 7 | P09671 | Sod2 | Superoxide dismutase
[Mn], mitochondrial | 1.641 |
| 8 | Q05769 | Ptgs2 | Prostaglandin G/H
synthase 2 | 1.617 |
| 9 | Q99JT1 | Gatb | Glutamyl-tRNA(Gln)
amidotransferase subunit B, mitochondrial | 1.531 |
| 10 | P99029 | Prdx5 | Peroxiredoxin-5,
mitochondrial | 1.489 |
| 11 | Q05816 | Fabp5 | Fatty acid-binding
protein, epidermal | 1.474 |
| 12 | P27046 | Man2a1 | α-mannosidase 2 | 1.447 |
| 13 | P37040 | Por | NADPH-cytochrome
P450 reductase | 1.444 |
| 14 | P45377 | Akr1b8 | Aldose
reductase-related protein 2 | 1.415 |
| 15 | P30204 | Msr1 | Macrophage
scavenger receptor types I and II | 1.402 |
| 16 | P35700 | Prdx1 |
Peroxiredoxin-1 | 1.396 |
| 17 | P10855 | Ccl3 | C-C motif chemokine
3 | 1.386 |
| 18 | P20029 | Hspa5 | 78 kDa
glucose-regulated protein | 1.375 |
| 19 | P17095 | Hmga1 | High mobility group
protein HMG-I/HMG-Y | 1.363 |
| 20 | Q9Z0J0 | Npc2 | Epididymal
secretory protein E1 | 1.362 |
| 21 | Q9JHK5 | Plek | Pleckstrin | 1.336 |
| 22 | E9Q555 | Rnf213 | E3
ubiquitin-protein ligase RNF213 | 1.328 |
| 23 | D0QMC3 | Mndal | Myeloid cell
nuclear differentiation antigen-like protein | 1.327 |
| 24 | P20108 | Prdx3 |
Thioredoxin-dependent peroxide reductase,
mitochondrial | 1.304 |
| 25 | P97429 | Anxa4 | Annexin A4 | 1.298 |
| 26 | P01902 | H2-K1 | H-2 class I
histocompatibility antigen, K-D alpha chain | 1.282 |
| 27 | Q8BLN5 | Lss | Lanosterol
synthase | 1.279 |
| 28 | P47758 | Srprb | Signal recognition
particle receptor subunit β | 1.276 |
| 29 | O35215 | Ddt | D-dopachrome
decarboxylase | 1.269 |
| 30 | P10852 | Slc3a2 | 4F2 cell-surface
antigen heavy chain | 1.261 |
| 31 | Q9WVK4 | Ehd1 | EH
domain-containing protein 1 | 1.253 |
| 32 | Q8BSY0 | Asph |
Aspartyl/asparaginyl β-hydroxylase | 1.249 |
| 33 | Q9QUJ7 | Acsl4 |
Long-chain-fatty-acid-CoA ligase 4 | 1.247 |
| 34 | P53395 | Dbt | Lipoamide
acyltransferase component of branched-chain α-keto acid | 1.237 |
|
|
|
| dehydrogenase
complex, mitochondrial |
|
| 35 | P61620 | Sec61a1 | Protein transport
protein Sec61 subunit α isoform 1 | 1.221 |
| 36 | Q6NZF1 | Zc3h11a | Zinc finger CCCH
domain-containing protein 11A | 1.208 |
| Table II.The 27 downregulated proteins in the
present study. |
Table II.
The 27 downregulated proteins in the
present study.
| Number | Code number | Symbol | Name | Ratio |
|---|
| 1 | P57759 | Erp29 | Endoplasmic
reticulum resident protein 29 | 0.827 |
| 2 | Q61093 | Cybb | Cytochrome b-245
heavy chain | 0.822 |
| 3 | Q9ESY9 | Ifi30 |
Gamma-interferon-inducible lysosomal thiol
reductase | 0.821 |
| 4 | P14152 | Mdh1 | Malate
dehydrogenase, cytoplasmic | 0.818 |
| 5 | P17742 | Ppia | Peptidyl-prolyl
cis-trans isomerase A | 0.811 |
| 6 | Q09014 | Ncf1 | Neutrophil cytosol
factor 1 | 0.807 |
| 7 | Q04447 | Ckb | Creatine kinase
B-type | 0.799 |
| 8 | Q9Z1B5 | Mad2l1 | Mitotic spindle
assembly checkpoint protein MAD2A | 0.791 |
| 9 | P43274 | Hist1h1e | Histone H1.4 | 0.789 |
| 10 | P20060 | Hexb | Beta-hexosaminidase
subunit β | 0.786 |
| 11 | P16110 | Lgals3 | Galectin-3 | 0.761 |
| 12 | P54227 | Stmn1 | Stathmin | 0.758 |
| 13 | P63158 | Hmgb1 | High mobility group
protein B1 | 0.757 |
| 14 | P23198 | Cbx3 | Chromobox protein
homolog 3 | 0.748 |
| 15 | P43276 | Hist1h1b | Histone H1.5 | 0.726 |
| 16 | P10749 | Il1b | Interleukin-1β | 0.725 |
| 17 | P43275 | Hist1h1a | Histone H1.1 | 0.721 |
| 18 | P30681 | Hmgb2 | High mobility group
protein B2 | 0.714 |
| 19 | P62806 | Hist1h4a | Histone H4 | 0.702 |
| 20 | P06804 | Tnf | Tumor necrosis
factor | 0.701 |
| 21 | Q91YS8 | Camk1 |
Calcium/calmodulin-dependent protein
kinase type 1 | 0.692 |
| 22 | P07091 | S100a4 | Protein
S100-A4 | 0.681 |
| 23 | Q91VW3 | Sh3bgrl3 | SH3 domain-binding
glutamic acid-rich- like protein 3 | 0.679 |
| 24 | P20065-2 | Tmsb4× | Isoform Short of
Thymosin β-4 | 0.676 |
| 25 | P63254 | Crip1 | Cysteine-rich
protein 1 | 0.657 |
| 26 | P15864 | Hist1h1c | Histone H1.2 | 0.615 |
| 27 | O54962 | Banf1 |
Barrier-to-autointegration factor | 0.590 |
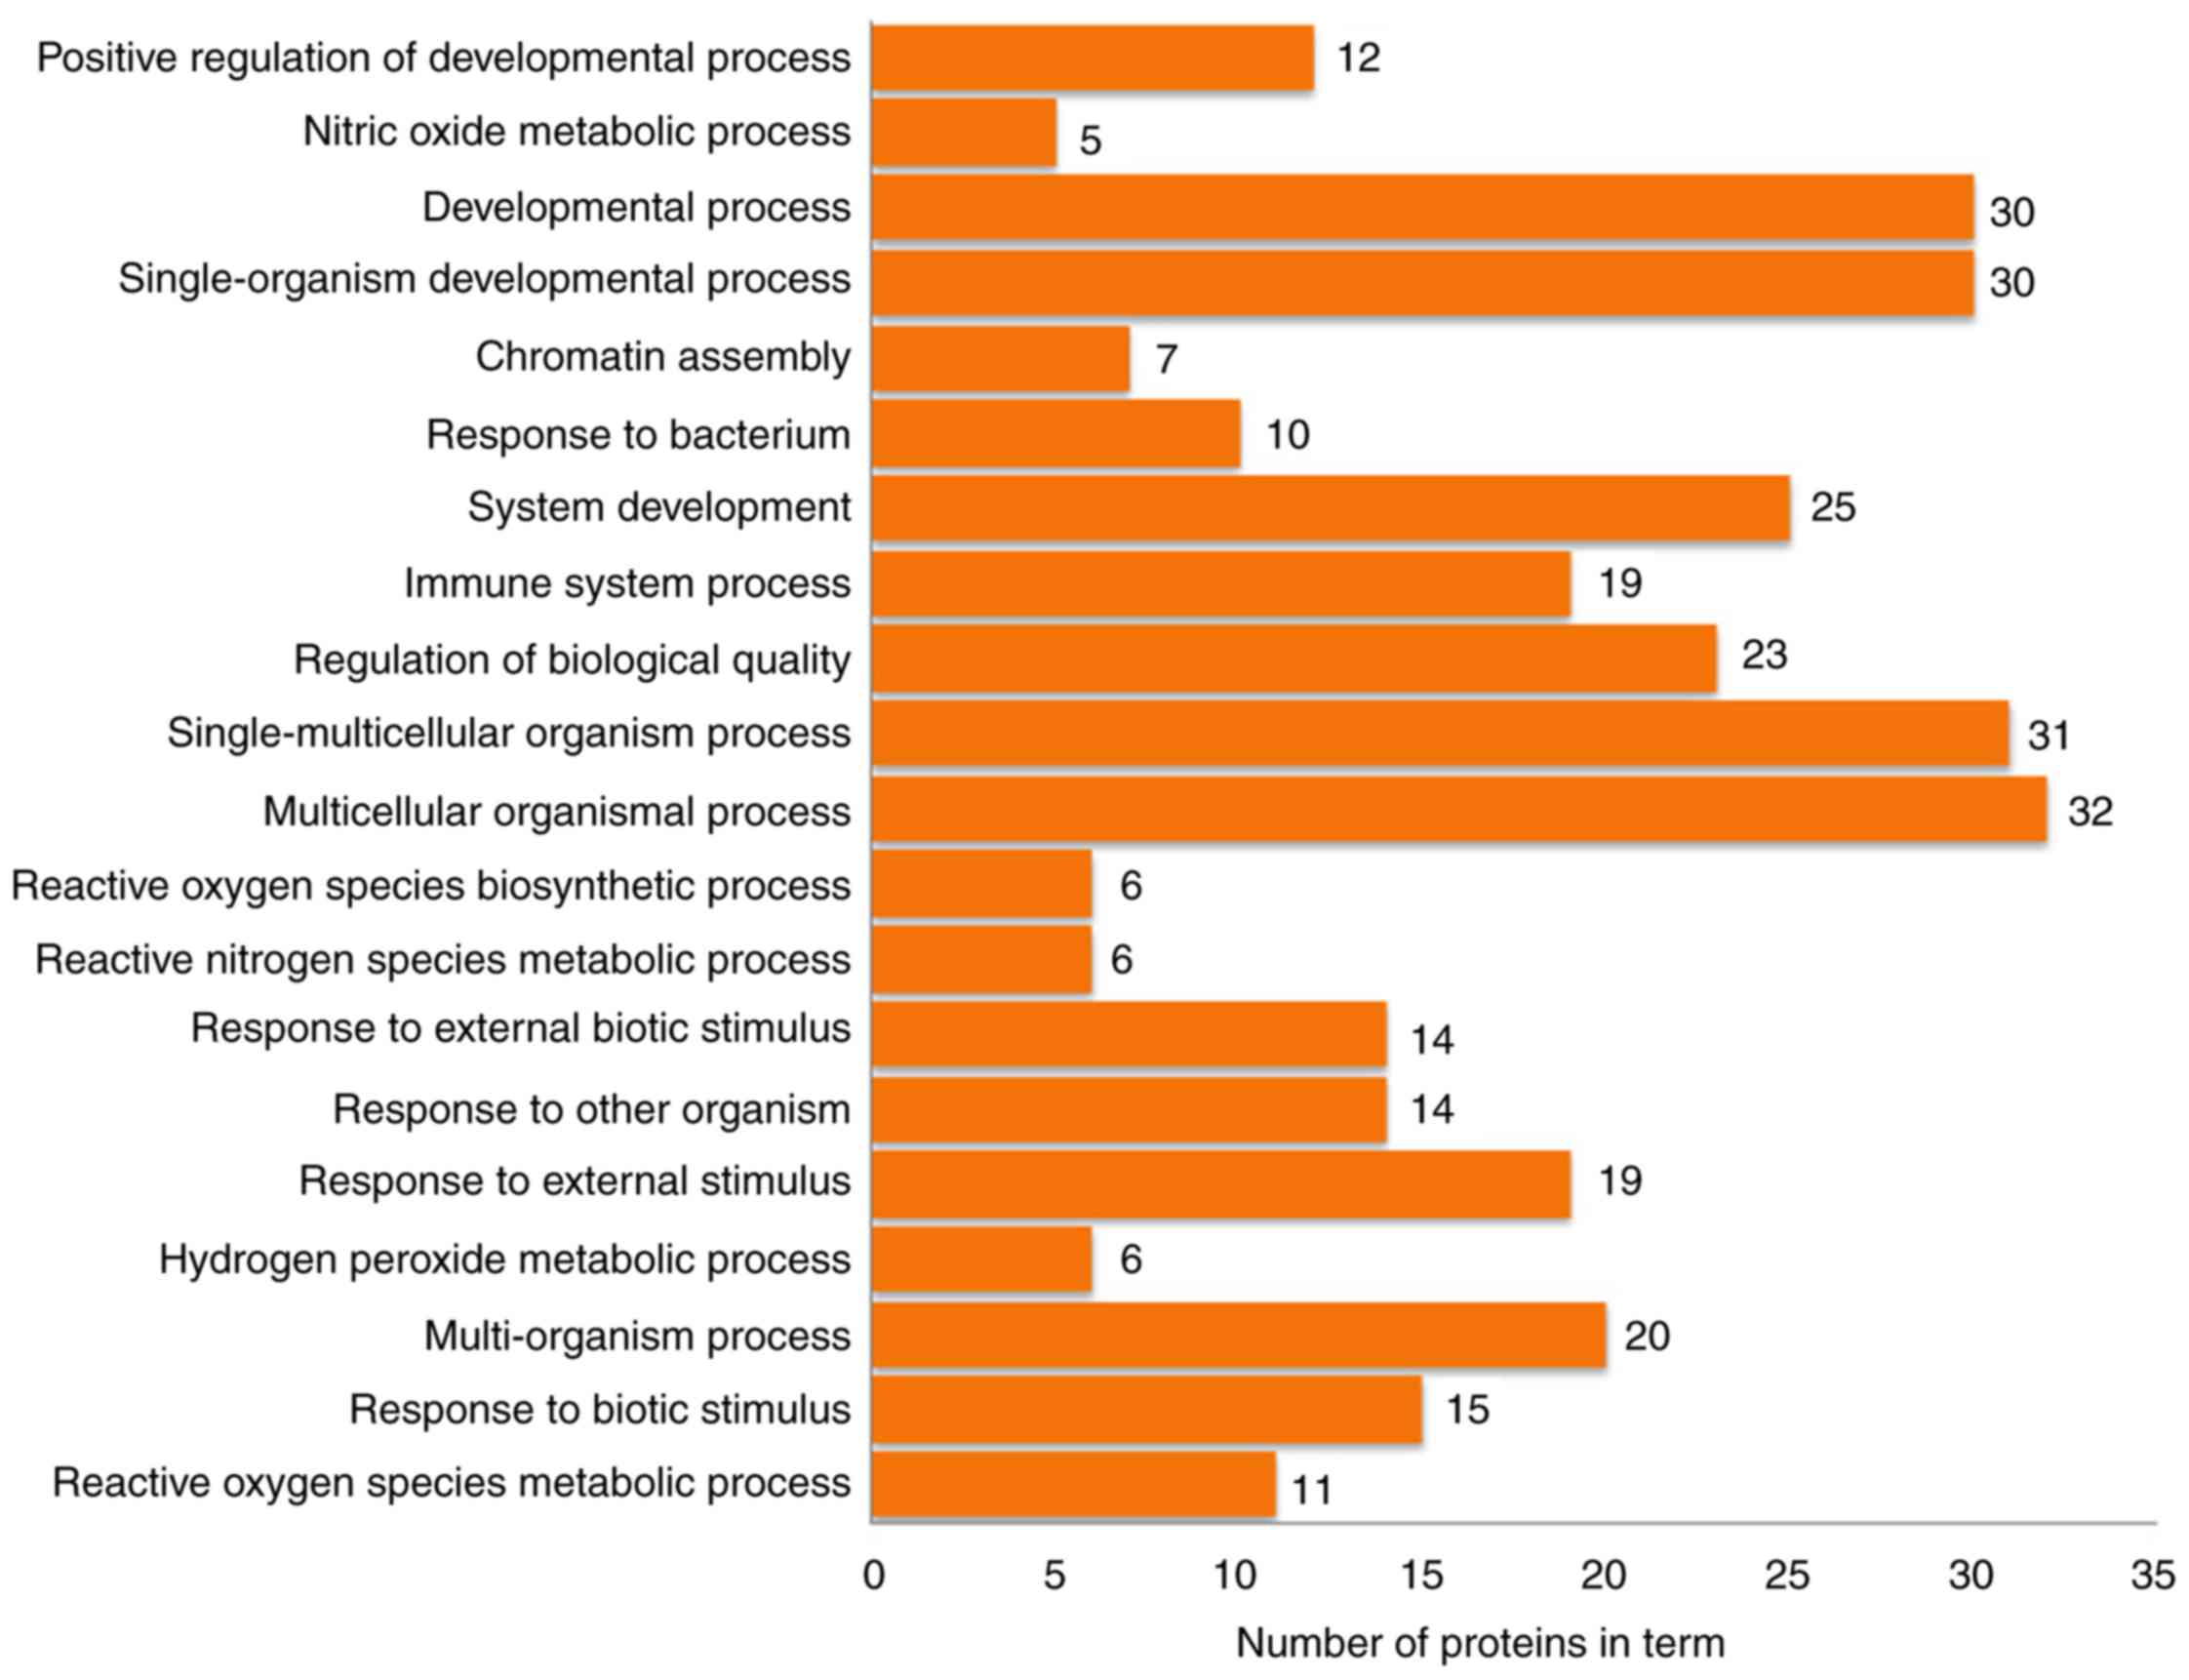
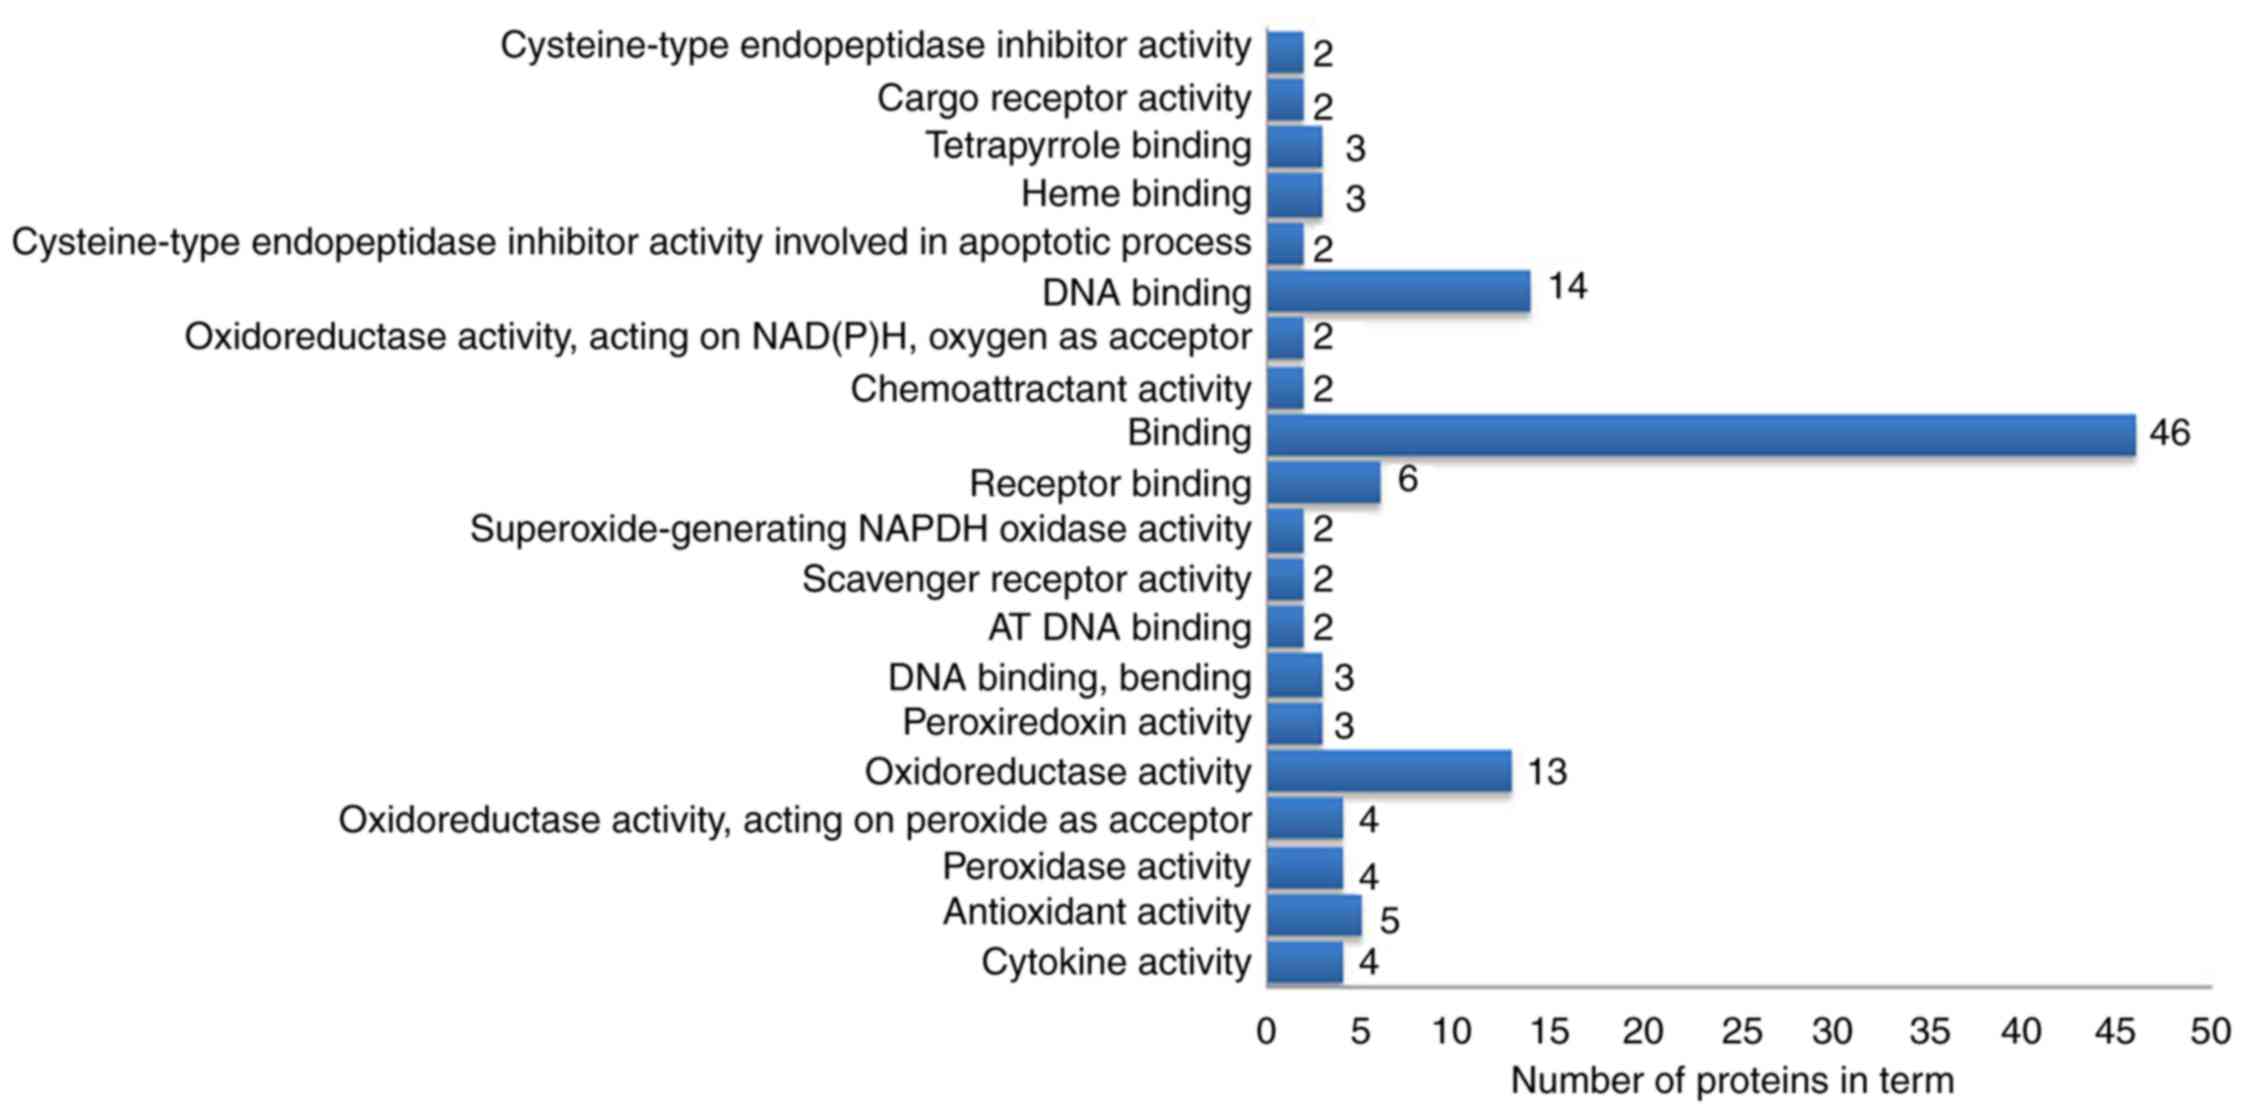
Functional enrichment analysis and
pathway annotation of differentially expressed proteins
The 63 differentially expressed proteins were
analyzed by DAVID to study their biological processes, molecular
functions and cellular component. The biological processes of these
proteins were mainly involved in the growth and development of
organ tissues, the regulation of biological quality and responses
to external stimuli (Fig. 4). The
molecular functions analysis demonstrated that these proteins were
mainly involved in ‘oxidoreductase activation’, ‘receptor binding’,
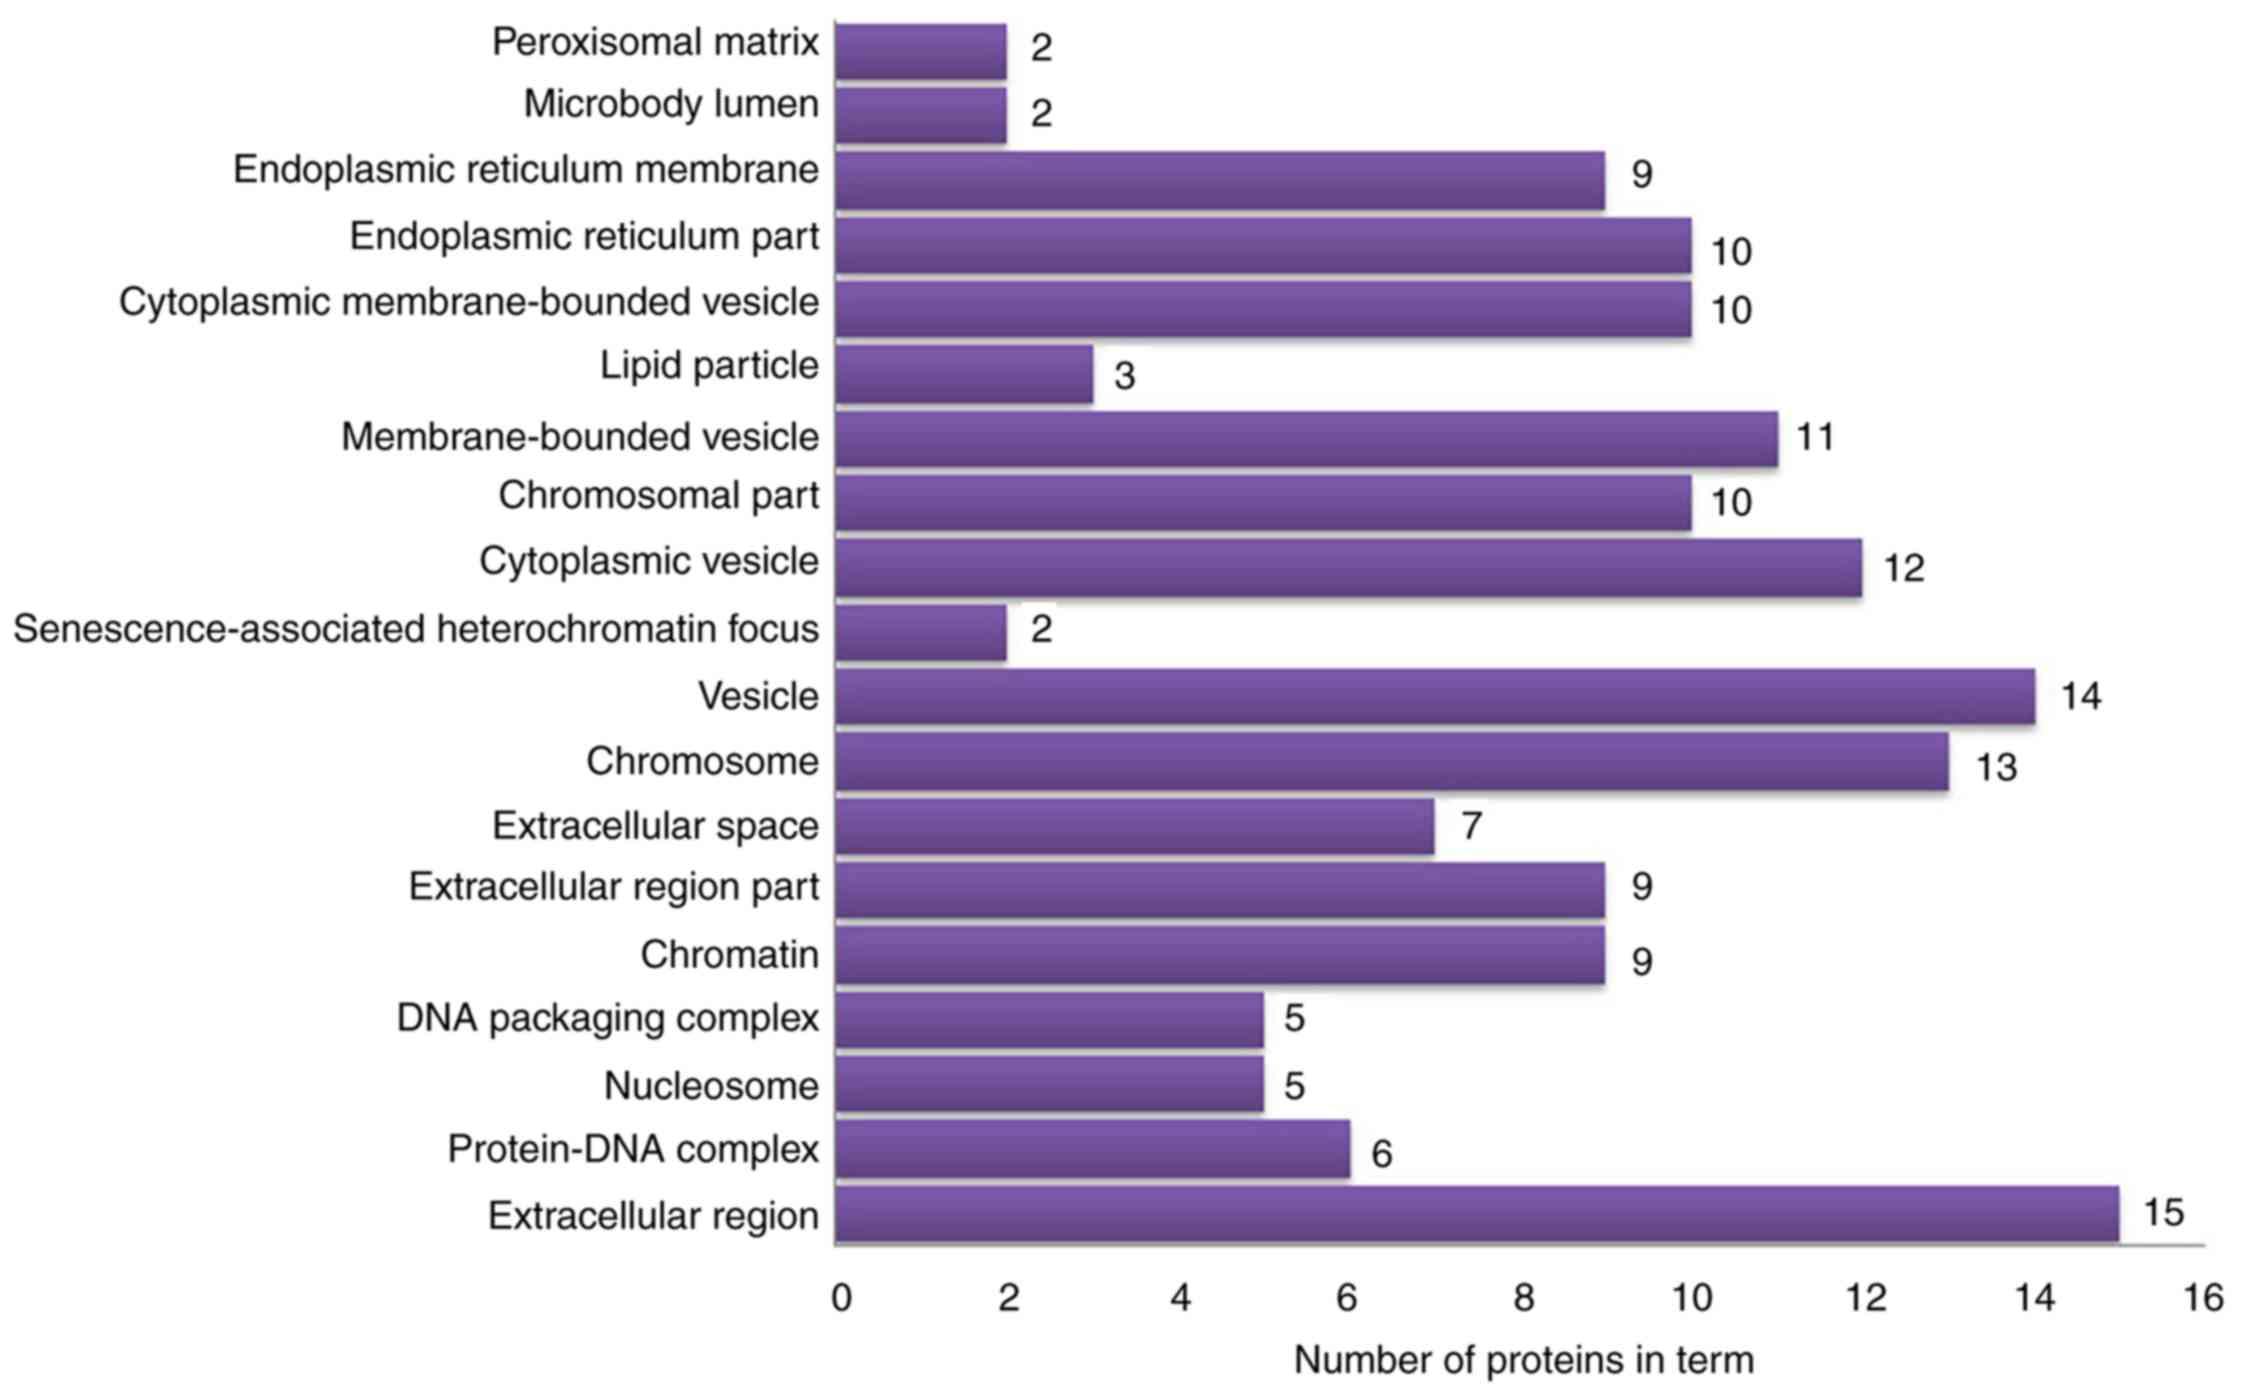
‘DNA binding’ and ‘antioxidant activity’ (Fig. 5). In the cellular component
analysis, the differentially expressed proteins were mainly located
in ‘chromatin’, the ‘extracellular space’, ‘membrane-bounded
vesicles’ and ‘cytoplasmic vesicles’ (Fig. 6). According to KEGG pathway
analysis, the 63 differentially expressed proteins were involved in
27 signaling pathways (P<0.05). The top 10 signaling pathways
included TLR signaling pathway, nuclear factor (NF)-κB signaling
pathway, TNF signaling pathway and antigen presentation processes
(Table III).
| Table III.Top 10 signaling pathways analyzed by
Kyoto Encyclopedia of Genes and Genomes pathway analysis. |
Table III.
Top 10 signaling pathways analyzed by
Kyoto Encyclopedia of Genes and Genomes pathway analysis.
| Path number | Pathway name | P-value | Number of
proteins |
|---|
| mmu05332 | Graft-versus-host
disease | <0.0001 | 3 |
| mmu04940 | Type I diabetes
mellitus | 0.0001 | 3 |
| mmu04612 | Antigen processing
and presentation | 0.0007 | 4 |
| mmu04060 | Cytokine-cytokine
receptor interaction | 0.0011 | 3 |
| mmu03060 | Protein export | 0.0017 | 3 |
| mmu04620 | Toll-like receptor
signaling pathway | 0.0031 | 4 |
| mmu04064 | NF-κB signaling
pathway | 0.0137 | 3 |
| mmu05206 | MicroRNAs in
cancer | 0.0246 | 3 |
| mmu04668 | TNF signaling
pathway | 0.0246 | 3 |
| mmu03320 | PPAR signaling
pathway | 0.0338 | 2 |
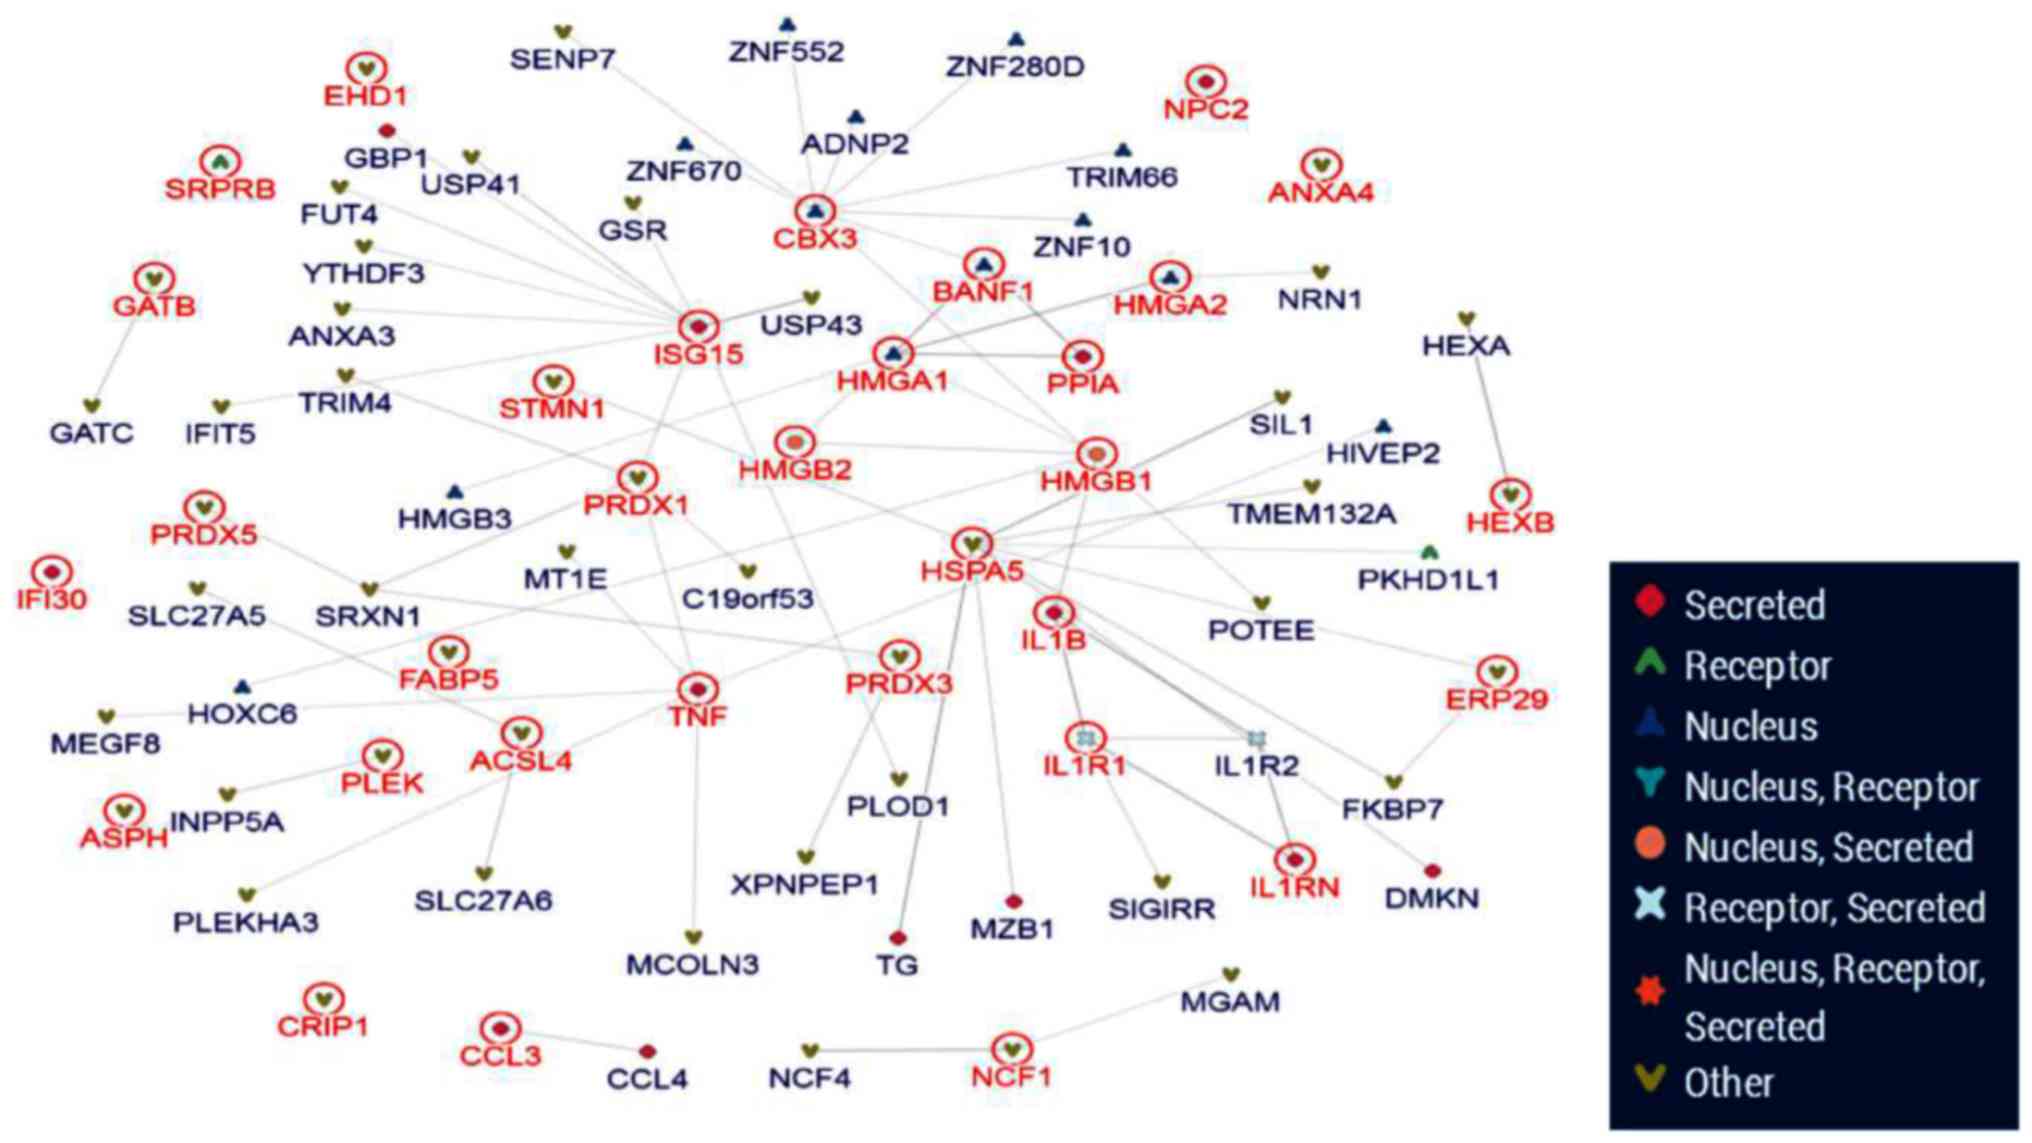
Protein-protein interaction
analysis
The inBio Map database was used to construct a
protein-protein interaction network (Fig. 7). From the 63 differential
proteins, 4 key proteins were located at the core of network.
According to the bioinformatics analysis, HMGA1/2 and HMGB1/2 were
selected for further study.
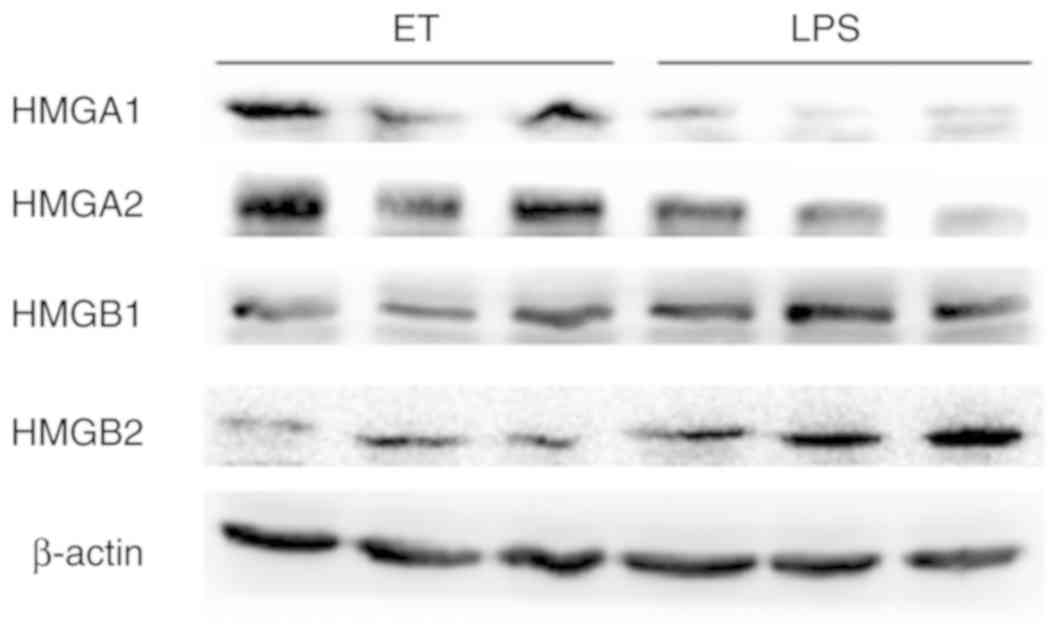
Validation of the key proteins HMGA1,
HMGA2, HMGB1 and HMGB2
To validate the 4 key proteins, western blot
analysis was performed. The expression of HMGA1 and HMGA2 in the ET
group was higher compared with the LPS group at 4 h following
high-dose LPS stimulation, while HMGB1 and HMGB2 exhibited the
opposite trend in expression under the same conditions (Fig. 8). These results were consistent
with the findings from iTRAQ analysis.
Discussion
Sepsis is a systemic infection caused by various
other infections. It can develop into septic shock and multiple
organ failure, with a high mortality rate (18). The pathophysiological changes of
sepsis result from multifactorial interactions. Fortunately, the
discovery of the phenomenon of ET provides a new avenue for
identifying treatments for sepsis. Paul Beeson (19) initially identified ET and
demonstrated that repeated injections of the typhoid bacilli
vaccine in rabbits significantly reduced the fever caused by the
vaccine. ET has been observed in infection, and certain studies
have demonstrated that ET is associated with innate immunity
(5), while monocyte macrophages
are an important part of innate immunity (20). Large differences in gene expression
were analyzed by microarray analysis during ET and the ETS family
of transcription factors were the most associated with ET (9). In the present study, an ET model was
constructed using 2 doses of LPS, and verified by measuring the
concentration of TNF-α and IL-6, and the proportion of cells with
the M1-like phenotype.
Proteomics is the study of the expression of all
proteins in cells and tissues at specific times and spatial
distributions. iTRAQ technology, a novel high-throughput MS method,
is a labeling technique for peptides using isotopes in
vitro. The specific quantitative information of the protein is
collected by specifically labeling the amino group of the
polypeptide and then performing MS analysis (21). iTRAQ is a commonly used
high-channel screening technique, and has been used to study the
proteomics of sepsis in recent years (22,23).
In the present study, iTRAQ technology was used to screen for
differentially expressed proteins between ET and sepsis, and 63
differentially expressed proteins were selected.
Bioinformatics enables the analysis of large-scale
genetic, protein, metabolite and other biomolecular data by the
application of information science (24). The biological processes of the 63
differentially expressed proteins were mainly involved in the
growth and development of organ tissues, the regulation of
biological quality and response to external stimuli, which
indicated that the differential proteins had extensive biological
functions in the ET state. In the present study, differential
proteins were involved in 27 signaling pathways, including the TLR,
NF-κB and TNF signaling pathways, and antigen presentation
processes. In ET, the TLR and the NF-κB signaling pathways were
inhibited (5,24), and the downstream effector factor,
TNF-α, was downregulated. The results of the present study are
consistent with these previous findings.
The levels of HMGA1 and HMGA2 in the ET group were
higher compared with those in the LPS group, while HMGB1 and HMGB2
exhibited the opposite trend in the present study. Previous studies
have identified that HMGB1 expression is downregulated during ET
and reduces inflammatory damage (25), which is associated with the
JAK/STAT1 signaling pathway (26).
As a late mediator of sepsis, HMGB1 is released into the
extracellular space by activated macrophages ~20 h after endotoxin
stimulation in vivo and in vitro (27). The present study also demonstrated
that HMGA1, HMGA2 and HMGB2 may be involved in the formation of ET.
The association between these 4 proteins in the formation of ET
remains unclear. The reasons for this phenomenon may involve the
following 2 mechanisms: Firstly, there may be a competitive
relationship between the 4 proteins for the development of ET and
sepsis; secondly, they may serve a phased role in ET at different
times.
In conclusion, proteomics combined with
bioinformatics were applied to explore the mechanism of ET. In the
present study, HMGA1/2 and HMGB1/2 exhibited opposite expression
trends in ET, and the specific interactions between them requires
further study. iTRAQ technology can be used to screen
differentially expressed proteins, but it is costly and only
suitable for a small number of samples. Therefore, it must be used
in combination with other molecular biological techniques.
Acknowledgements
The authors would like to thank MD Xiaoping Tang
(Experimental Medicine Center, The Affiliated Hospital of Southwest
Medical University, Luzhou, Sichuan 646000, China) for Flow
cytometric technical support.
Funding
The present study was funded by grants from
Southwest Medical University, China (grant no. 2015YJ-091) and the
Affiliated Hospital of Southwest Medical University, China (grant
no. 2015-PT-015).
Availability of data and materials
All data generated or analyzed during the present
study are included in this published article.
Authors' contributions
QZ contributed to study design, drafted the
manuscript and gave final approval of the manuscript; YCH
contributed to study design and data analysis, and gave final
approval of the manuscript; JZ contributed to experimental
operation and gave final approval of the manuscript; CLD acquired
the data, revised the manuscript for important intellectual
content, gave final approval of the version to be published, and
agreed to be accountable for all aspects of the work.
Ethics approval and consent to
participate
Not applicable.
Patient consent for publication
Not applicable.
Competing interests
The authors declare that they have no competing
interests.
References
|
1
|
Taeb AM, Hooper MH and Marik PE: Sepsis:
Current definition, pathophysiology, diagnosis, and management.
Nutr Clin Pract. 32:296–308. 2017. View Article : Google Scholar : PubMed/NCBI
|
|
2
|
Dellinger RP, Levy MM, Rhodes A, Annane D,
Gerlach H, Opal SM, Sevransky JE, Sprung CL, Douglas IS, Jaeschke
R, et al: Surviving sepsis campaign: International guidelines for
management of severe sepsis and septic shock, 2012. Crit Care Med.
41:580–637. 2013. View Article : Google Scholar : PubMed/NCBI
|
|
3
|
Salomao R, Brunialti MK, Rapozo MM,
Baggio-Zappia GL, Galanos C and Freudenberg M: Bacterial sensing,
cell signaling, and modulation of the immune response during
sepsis. Shock. 38:227–242. 2012. View Article : Google Scholar : PubMed/NCBI
|
|
4
|
Bai Y, Lu B and Sun Q: Pre-exposure to
fine particulate matters may induce endotoxin tolerance in a mouse
model. Austin J Environ Toxicol. 1:10042015.PubMed/NCBI
|
|
5
|
López-Collazo E and Del Fresno C:
Pathophysiology of endotoxin tolerance: Mechanisms and clinical
consequences. Crit Care. 17:2422013. View
Article : Google Scholar : PubMed/NCBI
|
|
6
|
Biswas SK and Lopez-Collazo E: Endotoxin
tolerance: New mechanisms, molecules and clinical significance.
Trends Immunol. 30:475–487. 2009. View Article : Google Scholar : PubMed/NCBI
|
|
7
|
Lacatus M: Innate immunity in surgical
patients. Chirurgia (Bucur). 108:18–25. 2013.PubMed/NCBI
|
|
8
|
Draisma A, Pickkers P, Bouw MP and van der
Hoeven JG: Development of endotoxin tolerance in humans in vivo.
Crit Care Med. 37:1261–1267. 2009. View Article : Google Scholar : PubMed/NCBI
|
|
9
|
Pena OM, Pistolic J, Raj D, Fjell CD and
Hancock RE: Endotoxin tolerance represents a distinctive state of
alternative polarization (M2) in human mononuclear cells. J
Immunol. 186:7243–7254. 2011. View Article : Google Scholar : PubMed/NCBI
|
|
10
|
Milot E, Fotouhi-Ardakani N and Filep JG:
Myeloid nuclear differentiation antigen, neutrophil apoptosis and
sepsis. Front Immunol. 3:3972012. View Article : Google Scholar : PubMed/NCBI
|
|
11
|
Xiong Y and Medvedev AE: Induction of
endotoxin tolerance in vivo inhibits activation of IRAK4 and
increases negative regulato rs IRAK-M, SHIP-1, and A20. J Leukoc
Biol. 90:1141–1148. 2011. View Article : Google Scholar : PubMed/NCBI
|
|
12
|
Piao W, Song C, Chen H, Diaz MA, Wahl LM,
Fitzgerald KA, Li L and Medvedev AE: Endotoxin tolerance
dysregulates MyD88- and Toll/IL-1R domain-containing adapter
inducing IFN-beta-de pendent pathways and increases expression of
negative regulators of TLR signaling. J Leukoc Biol. 86:863–875.
2009. View Article : Google Scholar : PubMed/NCBI
|
|
13
|
Cohen P: The search for physiological
substrates of MAP and SAP kinases in mammalian cells. Trends Cell
Biol. 7:353–361. 1997. View Article : Google Scholar : PubMed/NCBI
|
|
14
|
Nahid MA, Satoh M and Chan EK: MicroRNA in
TLR signaling and endotoxin tolerance. Cell Mol Immunol. 8:388–403.
2011. View Article : Google Scholar : PubMed/NCBI
|
|
15
|
Nahid MA, Satoh M and Chan EK: Interleukin
1β-responsive MicroRNA-146a is critical for the cytokine-induced
tolerance and cross-tole rance to toll-like receptor ligands. J
Innate Immun. 7:428–440. 2015. View Article : Google Scholar : PubMed/NCBI
|
|
16
|
Curtale G, Mirolo M, Renzi TA, Rossato M,
Bazzoni F and Locati M: Negative regulation of Toll-like receptor 4
signaling by IL-10-dependent microRNA-146b. Proc Natl Acad Sci U S
A. 110:11499–11504. 2013. View Article : Google Scholar : PubMed/NCBI
|
|
17
|
Liu M, John CM and Jarvis GA: Induction of
endotoxin tolerance by pathogenic neisseria is correlated with the
inflammatory potentia l of lipooligosaccharides and regulated by
microRNA-146a. J Immunol. 192:1768–1777. 2014. View Article : Google Scholar : PubMed/NCBI
|
|
18
|
Pena OM, Hancock DG, Lyle NH, Linder A,
Russell JA, Xia J, Fjell CD, Boyd JH and Hancock RE: An endotoxin
tolerance signature predicts sepsis and organ dysfunction at
initial clinical presentati on. EBioMedicine. 1:64–71. 2014.
View Article : Google Scholar : PubMed/NCBI
|
|
19
|
Beeson PB: Development of tolerance to
typhoid bacterial pyrogen and its abolition by reticulo-endothelial
blockade. Proc Soc Exp Biol Med. 61:248–250. 1946. View Article : Google Scholar : PubMed/NCBI
|
|
20
|
Morris MC, Gilliam EA and Li L: Innate
immune programing by endotoxin and its pathological consequences.
Front Immunol. 5:6802015. View Article : Google Scholar : PubMed/NCBI
|
|
21
|
Rauniyar N and Yates JR 3rd: Isobaric
labeling-based relative quantification in shotgun proteomics. J
Proteome Res. 13:5293–5309. 2014. View Article : Google Scholar : PubMed/NCBI
|
|
22
|
Cao Z, Yende S, Kellum JA, Angus DC and
Robinson RA: Proteomics reveals age-related differences in the host
immune response to sepsis. J Proteome Res. 13:422–432. 2014.
View Article : Google Scholar : PubMed/NCBI
|
|
23
|
Wu Z, Pan D, Guo Y, Zeng X and Sun Y:
iTRAQ proteomic analysis of N-acetylmuramic acid mediated
anti-inflammatory capacity in LPS-induced R AW 264.7 cells.
Proteomics. 15:2211–2219. 2015. View Article : Google Scholar : PubMed/NCBI
|
|
24
|
Yang YX and Li L: Identification of
potential biomarkers of sepsis using bioinformatics analysis. Exp
Ther Med. 13:1689–1696. 2017. View Article : Google Scholar : PubMed/NCBI
|
|
25
|
Li S, Luo C, Yin C, Peng C, Han R and Zhou
J, He Q and Zhou J: Endogenous HMGB1 is required in endotoxin
tolerance. J Surg Res. 185:319–328. 2013. View Article : Google Scholar : PubMed/NCBI
|
|
26
|
Yang NB, Ni SL, Li SS, Zhang SN, Hu DP and
Lu MQ: Endotoxin tolerance alleviates experimental acute liver
failure via inhibition of high mobility group box 1. Int J Clin Exp
Pathol. 8:9062–9071. 2015.PubMed/NCBI
|
|
27
|
Wang H, Liao H, Ochani M, Justiniani M,
Lin X, Yang L, Al-Abed Y, Wang H, Metz C, Miller EJ, et al:
Cholinergic agonists inhibit HMGB1 release and improve survival in
experimental sepsis. Nat Med. 10:1216–1221. 2004. View Article : Google Scholar : PubMed/NCBI
|