Introduction
Osteosarcoma (OS) is a primary malignant bone tumor
arising from primitive transformed cells of a mesenchymal origin
(1) and it is the 8th most common
form of childhood cancer (2).
Although OS is a rare malignancy overall, it is the most common
malignant tumor found in the bone tissue of children and usually
requires chemotherapy and surgical treatment (3,4). The
management of OS has improved over the past few decades, with the
5-year survival rate increasing from 20–30 to 60–70% (5). However, relapse and pulmonary
metastasis remain big challenges in the management of OS (6). A greater understanding of the
underlying mechanisms of OS will improve its management.
It has been reported that most cases of OS harbor
chromosomal abnormalities and gene mutations (7,8). In
total, ~70% of patients with OS showed loss-of-function mutations
in the gene encoding the retinoblastoma-associated protein
(9,10). Somatic mutations that lead to the
loss of tumor suppressor functions are a pivotal step in OS
pathogenesis, and there are a variety of genetic events that lead
to the development of OS (11).
Systematic research from the genetic perspective may help to
improve our understanding of the mechanism underlying OS.
Gene microarrays are a powerful tool to obtain gene
expression profiles. Comparisons made between normal and tumor
samples can lead to the identification of dysregulated genes; most
diseases have specific gene expression profiles and abnormal
regulation patterns (12). A
common practice for the identification of differentially expressed
genes (DEGs) is to filter results using fold change, P-values and
false discovery rates (13,14).
Weighted gene co-expression network analysis (WGCNA) can be used to
identify groups of genes with similar functions, known as gene
modules (15). Genes in the same
module tend to have similar expression patterns and, therefore, may
have similar functions. Genes with the most connectivity in a
module are called hub genes, these genes are more relevant to the
functionality of the module (14).
WGCNA has been widely accepted as an investigation tool to identify
hub genes in cancer studies.
In the present study, microarray gene expression
data derived from the same platform were extracted from the Gene
Expression Omnibus (GEO) database to identify DEGs in OS. WGCNA was
used to identify gene modules that were closely associated with OS.
Gene Ontology (GO) and Kyoto Encyclopedia of Genes and Genomes
(KEGG) enrichment analyses were used for functional annotations.
PharmGKB (16), oncoKB (17), Clinical Interpretations of Variants
in Cancer (CIViC) (18) were used
to check if potentially druggable targets could be found in closely
related modules in OS. The results of the present study may
increase the understanding of the molecular mechanisms underlying
OS and contribute to the clinical management of OS.
Materials and methods
Search strategy
The GEO database (www.ncbi.nlm.nih.gov/geo/) was used to retrieve
relevant studies (19–23) that used the Affymetrix Human Genome
U133 Plus 2.0 platform (GPL570; Affymetrix; Thermo Fisher
Scientific, Inc.) to explore the mRNA expression profiles in tumor
tissues from patients with OS or bone marrow mesenchymal stromal
cells (BM-MSCs) from healthy controls. Search terms including
‘osteosarcoma’, ‘cancer’ or ‘tumor’ or ‘neoplasm’ or ‘carcinoma’ or
‘sarcoma’, ‘mesenchymal stromal cells’ and ‘GPL570’ were used. The
species was limited to Homo sapiens.
Study selection
Inclusion criteria: i) Studies that used OS tissues
from patients or BM-BMCs from healthy controls to explore the RNA
expression profiles; and ii) for studies that used mixed tissue
types from patients with OS or healthy controls, only the data from
OS tissues and normal BM-BMCs were included. Exclusion criteria: i)
Studies that used cell lines derived from OS or human mesenchymal
stromal cells were excluded; ii) studies that used BM-MSCs
extracted from patients with osteoarthritis or osteoporosis were
excluded; and iii) studies with only ‘chp’ type original files,
other than ‘cel’ type files, were also excluded.
Data extraction and pre-processing
procedures
Raw data from eligible studies were retrieved from
GEO. GEO accession number, author, country, submission year,
platform and detailed patient information, as well as available
information from healthy controls, were obtained from the metadata.
Data were extracted by two researchers independently and conflicts
were resolved by consulting a third senior researcher. Raw data
were normalized using the R ‘affy’ package (version 1.62.0;
http://bioconductor.org/packages/affy) with
robust-multi array average methods, as described previously
(24–26). Mean expression values were
calculated for genes measured by multiple detection probes. DEGs
between patients with OS and control tissues were compared using
the Bioconductor ‘limma’ package (version 3.40.2; http://bioconductor.org/packages/limma)
(27). Genes with a fold change ≥2
and an adjusted P<0.01 were considered as DEGs.
Functional characterization of
DEGs
Microarray probe IDs were converted to Ensemble IDs
and gene symbols using ‘hgu133plus2.db’ R package (version 3.2.3;
http://bioconductor.org/packages/hgu133plus2.db)
(28). To interpret the biological
significance of DEGs, GO enrichment of cellular component,
biological process and molecular function, as well as KEGG pathway
enrichment analysis were conducted using Bioconductor
‘clusterProfiler’ R package (version 3.10.0; http://bioconductor.org/packages/clusterProfiler)
(29). The ‘Disease Ontology
semantic and enrichment analysis’ (DOSE) package (version 3.10.0;
http://bioconductor.org/packages/DOSE) (30) was used to find genes closely
associated with OS.
Principal component analysis (PCA) of
DEGs in patients with OS and controls
PCA analyses were conducted using the ClustVis
online tool (https://biit.cs.ut.ee/clustvis/) developed by
Metsalu et al (31).
Due to limitations on the file size that can be uploaded, only gene
expression values of DEGs were included in the PCA analysis. Groups
(OS or control) and gender were two of the clinical traits that
were used in the PCA analysis.
WGCNA
To identify key gene modules in OS, WGCNA was
conducted with the R ‘WGCNA’ package (version 1.46) (32). Normalized gene expression data were
used in WGCNA. Soft-connectivity was calculated using the default
parameters. Topology networks and gene modules were constructed
using one-step network construction.
Hub genes are a group of genes that tend to have
high connectivity with other genes and are expected to play pivotal
biological roles. The connections between the top 30 hub genes were
visualized using VisAnt software (version 5.51; http://visant.bu.edu). Functional annotations,
including GO and KEGG enrichment analyses, were used to highlight
the most overrepresented GO terms and KEGG pathways in modules that
were closely associated with OS. To determine if any of the hub
genes in the modules were abnormally expressed, log2
fold change (log2FC) was used to characterize the
expression pattern and enrichment scores were used for
characterizing the connectivity of genes in the yellow module.
Gene mutations may prevent the proper function of
the corresponding protein by affecting protein structure or
expression. PharmGKB (16), oncoKB
(17), and CIViC (18) are three databases that provide
information about the treatment implications of specific cancer
gene alterations, and how these mutations affect response to
treatment. In the present study, these databases were used to
identify any potentially druggable targets in the modules that were
found to be closely related with OS.
Tumor infiltrating immune cell
profiling using CIBERSORT
Tumor microenvironments are critical to tumor cell
survival and proliferation. Tumor infiltrating leukocytes are
usually present in the microenvironment of solid tumors. The
CIBERSORT webtool (version 1.06; http://cibersort.stanford.edu) (33) was used to estimate the abundancy of
tumor-infiltrating immune cells in the OS microenvironment. LM22,
which consisted of gene expression data from 22 distinct immune
cell types, was used as reference in the present study (34).
Results
Characteristics of the included
studies
In total, five eligible studies were included in the
present study (19–23). RNA expression data were extracted
from 48 patients with OS and 12 BM-MSCs from these previous studies
(Table SI). Details of the
included studies are shown in Table
I. For GSE18043 and GSE36474, only data from three eligible
individuals were included from each dataset (19,22).
There were two biological replicates in GSE35331 (21), the results from the first set were
included in the present study. More detailed information of the
included individuals from each study can be found in Table SI. The original gene expression
files from the included individuals were downloaded from the GEO
website.
 | Table I.Characteristics of the included
studies. |
Table I.
Characteristics of the included
studies.
| Author, year | Country | GEO accession | Platform | OS cases | Controls | Samples type | (Refs.) |
|---|
| Vella et al,
2016 | The
Netherlands | GSE87437 | GPL570 | 21 | NA | High-grade
osteosarcoma | (23) |
| Kobayashi et
al, 2009 | Japan | GSE14827 | GPL570 | 27 | NA | Fresh frozen tumor
specimens | (20) |
| Hamidouche et
al, 2009 | Germany | GSE18043 | GPL570 | NA | 3 | BM-MSCs | (19) |
| André et al,
2013 | Belgium | GSE36474 | GPL570 | NA | 3 | BM-MSCs | (22) |
| Guilloton et
al, 2012 | France | GSE35331 | GPL570 | NA | 6 | BM-MSCs | (21) |
Identification and functional
annotation of DEGs in OS
The Bioconductor ‘affy’ package was used to
pre-process raw data for background correction and normalization.
In total, expression values from 54,613 probes representing 20,188
known genes with symbols were analyzed in the present study. The
mean expression values of multiple probes corresponding to each
gene were calculated as the final expression value. The
Bioconductor ‘limma’ package was used to identify DEGs. When the
cutoff values were set as |log2FC|>1 (adjusted
P<0.01), 1,405 genes were found to be dysregulated (including
927 up- and 478 downregulated genes) in OS compared with controls
(Table SII). When cutoff values
were set as |log2FC|>2 (adjusted P<0.01), there
were 354 genes dysregulated (including 224 up- and 130
downregulated genes) in OS compared with controls. The top 10 most
up- and downregulated genes are shown in Tables II and III. PCA analysis revealed that these
DEGs could distinguish OS from normal controls and that there was
no disparity between males and females (Fig. S1).
| Table II.Top 10 upregulated genes in
osteosarcoma. |
Table II.
Top 10 upregulated genes in
osteosarcoma.
| Gene symbol |
Log2FC | AveExp | t-score | P-value |
Padj |
|---|
| CPE | 6.01 | 9.77 | 13.95 | <0.001 | <0.001 |
| MMP9 | 5.96 | 10.45 | 9.99 | <0.001 | <0.001 |
| SPARCL1 | 5.93 | 8.60 | 13.18 | <0.001 | <0.001 |
| S100A4 | 5.92 | 10.98 | 23.45 | <0.001 | <0.001 |
| CA2 | 5.60 | 8.08 | 9.62 | <0.001 | <0.001 |
| COL15A1 | 5.29 | 8.75 | 12.64 | <0.001 | <0.001 |
| ACP5 | 5.19 | 9.01 | 7.89 | <0.001 | <0.001 |
| C1QC | 5.18 | 8.93 | 16.32 | <0.001 | <0.001 |
| MMP13 | 5.17 | 8.91 | 6.80 | <0.001 | <0.001 |
| MRC1 | 5.00 | 7.55 | 15.24 | <0.001 | <0.001 |
| Table III.Top 10 downregulated genes in
osteosarcoma. |
Table III.
Top 10 downregulated genes in
osteosarcoma.
| Gene symbol |
Log2FC | AveExp | t-score | P-value |
Padj |
|---|
|
KRTAP1-5 | −5.36 | 5.76 | −17.48 | <0.001 | <0.001 |
| DKK1 | −4.68 | 7.14 | −7.45 | <0.001 | <0.001 |
| STC2 | −4.25 | 6.78 | −16.57 | <0.001 | <0.001 |
| TFPI2 | −4.23 | 5.06 | −11.62 | <0.001 | <0.001 |
| PTX3 | −4.19 | 8.95 | −7.46 | <0.001 | <0.001 |
| RGS4 | −4.08 | 6.30 | −12.49 | <0.001 | <0.001 |
| NPR3 | −4.07 | 5.77 | −16.82 | <0.001 | <0.001 |
| DSP | −4.00 | 6.85 | −8.51 | <0.001 | <0.001 |
| LTBP2 | −3.99 | 7.91 | −12.64 | <0.001 | <0.001 |
| VGLL3 | −3.91 | 5.93 | −8.69 | <0.001 | <0.001 |
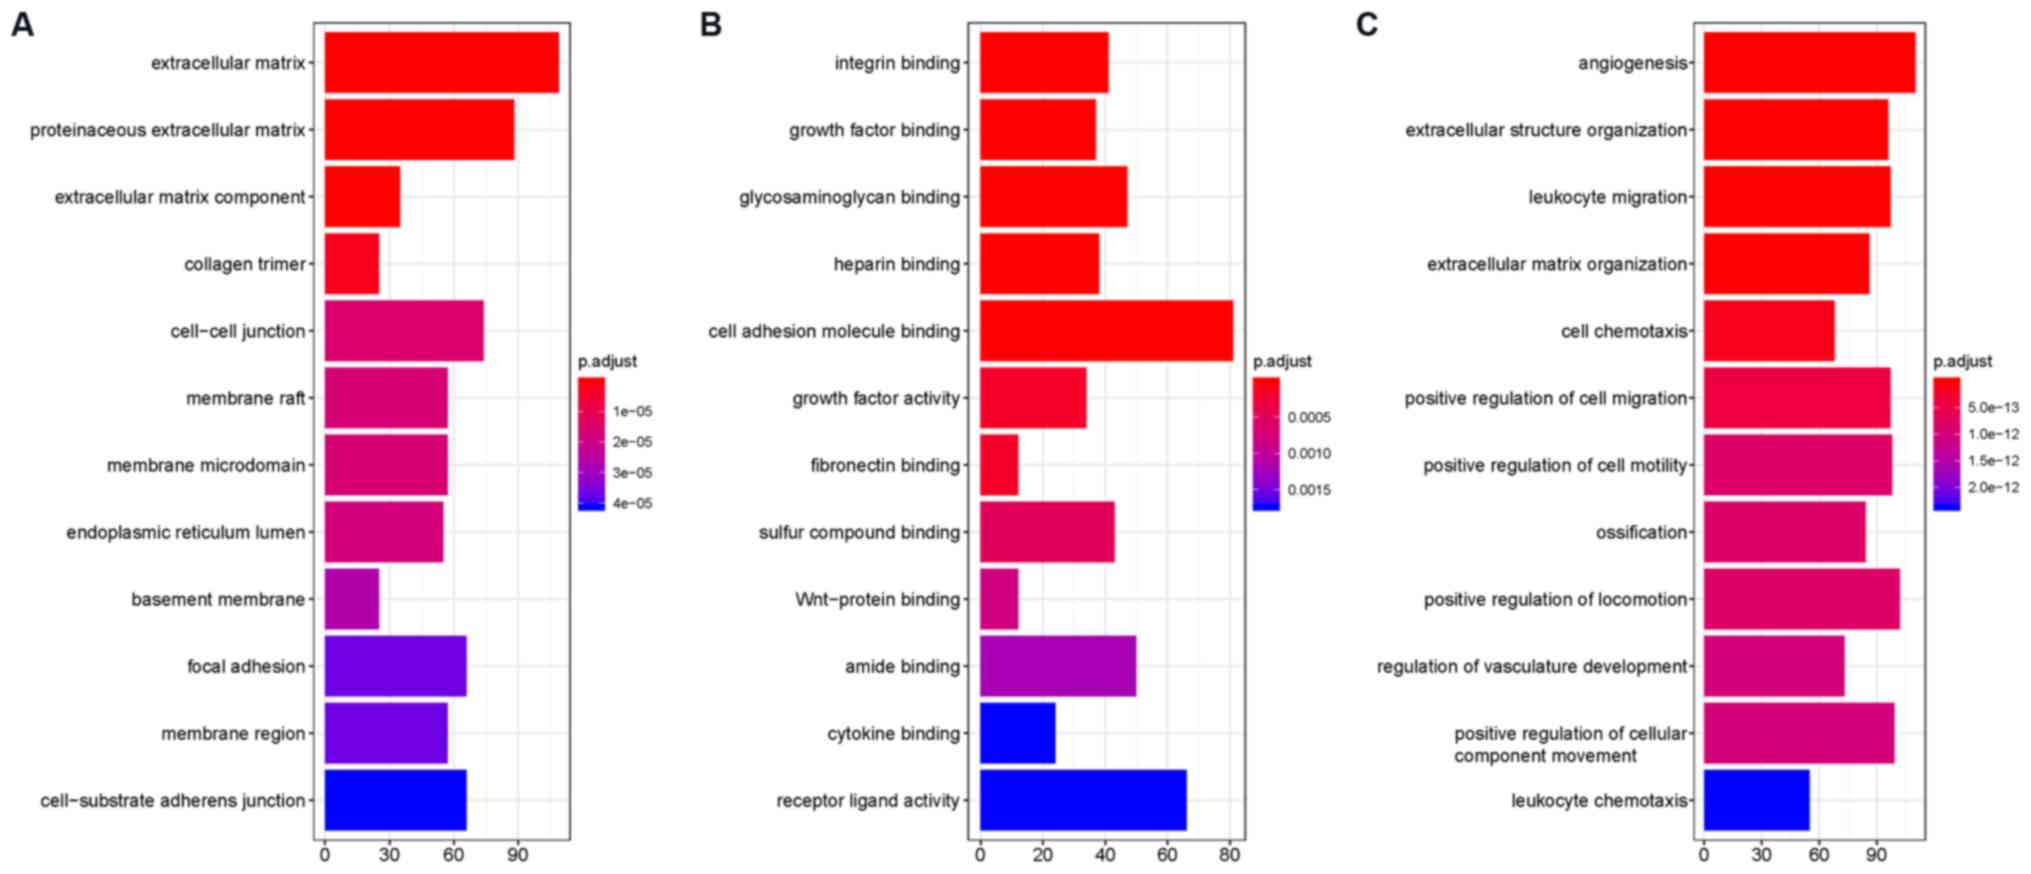
GO overrepresentation analysis showed that DEGs were
enriched in terms including ‘extracellular matrix’, ‘proteinaceous
extracellular matrix’, ‘extracellular matrix component’, ‘collagen
trimer’, ‘cell-cell junction’, ‘membrane raft’, ‘membrane
microdomain’, ‘endoplasmic reticulum lumen’ and ‘basement
membrane’. Their functions included ‘integrin binding’, ‘growth
factor binding’, ‘glycosaminoglycan binding’, ‘heparin binding’,
‘cell adhesion molecule binding’, ‘growth factor activity’,
‘fibronectin binding’, ‘sulfur compound binding’ and ‘Wnt-protein
binding’. These DEGs participated in biological processes including
‘angiogenesis’, ‘extracellular structure organization’, ‘leukocyte
migration’, ‘extracellular matrix organization’, ‘cell chemotaxis’,
‘positive regulation of cell migration’, ‘positive regulation of
cell motility’, ‘ossification’ and ‘positive regulation of
locomotion’. More detailed information can be found in Fig. 1. Dysregulation of the extracellular
matrix (ECM) could shape the tumor microenvironment and further
modulate cancer hallmarks (35).
These results also suggest that dysregulation of the ECM may
contribute to OS development and metastasis (Fig. 2).
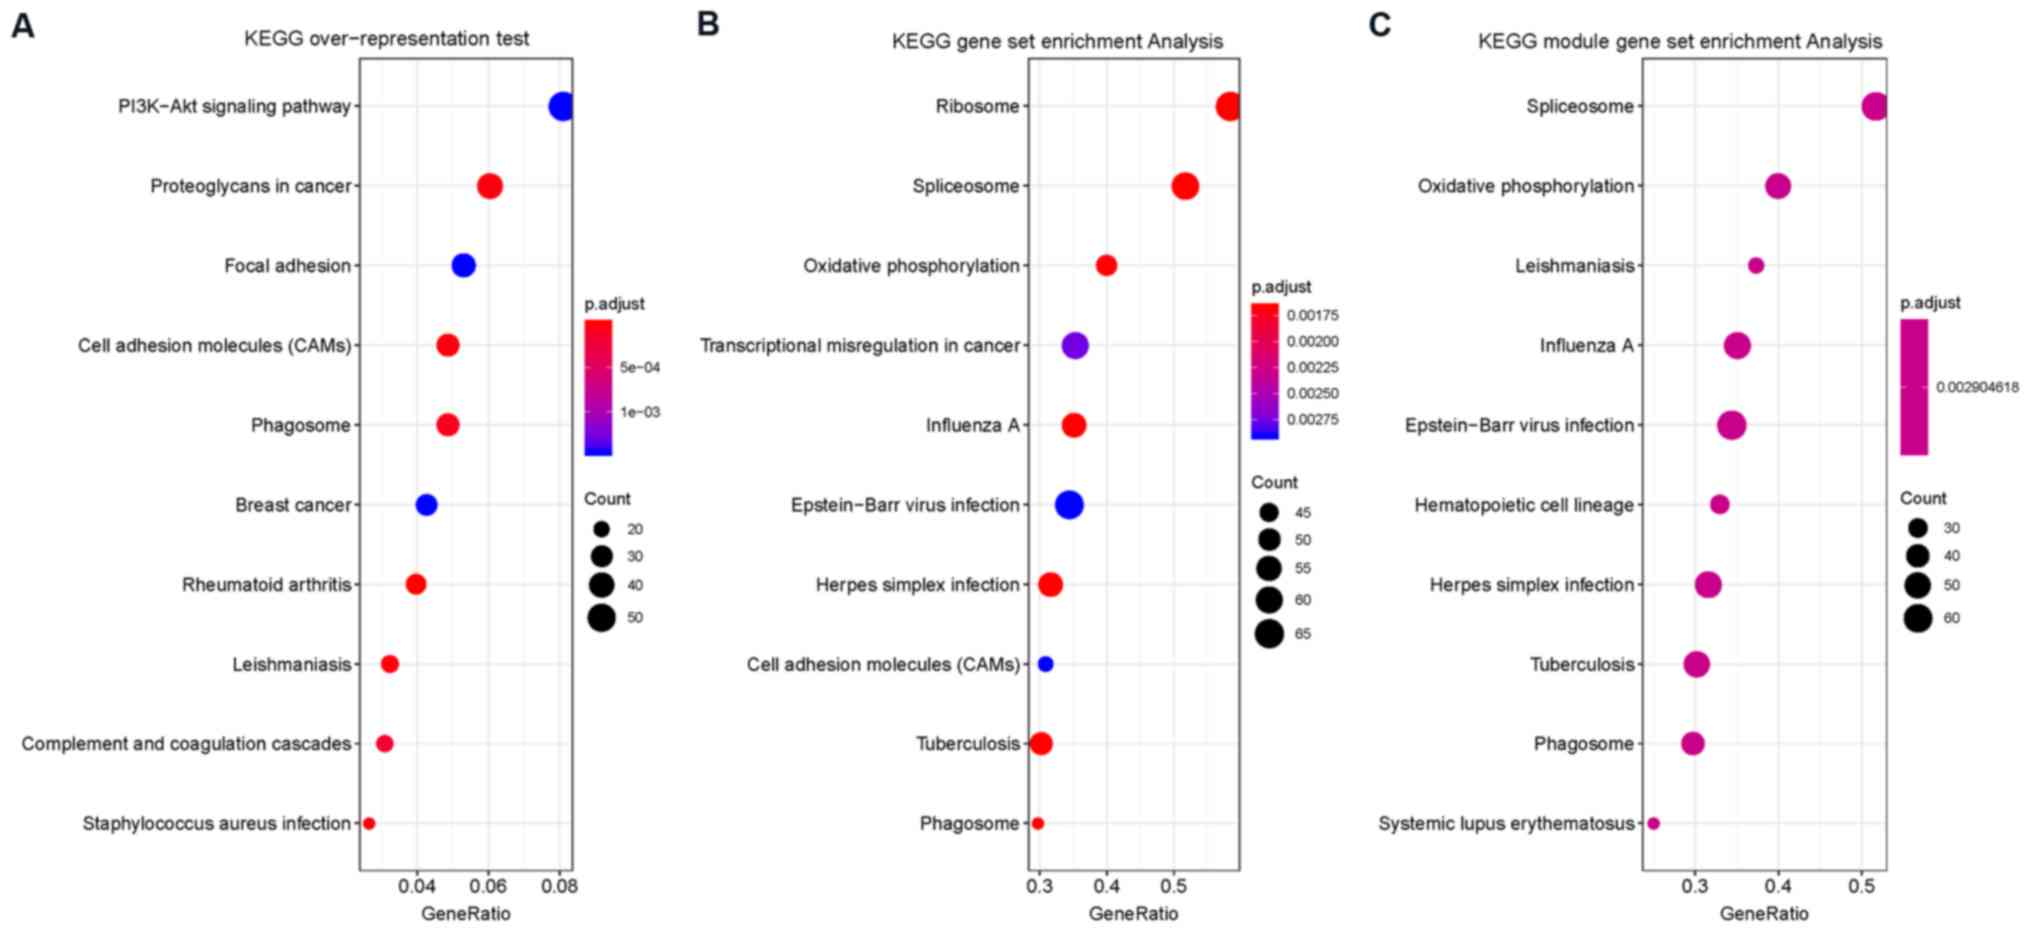
KEGG overrepresentation analysis demonstrated that
DEGs were enriched in ‘PI3K-Akt signaling pathway’, ‘proteoglycans
in cancer’, ‘focal adhesion’, ‘cell adhesion molecules (CAMs)’,
‘phagosome’, ‘breast cancer’, ‘rheumatoid arthritis’,
‘leishmaniasis’, ‘complement and coagulation cascades’ and
‘staphylococcus aureus infection’. KEGG enrichment analysis showed
that DEGs were enriched in ‘ribosome’, ‘spliceosome’, ‘oxidative
phosphorylation’, ‘transcriptional dysregulation in cancer’,
‘influenza A’, ‘Epstein-Barr virus infection’, ‘herpes simplex
infection’, ‘cell adhesion molecules (CAMs)’, ‘tuberculosis’ and
‘phagosome’.
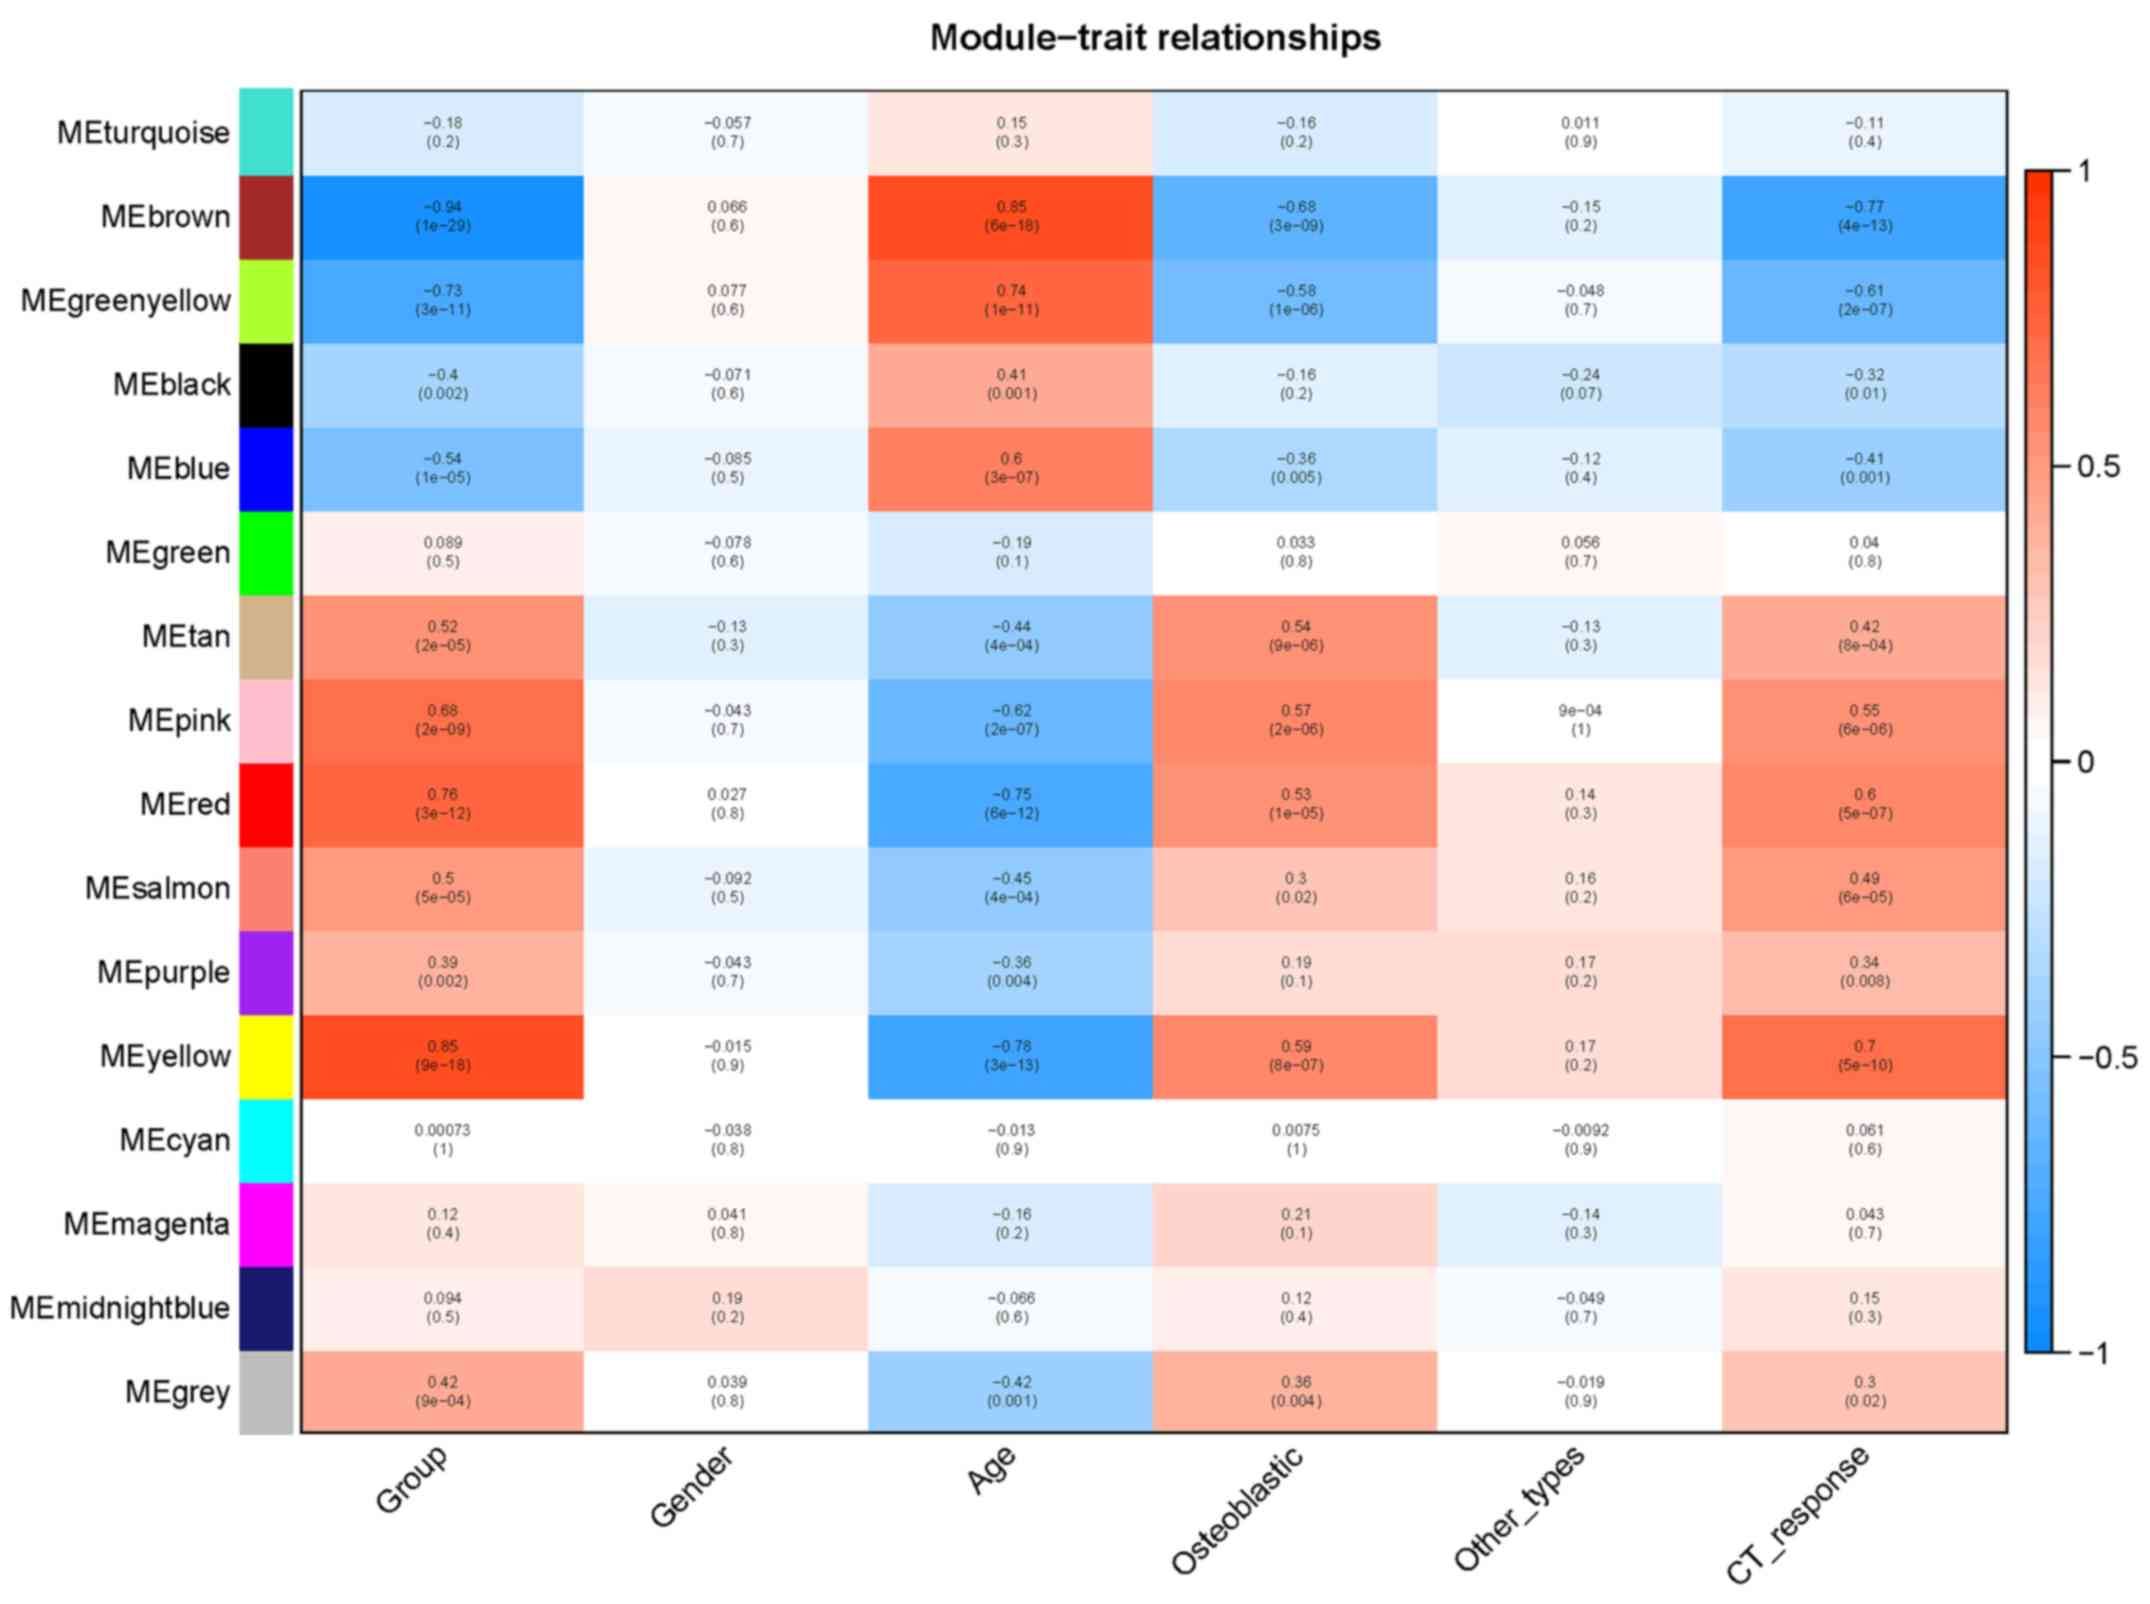
Identification of key modules and
genes closely associated with OS
Gene expression values from all genes and samples
were included in WGCNA. Soft-thresholding was selected with a power
of 12, a minimum module size of 30 and a medium sensitivity to
cluster splitting (Fig. S2). A
module-trait association heatmap was plotted to identify modules
that were significantly associated with clinical traits (Fig. 3). As shown in Fig. 3, the yellow, red and pink modules
are positively related with OS status, osteoblastic tumor type and
chemotherapy response; these three modules are negatively
associated with age. The blue module is negatively associated with
OS and positively associated with age. Modules with a height of
<0.25 were merged. In total, 15 gene modules were identified and
the dendrogram displayed together with the color assignment is
shown in Fig. 4.
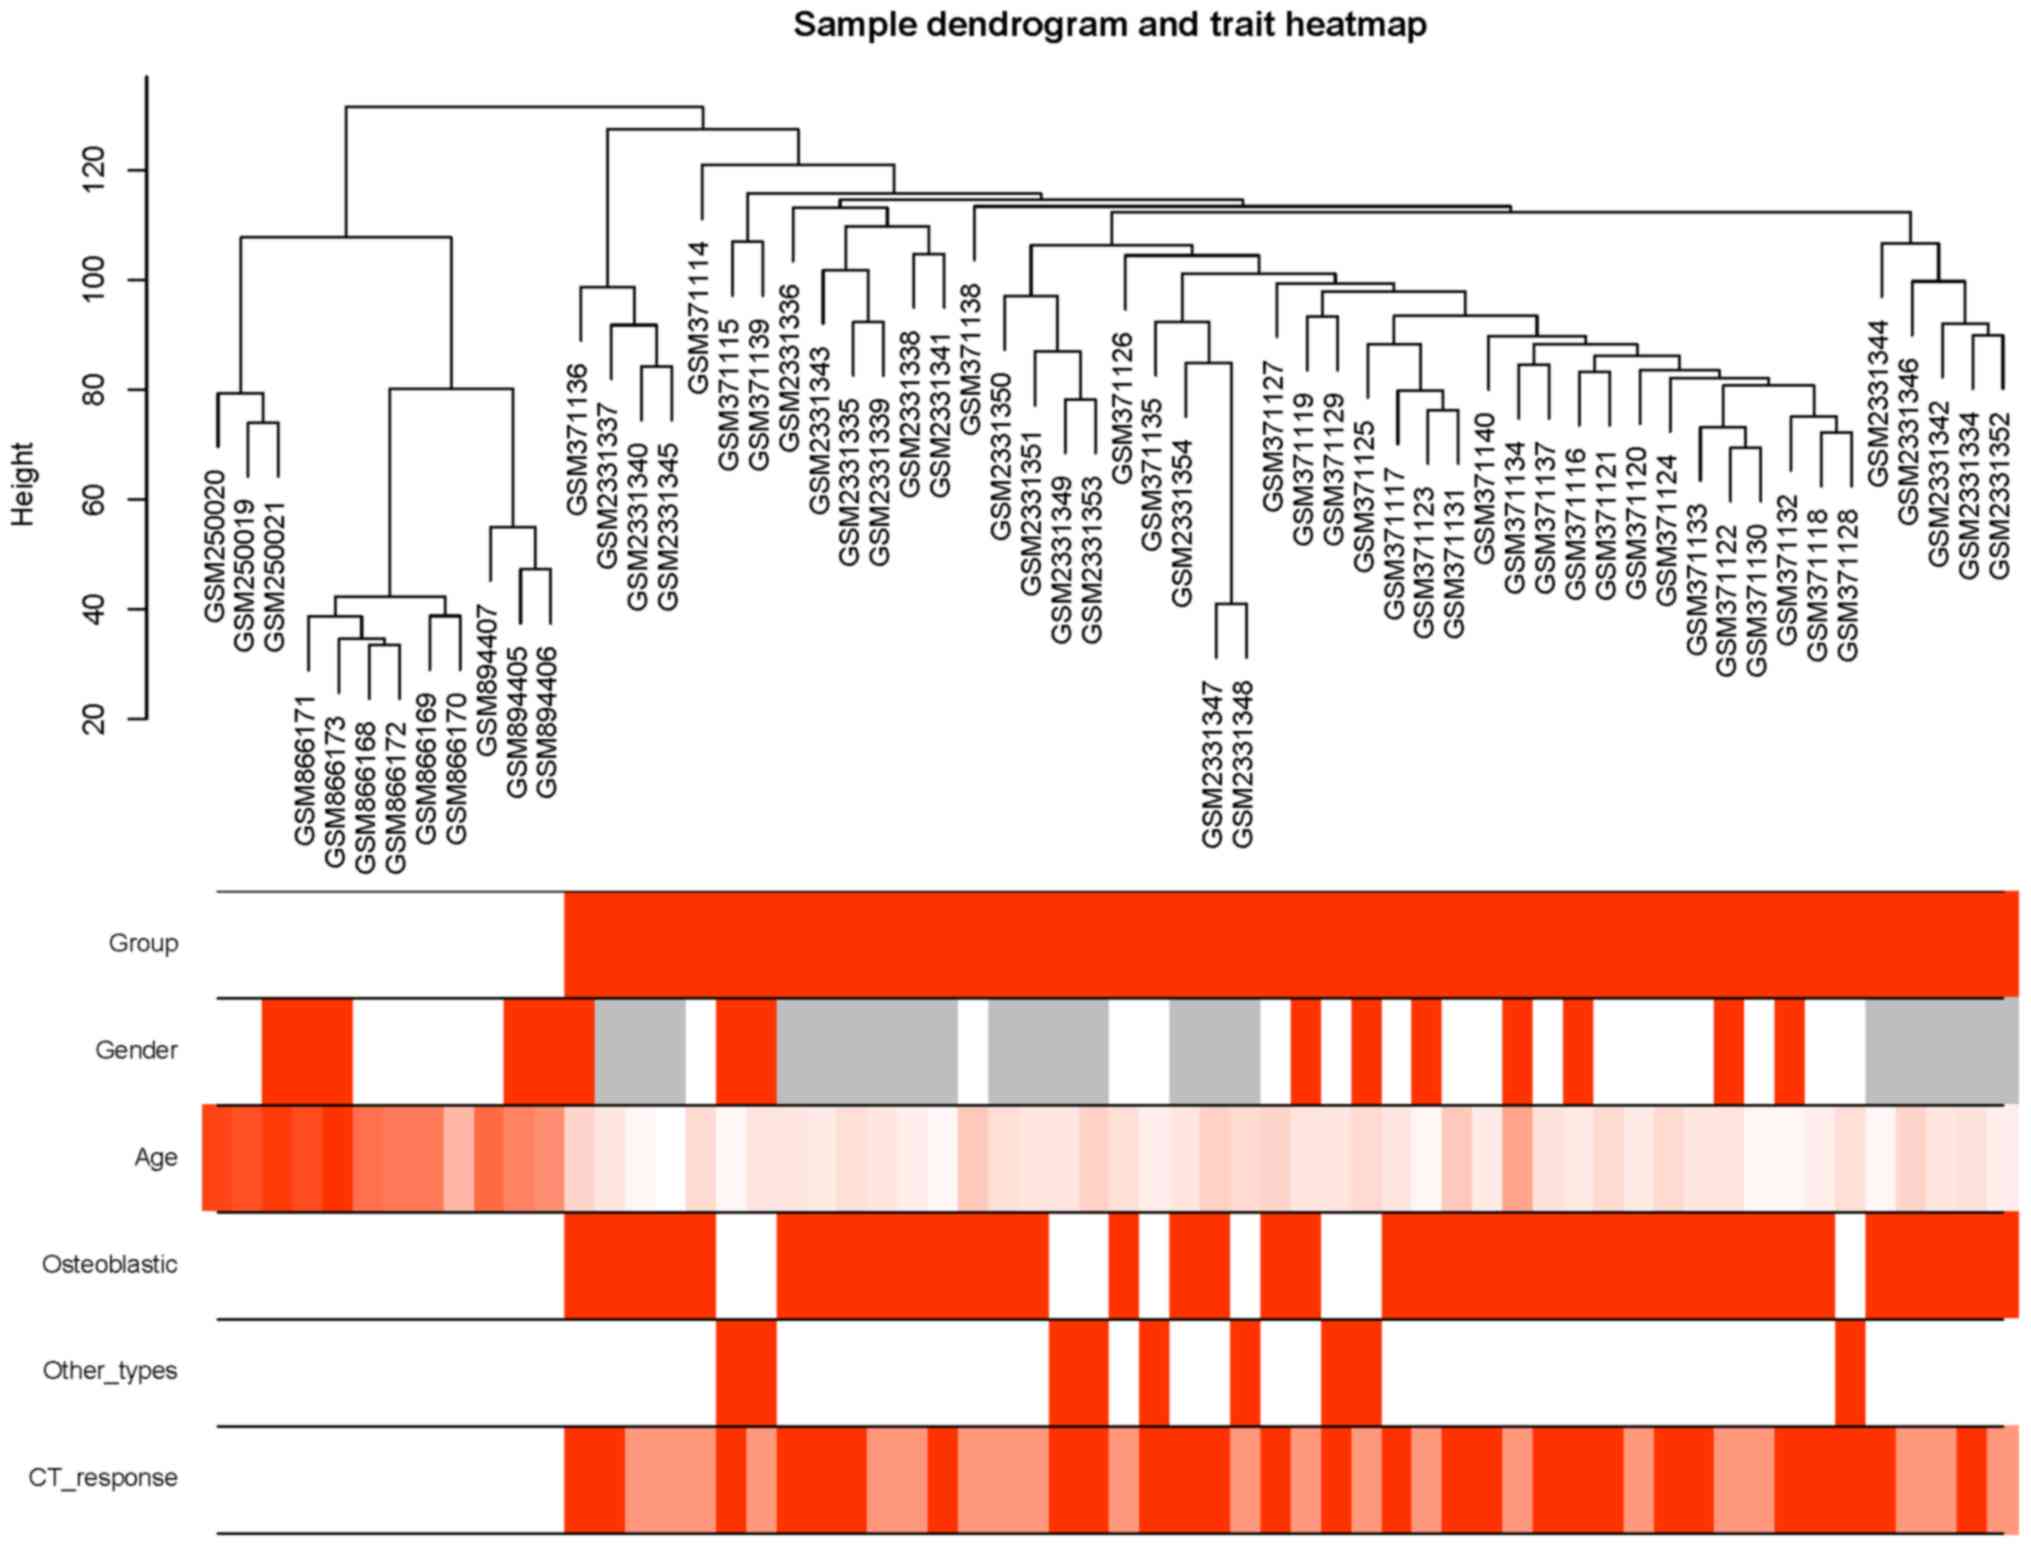 | Figure 4.Sample dendrogram and trait heatmap
for the different traits. Control and OS samples can be classified.
The average age in the control group was higher than in the OS
group. For gender, histology type (osteoblastic and other types)
and CT response, no significant patterns were found. Group: White,
BM-MSCs; orange: OS. Gender: White, male; orange, female; grey, not
reported. Age: Color scale from white (young) to orange (older).
Osteoblastic type: White, no; orange, yes. Other types: White,
osteoblastic type; orange, other types (except osteoblastic type).
CT response: White, not applicable; dark orange, poor; light
orange, good. OS, osteosarcoma; CT, chemotherapy. |
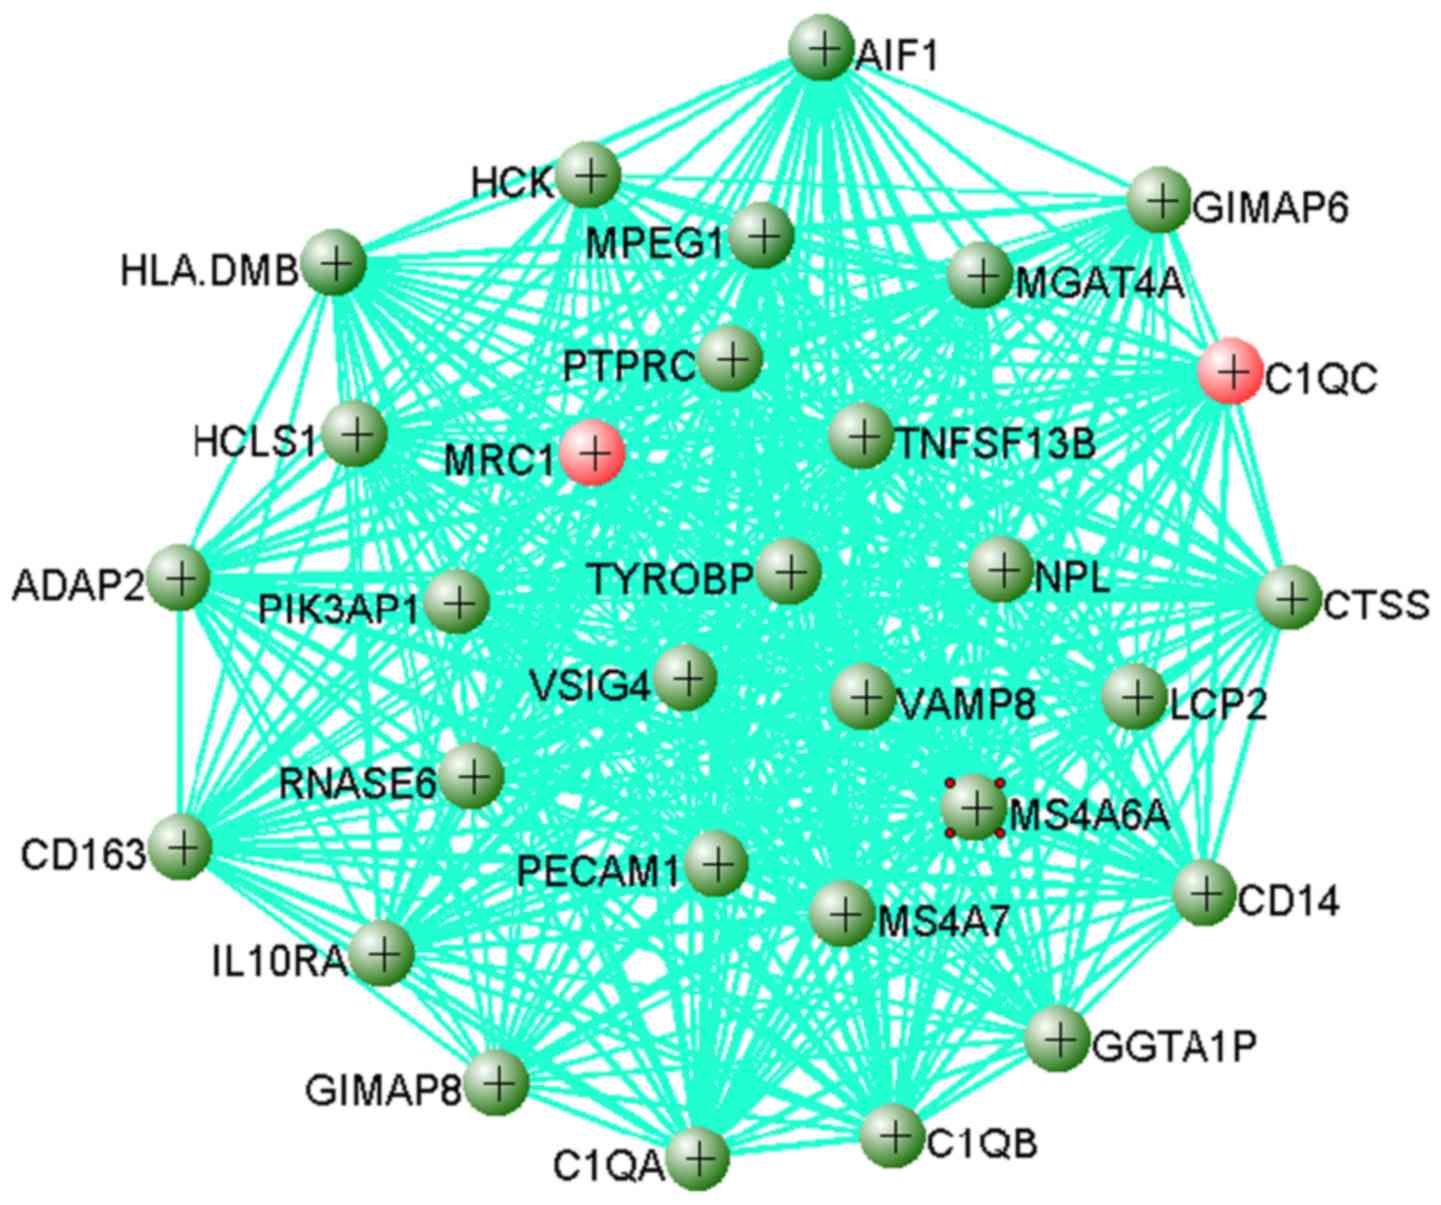
Genes in these modules may play a pivotal role in
OS. The results showed that 383 out of 749 genes in the yellow
module were dysregulated, including 358 upregulated genes and 25
downregulated genes when the cutoff value was set as
|log2FC|>1 and adjusted P<0.01. The top 30 hub
genes from the yellow module were extracted to visualize their
connections using VisAnt software (Fig. 5). As shown in Fig. 5, C1QC and MRC1 are
two hub genes that were upregulated in OS, which indicated that
these two genes may play important roles in OS.
DEGs from the yellow module were investigated using
the PharmGKB, oncoKB and CIViC databases to identify potentially
druggable targets (16–18). The results showed that MERTK
and SYK were druggable according to the CIViC database
(18,36,37).
Gene variations in CXCR4, FCGR2A, MGAT4A, NCOA1, PIK3R1, RGS5,
RRAS2 and SOD2 may be predictive markers or have
targetable variations according to the PharmGKB database (16,38–47).
A total of 10 oncogenes (CXCR4, ERG, FLT1, IGF1, KDR, LYN, MITF,
PIK3CG, REL and SYK), six tumor suppressor genes
(MITF, MAP3K1, MOB3B, NFKBIA, PRDM1 and SAMHD1) and
one gene (CSF1R), belonging to neither oncogene or tumor suppressor
gene categories, were identified, according to the oncoKB database.
Some mutations in MITF are oncogenic while others can
repress the development of cancer (17). Therefore, MITF was
classified as both a tumor suppressor and an oncogenic gene.
However, no further evidence could support these findings in OS as
the present study only included gene expression results from
microarray analysis where no gene variation data were available.
These findings were predominantly reported in breast cancer,
colorectal cancer and prostatic neoplasms, with only a few studies
in OS.
Tumor infiltrating immune cell
profiles in OS
The results of the present study showed that M0 and
M2 macrophages were two major types of immune cells found in OS
tissues. Some memory resting CD4+ T cells were present
in OS tissues. In BM-MSCs, memory resting CD4+ T cells
and naïve B cells were the two major types of immune cells
identified (Fig. S3).
Discussion
Bioinformatic approaches are widely used for the
clinical prediction of cancer diagnosis and gene research. By using
DEG analysis in combination with WGCNA, biologically meaningful
genes and gene modules can be identified as candidate biomarkers
(32,48). The present study identified five
previous studies related to OS from GEO; 1,405 genes were found
dysregulated in OS compared with BM-MSCs. These genes were found to
be involved in the ECM, according to the results from functional
annotations. WGCNA analysis showed that the yellow module was
positively associated with OS. A total of 30 hub genes were
selected to visualize their connections. Several DEGs in the yellow
module were found to be potentially druggable genes, according to
the CIViC, PharmGKB and oncoKB databases. CXCR4 belongs to
the chemokine receptor family and is an oncogene that can mediate
metastasis in cancers (49). It is
overexpressed in breast cancer (50), ovarian cancer (51), melanoma (52), and prostate cancer (53,54).
A previous study investigating gastric cancer showed that
CXCR4 mRNA expression was positively correlated with
docetaxel sensitivity (55),
indicating that docetaxel may be effective in patients with OS who
have a high level of CXCR4 mRNA expression. These findings
may be helpful for guiding the clinical management of OS.
Yang et al (56) conducted a meta-analysis of OS
microarray data in 2014 to better understand the underlying
mechanism of OS. In this previous study, data was included from
different microarray platforms, and results from OS tissue samples
and cell lines were also included. The study revealed that
‘ECM-receptor interaction’ and the ‘cell cycle’ were highly
enriched KEGG pathways, and several hub genes were identified,
including PTBP2, RGS4 and FXYD6 (56). The present study provided some
improvements in the inclusion criteria and the analytic methods
used. Evidence suggests that cell lines from different laboratories
are heterogeneous in various ways (57), therefore, gene expression profiles
generated from OS cell lines were excluded from the present study.
BM-MSCs from individuals with no signs of malignancies were
selected as controls as OS has been reported to originate from
BM-MSCs (1). Furthermore, as
different microarray platforms may have different probes to
represent the same gene, results from different platforms are not
usually directly comparable. In the present study, only RNA
expression data generated from Human Genome U133 Plus 2.0 array
(GPL570) using tissue samples were included to reduce bias. Public
databases were used to investigate key genes in order to identify
potentially druggable genes or therapeutic targets.
Results from GO and KEGG enrichment analysis
suggested that the DEGs identified participated in the ECM; this
may contribute to OS development, which was consistent with a
previous study by Yang et al (56). Many ECM proteins are significantly
dysregulated during the progression of cancer, causing both
biochemical and biomechanical changes (58). It has been reported that cancer
cells can degrade the ECM, and promote metastasis by facilitating
tumor associated angiogenesis and inflammation (59,60).
Accumulation of ECM proteins can provide a suitable
microenvironment to promote cancer cell proliferation and
metastasis (61–63). Miyata et al (64) reported that MMP2 and
MMP9 could promote the mobility of vascular epithelial cells
by remodeling the ECM. In the present study, both MMP9 and
MMP13 were found to be overexpressed in OS.
The yellow gene module was positively related to OS
and thus, may play an important role in the development of OS. The
top 30 hub genes were selected to visualize the gene-gene
interactions. Each of these genes were upregulated >2-fold. In
total, 17 out of the 30 hub genes identified were from the innate
immune system, including C1QA, C1QB, C1QC, CD14, CTSS, HCK,
HLA-DMB, IL10RA, LCP2, MRC1, PECAM1, PIK3AP1, PTPRC, RNASE6,
TNFSF13B, TYROBP and VAMP8. C1QA, C1QB and
C1QC encode the A-, B- and C-chain of the serum complement
subcomponent C1q, respectively. The protein encoded by CD14
is a component of the innate immune system and CD163
functions as an innate immune sensor in bacteria (65,66).
CTSS acts as a pivotal role in antigen presentation and can
promote cell growth during tumorigenesis (67). GGTA1P can produce an
immunogenic carbohydrate structure in Homo sapiens and the
aberrant expression of this gene is associated with autoimmune
disorders. GIMAP6 and GIMAP8 are members of the
GTPase of immunity-associated protein family, regulating lymphocyte
survival and homeostasis (68).
The protein encoded by HCK may play a role in neutrophil
migration and neutrophil degranulation (66). Expression of HCLS1 is not
restricted to hematopoietic cell lineages (69). HLA-DMA and HLA-DMB
are both required for the normal assembly of peptides onto major
histocompatibility complex class II molecules (70,71).
HLA-DMB is upregulated in the tumor tissues of patients of a
Caucasian decent, but not of African-American descent, and is
positively correlated with an increase in T cell infiltration and
an improved prognosis (72). In
mouse models, PECAM1 is associated with dysregulated
osteoclastogenesis and hematopoiesis (73). PTPRC is also known as the
CD45 antigen, which belongs to the protein tyrosine phosphatase
(PTP) family (74). PTPs can
regulate a variety of cellular processes, including cell growth,
differentiation, the mitotic cell cycle and oncogenic
transformation (74). CENTA2,
encoded by ADAP2, can bind β-tubulin and increase its
stability (75). AIF1
expression is induced by cytokines and interferon, and may promote
the activation of macrophages and the growth of vascular smooth
muscle cells (76). It has been
reported that tumor-associated macrophages can suppress the T
cell-mediated anti-tumor immune response (77). OS is a type of cold tumor, largely
due to the anti-inflammatory M2 macrophages enriched in the tumor
microenvironment, which can repress tumor-infiltrating T cells
(78,79). Results from CIBERSORT revealed that
M0 and M2 macrophages were two major types of immune cell found in
OS compared with BM-BMCs. This is consistent with the results of
previous studies that have been reviewed by Kelleher et al
(78), indicating that AIF1
may play an important role in the OS microenvironment. Programmed
cell death protein 1 (PD-1) and cytotoxic T-lymphocyte antigen 4
can downregulate the immune system by suppressing T cell-mediated
inflammatory activity in order to prevent the immune system from
killing cancer cell (80).
However, a previous study showed that a PD-1 inhibitor is only
effective in metastatic OS, as only metastatic OS expressed PD-1
(81). In the present study,
PD-1 and PD-L1 were downregulated in OS compared with
BM-MSCs.
The protein encoded by MGAT4A can regulate
the availability of serum glycoproteins, and may participate in
oncogenesis and differentiation (82). As OS is frequently infiltrated by
immune cells, including M2 macrophages and T cells (83,84),
these findings may be instrumental in developing a better
understanding of the mechanisms underlying OS. Further studies are
warranted to explore whether and how personalized chemotherapy
along with targeted therapy, including PD1 inhibitors, can benefit
patients with primary OS.
Several advantages of the present study should be
mentioned. Firstly, the inclusion criteria for relevant studies has
been improved, only RNA expression data from the same platform and
from tissues were included in the present study. Additionally, DEG
analysis was combined with WGCNA analysis, which reduced the number
of genes closely related to OS. Key genes from the yellow module
were further compared using the CIViC, PharmGKB and oncoKB
databases, and several promising druggable targets were identified.
However, there were also several limitations to the present study.
The five studies included were from The Netherlands, Japan,
Germany, Belgium and France; stratified analysis was not performed
on these data due to the relatively small samples in each study,
and the heterogeneity of the tissues used in the different studies
were unmodifiable, which should be improved in further studies.
In conclusion, the present study identified a group
of DEGs in OS using meta-analysis and bioinformatics analysis, and
several key genes that may contribute to OS were identified.
Functional annotations of these hub genes indicated that the ECM is
involved in the development of OS. The present study improved our
understanding of the mechanisms underlying the development of
OS.
Supplementary Material
Supporting Data
Acknowledgements
Not applicable.
Funding
The present study was supported by the Key Research
Program for Higher Educational Institutes of Henan Province (grant
no. 19B310007) and the Key R&D and Transfer Program for the
Institute of Science and Technology of Henan Province (grant nos.
192102310402 and 192102310034). The funding body had no role in the
study design, collection, analysis or interpretation of the data,
writing the manuscript or the decision to submit the paper for
publication.
Availability of data and materials
The datasets used and/or analyzed during the current
study are available from the corresponding author on reasonable
request.
Authors' contributions
JSh and CZ conceived the idea. JSu, HX and MQ
retrieved and screened all relevant studies, and conducted the
bioinformatic analyses. JSh prepared the manuscript with all other
authors contributing to its completion.
Ethics approval and consent to
participate
Not applicable.
Patient consent for publication
Not applicable.
Competing interests
The authors declare that they have no competing
interests.
Glossary
Abbreviations
Abbreviations:
|
OS
|
osteosarcoma
|
|
GEO
|
Gene Expression Omnibus
|
|
DEGs
|
differently expressed genes
|
|
WGCNA
|
weighted gene co-expression network
analysis
|
|
GO
|
Gene Ontology
|
|
KEGG
|
Kyoto Encyclopedia of Genes and
Genomes
|
|
ECM
|
extracellular matrix
|
|
CAMs
|
cell adhesion molecules
|
|
GIMAP
|
GTPase of immunity-associated
protein
|
|
PTP
|
protein tyrosine phosphatase
|
|
BM-MSCs
|
bone marrow mesenchymal stromal
cells
|
References
|
1
|
Luetke A, Meyers PA, Lewis I and Juergens
H: Osteosarcoma treatment-where do we stand? A state of the art
review. Cancer Treat Rev. 40:523–532. 2014. View Article : Google Scholar : PubMed/NCBI
|
|
2
|
Ottaviani G and Jaffe N: The epidemiology
of osteosarcoma. Pediatric and adolescent osteosarcoma, Springer.
3–13. 2009. View Article : Google Scholar
|
|
3
|
Grimer RJ: Surgical options for children
with osteosarcoma. Lancet Oncol. 6:85–92. 2005. View Article : Google Scholar : PubMed/NCBI
|
|
4
|
Akiyama T, Dass CR and Choong PF: Novel
therapeutic strategy for osteosarcoma targeting osteoclast
differentiation, bone-resorbing activity and apoptosis pathway. Mol
Cancer Ther. 7:3461–3469. 2008. View Article : Google Scholar : PubMed/NCBI
|
|
5
|
Mirabello L, Troisi RJ and Savage SA:
Osteosarcoma incidence and survival rates from 1973 to 2004: Data
from the Surveillance, Epidemiology, and end results program.
Cancer. 115:1531–1543. 2009. View Article : Google Scholar : PubMed/NCBI
|
|
6
|
Kempf-Bielack B, Bielack SS, Jürgens H,
Branscheid D, Berdel WE, Exner GU, Göbel U, Helmke K, Jundt G,
Kabisch H, et al: Osteosarcoma relapse after combined modality
therapy: An analysis of unselected patients in the Cooperative
Osteosarcoma Study Group (COSS). J Clin Oncol. 23:559–568. 2005.
View Article : Google Scholar : PubMed/NCBI
|
|
7
|
Kruzelock RP, Murphy EC, Strong LC, Naylor
SL and Hansen MF: Localization of a novel tumor suppressor locus on
human chromosome 3q important in osteosarcoma tumorigenesis. Cancer
Res. 57:106–159. 1997.PubMed/NCBI
|
|
8
|
Morrow JJ and Khanna C: Osteosarcoma
genetics and epigenetics: Emerging biology and candidate therapies.
Crit Rev Oncog. 20:173–197. 2015. View Article : Google Scholar : PubMed/NCBI
|
|
9
|
Belchis DA, Meece CA, Benko FA, Rogan PK,
Williams RA and Gocke CD: Loss of heterozygosity and microsatellite
instability at the retinoblastoma locus in osteosarcomas. Diagn Mol
Pathol. 5:214–219. 1996. View Article : Google Scholar : PubMed/NCBI
|
|
10
|
Benassi MS, Molendini L, Gamberi G,
Ragazzini P, Sollazzo MR, Merli M, Asp J, Magagnoli G, Balladelli
A, Bertoni F and Picci P: Alteration of pRb/p16/cdk4 regulation in
human osteosarcoma. Int J Cancer. 84:489–493. 1999. View Article : Google Scholar : PubMed/NCBI
|
|
11
|
Durfee RA, Mohammed M and Luu HH: Review
of osteosarcoma and current management. Rheumatol Ther. 3:221–243.
2016. View Article : Google Scholar : PubMed/NCBI
|
|
12
|
Lage K, Hansen NT, Karlberg EO, Eklund AC,
Roque FS, Donahoe PK, Szallasi Z, Jensen TS and Brunak S: A
large-scale analysis of tissue-specific pathology and gene
expression of human disease genes and complexes. Proc Natl Acad Sci
USA. 105:20870–20875. 2008. View Article : Google Scholar : PubMed/NCBI
|
|
13
|
Zhang S and Cao J: A close examination of
double filtering with fold change and t test in microarray
analysis. BMC Bioinformatics. 10:4022009. View Article : Google Scholar : PubMed/NCBI
|
|
14
|
Reiner A, Yekutieli D and Benjamini Y:
Identifying differentially expressed genes using false discovery
rate controlling procedures. Bioinformatics. 19:368–375. 2003.
View Article : Google Scholar : PubMed/NCBI
|
|
15
|
Zhang B and Horvath S: A general framework
for weighted gene co-expression network analysis. Stat Appl Genet
Mol Biol. 4:172005. View Article : Google Scholar
|
|
16
|
Whirl-Carrillo M, McDonagh EM, Hebert JM,
Gong L, Sangkuhl K, Thorn CF, Altman RB and Klein TE:
Pharmacogenomics knowledge for personalized medicine. Clin
Pharmacol Ther. 92:414–417. 2012. View Article : Google Scholar : PubMed/NCBI
|
|
17
|
Chakravarty D, Gao J, Phillips SM, Kundra
R, Zhang H, Wang J, Rudolph JE, Yaeger R, Soumerai T, Nissan MH, et
al: OncoKB: A precision oncology knowledge base. JCO Precis Oncol.
May 16–2017.(Epub ahead of print). doi: 10.1200/PO.17.00011.
View Article : Google Scholar
|
|
18
|
Griffith M, Spies NC, Krysiak K, McMichael
JF, Coffman AC, Danos AM, Ainscough BJ, Ramirez CA, Rieke DT, Kujan
L, et al: CIViC is a community knowledgebase for expert
crowdsourcing the clinical interpretation of variants in cancer.
Nat Genet. 49:170–174. 2017. View Article : Google Scholar : PubMed/NCBI
|
|
19
|
Hamidouche Z, Fromigué O, Ringe J, Häupl
T, Vaudin P, Pagès JC, Srouji S, Livne E and Marie PJ: Priming
integrin alpha5 promotes human mesenchymal stromal cell osteoblast
differentiation and osteogenesis. Proc Natl Acad Sci USA.
106:18587–18591. 2009. View Article : Google Scholar : PubMed/NCBI
|
|
20
|
Kobayashi E, Masuda M, Nakayama R,
Ichikawa H, Satow R, Shitashige M, Honda K, Yamaguchi U, Shoji A,
Tochigi N, et al: Reduced argininosuccinate synthetase is a
predictive biomarker for the development of pulmonary metastasis in
patients with osteosarcoma. Mol Cancer Ther. 9:535–544. 2010.
View Article : Google Scholar : PubMed/NCBI
|
|
21
|
Guilloton F, Caron G, Ménard C, Pangault
C, Amé-Thomas P, Dulong J, De Vos J, Rossille D, Henry C, Lamy T,
et al: Mesenchymal stromal cells orchestrate follicular lymphoma
cell niche through the CCL2-dependent recruitment and polarization
of monocytes. Blood. 119:2556–2567. 2012. View Article : Google Scholar : PubMed/NCBI
|
|
22
|
André T, Meuleman N, Stamatopoulos B, De
Bruyn C, Pieters K, Bron D and Lagneaux L: Evidences of early
senescence in multiple myeloma bone marrow mesenchymal stromal
cells. PLoS One. 8:e597562013. View Article : Google Scholar : PubMed/NCBI
|
|
23
|
Vella S, Tavanti E, Hattinger CM, Fanelli
M, Versteeg R, Koster J, Picci P and Serra M: Targeting CDKs with
roscovitine increases sensitivity to DNA damaging drugs of human
osteosarcoma cells. PLoS One. 11:e01662332016. View Article : Google Scholar : PubMed/NCBI
|
|
24
|
Irizarry RA, Hobbs B, Collin F,
Beazer-Barclay YD, Antonellis KJ, Scherf U and Speed TP:
Exploration, normalization, and summaries of high density
oligonucleotide array probe level data. Biostatistics. 4:249–264.
2003. View Article : Google Scholar : PubMed/NCBI
|
|
25
|
Irizarry RA, Bolstad BM, Collin F, Cope
LM, Hobbs B and Speed TP: Summaries of Affymetrix GeneChip probe
level data. Nucleic Acids Res. 31:e152003. View Article : Google Scholar : PubMed/NCBI
|
|
26
|
Gautier L, Cope L, Bolstad BM and Irizarry
RA: Affy-analysis of Affymetrix GeneChip data at the probe level.
Bioinformatics. 20:307–315. 2004. View Article : Google Scholar : PubMed/NCBI
|
|
27
|
Ritchie ME, Phipson B, Wu D, Hu Y, Law CW,
Shi W and Smyth GK: Limma powers differential expression analyses
for RNA-sequencing and microarray studies. Nucleic Acids Res.
43:e472015. View Article : Google Scholar : PubMed/NCBI
|
|
28
|
Carlson M, Falcon S, Pages H and Li N:
hgu133plus2. db: Affymetrix human genome U133 Plus 2.0 Array
annotation data (chip hgu133plus2). R package version 2. 2012.
|
|
29
|
Yu G, Wang LG, Han Y and He QY:
clusterProfiler: An R package for comparing biological themes among
gene clusters. OMICS. 16:284–287. 2012. View Article : Google Scholar : PubMed/NCBI
|
|
30
|
Yu G, Wang LG, Yan GR and He QY: DOSE: An
R/Bioconductor package for disease ontology semantic and enrichment
analysis. Bioinformatics. 31:608–609. 2015. View Article : Google Scholar : PubMed/NCBI
|
|
31
|
Metsalu T and Vilo J: ClustVis: A web tool
for visualizing clustering of multivariate data using Principal
Component Analysis and heatmap. Nucleic Acids Res. 43:W566–W570.
2015. View Article : Google Scholar : PubMed/NCBI
|
|
32
|
Langfelder P and Horvath S: WGCNA: An R
package for weighted correlation network analysis. BMC
Bioinformatics. 9:5592008. View Article : Google Scholar : PubMed/NCBI
|
|
33
|
Chen B, Khodadoust MS, Liu CL, Newman AM
and Alizadeh AA: Profiling tumor infiltrating immune cells with
CIBERSORT. Methods Mol Biol. 1711:243–259. 2018. View Article : Google Scholar : PubMed/NCBI
|
|
34
|
Newman AM, Liu CL, Green MR, Gentles AJ,
Feng W, Xu Y, Hoang CD, Diehn M and Alizadeh AA: Robust enumeration
of cell subsets from tissue expression profiles. Nat Methods.
12:453–457. 2015. View Article : Google Scholar : PubMed/NCBI
|
|
35
|
Pickup MW, Mouw JK and Weaver VM: The
extracellular matrix modulates the hallmarks of cancer. EMBO Rep.
15:1243–1253. 2014. View Article : Google Scholar : PubMed/NCBI
|
|
36
|
Schlegel J, Sambade MJ, Sather S, Moschos
SJ, Tan AC, Winges A, DeRyckere D, Carson CC, Trembath DG, Tentler
JJ, et al: MERTK receptor tyrosine kinase is a therapeutic target
in melanoma. J Clin Invest. 123:2257–2267. 2013. View Article : Google Scholar : PubMed/NCBI
|
|
37
|
Yu Y, Gaillard S, Phillip JM, Huang TC,
Pinto SM, Tessarollo NG, Zhang Z, Pandey A, Wirtz D, Ayhan A, et
al: Inhibition of spleen tyrosine kinase potentiates
paclitaxel-induced cytotoxicity in ovarian cancer cells by
stabilizing microtubules. Cancer Cell. 28:82–96. 2015. View Article : Google Scholar : PubMed/NCBI
|
|
38
|
Matsusaka S, Cao S, Hanna DL, Sunakawa Y,
Ueno M, Mizunuma N, Zhang W, Yang D, Ning Y, Stintzing S, et al:
CXCR4 polymorphism predicts progression-free survival in metastatic
colorectal cancer patients treated with first-line
bevacizumab-based chemotherapy. Pharmacogenomics J. 17:543–550.
2017. View Article : Google Scholar : PubMed/NCBI
|
|
39
|
Musolino A, Naldi N, Bortesi B, Pezzuolo
D, Capelletti M, Missale G, Laccabue D, Zerbini A, Camisa R,
Bisagni G, et al: Immunoglobulin G fragment C receptor
polymorphisms and clinical efficacy of trastuzumab-based therapy in
patients with HER-2/neu-positive metastatic breast cancer. J Clin
Oncol. 26:1789–1796. 2008. View Article : Google Scholar : PubMed/NCBI
|
|
40
|
Tamura K, Shimizu C, Hojo T, Akashi-Tanaka
S, Kinoshita T, Yonemori K, Kouno T, Katsumata N, Ando M, Aogi K,
et al: FcγR2A and 3A polymorphisms predict clinical outcome of
trastuzumab in both neoadjuvant and metastatic settings in patients
with HER2-positive breast cancer. Ann Oncol. 22:1302–1307. 2011.
View Article : Google Scholar : PubMed/NCBI
|
|
41
|
Pander J, van Huis-Tanja L, Böhringer S,
van der Straaten T, Gelderblom H, Punt C and Guchelaar HJ: Genome
wide association study for predictors of progression free survival
in patients on capecitabine, oxaliplatin, bevacizumab and cetuximab
in first-line therapy of metastatic colorectal cancer. PLoS One.
10:e01310912015. View Article : Google Scholar : PubMed/NCBI
|
|
42
|
Hartmaier RJ, Richter AS, Gillihan RM,
Sallit JZ, McGuire SE, Wang J, Lee AV, Osborne CK, O'Malley BW,
Brown PH, et al: A SNP in steroid receptor coactivator-1 disrupts a
GSK3β phosphorylation site and is associated with altered tamoxifen
response in bone. Mol Endocrinol. 26:220–177. 2012. View Article : Google Scholar : PubMed/NCBI
|
|
43
|
Pascual T, Apellániz-Ruiz M, Pernaut C,
Cueto-Felgueroso C, Villalba P, Álvarez C, Manso L, Inglada-Pérez
L, Robledo M, Rodríguez-Antona C and Ciruelos E: Polymorphisms
associated with everolimus pharmacokinetics, toxicity and survival
in metastatic breast cancer. PLoS One. 12:e01801922017. View Article : Google Scholar : PubMed/NCBI
|
|
44
|
Volz N, Stintzing S, Zhang W, Yang D, Ning
Y, Wakatsuki T, El-Khoueiry RE, Li JE, Kardosh A, Loupakis F, et
al: Genes involved in pericyte-driven tumor maturation predict
treatment benefit of first-line FOLFIRI plus bevacizumab in
patients with metastatic colorectal cancer. Pharmacogenomics J.
15:69–76. 2015. View Article : Google Scholar : PubMed/NCBI
|
|
45
|
Rokavec M, Schroth W, Amaral SM, Fritz P,
Antoniadou L, Glavac D, Simon W, Schwab M, Eichelbaum M and Brauch
H: A polymorphism in the TC21 promoter associates with an
unfavorable tamoxifen treatment outcome in breast cancer. Cancer
Res. 68:9799–9808. 2008. View Article : Google Scholar : PubMed/NCBI
|
|
46
|
Glynn SA, Boersma BJ, Howe TM, Edvardsen
H, Geisler SB, Goodman JE, Ridnour LA, Lønning PE, Børresen-Dale
AL, Naume B, et al: A mitochondrial target sequence polymorphism in
manganese superoxide dismutase predicts inferior survival in breast
cancer patients treated with cyclophosphamide. Clin Cancer Res.
15:4165–4173. 2009. View Article : Google Scholar : PubMed/NCBI
|
|
47
|
Bosó V, Herrero MJ, Santaballa A, Palomar
L, Megias JE, de la Cueva H, Rojas L, Marqués MR, Poveda JL,
Montalar J and Aliño SF: SNPs and taxane toxicity in breast cancer
patients. Pharmacogenomics. 15:1845–1858. 2014. View Article : Google Scholar : PubMed/NCBI
|
|
48
|
DiLeo MV, Strahan GD, den Bakker M and
Hoekenga OA: Weighted correlation network analysis (WGCNA) applied
to the tomato fruit metabolome. PLoS One. 6:e266832011. View Article : Google Scholar : PubMed/NCBI
|
|
49
|
Zlotnik A, Burkhardt AM and Homey B:
Homeostatic chemokine receptors and organ-specific metastasis. Nat
Rev Immunol. 11:597–606. 2011. View Article : Google Scholar : PubMed/NCBI
|
|
50
|
Holm NT, Byrnes K, Li BD, Turnage RH,
Abreo F, Mathis JM and Chu QD: Elevated levels of chemokine
receptor CXCR4 in HER-2 negative breast cancer specimens predict
recurrence. J Surg Res. 141:53–59. 2007. View Article : Google Scholar : PubMed/NCBI
|
|
51
|
Jiang YP, Wu XH, Shi B, Wu WX and Yin GR:
Expression of chemokine CXCL12 and its receptor CXCR4 in human
epithelial ovarian cancer: An independent prognostic factor for
tumor progression. Gynecol Oncol. 103:226–233. 2006. View Article : Google Scholar : PubMed/NCBI
|
|
52
|
Longo-Imedio MI, Longo N, Treviño I,
Lázaro P and Sánchez-Mateos P: Clinical significance of CXCR3 and
CXCR4 expression in primary melanoma. Int J Cancer. 117:861–865.
2005. View Article : Google Scholar : PubMed/NCBI
|
|
53
|
Zhao H, Guo L, Zhao H, Zhao J, Weng H and
Zhao B: CXCR4 over-expression and survival in cancer: A system
review and meta-analysis. Oncotarget. 6:5022–5040. 2015.PubMed/NCBI
|
|
54
|
Akashi T, Koizumi K, Tsuneyama K, Saiki I,
Takano Y and Fuse H: Chemokine receptor CXCR4 expression and
prognosis in patients with metastatic prostate cancer. Cancer Sci.
99:539–542. 2008. View Article : Google Scholar : PubMed/NCBI
|
|
55
|
Xie L, Wei J, Qian X, Chen G, Yu L, Ding Y
and Liu B: CXCR4, a potential predictive marker for docetaxel
sensitivity in gastric cancer. Anticancer Res. 30:2209–2216.
2010.PubMed/NCBI
|
|
56
|
Yang Z, Chen Y, Fu Y, Yang Y, Zhang Y,
Chen Y and Li D: Meta-analysis of differentially expressed genes in
osteosarcoma based on gene expression data. BMC Med Genet.
15:802014. View Article : Google Scholar : PubMed/NCBI
|
|
57
|
Liu Y, Mi Y, Mueller T, Kreibich S,
Williams EG, Van Drogen A, Borel C, Frank M, Germain PL, Bludau I,
et al: Multi-omic measurements of heterogeneity in HeLa cells
across laboratories. Nat Biotechnol. 37:314–322. 2019. View Article : Google Scholar : PubMed/NCBI
|
|
58
|
Venning FA, Wullkopf L and Erler JT:
Targeting ECM disrupts cancer progression. Front Oncol. 5:2242015.
View Article : Google Scholar : PubMed/NCBI
|
|
59
|
Ivanov V, Ivanova S, Roomi M, Kalinovsky
T, Niedzwiecki A and Rath M: Naturally produced extracellular
matrix inhibits growth rate and invasiveness of human osteosarcoma
cancer cells. Med Oncol. 24:209–217. 2007. View Article : Google Scholar : PubMed/NCBI
|
|
60
|
Lu P, Weaver VM and Werb Z: The
extracellular matrix: A dynamic niche in cancer progression. J Cell
Biol. 196:395–406. 2012. View Article : Google Scholar : PubMed/NCBI
|
|
61
|
Provenzano PP, Eliceiri KW, Campbell JM,
Inman DR, White JG and Keely PJ: Collagen reorganization at the
tumor-stromal interface facilitates local invasion. BMC Med.
4:382006. View Article : Google Scholar : PubMed/NCBI
|
|
62
|
Kim BG, An HJ, Kang S, Choi YP, Gao MQ,
Park H and Cho NH: Laminin-332-rich tumor microenvironment for
tumor invasion in the interface zone of breast cancer. Am J Pathol.
178:373–381. 2011. View Article : Google Scholar : PubMed/NCBI
|
|
63
|
Lee S, Stewart S, Nagtegaal I, Luo J, Wu
Y, Colditz G, Medina D and Allred DC: Differentially expressed
genes regulating the progression of ductal carcinoma in situ to
invasive breast cancer. Cancer Res. 72:4574–4586. 2012. View Article : Google Scholar : PubMed/NCBI
|
|
64
|
Miyata Y, Kanda S, Nomata K, Hayashida Y
and Kanetake H: Expression of metalloproteinase-2,
metalloproteinase-9, and tissue inhibitor of metalloproteinase-1 in
transitional cell carcinoma of upper urinary tract: Correlation
with tumor stage and survival. Urology. 63:602–608. 2004.
View Article : Google Scholar : PubMed/NCBI
|
|
65
|
Akira S, Uematsu S and Takeuchi O:
Pathogen recognition and innate immunity. Cell. 124:783–801. 2006.
View Article : Google Scholar : PubMed/NCBI
|
|
66
|
Fabriek BO, van Bruggen R, Deng DM,
Ligtenberg AJ, Nazmi K, Schornagel K, Vloet RP, Dijkstra CD and van
den Berg TK: The macrophage scavenger receptor CD163 functions as
an innate immune sensor for bacteria. Blood. 113:887–892. 2009.
View Article : Google Scholar : PubMed/NCBI
|
|
67
|
Héninger E, Krueger TE and Lang JM:
Augmenting antitumor immune responses with epigenetic modifying
agents. Front Immunol. 6:292015.PubMed/NCBI
|
|
68
|
Schwefel D, Arasu BS, Marino SF, Lamprecht
B, Köchert K, Rosenbaum E, Eichhorst J, Wiesner B, Behlke J, Rocks
O, et al: Structural insights into the mechanism of GTPase
activation in the GIMAP family. Structure. 21:550–559. 2013.
View Article : Google Scholar : PubMed/NCBI
|
|
69
|
Fischer U, Michel A and Meese EU:
Expression of the gene for hematopoietic cell specific protein is
not restricted to cells of hematopoietic origin. Int J Mol Med.
15:611–615. 2005.PubMed/NCBI
|
|
70
|
Morris P, Shaman J, Attaya M, Amaya M,
Goodman S, Bergman C, Monaco JJ and Mellins E: An essential role
for HLA-DM in antigen presentation by class II major
histocompatibility molecules. Nature. 368:551–554. 1994. View Article : Google Scholar : PubMed/NCBI
|
|
71
|
Fling SP, Arp B and Pious D: HLA-DMA and
-DMB genes are both required for MHC class II/peptide complex
formation in antigen-presenting cells. Nature. 368:554–548. 1994.
View Article : Google Scholar : PubMed/NCBI
|
|
72
|
Kinseth MA, Jia Z, Rahmatpanah F, Sawyers
A, Sutton M, Wang-Rodriguez J, Mercola D and McGuire KL: Expression
differences between African American and Caucasian prostate cancer
tissue reveals that stroma is the site of aggressive changes. Int J
Cancer. 134:81–91. 2014. View Article : Google Scholar : PubMed/NCBI
|
|
73
|
Wu Y, Tworkoski K, Michaud M and Madri JA:
Bone marrow monocyte PECAM-1 deficiency elicits increased
osteoclastogenesis resulting in trabecular bone loss. J Immunol.
182:2672–2679. 2009. View Article : Google Scholar : PubMed/NCBI
|
|
74
|
Kaplan R, Morse B, Huebner K, Croce C,
Howk R, Ravera M, Jaye M and Schlessinger J: Cloning of three human
tyrosine phosphatases reveals a multigene family of receptor-linked
protein-tyrosine-phosphatases expressed in brain. Proc Natl Acad
Sci USA. 87:7000–7004. 1990. View Article : Google Scholar : PubMed/NCBI
|
|
75
|
Zuccotti P, Cartelli D, Stroppi M, Pandini
V, Venturin M, Aliverti A, Battaglioli E, Cappelletti G and Riva P:
Centaurin-α2 interacts with β-tubulin and stabilizes microtubules.
PLoS One. 7:e528672012. View Article : Google Scholar : PubMed/NCBI
|
|
76
|
Autieri MV, Carbone C and Mu A: Expression
of allograft inflammatory factor-1 is a marker of activated human
vascular smooth muscle cells and arterial injury. Arterioscler
Thromb Vasc Biol. 20:1737–1744. 2000. View Article : Google Scholar : PubMed/NCBI
|
|
77
|
Talmadge JE and Gabrilovich DI: History of
myeloid-derived suppressor cells. Nat Rev Cancer. 13:739–752. 2013.
View Article : Google Scholar : PubMed/NCBI
|
|
78
|
Kelleher FC and O'Sullivan H: Monocytes,
macrophages and osteoclasts in osteosarcoma. J Adolesc Young Adult
Oncol. 6:396–405. 2017. View Article : Google Scholar : PubMed/NCBI
|
|
79
|
Han Q, Shi H and Liu F: CD163(+) M2-type
tumor-associated macrophage support the suppression of
tumor-infiltrating T cells in osteosarcoma. Int Immunopharmacol.
34:101–106. 2016. View Article : Google Scholar : PubMed/NCBI
|
|
80
|
Syn NL, Teng MWL, Mok TSK and Soo RA:
De-novo and acquired resistance to immune checkpoint targeting.
Lancet Oncol. 18:e731–e741. 2017. View Article : Google Scholar : PubMed/NCBI
|
|
81
|
Lussier DM, O'Neill L, Nieves LM, McAfee
MS, Holechek SA, Collins AW, Dickman P, Jacobsen J, Hingorani P and
Blattman JN: Enhanced T-cell immunity to osteosarcoma through
antibody blockade of PD-1/PD-L1 interactions. J Immunother.
38:96–106. 2015. View Article : Google Scholar : PubMed/NCBI
|
|
82
|
Yoshida A, Minowa MT, Takamatsu S, Hara T,
Oguri S, Ikenaga H and Takeuchi M: Tissue specific expression and
chromosomal mapping of a human UDP-N-acetylglucosamine:
Alpha1,3-d-mannoside beta1, 4-N-acetylglucosaminyltransferase.
Glycobiology. 9:303–310. 1999. View Article : Google Scholar : PubMed/NCBI
|
|
83
|
Buddingh EP, Kuijjer ML, Duim RA, Bürger
H, Agelopoulos K, Myklebost O, Serra M, Mertens F, Hogendoorn PC,
Lankester AC and Cleton-Jansen AM: Tumor-infiltrating macrophages
are associated with metastasis suppression in high-grade
osteosarcoma: A rationale for treatment with macrophage activating
agents. Clin Cancer Res. 17:2110–2119. 2011. View Article : Google Scholar : PubMed/NCBI
|
|
84
|
van Ravenswaay Claasen HH, Kluin PM and
Fleuren GJ: Tumor infiltrating cells in human cancer. On the
possible role of CD16+ macrophages in antitumor cytotoxicity. Lab
Invest. 67:166–174. 1992.PubMed/NCBI
|