Introduction
Lung cancer is the leading cause of cancer-related
deaths for patients worldwide, with the highest incidence rates
among all malignancies. For the purposes of treatment, lung cancer
is classified into several histological subtypes, including small
cell lung cancer (13% of cases) or non-small cell lung cancer
(NSCLC, 83% of cases) (1,2). In most countries, lung adenocarcinoma
(LUAD) is the most frequent histological NSCLC subtype. Despite
comprehensive treatment in clinical practice, most LUAD patients at
present are commonly diagnosed at late stages, and meanwhile
receive insufficient treatment efficacy (3). Therefore, identification of the novel
biomarkers and molecular events associated with LUAD biology would
provide novel insights for developing a more rational therapeutic
strategy.
Pyroptosis is a form of gasdermin (GSDM)-mediated
programmed necrosis that is essential for multicellular organism
development and immune response. The members of the GSDM
superfamily (GSDMA, GSDMB, GSDMC, GSDMD, DFNA5 and DFNB59) share a
similar pore-forming domain in their crystal structure, which is
critical to execute pyroptosis induction (4–6).
Recently, various studies have revealed the dysfunction and
abnormal expression of the GSDM family in multiple human cancers
(7,8), implying the potential roles in
tumorigenesis. Moreover, the clinical application of the GSDM
family as diagnostic and prognostic factors for cancer patients is
to be further elucidated in detail. Using high-resolution melting
curve analysis, Lutkowska et al (7) found that a single nucleotide
polymorphism (SNP) variant, rs8067378, significantly increased the
expression of GSDMB, further leading to cervical
carcinogenesis. Miguchi et al (8) demonstrated that GSDMC,
functioning as a promising oncogene, promoted cell proliferation in
colorectal cancer by depressing TGFBR2 (transforming growth factor
β receptor type II) activation. However, the potential functions
and detailed mechanisms of the GSDM family in lung cancer are still
unknown.
The present study was conducted to explore the
detailed function and molecular mechanism of the GSDM family in
LUAD biology. Using data from several bioinformatic platforms, the
expression profiles of GSDM family members were evaluated in LUAD
cases. GSDMC was found to be significantly upregulated in
LUAD samples. Moreover, data from Kaplan-Meier curves showed that
upregulated GSDMC acts as a negative prognostic indicator
for LUAD patients. Mechanistically, based on data from The Cancer
Genome Atlas (TCGA) database, the effect of DNA methylation value
of GSDMC on its expression and prognostic value were
evaluated in LUAD patients. Meanwhile, the copy number alterations
(CNAs) and mutation status of GSDMC DNA were also explored
to further investigate GSDMC dysregulation in LUAD.
Materials and methods
Reanalysis of the acquisition
data
The molecular profiles of GSDM family members in
LUAD tissues and cell lines were identified from multiple
bioinformatic platforms, such as Gene Expression Profiling
Interactive Analysis (GEPIA), UALCAN and Oncomine. GEPIA is an
online tool for gene expression profiling analyses in cancer and
adjacent tissues (9). UALCAN
platform is helpful for in-silico validation of tumor subgroup
candidate biomarkers (10).
Serving as a cancer microarray data-mining platform, Oncomine is
valuable to characterize the gene expression signatures in multiple
human cancer tissues and cells (11). The Cancer Cell Line Encyclopedia
(CCLE) project provides public access for the systematic
exploration of genetic and pharmacologic characterization in
approximately 1,457 cell lines (12). The Human Protein Atlas Project, an
international program, has been set up to draw a map of protein
signatures on a cellular level (13). Using these bioinformatics data, the
molecular profiles of the GSDM family were definitely characterized
in LUAD patients.
Several bioinformatic tools, such as cBioPortal
(14) and Kaplan-Meier Plotter
(15), were used to reanalyze the
clinical significance of GSDMC in LUAD cancer cases by
linking TCGA clinical data to mRNA expression and DNA methylation
values. In particular, using a TCGA-LUAD dataset (TCGA,
Provisional) from cBioPortal, a retrospective study was performed
to evaluate the association between GSDMC molecular profiles
and clinical pathologic characteristics in LUAD patients. MethHC
(16) and MEXPRESS (17) are two web databases that focus on
the methylomes of human diseases, databases through which we
confirmed the different methylation values between cancerous and
noncancerous tissues. An important characteristic of MethHC and
MEXPRESS is that all figures offer not just a visualization of the
findings, but also a statistical analysis. The figures show the
P-values and Pearson correlation coefficients for the comparison
between the methylation value and expression level of the
corresponding genes. The Kaplan-Meier algorithm was used to analyze
the disease prognostic markers, such as first progression (FP),
overall survival (OS) and postprogression survival (PPS). As for
the Kaplan-Meier Plotter and DNA methylation analyses, all possible
cut-off values between the lower and upper quartiles were analyzed
by the algorithm automatically, and the best performing threshold
was used as an optimal cut-off.
Subsequently, the copy number alterations (CNAs) and
mutation status of GSDMC DNA were also downloaded from the
cBioPortal web-server to re-analyze the potential roles of
GSDMC in LUAD tumorigenesis.
In addition, we selected the abovementioned
TCGA-LUAD dataset (TCGA, Provisional), which contained 517
RNA-sequenced samples, to analyze the coexpression genes of
GSDMC. Using SangerBox tools, a Volcano Plot was drawn for a
detailed visualization of differentially expressed genes (DEGs),
with the criteria of |log2 (fold change)| ≥2 and P-value
<0.05. Moreover, the functional enrichment analysis of these
DEGs, including Gene Ontology (GO) terms and Kyoto Encyclopedia of
Genes and Genomes (KEGG) pathways, was performed using Database for
Annotation, Visualization and Integration Discovery (DAVID)
(18). The visualization of GO
terms was showed by a web platform, WEB-based Gene SeT AnaLysis
Toolkit (WebGestalt) (19).
All bioinformatic tools mentioned above are
summarized in Table I.
 | Table I.Bioinformatic tools used to analyze
the roles of GSDMC in LUAD biology. |
Table I.
Bioinformatic tools used to analyze
the roles of GSDMC in LUAD biology.
Cell lines
The LUAD cell lines NCIH358 (ATCC CCL-5807), A549
(ATCC CCL-18), and their corresponding radio-resistant cells
(NCIH358R and A549R) were kindly provided by the laboratory of
Professor Deng (Winship Cancer Institute of Emory University, USA)
(20,21), and maintained in DMEM/F-12 medium
(Hyclone) containing 10% fetal bovine serum (FBS) and 1%
penicillin/gentamicin/streptomycin at 37°C with 5% carbon
dioxide.
Real-time fluorescence quantitative
PCR
As previously described (22), the total RNA was extracted from
LUAD cells and used for cDNA synthesis. Real-time fluorescence
quantitative PCR (qPCR) was performed using the CFX96 Touch
Real-Time PCR Detection System (Bio-Rad) with Applied Biosystems
Power SYBR Green PCR Master Mix (cat. no. 4367659, Thermo Fisher
Scientific, Inc.). Amplification was performed in a three-step
cycle procedure (denaturation at 95°C for 1 sec, ramp rate
20°C/sec; annealing at 60°C for 10 sec, ramp rate 20°C/sec; and
extension at 72°C for 26 sec, ramp rate 2°C/sec) for 40 cycles. The
involving primers were as follows: GSDMC forward,
5′-TCCGAAATGGTAGGCTACTGT-3′ and reverse,
5′-ATGAGGCATTGAAGAGGGTTG-3′; β-actin forward,
5′-CATGTACGTTGCTATCCAGGC-3′ and reverse,
5′-CTCCTTAATGTCACGCACGAT-3′. PCR reaction with β-actin primers was
used as an internal control. And the relative transcriptional level
of GSDMC was normalized to β-actin. After the cycle
threshold (Cq) value (power amplification knee point) was achieved,
we used the 2−ΔΔCq method to determine the relative
expression levels (23). The
specificity of amplification products was confirmed by the melting
curve analysis. All experiments were repeated at least three
times.
Statistical analyses
The differential expression of GSDMC between
normal and LUAD samples was examined by the Student's t-test with
SPSS 12.0 software (SPSS, Inc.). Wilcoxon's and Chi-square tests
were performed to study associations between GSDMC molecular
profiles and clinical pathologic characteristics. The significance
of the difference between survival as determined by Kaplan-Meier
curves was evaluated with the Logrank test. The correlation
analysis was conducted by Pearson's correlation coefficient. The
statistical differences were considered significant at a P-value of
<0.05.
Results
Identification of upregulated GSDMC in
LUAD tissues and cell lines
Using data from several bioinformatic tools,
molecular profiles of the GSDM family members were evaluated
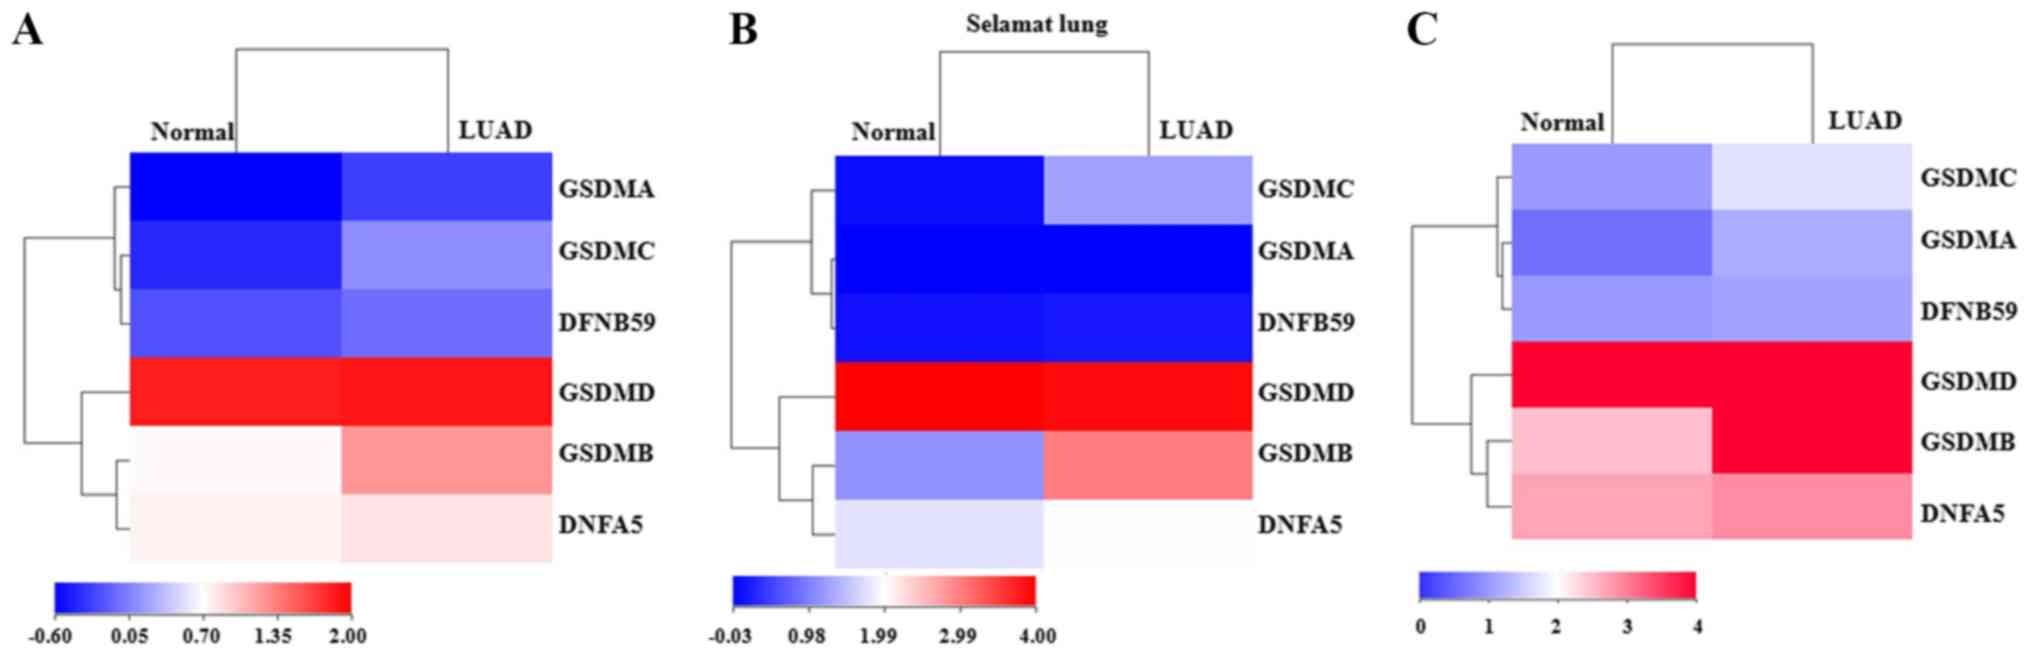
between LUAD tissues and adjacent normal lung tissues. The heatmap
of data from UALCAN showed that GSDMA, GSDMB, GSDMC and
DFNB59 were all upregulated in LUAD compared with the levels
in adjacent normal tissues (Fig.
1A). However, in a dataset (Selamat Lung) extracted from
Oncomine, only GSDMB, GSDMC and DFNA5 were found to
be significantly highly expressed in tumor tissues (Fig. 1B). Another heatmap result from
GEPIA showed that GSDMA, GSDMB and GSDMC were
significantly overexpressed in LUAD tissues (Fig. 1C). These findings collectively
revealed that both GSDMB and GSDMC were consistently
upregulated in LUAD patients. To verify these dysregulations, their
expression was further detected in LUAD tissues using the IHC data
from Human Protein Atlas project. As shown in Fig. 1D, the IHC results revealed that
moderate GSDMB expression and negative GSDMC expression could be
observed in normal lung tissues. In comparison, among the 8 cases
of LUAD tissues examined for GSDMB staining, 6 cases had negative
expression, while the remaining 2 cases had weak intensity.
Conversely, among the 11 cases of LUAD tissues examined for GSDMC
staining, 4 cases had strong or moderate staining, while the
remaining 7 cases had negative expression. All these findings
together demonstrated that GSDMC is significantly
upregulated in LUAD compared with adjacent normal tissues.
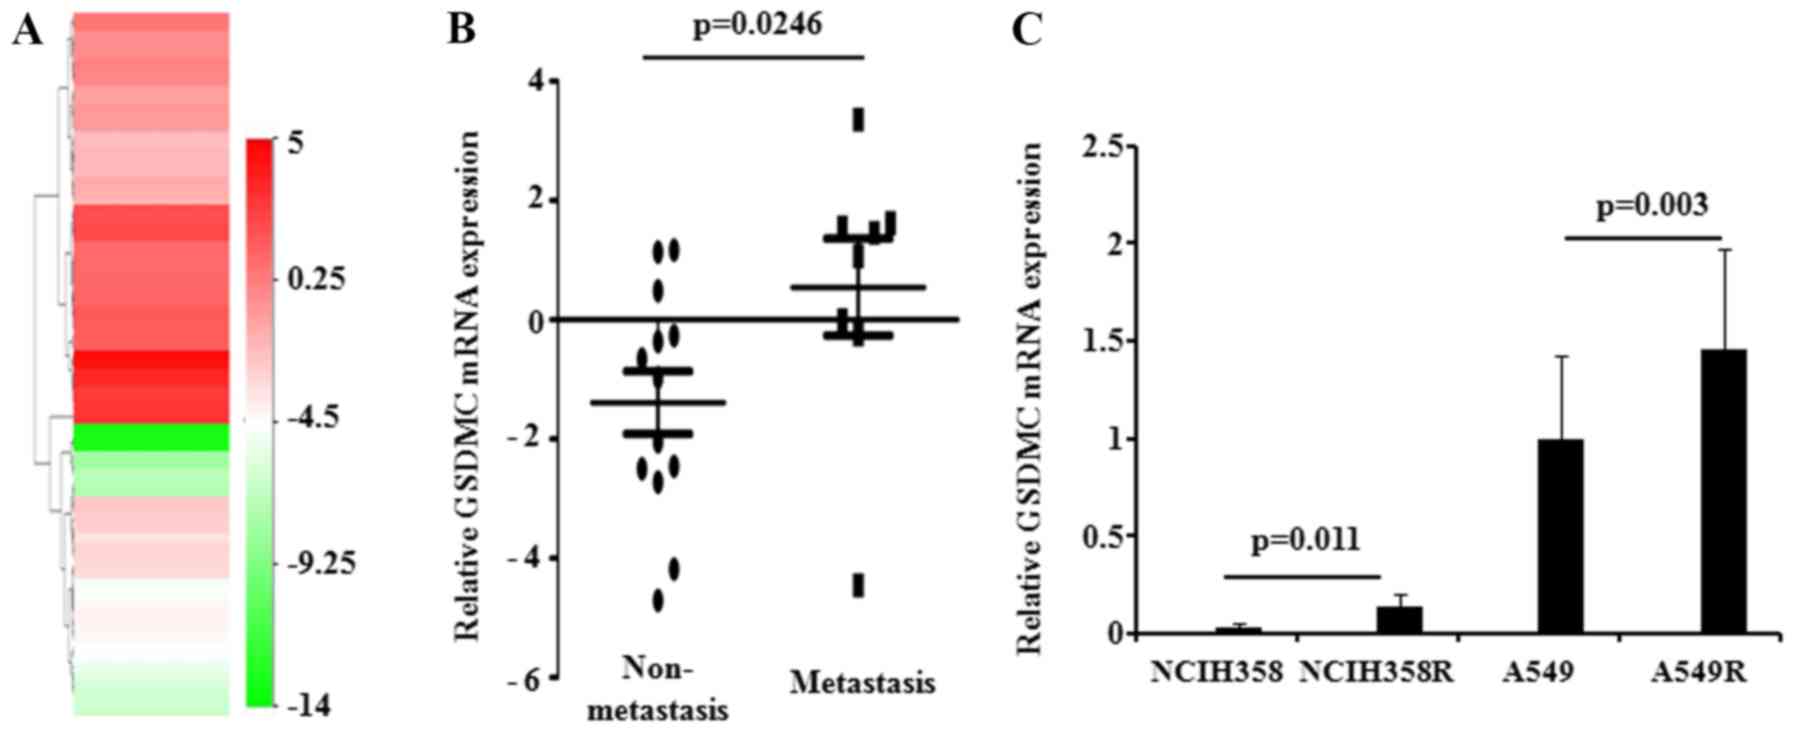
Next, the expression level of GSDMC was
established in lung cancer cells. By exploring the CCLE database, a
total of 75 LUAD cell lines with corresponding GSDMC
expression values were finally selected. The heatmap data indicated
that more than half of the bands were red, revealing the
overexpressed GSDMC level in LUAD cells (Fig. 2A, Table SI). We also compared GSDMC
expression levels in cancer cells with different metastatic
abilities. The phenotypic differences in LUAD cells are summarized
in Table SII. Expectedly, the
expression level of GSDMC was significantly upregulated in
metastatic LUAD cells (Fig. 2B).
Then, the expression of GSDMC was further determined in
radio-resistant lung cancer cells. The qPCR analysis showed that
GSDMC was obviously upregulated in radio-resistant LUAD
cells (NCIH358R and A549R), compared with the parental cells
(NCIH358 anc A549) (Fig. 2C).
Taken together, the above-mentioned data collectively demonstrated
that overexpression of GSDMC acts as a promising oncogenic
biomarker in LUAD.
Preserved GSDMC expression is an
independent indicator for LUAD patients
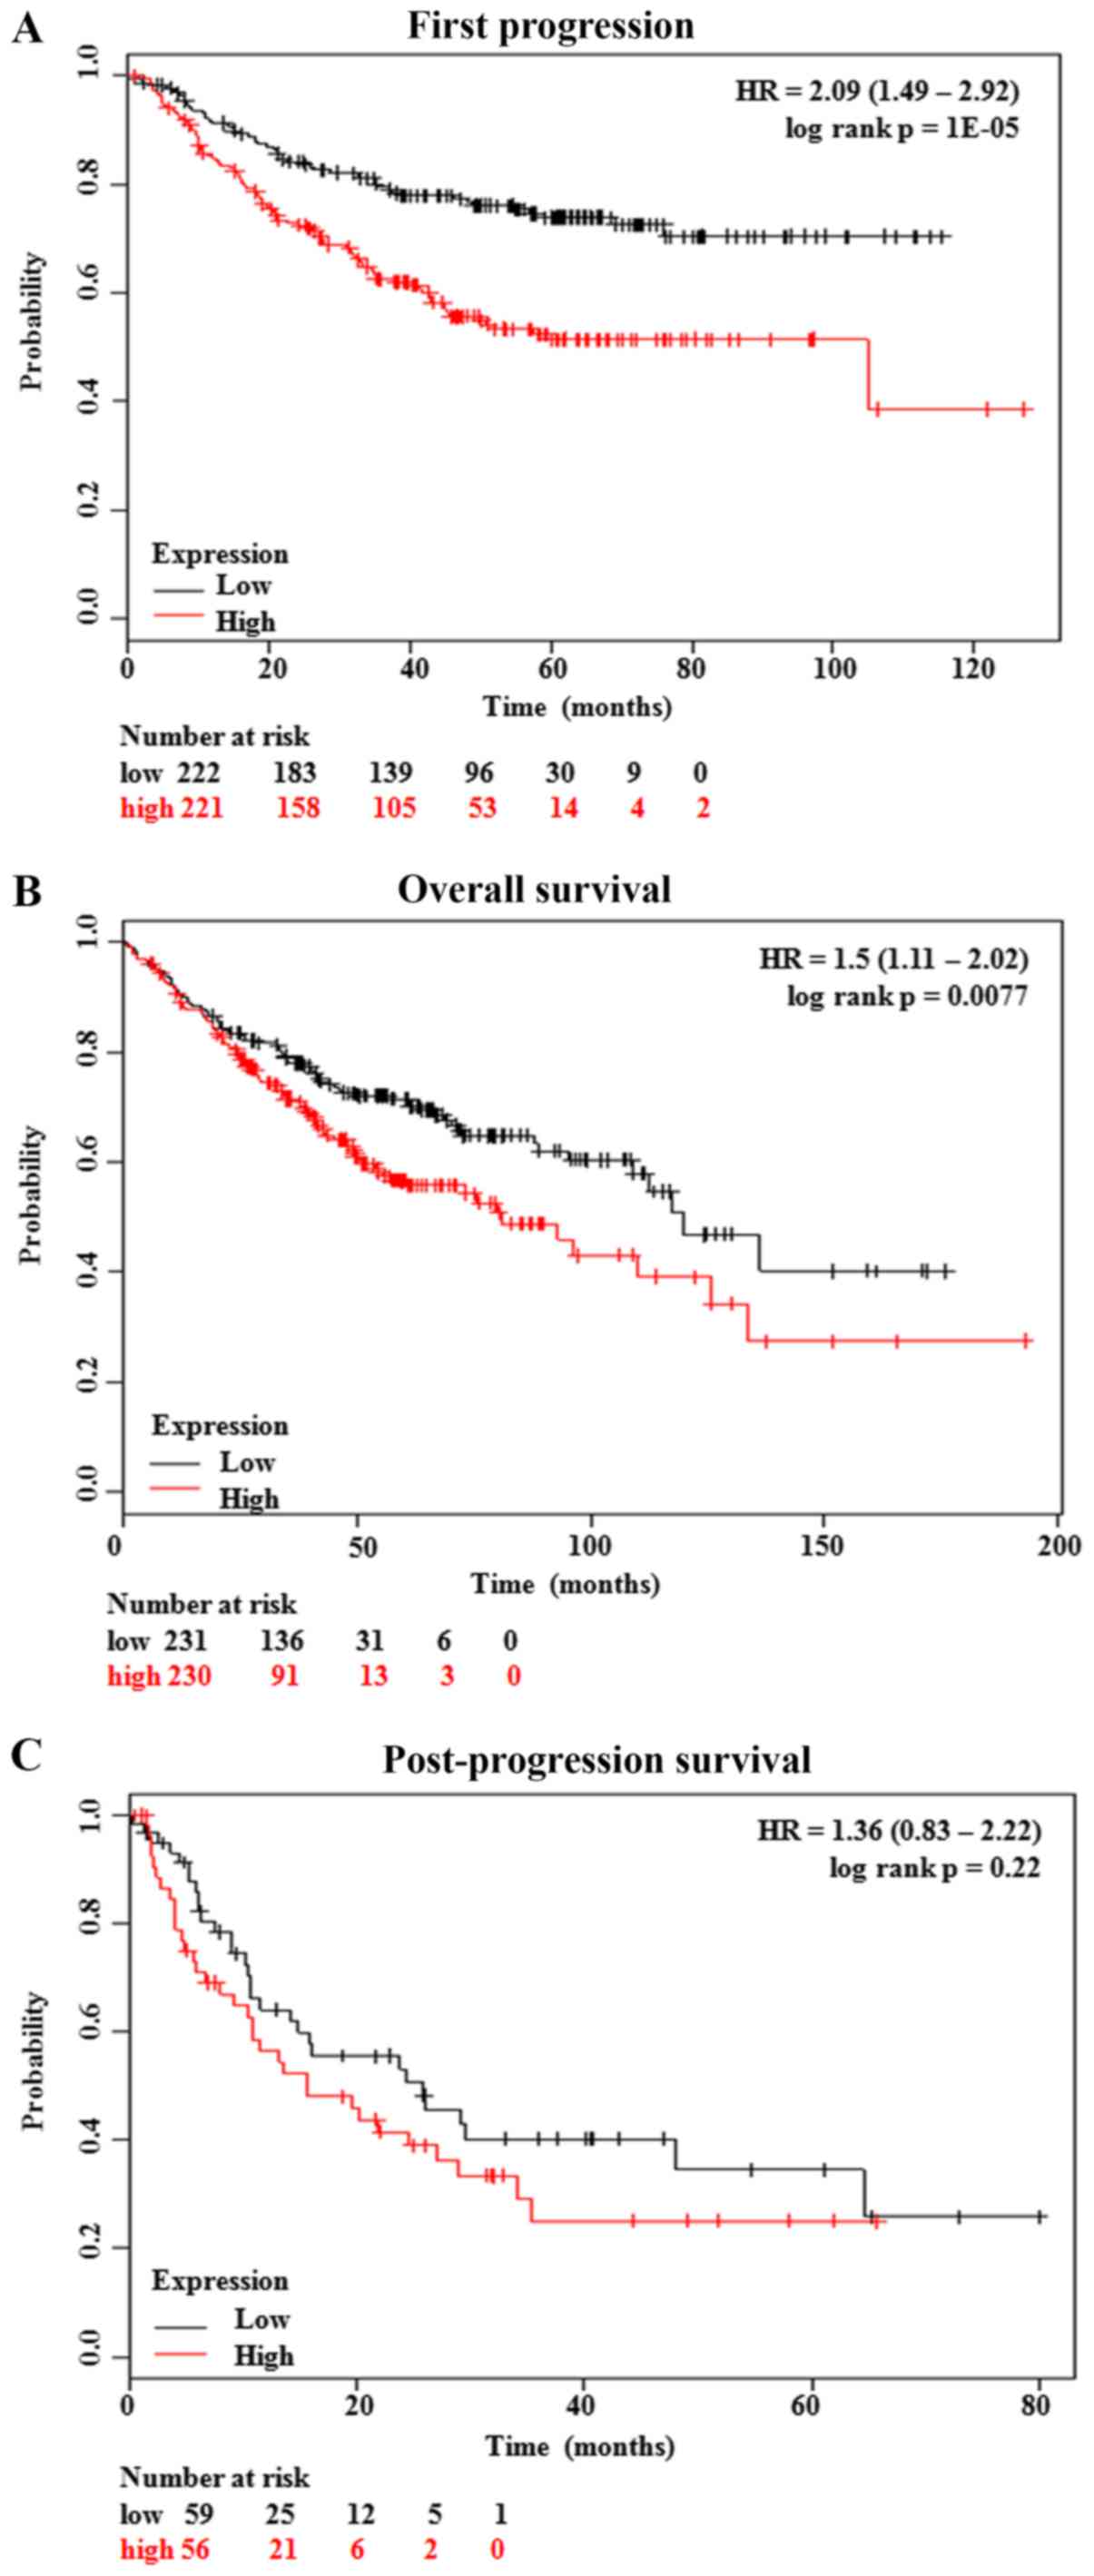
Kaplan-Meier curves showed that the LUAD patients
with low GSDMC expression had significantly better first
progression (FP) (P=0.00001) and overall survival (OS) (P=0.0077)
(Fig. 3A and B). In addition,
although patients with low GSDMC expression had a better
post-progression survival (PPS), no statistical significance was
achieved (P=0.22) (Fig. 3C). The
associations between clinical pathological characteristics and
GSDMC expression profiles are summarized in Table II. The findings showed that,
compared with the patients with low GSDMC expression, the
LUAD patients with high GSDMC expression had a significantly
higher ratio of the KRAS mutation (22/45, 48.9% vs. 1/18,
5.6%; P=0.001) and a longer history of cigarette smoking (P=0.012)
(Table II).
| Table II.Expression of GSDMC in the
TCGA-LUAD datasets. |
Table II.
Expression of GSDMC in the
TCGA-LUAD datasets.
| Patient
characteristics | No. of patients
(%) | High expression n
(%) | Low expression n
(%) | P-value |
|---|
| Sex (N=515) |
|
|
| 0.389 |
|
Male | 240 (46.6) | 158 (48.0) | 82 (44.1) |
|
|
Female | 275 (53.4) | 171 (52.0) | 104 (55.9) |
|
| Lymph node stage
(N=514) |
|
|
| 0.326 |
| N0 | 332 (64.6) | 215 (65.5) | 117 (62.9) |
|
| N1 | 95 (18.5) | 63 (19.2) | 32 (17.2) |
|
| N2 | 74 (14.4) | 44 (13.4) | 30 (16.1) |
|
| N3 | 2 (0.4) | 0 (0.0) | 2 (1.1) |
|
| NX | 11 (2.1) | 6 (1.8) | 5 (2.7) |
|
| Metastasis stage
(N=511) |
|
|
| 0.922 |
| M0 | 345 (67.5) | 222 (68.1) | 123 (66.5) |
|
| M1 | 25 (4.9) | 16 (4.9) | 9 (4.9) |
|
| MX | 141 (27.6) | 88 (27.0) | 53 (28.6) |
|
| Tumor stage
(N=515) |
|
|
| 0.675 |
| T1 | 168 (32.6) | 110 (33.4) | 58 (31.2) |
|
| T2 | 278 (54.0) | 175 (53.2) | 103 (55.4) |
|
| T3 | 47 (9.1) | 29 (8.8) | 18 (9.7) |
|
| T4 | 19 (3.7) | 14 (4.3) | 5 (2.7) |
|
| TX | 3 (0.6) | 1 (0.3) | 2 (1.0) |
|
| Stage (N=507) |
|
|
| 0.808 |
| I | 276 (54.4) | 175 (54.3) | 101 (54.6) |
|
| II | 121 (23.9) | 80 (24.8) | 41 (22.2) |
|
|
III | 84 (16.6) | 50 (15.5) | 34 (18.4) |
|
| IV | 26 (5.1) | 17 (5.3) | 9 (4.9) |
|
| Race (N=448) |
|
|
| 0.145 |
|
Asian | 8 (1.8) | 3 (1.1) | 5 (3.0) |
|
|
Black | 53 (11.8) | 29 (10.4) | 24 (14.2) |
|
|
Caucasian | 387 (86.4) | 247 (88.5) | 140 (82.8) |
|
| Age (N=496) in
years |
|
|
| 0.558 |
|
20–40 | 2 (0.4) | 2 (0.6) | 0 (0.0) |
|
|
40–60 | 134 (27.0) | 81 (25.6) | 53 (29.4) |
|
|
60–80 | 329 (66.3) | 211 (66.8) | 118 (65.6) |
|
|
≥80 | 31 (6.3) | 22 (7.0) | 9 (5.0) |
|
| KRAS
mutation (N=63) |
|
|
| 0.001 |
| No | 40 (63.5) | 23 (51.1) | 17 (94.4) |
|
|
Yes | 23 (36.5) | 22 (48.9) | 1 (5.6) |
|
| KPS (N=99) |
|
|
| 0.908 |
|
0–70 | 12 (12.1) | 6 (11.8) | 6 (12.5) |
|
| 80 | 23 (23.2) | 13 (25.5) | 10 (20.8) |
|
| 90 | 32 (32.3) | 17 (33.3) | 15 (31.3) |
|
|
100 | 32 (32.3) | 15 (29.4) | 17 (35.4) |
|
| Cigarette smoking
history, pack year (N=349) |
|
|
| 0.012 |
| ≤5 | 7 (2.0) | 5 (2.2) | 2 (1.6) |
|
|
6–20 | 51 (14.6) | 34 (15.0) | 17 (13.8) |
|
|
21–40 | 115 (33.0) | 81 (35.8) | 34 (27.6) |
|
|
41–60 | 106 (30.4) | 67 (29.6) | 39 (31.7) |
|
|
61–80 | 33 (9.5) | 17 (7.5) | 16 (13.0) |
|
|
81–100 | 17 (4.9) | 15 (6.6) | 2 (1.6) |
|
|
>100 | 20 (5.7) | 7 (3.1) | 13 (10.6) |
|
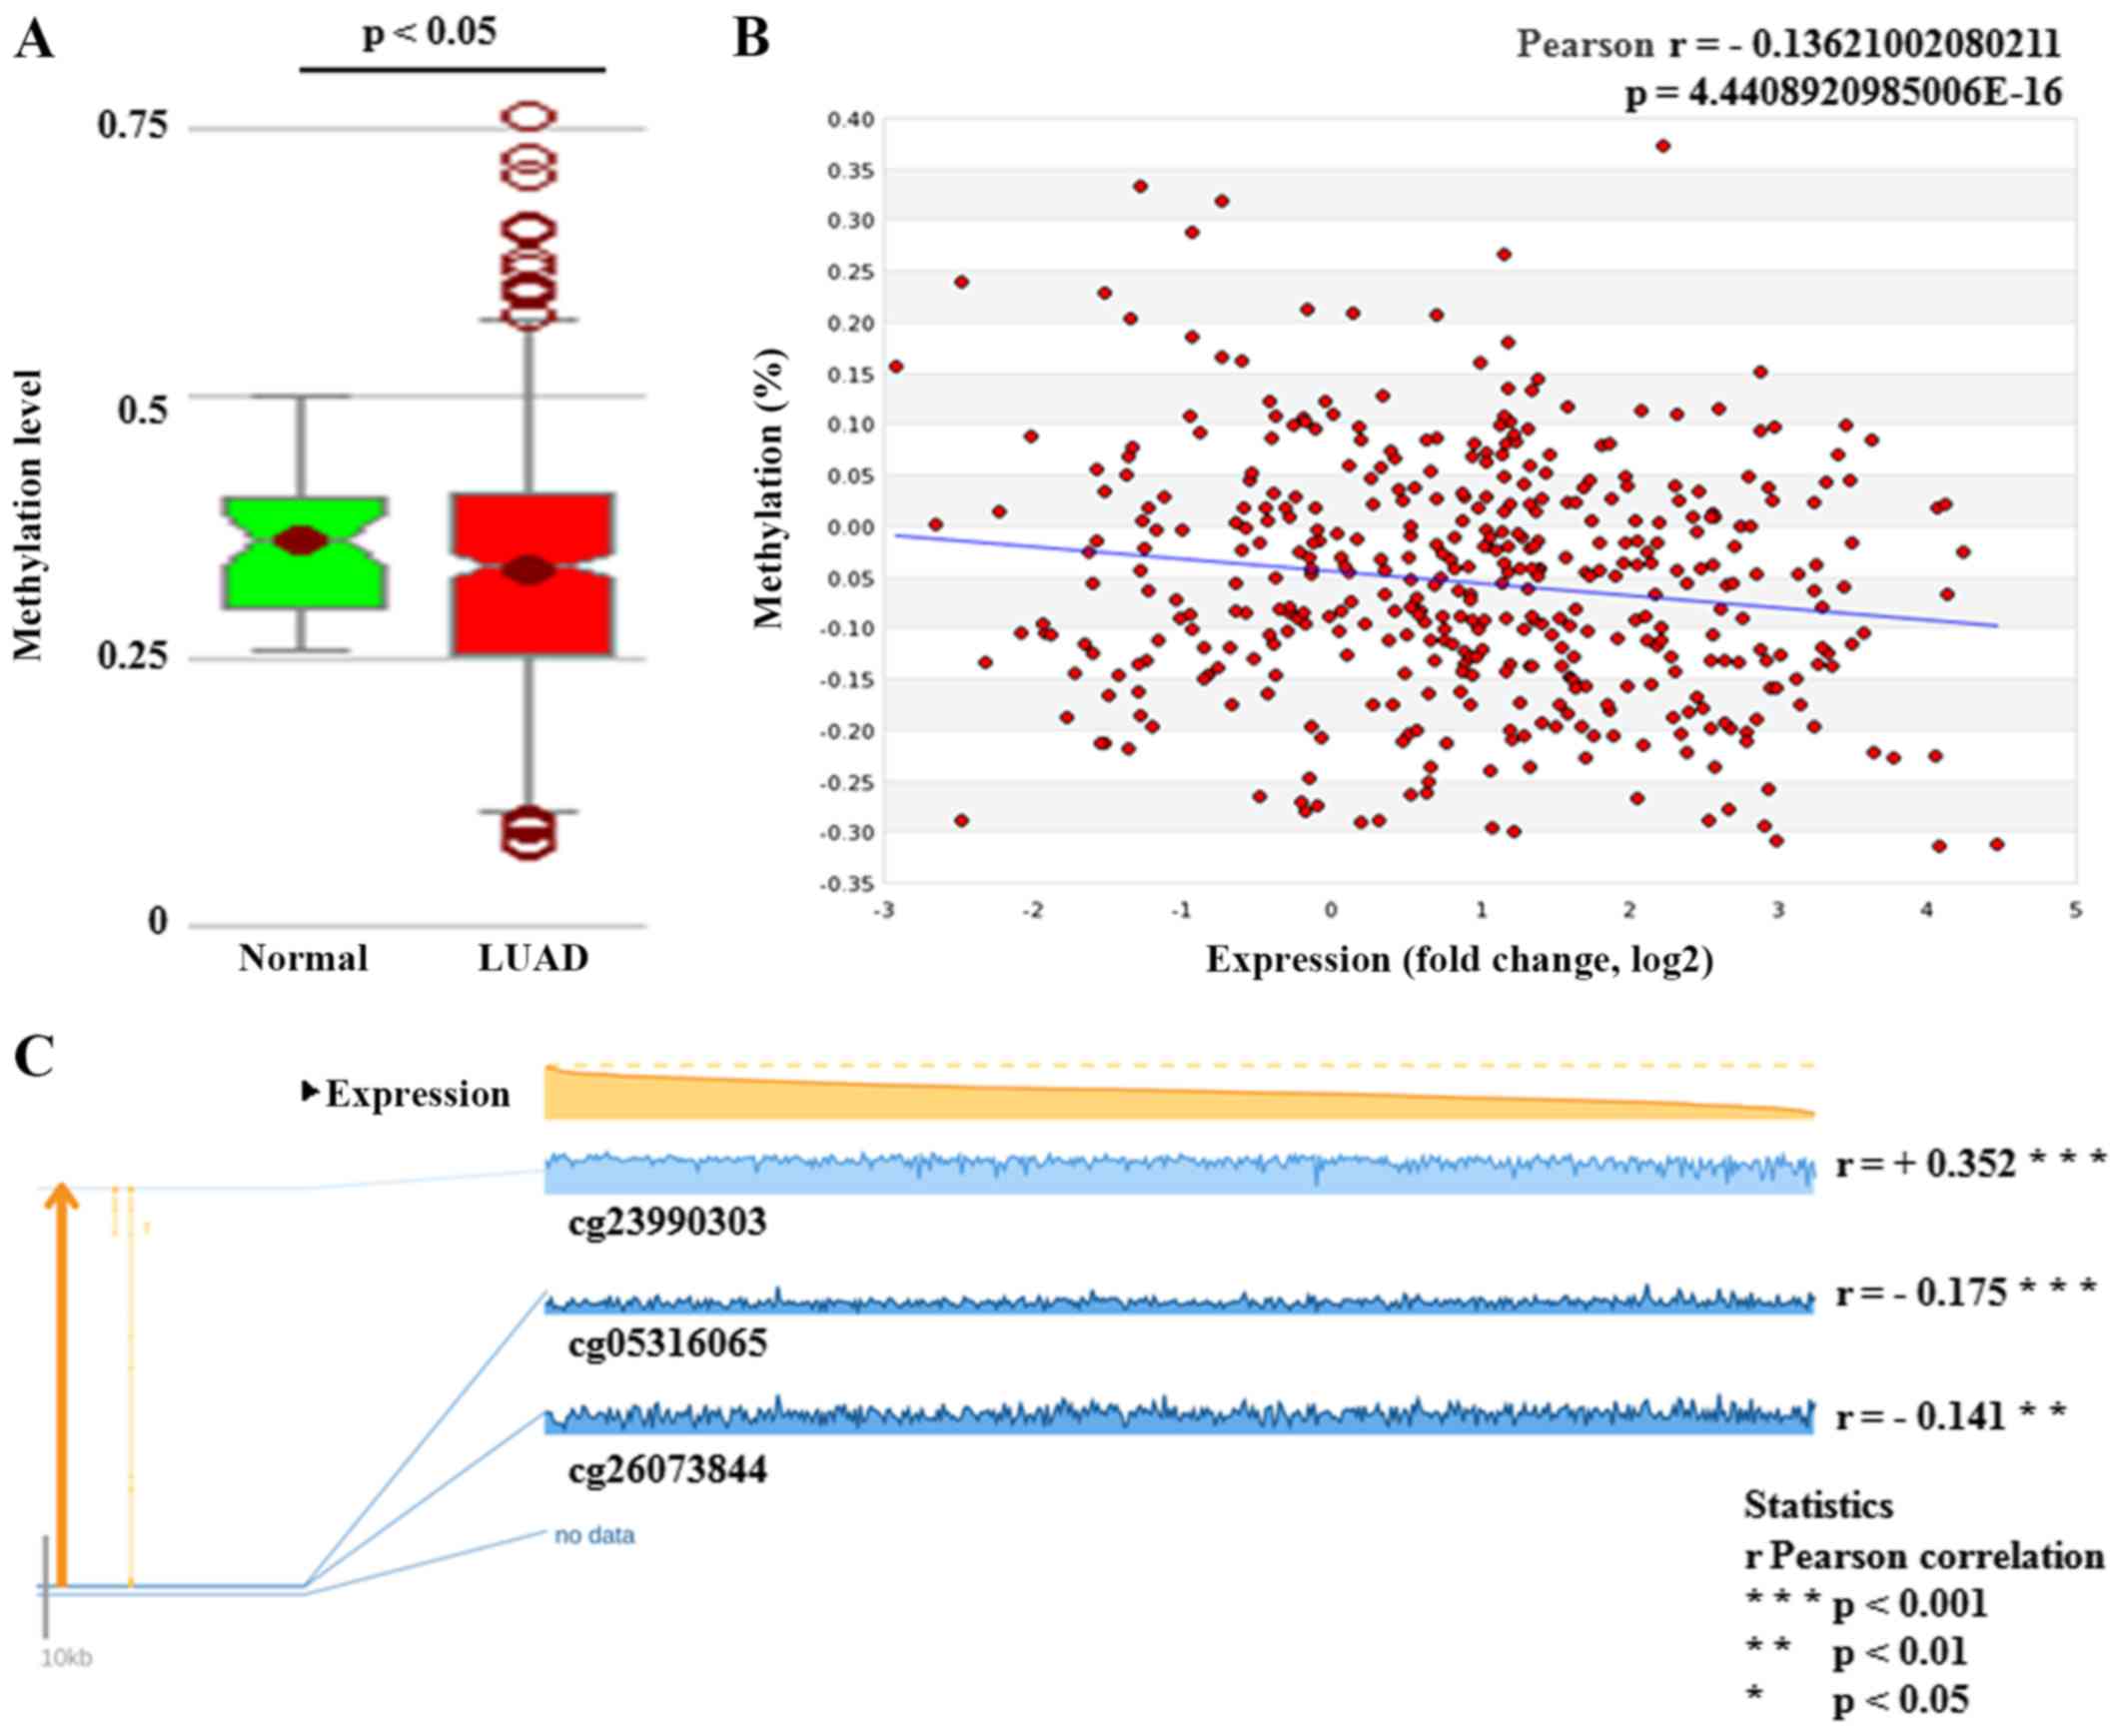
DNA hypomethylation has a negative
effect on GSDMC expression
The methylation status of GSDMC DNA was
measured using an Illumina 450K Infinium methylation chip
(Illumina, Inc.). The results from the MethHC web-tool showed that
the GSDMC methylation level was significantly lower in LUAD
tissues (P<0.05) (Fig. 4A). A
significantly negative correlation was found between GSDMC
expression and its DNA methylation status (Pearson's r=−0.136,
P<0.001) (Fig. 4B). Meanwhile,
regression analysis from the MEXPRESS database also confirmed the
negative relation between GSDMC expression and the
methylation values of two CpG sites (cg05316065 and cg26073844) in
LUAD cases (Pearson's r=−0.175, P<0.001 and Pearson's r=−0.141,
P<0.01, respectively) (Fig.
4C). Based on its obvious significance, the CpG site,
cg05316065, has been chosen to access the methylation status of
GSDMC DNA on the LUAD patient clinical prognosis. Chi-square
analysis showed that the patients with high methylation values of
the CpG site (cg05316065) had a significantly higher Karnofsky
performance score (KPS), an easy-to-use prognostic model for
prognosis (24,25). Moreover, the results suggested that
the cases with high methylation values of GSDMC had a longer
OS and disease-free survival (DFS), although there were no
significant differences (Table
III).
| Table III.The cg05316065 methylation status of
GSDMC in the TCGA-LUAD datasets. |
Table III.
The cg05316065 methylation status of
GSDMC in the TCGA-LUAD datasets.
|
| cg05316065
methylation value |
|
|---|
|
|
|
|
|---|
| Patient
characteristics | Total no. of
patients (%) | High
methylation | Low
methylation | P-value |
|---|
| Sex (N=447) |
|
|
| 0.008 |
|
Male | 208 (46.5) | 118 (52.9) | 90 (40.2) |
|
|
Female | 239 (53.5) | 105 (47.1) | 134 (59.8) |
|
| Lymph node stage
(N=445) |
|
|
| 0.317 |
| N0 | 290 (65.2) | 149 (67.1) | 141 (63.2) |
|
| N1 | 82 (18.4) | 35 (15.8) | 47 (21.1) |
|
| N2 | 64 (14.4) | 35 (15.8) | 29 (13.0) |
|
| NX | 9 (2.0) | 3 (1.4) | 6 (2.7) |
|
| Metastasis stage
(N=443) |
|
|
| 0.701 |
| M0 | 292 (65.9) | 143 (64.4) | 149 (67.4) |
|
| M1 | 19 (4.3) | 11 (5.0) | 8 (3.6) |
|
| MX | 132 (29.8) | 68 (30.6) | 64 (29.0) |
|
| Tumor stage
(N=447) |
|
|
| 0.101 |
| T1 | 150 (33.6) | 67 (30.0) | 83 (37.1) |
|
| T2 | 239 (53.5) | 119 (53.4) | 120 (53.6) |
|
| T3 | 39 (8.7) | 25 (11.2) | 14 (6.3) |
|
| T4 | 16 (3.6) | 11 (4.9) | 5 (2.2) |
|
| TX | 3 (0.7) | 1 (0.4) | 2 (0.9) |
|
| Stage (N=442) |
|
|
| 0.591 |
| I | 241 (54.5) | 118 (53.2) | 123 (55.9) |
|
| II | 109 (24.7) | 52 (23.4) | 57 (25.9) |
|
|
III | 72 (16.3) | 41 (18.5) | 31 (14.1) |
|
| IV | 20 (4.5) | 11 (5.0) | 9 (4.1) |
|
| Race (N=399) |
|
|
| 0.813 |
|
Asian | 6 (1.5) | 4 (2.0) | 2 (1.0) |
|
|
Black | 40 (10.0) | 20 (10.0) | 20 (10.1) |
|
|
Caucasian | 353 (88.5) | 176 (88.0) | 177 (88.9) |
|
| Age (N=428) in
years |
|
|
| 0.522 |
|
20–40 | 0 (0.0) | 0 (0.0) | 0 (0.0) |
|
|
40–60 | 119 (27.8) | 59 (27.2) | 60 (28.4) |
|
|
60–80 | 280 (65.4) | 146 (67.3) | 134 (63.5) |
|
|
≥80 | 29 (6.8) | 12 (5.5) | 17 (8.1) |
|
| KRAS
mutation (N=61) |
|
|
| 0.979 |
| No | 38 (62.3) | 15 (62.5) | 23 (62.2) |
|
|
Yes | 23 (37.7) | 9 (37.5) | 14 (37.7) |
|
| KPS (N=83) |
|
|
| 0.044 |
|
0–70 | 11 (13.3) | 4 (8.9) | 7 (18.4) |
|
| 80 | 19 (22.9) | 11 (24.4) | 8 (21.1) |
|
| 90 | 24 (28.9) | 9 (20.0) | 15 (39.4) |
|
|
100 | 29 (34.9) | 21 (46.7) | 8 (21.1) |
|
| Median DFS (95%
CI) | 33.44
(24.70–42.18) | 33.44
(24.73–42.14) | 30.39
(15.77–45.01) | 0.823 |
| Median OS (95%
CI) | 49.24
(41.29–57.19) | 50.3
(38.09–62.51) | 49.21
(42.42–56.00) | 0.921 |
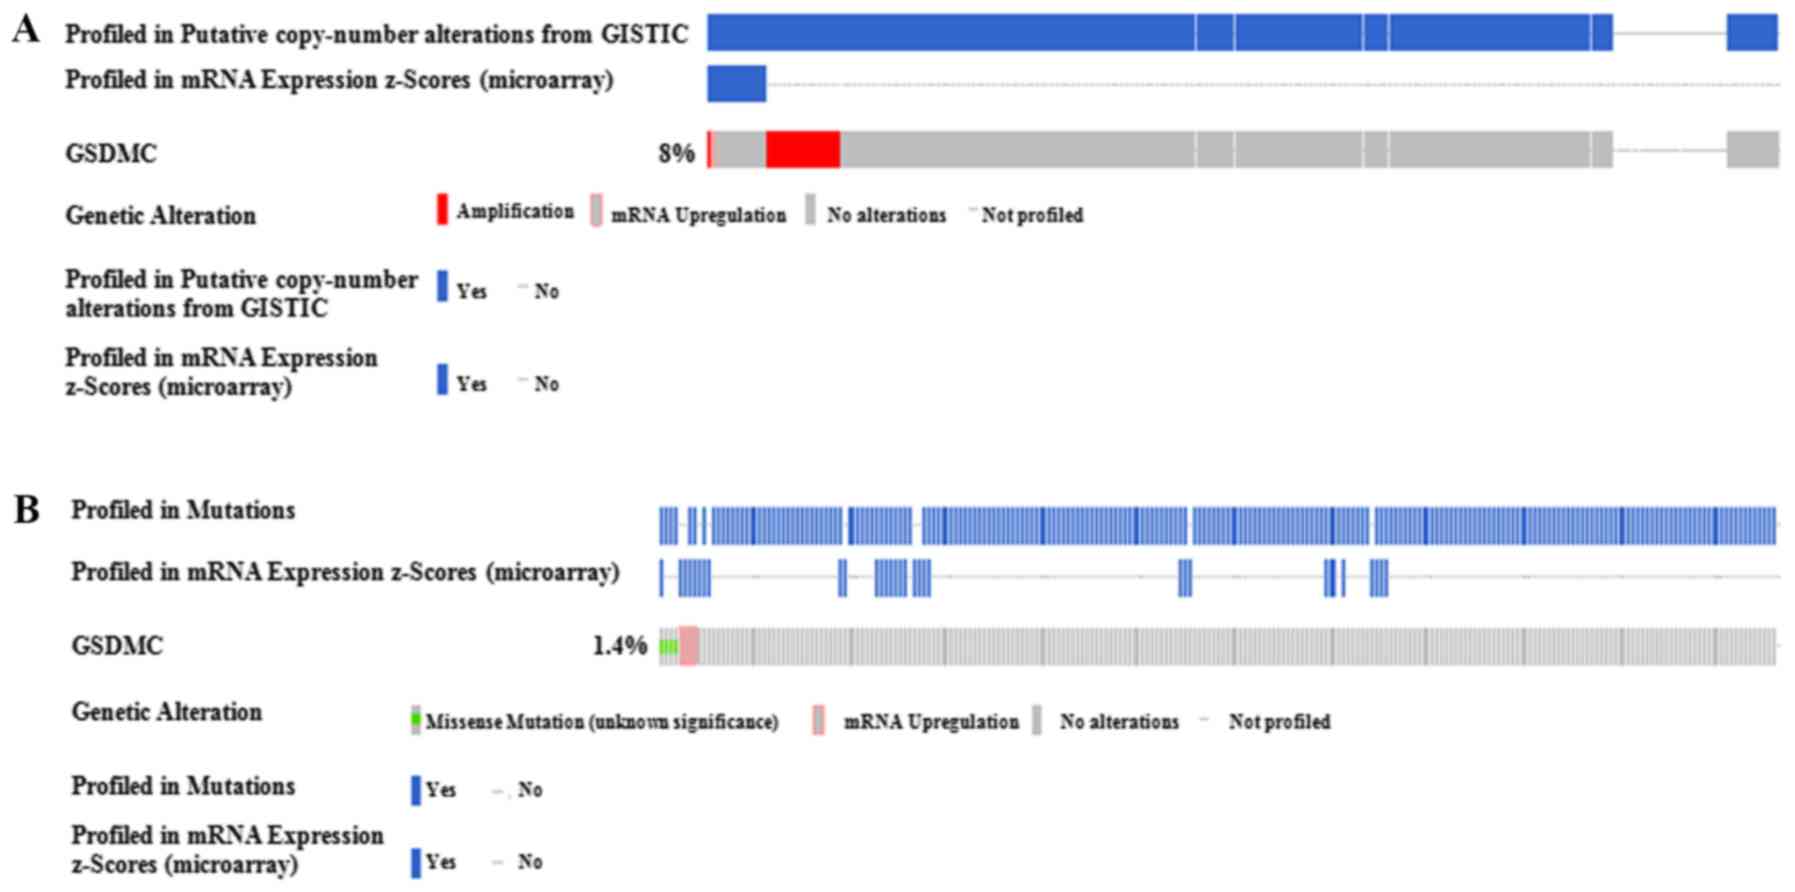
Next, the relationship between GSDMC
expression and its CNA/mutation status was also evaluated. We found
that 581 samples among the 584 sequenced LUAD patients had CNAs
measured, while only 45 samples (8%) had an obvious copy number
change (+2 high level amplification altered) (Fig. 5A). Additionally, the somatic
mutation in GSDMC DNA was only found in 8 cases (1.4%), with
unknown significance (Fig. 5B).
Thus, the CNA/mutation status did not influence GSDMC
expression distinctly.
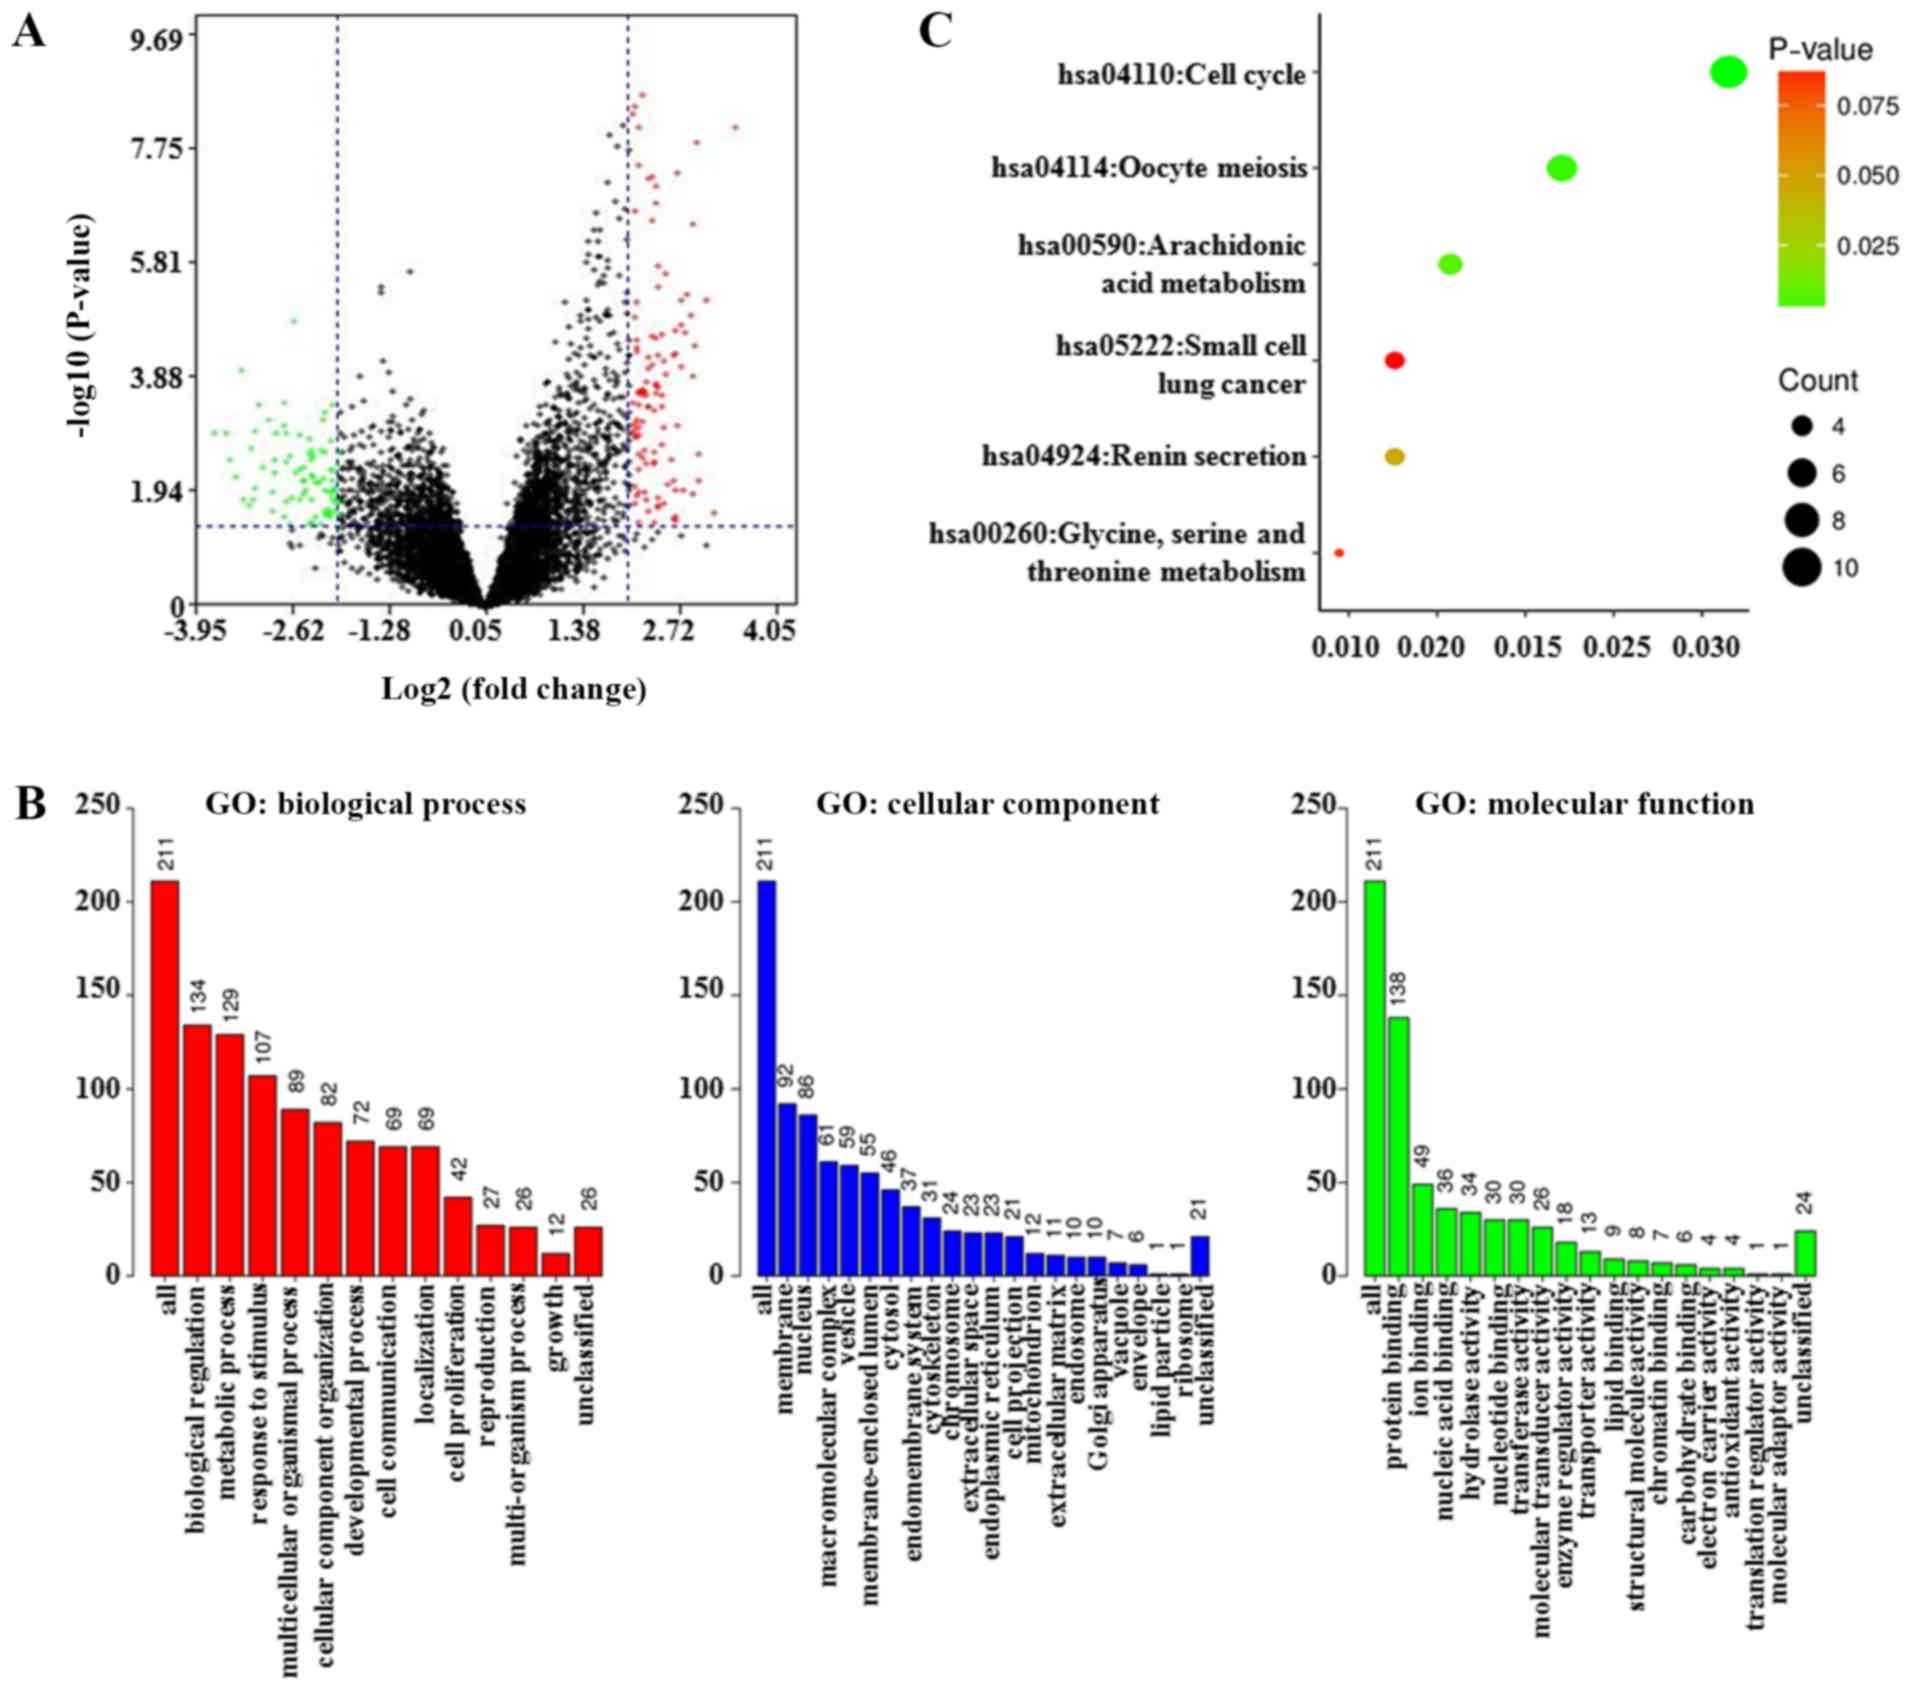
Functional enrichment analysis of
GSDMC-associated co-expression genes in LUAD patients
From a TCGA-LUAD dataset (TCGA, Provisional) of
cBioPortal, 13,446 genes that were co-expressed with GSDMC
were identified in the LUAD samples. Then, using the criteria of
|log2(fold change)| 32 and P-value <0.05,
215 genes were preliminarily validated as GSDMC-associated
co-differentially expressed genes (co-DEGs) (Table SIII). These co-DEGs between the
altered and unaltered GSDMC expression group are shown as a
volcano plot (Fig. 6A). Next, GO
and KEGG analyses were performed to clarify their biological
function. The biological processes enrichment analysis showed that
these co-DEGs were mainly correlated with biological regulation and
metabolic processes. The cellular component of these co-DEGs was
mainly enriched in the membrane and the nucleus. For molecular
function analysis, these co-DEGs were enriched primarily in terms
of protein binding (Fig. 6B). The
KEGG pathway, annotated by the DAVID bioinformatics resource,
indicated that these co-DEGs were mainly enriched in cell cycle
regulation (hsa04110) (Fig.
6C).
Discussion
Research indicates that dysregulated GSDMC is
associated with multiple cancer biological behaviors. Watabe et
al (26) suggested that
GSDMC overexpression promotes cell metastasis in B16
melanoma cells. In colorectal cancer cells, enforced GSDMC
expression was found to enhance cell proliferation and
tumorigenesis by suppressing TGFBR2 activity (8). However, in gastric cancer cells,
GSDMC was found to exert obvious cell-growth inhibition
activity, functioning as a potential tumor suppressor (27). These findings collectively
demonstrate that the detailed functional roles of GSDMC are
tissue-specific.
By using several public databases, our present study
presented the expression profiles of GSDM superfamily members in
LUAD, which revealed that GSDMC is obviously upregulated in
LUAD tissues and cell lines. We also found that the LUAD patients
with higher GSDMC expression presented with significant KRAS
mutation status. Studies have revealed that patient prognosis after
LUAD diagnosis is usually poor, and current treatment strategies
derived from primary LUAD seem to be largely inefficacious
(28). Next, we detected the
potential influence of GSDMC expression on the prognostic
markers of LUAD patients, in terms of first progression (FP),
overall survival (OS) and post-progression survival (PPS).
Kaplan-Meier curves showed significantly better FP and OS in the
lower GSDMC staining group, but no statistical difference in
PPS cases with different GSDMC expression. These unexpected
findings may be due to the small sample size and may need to be
further examined in future studies. The following analysis of the
association between GSDMC profiles and clinicopathological
parameters further support that preserved GSDMC expression
could act as an independent prognostic indicator for LUAD
patients.
Research has revealed that epigenetic alterations
(such as DNA hypomethylation) and genetic mutations have key
functions in modulating transcription of important oncogenes in
several types of human carcinomas, including LUAD (29–33).
For example, Upchurch et al (34) found that aberrant promoter
hypomethylation frequently affected the expression levels of
several oncogenes in hematologic malignancies. Preferentially
expressed phosphoribosylaminoimidazole carboxylase (PAICS) has been
confirmed as a major tumor promoter in LUAD, which is frequently
activated by promoter DNA hypomethylation (33). Cancer/testis antigen 45 (CT45) has
been confirmed to be associated with disease progression of
epithelial ovarian cancer, which is frequently activated by
promoter DNA hypomethylation (35). Unexpectedly, the CNAs in
CT45 DNA did not obviously influence its expression
(35). In addition, Wang et
al (29) demonstrated that
tumor-suppressive activity by adenosine deaminase RNA-specific
B1 (ADARB1) overexpression is a consequence of DNA
demethylation signaling. Inactivation of DNA methylation using DNA
methyltransferase inhibitors markedly enhanced the
ADARB1-mediation metastatic inhibition of LUAD cells. Here,
using the data from an Illumina 450K Infinium methylation chip, we
identified that GSDMC was hypomethylated in LUAD samples
compared with that in normal lung samples (P<0.05) (Fig. 4A). In addition, a significant
negative correlation was found between GSDMC expression and
its DNA methylation status in all LUAD cases (Pearson's r=−0.136).
Meanwhile, the results from the MEXPRESS database confirmed that
the expression of GSDMC was negatively correlated to the
methylation values of two CpG sites (cg05316065 and cg26073844) in
its promoter region (Pearson's r=−0.175 and −0.141, respectively).
Although this is the first study to identify these two
hypomethylated CpG sites in GSDMC and to demonstrate several
advances in indicating their functions in LUAD tumorigenesis, many
of the functional mechanisms remain poorly understood; particularly
in terms of their roles in cancer metastasis, risk index and
therapeutic response. Moreover, in this report, the LUAD patients
with longer OS also had higher GSDMC methylation values. In
comparison, GSDMC DNA CNAs and somatic mutation were not
frequent events, and might not obviously affect the transcriptional
level. Thus, these experiments confirmed the important functions of
DNA hypomethylation for the overexpression of GSDMC in LUAD
biological processes.
Alterations in cell cycle regulation have been
well-described to date in human carcinogenesis as they are known to
play pivotal roles in cell differentiation and growth. Identifying
the changes in cell cycle checkpoints is essential to the
regulation of cell cycle processes and the maintenance of genome
integrity. Abnormal activation of oncogenes or various cancer
therapeutic strategies could evoke cell cycle arrest in malignant
cells, thereby interfering with tumor formation or progression
(36). Moreover, studies have
shown that tight temporal control of cell cycle checkpoints has a
potential application in clinical practice. The pharmacological
inhibitors that target cell cycle checkpoints have the potential to
provoke the synthetic lethality of anticancer therapeutics and
disrupt the cancerous phenotype (37). Esophageal squamous cell carcinoma
cells treated with chemotherapeutic agents have impaired cell cycle
progression and DNA damage repair by promoting the accumulation of
GSDME around the cytoplasm (38).
In our study, the detailed molecular interactions between
GSDMC and its co-expressed genes were not well-illuminated;
however, the GO and KEGG analyses that were constructed identified
the function of GSDMC to some extent. Using the
gene-annotation enrichment analysis, the main functional pathway of
the GSDMC co-expressed genes was confirmed to be cell cycle
regulation. However, no relevant studies have demonstrated the
roles and mechanisms of GSDMC in cell cycle modulation.
Therefore, further research is required to clarify the detailed
functions of GSDMC in LUAD biology.
In conclusion, collectively, our present study
revealed that GSDMC is significantly overexpressed in LUAD
tissues and cell lines. We also found that upregulated GSDMC
expression could act as an independent predictor for the poor
prognosis of LUAD patients. Mechanistically, GSDMC
expression may be modulated by DNA hypomethylation in LUAD
cells.
Supplementary Material
Supporting Data
Acknowledgements
Not applicable.
Funding
The present study was supported by grants from the
Natural Science Foundation of Hunan Province, China (2019JJ50932),
the National Natural Science Foundation of China (81803035,
81703036, 81572946), China Postdoctoral Science Foundation
(2017M610510) and the Youth Fund of Xiangya Hospital (2017Q17).
Availability of data and materials
All data generated or analyzed during this study are
included in this published article.
Authors' contributions
Literature search was carried out by ZX, JW, ZG and
YY. Data collection was performed by XC, XW, SZ and LQ. The study
design was the responsibility of YY and ZX. Analysis of the data
was carried out by XY, CO and WL, and manuscript preparation was
completed by YY and ZX. Review of the manuscript was undertaken by
YY and ZX. All authors read and approved the manuscript and agree
to be accountable for all aspects of the research in ensuring that
the accuracy or integrity of any part of the work are appropriately
investigated and resolved.
Ethics approval and consent to
participate
Not applicable.
Patient consent for publication
Not applicable.
Competing interests
The authors declare that they have no competing
interests.
References
|
1
|
Miller KD, Siegel RL, Lin CC, Mariotto AB,
Kramer JL, Rowland JH, Stein KD, Alteri R and Jemal A: Cancer
treatment and survivorship statistics, 2016. CA Cancer J Clin.
66:271–289. 2016. View Article : Google Scholar : PubMed/NCBI
|
|
2
|
Yan Y, Su W, Zeng S, Qian L, Chen X, Wei
J, Chen N, Gong Z and Xu Z: Effect and mechanism of tanshinone I on
the radiosensitivity of lung cancer cells. Mol Pharm. 15:4843–4853.
2018. View Article : Google Scholar : PubMed/NCBI
|
|
3
|
Jordan EJ, Kim HR, Arcila ME, Barron D,
Chakravarty D, Gao J, Chang MT, Ni A, Kundra R, Jonsson P, et al:
Prospective comprehensive molecular characterization of lung
adenocarcinomas for efficient patient matching to approved and
emerging therapies. Cancer Discov. 7:596–609. 2017. View Article : Google Scholar : PubMed/NCBI
|
|
4
|
Kovacs SB and Miao EA: Gasdermins:
Effectors of pyroptosis. Trends Cell Biol. 27:673–684. 2017.
View Article : Google Scholar : PubMed/NCBI
|
|
5
|
Shi J, Gao W and Shao F: Pyroptosis:
Gasdermin-mediated programmed necrotic cell death. Trends Biochem
Sci. 42:245–254. 2017. View Article : Google Scholar : PubMed/NCBI
|
|
6
|
Yuan YY, Xie KX, Wang SL and Yuan LW:
Inflammatory caspase-related pyroptosis: Mechanism, regulation and
therapeutic potential for inflammatory bowel disease. Gastroenterol
Rep (Oxf). 6:167–176. 2018. View Article : Google Scholar : PubMed/NCBI
|
|
7
|
Lutkowska A, Roszak A, Lianeri M, Sowinska
A, Sotiri E and Jagodzinski PP: Analysis of rs8067378 polymorphism
in the risk of uterine cervical cancer from a polish population and
its impact on gasdermin B expression. Mol Diagn Ther. 21:199–207.
2017. View Article : Google Scholar : PubMed/NCBI
|
|
8
|
Miguchi M, Hinoi T, Shimomura M, Adachi T,
Saito Y, Niitsu H, Kochi M, Sada H, Sotomaru Y, Ikenoue T, et al:
Gasdermin C is upregulated by inactivation of transforming growth
factor β receptor type II in the presence of mutated apc, promoting
colorectal cancer proliferation. PloS One. 11:e01664222016.
View Article : Google Scholar : PubMed/NCBI
|
|
9
|
Tang Z, Li C, Kang B, Gao G, Li C and
Zhang Z: GEPIA: A web server for cancer and normal gene expression
profiling and interactive analyses. Nucleic Acids Res. 45:W98–W102.
2017. View Article : Google Scholar : PubMed/NCBI
|
|
10
|
Chandrashekar DS, Bashel B, Balasubramanya
SAH, Creighton CJ, Ponce-Rodriguez I, Chakravarthi BVSK and
Varambally S: UALCAN: A portal for facilitating tumor subgroup gene
expression and survival analyses. Neoplasia. 19:649–658. 2017.
View Article : Google Scholar : PubMed/NCBI
|
|
11
|
Rhodes DR, Kalyana-Sundaram S, Mahavisno
V, Varambally R, Yu J, Briggs BB, Barrette TR, Anstet MJ,
Kincead-Beal C, Kulkarni P, et al: Oncomine 3.0: Genes, pathways,
and networks in a collection of 18,000 cancer gene expression
profiles. Neoplasia. 9:166–180. 2007. View Article : Google Scholar : PubMed/NCBI
|
|
12
|
Barretina J, Caponigro G, Stransky N,
Venkatesan K, Margolin AA, Kim S, Wilson CJ, Lehár J, Kryukov GV,
Sonkin D, et al: The cancer cell line encyclopedia enables
predictive modelling of anticancer drug sensitivity. Nature.
483:603–607. 2012. View Article : Google Scholar : PubMed/NCBI
|
|
13
|
Uhlen M, Zhang C, Lee S, Sjöstedt E,
Fagerberg L, Bidkhori G, Benfeitas R, Arif M, Liu Z, Edfors F, et
al: A pathology atlas of the human cancer transcriptome. Science.
357:eaan25072017. View Article : Google Scholar : PubMed/NCBI
|
|
14
|
Gao J, Aksoy BA, Dogrusoz U, Dresdner G,
Gross B, Sumer SO, Sun Y, Jacobsen A, Sinha R, Larsson E, et al:
Integrative analysis of complex cancer genomics and clinical
profiles using the cBioPortal. Sci Signal. 6:pl12013. View Article : Google Scholar : PubMed/NCBI
|
|
15
|
Gyorffy B, Surowiak P, Budczies J and
Lanczky A: Online survival analysis software to assess the
prognostic value of biomarkers using transcriptomic data in
non-small-cell lung cancer. PloS One. 8:e822412013. View Article : Google Scholar : PubMed/NCBI
|
|
16
|
Huang WY, Hsu SD, Huang HY, Sun YM, Chou
CH, Weng SL and Huang HD: MethHC: A database of DNA methylation and
gene expression in human cancer. Nucleic Acids Res. 43:D856–D861.
2015. View Article : Google Scholar : PubMed/NCBI
|
|
17
|
Koch A, De Meyer T, Jeschke J and Van
Criekinge W: MEXPRESS: Visualizing expression, DNA methylation and
clinical TCGA data. BMC Genomics. 16:6362015. View Article : Google Scholar : PubMed/NCBI
|
|
18
|
Huang DW, Sherman BT, Tan Q, Kir J, Liu D,
Bryant D, Guo Y, Stephens R, Baseler MW, Lane HC and Lempicki RA:
DAVID Bioinformatics Resources: Expanded annotation database and
novel algorithms to better extract biology from large gene lists.
Nucleic Acids Res. 35:W169–W175. 2007. View Article : Google Scholar : PubMed/NCBI
|
|
19
|
Wang J, Duncan D, Shi Z and Zhang B:
WEB-based GEne SeT analysis toolkit (WebGestalt): Update 2013.
Nucleic Acids Res. 41:W77–W83. 2013. View Article : Google Scholar : PubMed/NCBI
|
|
20
|
Xu Z, Yan Y, Xiao L, Dai S, Zeng S, Qian
L, Wang L, Yang X, Xiao Y and Gong Z: Radiosensitizing effect of
diosmetin on radioresistant lung cancer cells via Akt signaling
pathway. PloS One. 12:e01759772017. View Article : Google Scholar : PubMed/NCBI
|
|
21
|
You S, Li R, Park D, Xie M, Sica GL, Cao
Y, Xiao ZQ and Deng X: Disruption of STAT3 by niclosamide reverses
radioresistance of human lung cancer. Mol Cancer Ther. 13:606–616.
2014. View Article : Google Scholar : PubMed/NCBI
|
|
22
|
Dai S, Yan Y, Xu Z, Zeng S, Qian L, Huo L,
Li X, Sun L and Gong Z: SCD1 confers temozolomide resistance to
human glioma cells via the Akt/GSK3β/β-catenin signaling axis.
Front Pharmacol. 8:9602017. View Article : Google Scholar : PubMed/NCBI
|
|
23
|
Livak KJ and Schmittgen TD: Analysis of
relative gene expression data using real-time quantitative PCR and
the 2(-Delta Delta C(T)) method. Methods. 25:402–408. 2001.
View Article : Google Scholar : PubMed/NCBI
|
|
24
|
Ouyang Z, Peng D and Dhakal DP: Risk
factors for hematological toxicity of chemotherapy for bone and
soft tissue sarcoma. Oncol Lett. 5:1736–1740. 2013. View Article : Google Scholar : PubMed/NCBI
|
|
25
|
Tandon P, Reddy KR, O'Leary JG,
Garcia-Tsao G, Abraldes JG, Wong F, Biggins SW, Maliakkal B, Fallon
MB, Subramanian RM, et al: A Karnofsky performance status-based
score predicts death after hospital discharge in patients with
cirrhosis. Hepatology. 65:217–224. 2017. View Article : Google Scholar : PubMed/NCBI
|
|
26
|
Watabe K, Ito A, Asada H, Endo Y,
Kobayashi T, Nakamoto K, Itami S, Takao S, Shinomura Y, Aikou T, et
al: Structure, expression and chromosome mapping of MLZE, a novel
gene which is preferentially expressed in metastatic melanoma
cells. Jap J Cancer Res. 92:140–151. 2001. View Article : Google Scholar
|
|
27
|
Saeki N, Usui T, Aoyagi K, Kim DH, Sato M,
Mabuchi T, Yanagihara K, Ogawa K, Sakamoto H, Yoshida T and Sasaki
H: Distinctive expression and function of four GSDM family genes
(GSDMA-D) in normal and malignant upper gastrointestinal
epithelium. Genes Chromosomes Cancer. 48:261–271. 2009. View Article : Google Scholar : PubMed/NCBI
|
|
28
|
Borczuk AC: Prognostic considerations of
the new world health organization classification of lung
adenocarcinoma. Eur Respir Rev. 25:364–371. 2016. View Article : Google Scholar : PubMed/NCBI
|
|
29
|
Wang X, Xu Z, Ren X, Chen X, Wei J, Lin W,
Li Z, Ou C, Gong Z and Yan Y: Function of low ADARB1 expression in
lung adenocarcinoma. PLoS One. 14:e02222982019. View Article : Google Scholar : PubMed/NCBI
|
|
30
|
Wang X, Xu Z, Chen X, Ren X, Wei J, Zhou
S, Yang X, Zeng S, Qian L, Wu G, et al: A tropomyosin receptor
kinase family protein, NTRK2 is a potential predictive biomarker
for lung adenocarcinoma. PeerJ. 7:e71252019. View Article : Google Scholar : PubMed/NCBI
|
|
31
|
Yang X, Xu ZJ, Chen X, Zeng SS, Qian L,
Wei J, Peng M, Wang X, Liu WL, Ma HY, et al: Clinical value of
preoperative methylated septin 9 in Chinese colorectal cancer
patients. World J Gastroenterol. 25:2099–2109. 2019. View Article : Google Scholar : PubMed/NCBI
|
|
32
|
Chen X, Xu Z, Zeng S, Wang X, Liu W, Qian
L, Wei J, Yang X, Shen Q, Gong Z and Yan Y: SIRT5 downregulation is
associated with poor prognosis in glioblastoma. Cancer Biomark.
24:449–459. 2019. View Article : Google Scholar : PubMed/NCBI
|
|
33
|
Zhou S, Yan Y, Chen X, Wang X, Zeng S,
Qian L, Wei J, Yang X, Zhou Y, Gong Z and Xu Z: Roles of highly
expressed PAICS in lung adenocarcinoma. Gene. 692:1–8. 2019.
View Article : Google Scholar : PubMed/NCBI
|
|
34
|
Upchurch GM, Haney SL and Opavsky R:
Aberrant promoter hypomethylation in CLL: Does it matter for
disease development? Front Oncol. 6:1822016. View Article : Google Scholar : PubMed/NCBI
|
|
35
|
Zhang W, Barger CJ, Link PA,
Mhawech-Fauceglia P, Miller A, Akers SN, Odunsi K and Karpf AR: DNA
hypomethylation-mediated activation of Cancer/Testis Antigen 45
(CT45) genes is associated with disease progression and reduced
survival in epithelial ovarian cancer. Epigenetics. 10:736–748.
2015. View Article : Google Scholar : PubMed/NCBI
|
|
36
|
Milanovic M, Yu Y and Schmitt CA: The
senescence-stemness alliance-a cancer-hijacked regeneration
principle. Trends Cell Biol. 28:1049–1061. 2018. View Article : Google Scholar : PubMed/NCBI
|
|
37
|
Vymětalová L and Kryštof V: Potential
clinical uses of CDK inhibitors: Lessons from synthetic lethality
screens. Med Res Rev. 35:1156–1174. 2015. View Article : Google Scholar : PubMed/NCBI
|
|
38
|
Wu M, Wang Y, Yang D, Gong Y, Rao F, Liu
R, Danna Y, Li J, Fan J, Chen J, et al: A PLK1 kinase inhibitor
enhances the chemosensitivity of cisplatin by inducing pyroptosis
in oesophageal squamous cell carcinoma. EBioMedicine. 41:244–255.
2019. View Article : Google Scholar : PubMed/NCBI
|