Open Access

Integrated analysis of DNA methylation and transcriptome profiling of polycystic ovary syndrome

  • Authors:
    • Li Liu
    • Dongyun He
    • Yang Wang
    • Minjia Sheng
  • View Affiliations

  • Published online on: February 26, 2020     https://doi.org/10.3892/mmr.2020.11005
  • Pages: 2138-2150
  • Copyright: © Liu et al. This is an open access article distributed under the terms of Creative Commons Attribution License.

Metrics: Total Views: 0 (Spandidos Publications: | PMC Statistics: )
Total PDF Downloads: 0 (Spandidos Publications: | PMC Statistics: )


Abstract

The present study aimed to identify potentially important biomarkers associated with polycystic ovary syndrome (PCOS) by integrating DNA methylation with transcriptome profiling. The transcription (E‑MTAB‑3768) and methylation (E‑MTAB‑3777) datasets were retrieved from ArrayExpress. Paired transcription and methylation profiling data of 10 cases of PCOS and 10 healthy controls were available for screening differentially expressed genes (DEGs) and differentially methylated genes (DMGs). Genes with a negative correlation between expression levels and methylation levels were retained by correlation analysis to construct a protein‑protein interaction (PPI) network. Subsequently, functional and pathway enrichment analyses were performed to identify genes in the PPI network. Additionally, a disease‑associated pathway network was also established. A total of 491 overlapping genes, and the expression levels of 237 genes, were negatively correlated with their methylation levels. Functional enrichment analysis revealed that genes in the PPI network were mainly involved with biological processes of cellular response to stress, negative regulation of the biosynthetic process, and regulation of cell proliferation. The constructed pathway network associated with PCOS led to the identification of four important genes (SPP1, F2R, IL12B and RBP4) and two important pathways (Jak‑STAT signaling pathway and neuroactive ligand‑receptor interaction). Taken, together, the results from the present study have revealed numerous important genes with abnormal DNA methylation levels and altered mRNA expression levels, along with their associated functions and pathways. These findings may contribute to an improved understanding of the possible pathophysiology of PCOS.

Introduction

Polycystic ovary syndrome (PCOS) is a common reproductive disorder, affecting 5–20% of the reproductive-age female population worldwide (1,2). In addition, PCOS is associated with ovulatory dysfunction, abdominal adiposity, insulin resistance, obesity, excessive androgen production and cardiovascular risk factors (3). However, the genetic mechanisms of PCOS remain largely unknown, since the etiology of the disease is very complex and affected both by genomic and environmental factors. Therefore, an improved understanding of the genetic mechanisms of PCOS may provide novel insights into the treatment and diagnosis of PCOS (4).

Recent data have suggested that inheritable epigenetic modifications, including the transcriptional effects of microRNAs and methylation patterns within the DNA, are probable contributors to the heritability of PCOS (5). DNA methylation is an important epigenetic phenomenon modulating gene expression during organismal development (6). It has been reported that decreased methylation levels of the anti-Müllerian hormone (AMH) gene may lead to an increased concentration of AMH in ovarian large-follicle tissues, and this was shown to correlate with the pathogenesis of PCOS (7). Global methylation of peripheral blood DNA was found not to be significantly altered in 20 PCOS patients by comparing with 20 controls, suggesting that specific tissues and target genomic regions are required to further determine whether epigenetic alterations may influence the development of PCOS (8). Genome-wide methylated DNA immunoprecipitation analysis of peripheral blood samples from 10 patients with PCOS and 5 healthy controls revealed that 40 genes were differentially methylated, comparing the PCOS patients with the control subjects (9). In addition, the extent of global DNA methylation of granulosa cells isolated from the follicular fluid samples of patients with PCOS was significantly higher compared with healthy controls, and differentially methylated genes were enriched in transcription factor activity, alternative splicing, sequence-specific DNA binding and embryonic morphogenesis (10). Therefore, epigenetic mechanisms involved in the regulation of gene expression caused by genomic DNA methylation patterns could be of great importance in the pathogenesis of PCOS. Wang et al (11) conducted a combined analysis of DNA methylation and transcriptome profiling, although only ovarian tissue samples from three PCOS patients and three cervical cancer patients were included in their study (11). Therefore, further well-designed studies of other specific tissues, and based on relatively larger sample sizes, are urgently required to study the genetic mechanisms of PCOS.

In the present study, paired transcription and methylation profiling data of subcutaneous adipose tissue samples collected from 10 cases of PCOS and 10 healthy controls were available to investigate differences in gene expression and DNA methylation patterns. After the differentially expressed genes (DEGs) and differentially methylated genes (DMGs) has been screened, genes showing a negative correlation between expression levels and methylation levels were retained for the construction of protein-protein interaction (PPI) networks. Functional enrichment analysis was subsequently performed for genes in the PPI network. Additionally, a disease-associated pathway network was also established.

Materials and methods

Data collection and preprocessing

The gene transcription dataset (E-MTAB-3768) and the methylation dataset (E-MTAB-3777) used in the present study were retrieved from ArrayExpress (http://www.ebi.ac.uk/arrayexpress/). ArrayExpress is a public database of microarray gene expression data at the European Bioinformatics Institute (EBI), and is a generic gene expression database designed to serve the scientific community as a repository for data that support publications (12). E-MTAB-3768 consists of transcription profiling data of subcutaneous adipose tissue samples collected from 23 cases of PCOS and 13 healthy controls, generated by the platform, Illumina HumanHT-12_V4 (https://www.ebi.ac.uk/arrayexpress/experiments/E-MTAB-3768/). E-MTAB-3777 contains methylation profiling data of subcutaneous adipose tissue samples collected from 13 cases of PCOS and 11 healthy controls, based on the Infinium HumanMethylation450 BeadChip platform (https://www.ebi.ac.uk/arrayexpress/experiments/E-MTAB-3777/). In the present study, paired DNA methylation and gene expression profiling patterns of samples from 10 PCOS cases and 10 healthy controls were retained for further analysis. The clinical characteristics of these individuals are listed in supplementary Table SI.

After the original .txt files for E-MTAB-3768 were downloaded, Linear Models for Microarray Analysis (Limma) package (version 3.32.5, http://bioconductor.org/packages/release/bioc/html/limma.html) in R software (13) was used for log2 conversion, and sequencing data were subsequently normalized using quantile method (14). The annotations for probes (such as ‘chromosome’, ‘gene’, and ‘gene region information’) in the methylation profiling data of E-MTAB-3777 were conducted based on the information supported by annotation platform HumanMethylation450 BeadChip Versuib 1.0 (https://support.illumina.com.cn/array/array_kits/infinium_humanmethylation450_beadchip_kit).

Differential expression and methylation analysis

Limma package (15) was used to perform differential expression and methylation analyses between PCOS samples and healthy control samples. Statistical P-values were obtained by Limma package and adjusted into the false discovery rate (FDR) using the Benjamini-Hochberg method (16). The thresholds for screening DEGs and DMGs were set as FDR<0.05 and |log2 fold-change (FC)|>0.263 (17).

In addition, the expression and methylation levels of screened DEGs and DMGs in each sample were hierarchically clustered using the pheatmap package (version 1.0.8; http://cran.r-project.org/package=pheatmap) (18) in R based on the encyclopedia of distances (19) to observe the differences in expression and methylation levels.

Integrated analysis of DEGs and DMGs

Overlapping genes between DEGs and DMGs were retained to perform subsequent correlation analysis. Gene Ontology (GO) functional analysis [categories: Biology process (BP), molecular function (MF) and cellular component (CC)] and Kyoto Encyclopedia of Genes and Genomes (KEGG) pathway enrichment analysis according to Database for Annotation, Visualization and Integrated Discovery (DAVID) were performed for genes that were identified having negative correlation between their expression levels and methylation levels (20,21). P<0.05 was set as the threshold value.

PPI network construction and analysis

Direct (physical) and indirect (functional) PPI interactions for the above genes with negative correlation between expression levels and methylation levels were aggregated using STRING (http://string-db.org/), which is a database of known and predicted PPIs (22). The cut-off criterion was set as an interaction score ≥0.4. The PPI network was constructed by integrating the PPIs together using the platform, Cytoscape (http://www.cytoscape.org/) (23). Subsequently, genes in the constructed PPI network were used for GO annotation and KEGG pathway enrichment analysis.

Disease-associated pathway network

Genes and KEGG pathways directly associated with PCOS were searched from the Comparative Toxicogenomics Database (CTD, http://ctd.mdibl.org/) (24) using the key words ‘polycystic ovary syndrome’. The overlapped genes and pathways were retained to construct the disease-associated pathway network.

Results

Differential expression and methylation analysis

After data preprocessing, 1,275 DEGs (527 downregulated and 748 upregulated) and 556 DMGs (384 downregulated and 172 upregulated) were respectively identified from transcription and methylation profiling data. The color contrast in hierarchically clustering heat-maps for DEGs or DMGs indicated clear differences in the transcription or methylation levels between PCOS and healthy control samples (Fig. 1).

Integrated analysis of DEGs and DMGs

Among these obtained DEGs and DMGs, 491 overlapping genes between DEGs and DMGs were identified. Correlation analysis revealed that the expression levels of 237 genes were negatively correlated with their methylation levels (Fig. 2). These 491 genes were clearly involved with 17, 7, and 4 GO terms in the BP, CC, and MF categories, respectively. These functions were mainly about regulation of cell proliferation and regulation of apoptosis involving B4GALT1, ERBB2, PML, ZBTB16, TNFRSF9, CDKN1A, IL12B, and F2R (Table I and Fig. 3). Furthermore, 11 KEGG pathways were enriched, including the mitogen-activated protein kinase (MAPK) (P=4.903×10⁻³), p53 (P=2.107×10⁻²) and Wnt (P=2.958×10⁻²) signaling pathways. In addition, the genes LAMA1, ERBB2, MYLK and SPP1 were found to be involved in the focal adhesion pathway (P=4.673×10⁻²; Table II and Fig. 3).

Table I.

GO functional annotations in terms of biology process, molecular function, and cellular component for the 491 overlapping genes between differentially expressed genes and differentially methylated genes.

Table I.

GO functional annotations in terms of biology process, molecular function, and cellular component for the 491 overlapping genes between differentially expressed genes and differentially methylated genes.

CategoryTermCountP-valueGenes
Biology process 
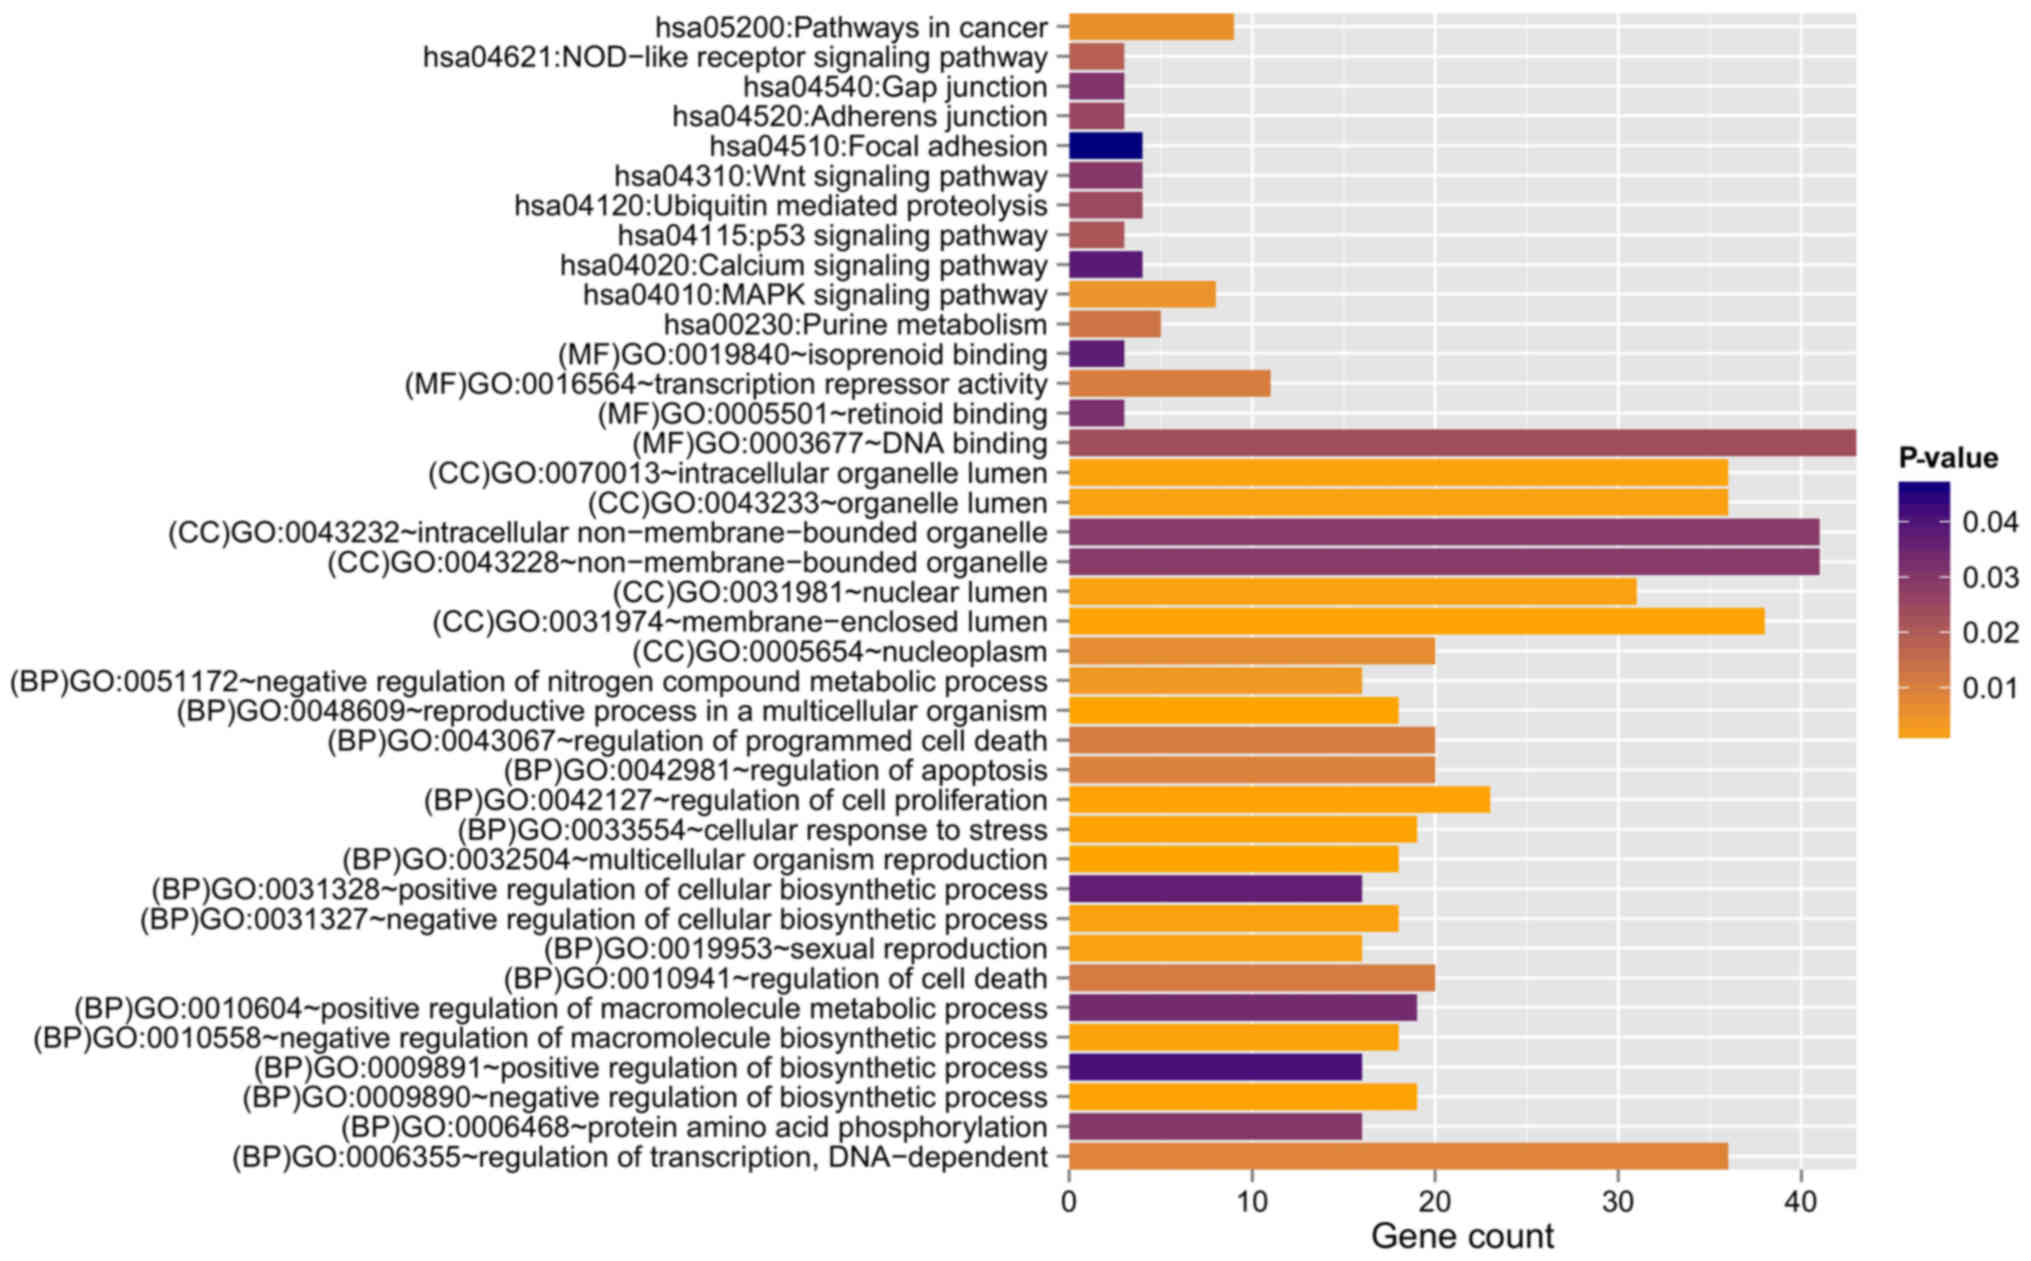
GO:0048609~reproductive process in a multicellular organism182.390×10-4B4GALT1, RBP4, HMGB2, AGFG1, ERBB2, ADCYAP1R1, FIGLA, ZBTB16, ELL3, BOLL, LEP, INHBA, FANCD2, ZMIZ1, WIPF3, ADAMTS1, SPIN4, PNMA1
GO:0032504~multicellular organism reproduction182.390×10-4B4GALT1, RBP4, HMGB2, AGFG1, ERBB2, ADCYAP1R1, FIGLA, ZBTB16, ELL3, BOLL, LEP, INHBA, FANCD2, ZMIZ1, WIPF3, ADAMTS1, SPIN4, PNMA1
GO:0033554~cellular response to stress194.810×10-4HMGB2, UBE2A, DERL1, GEN1, PML, MBD4, RAD9A, SIRT7, TP73, TRIB1, SCAP, PRPF19, CDKN1A, MRPS9, FANCD2, NSMCE1, TDP1, SUPT16H, GADD45A
GO:0009890~negative regulation of biosynthetic process195.560×10-4HMGB2, CTBP1, CDX4, SIX3, HDAC10, ZNF24, PML, ZHX3, RAD9A, SNW1, SIRT7, DMAP1, ZBTB16, SCAP, INHBA, HHEX, HDAC3, OVOL2, IGFBP5
GO:0042127~regulation of cell proliferation236.630×10-4B4GALT1, RBP4, UBE2A, CTBP1, PTPRM, ERBB2, PML, ZBTB16, SSR1, TRIB1, LAMA1, HHEX, S1PR3, TNFRSF9, CDKN1A, OSR2, OVOL2, ZMIZ1, PLA2G1B, ADAMTS1, IL12B, F2R, IGFBP5
GO:0010558~negative regulation of macromolecule biosynthetic process188.940×10-4HMGB2, CTBP1, CDX4, SIX3, HDAC10, ZNF24, PML, ZHX3, RAD9A, SNW1, SIRT7, DMAP1, ZBTB16, INHBA, HHEX, HDAC3, OVOL2, IGFBP5
GO:0019953~sexual reproduction161.069×10-3B4GALT1, RBP4, HMGB2, AGFG1, ADCYAP1R1, FIGLA, ZBTB16, ELL3, BOLL, LEP, FANCD2, ZMIZ1, WIPF3, ADAMTS1, SPIN4, PNMA1
GO:0031327~negative regulation of cellular biosynthetic process181.178×10-3HMGB2, CTBP1, CDX4, SIX3, HDAC10, ZNF24, PML, ZHX3, RAD9A, SNW1, SIRT7, DMAP1, ZBTB16, INHBA, HHEX, HDAC3, OVOL2, IGFBP5
GO:0051172~negative regulation of nitrogen compound metabolic process163.578×10-3HMGB2, CTBP1, CDX4, SIX3, ZNF24, PML, HDAC10, ZHX3, RAD9A, SNW1, SIRT7, DMAP1, ZBTB16, HHEX, HDAC3, OVOL2
GO:0006355~regulation of transcription, DNA-dependent368.581×10-3HMGB2, CDX4, IRX2, ZNF557, ZBTB16, DMAP1, ZKSCAN2, OVOL2, PLA2G1B, POU4F1, POU3F1, RFX8, CTBP1, RFX4, SIX3, ZNF24, HDAC10, ZHX3, DMRT2, SNW1, SIRT7, ELL3, ZNF320, TP73, SCAP, RPS6KA5, ASCL2, INHBA, HHEX, HDAC3, RNF4, ZMIZ1, ZNF460, MGA, UNCX, F2R
GO:0042981~regulation of apoptosis209.553×10-3B4GALT1, ERBB2, PML, MBD4, RAD9A, ZBTB16, TP73, MAP3K7, INHBA, TNFRSF9, HDAC3, PLEKHG2, CDKN1A, HSP90B1, BNIP1, GSPT1, POU4F1, IL12B, TNFAIP3, F2R
GO:0043067~regulation of programmed cell death201.054×10-2B4GALT1, ERBB2, PML, MBD4, RAD9A, ZBTB16, TP73, MAP3K7, INHBA, TNFRSF9, HDAC3, PLEKHG2, CDKN1A, HSP90B1, BNIP1, GSPT1, POU4F1, IL12B, TNFAIP3, F2R
GO:0010941~regulation of cell death201.094×10-2B4GALT1, ERBB2, PML, MBD4, RAD9A, ZBTB16, TP73, MAP3K7, INHBA, TNFRSF9, HDAC3, PLEKHG2, CDKN1A, HSP90B1, BNIP1, GSPT1, POU4F1, IL12B, TNFAIP3, F2R
GO:0006468~protein amino acid phosphorylation163.007×10-2CTBP1, ERBB2, MKNK2, PML, ALK, TBCK, TRIB1, RPS6KA5, MAP3K7, RPS6KA6, ADCK1, PLA2G1B, CAMK1, PRKACB, MYLK, F2R
GO:0010604~positive regulation of macromolecule metabolic process193.329×10-2HMGB2, RFX4, SIX3, PML, SIRT7, ELL3, BOLL, TP73, SCAP, HHEX, INHBA, OVOL2, RNF4, ZMIZ1, PLA2G1B, MLST8, POU3F1, IL12B, F2R
GO:0031328~positive regulation of cellular biosynthetic process163.673×10-2HMGB2, RFX4, SIX3, SIRT7, ELL3, TP73, BOLL, SCAP, HHEX, INHBA, OVOL2, RNF4, ZMIZ1, PLA2G1B, IL12B, F2R
GO:0009891~positive regulation of biosynthetic process164.086×10-2HMGB2, RFX4, SIX3, SIRT7, ELL3, TP73, BOLL, SCAP, HHEX, INHBA, OVOL2, RNF4, ZMIZ1, PLA2G1B, IL12B, F2R
Cellular Component GO:0031974~membrane-enclosed lumen385.070×10-4PDP1, HMGB2, PNMA2, POLR2J, PNPT1, FIGLA, PML, ZBTB16, DMAP1, POLR2D, PRPF19, ALAS1, NUMA1, COX6B1, NPM3, POU3F1, ETFB, PDCD11, CTBP1, ZMYM3, HDAC10, RAD9A, MBD4, SNW1, SIRT7, ELL3, RPS6KA5, NVL, CDKN1A, HSP90B1, HDAC3, MRPS9, FANCD2, ZMIZ1, SUPT16H, MATR3, EP400, PNMA1
GO:0070013~intracellular organelle lumen369.530×10-4PDP1, HMGB2, PNMA2, POLR2J, FIGLA, PML, ZBTB16, DMAP1, POLR2D, PRPF19, ALAS1, NUMA1, NPM3, POU3F1, ETFB, PDCD11, CTBP1, ZMYM3, HDAC10, RAD9A, MBD4, SNW1, SIRT7, ELL3, RPS6KA5, NVL, CDKN1A, HSP90B1, HDAC3, MRPS9, FANCD2, ZMIZ1, SUPT16H, MATR3, EP400, PNMA1
GO:0031981~nuclear lumen311.079×10-3HMGB2, PNMA2, POLR2J, FIGLA, PML, ZBTB16, DMAP1, POLR2D, PRPF19, NUMA1, NPM3, POU3F1, PDCD11, CTBP1, ZMYM3, HDAC10, RAD9A, MBD4, SNW1, SIRT7, ELL3, NVL, RPS6KA5, CDKN1A, HDAC3, FANCD2, ZMIZ1, SUPT16H, MATR3, EP400, PNMA1
GO:0043233~organelle lumen361.430×10-3PDP1, HMGB2, PNMA2, POLR2J, FIGLA, PML, ZBTB16, DMAP1, POLR2D, PRPF19, ALAS1, NUMA1, NPM3, POU3F1, ETFB, PDCD11, CTBP1, ZMYM3, HDAC10, RAD9A, MBD4, SNW1, SIRT7, ELL3, RPS6KA5, NVL, CDKN1A, HSP90B1, HDAC3, MRPS9, FANCD2, ZMIZ1, SUPT16H, MATR3, EP400, PNMA1
GO:0005654~nucleoplasm206.379×10-3HMGB2, CTBP1, POLR2J, HDAC10, PML, FIGLA, DMAP1, ZBTB16, ELL3, POLR2D, RPS6KA5, PRPF19, HDAC3, NUMA1, CDKN1A, FANCD2, ZMIZ1, SUPT16H, POU3F1, EP400
GO:0043232~intracellular non-membrane-bounded organelle412.914×10-2HMGB2, PNMA2, USP2, PML, ZBTB16, DMAP1, KIF2C, NUMA1, NPM3, SKA3, NDRG2, TRIP10, CNKSR2, IPP, PDCD11, UBE2A, ZMYM3, RNF19A, PDE4D, SNW1, RAD9A, MBD4, MID1IP1, SIRT7, PALLD, TNKS1BP1, NVL, HDAC3, TUBA8, MRPS9, FANCD2, RPS4Y2, TPPP, SUPT16H, OPHN1, TUBA4A, ARL8B, TNFAIP3, EP400, LCP1, PNMA1
GO:0043228~non-membrane-bounded organelle412.914×10-2HMGB2, PNMA2, USP2, PML, ZBTB16, DMAP1, KIF2C, NUMA1, NPM3, SKA3, NDRG2, TRIP10, CNKSR2, IPP, PDCD11, UBE2A, ZMYM3, RNF19A, PDE4D, SNW1, RAD9A, MBD4, MID1IP1, SIRT7, PALLD, TNKS1BP1, NVL, HDAC3, TUBA8, MRPS9, FANCD2, RPS4Y2, TPPP, SUPT16H, OPHN1, TUBA4A, ARL8B, TNFAIP3, EP400, LCP1, PNMA1
Molecular functionGO:0003677~DNA binding432.360×10-2HMGB2, AGFG1, CDX4, IRX2, POLR2J, ZNF557, FIGLA, PML, DMAP1, ZBTB16, ZKSCAN2, APLP2, PRPF19, KIF2C, OVOL2, SERPINA3, POU4F1, POU3F1, BAHD1, RFX8, CTBP1, RFX4, GEN1, SNAPC1, ZMYM3, SIX3, ZNF24, DMRT2, ZHX3, MBD4, ZNF320, TP73, ASCL2, HHEX, HDAC3, RNF4, TDP1, ZNF460, MGA, TNFAIP3, ZBTB1, EP400, UNCX
GO:0016564~transcription repressor activity111.021×10-2HHEX, CTBP1, HMGB2, HDAC3, SIX3, PML, ZNF24, HDAC10, SNW1, ZBTB16, DMAP1
GO:0005501~retinoid binding33.174×10-2RBP4, RBP7, CYP26A1
GO:0019840~isoprenoid binding33.758×10-2RBP4, RBP7, CYP26A1

[i] GO, Gene Ontology.

Table II.

Kyoto Encyclopedia of Genes and Genomes pathway enrichment analysis for the 491 overlapping genes between differentially expressed genes and differentially methylated genes.

Table II.

Kyoto Encyclopedia of Genes and Genomes pathway enrichment analysis for the 491 overlapping genes between differentially expressed genes and differentially methylated genes.

TermCountP-valueGenes
hsa04010: MAPK signaling pathway8 4.903×10⁻³MAP3K7, RPS6KA5, RPS6KA6, MKNK2, PLA2G1B, FGF13, PRKACB, GADD45A
hsa05200: Pathways in cancer9 5.179×10⁻³LAMA1, CDKN1A, CTBP1, HSP90B1, ERBB2, PML, FGF13, FZD3, ZBTB16
hsa00230: Purine metabolism5 1.256×10⁻²POLR2J, PNPT1, PDE5A, PDE4D, POLR2D
hsa04621: NOD-like receptor signaling pathway3 1.831×10⁻²MAP3K7, HSP90B1, TNFAIP3
hsa04115: p53 signaling pathway3 2.107×10⁻²CDKN1A, GADD45A, TP73
hsa04120: Ubiquitin mediated proteolysis4 2.477×10⁻²PRPF19, UBE2D4, UBE2A, PML
hsa04520: Adherens junction3 2.527×10⁻²MAP3K7, PTPRM, ERBB2
hsa04310: Wnt signaling pathway4 2.958×10⁻²MAP3K7, CTBP1, FZD3, PRKACB
hsa04540: Gap junction3 3.090×10⁻²TUBA8, TUBA4A, PRKACB
hsa04020: Calcium signaling pathway4 3.827×10⁻²ERBB2, PRKACB, MYLK, F2R
hsa04510: Focal adhesion4 4.673×1°2LAMA1, ERBB2, MYLK, SPP1
PPI network construction and analysis

Based on the information in STRING, the PPI network was constructed with 237 PPIs associated with these 491 overlapping genes, involving 127 genes (Fig. 4). The top five hub genes with the highest node degree were SIRT7 (node degree=13), CDKN1A (node degree=11), HDAC3 (node degree=11), ZBTB16 (node degree=11) and POLR2J (node degree=10). Genes in this PPI network were significantly involved with 8, 9 and 9 GO terms in the BP, CC and MF categories, respectively (Fig. 5). These functions were mainly concerned with cellular response to stress (P=4.190×10⁻⁵), negative regulation of biosynthetic processes (P=1.820×10⁻⁴), regulation of cell proliferation (P=1.434×10⁻³), membrane-enclosed lumen (P=1.500×10⁻⁷), intracellular organelle lumen (P=1.950×10⁻⁷), organelle lumen (P=3.300×10⁻⁷), nucleotide binding (P=2.349×10⁻³), purine nucleoside binding (P=7.436×10⁻³), and nucleoside binding (P=8.046×10⁻³). The regulation of cell proliferation, regulation of apoptosis, regulation of programmed cell death and regulation of cell death were involved with the genes RBP4, B4GALT1, ERBB2, PML, ZBTB16, CDKN1A, IL12B and F2R (Table III).

Table III.

The GO functional annotations in terms of biology process, molecular function, and cellular component for the genes in the protein-protein interaction network.

Table III.

The GO functional annotations in terms of biology process, molecular function, and cellular component for the genes in the protein-protein interaction network.

CategoryTermCountP-valueGenes
Biology processGO:0033554~cellular response to stress16 4.190×10⁻⁵HMGB2, UBE2A, DERL1, GEN1, PML, RAD9A, SIRT7, TP73, TRIB1, SCAP, PRPF19, CDKN1A, MRPS9, FANCD2, SUPT16H, GADD45A
GO:0009890~negative regulation of biosynthetic process15 1.820×10⁻⁴CTBP1, HMGB2, CDX4, HDAC10, PML, ZNF24, RAD9A, SNW1, SIRT7, DMAP1, ZBTB16, SCAP, HHEX, HDAC3, IGFBP5
GO:0042127~regulation of cell proliferation16 1.434×10⁻³B4GALT1, RBP4, CTBP1, UBE2A, ERBB2, PML, ZBTB16, SSR1, TRIB1, S1PR3, HHEX, CDKN1A, ZMIZ1, IL12B, F2R, IGFBP5
GO:0042981~regulation of apoptosis16 1.770×10⁻³B4GALT1, ERBB2, PML, RAD9A, ZBTB16, TP73, MAP3K7, HDAC3, CDKN1A, HSP90B1, GSPT1, BNIP1, POU4F1, IL12B, TNFAIP3, F2R
GO:0043067~regulation of programmed cell death16 1.950×10⁻³B4GALT1, ERBB2, PML, RAD9A, ZBTB16, TP73, MAP3K7, HDAC3, CDKN1A, HSP90B1, GSPT1, BNIP1, POU4F1, IL12B, TNFAIP3, F2R
GO:0010941~regulation of cell death16 2.021×10⁻³B4GALT1, ERBB2, PML, RAD9A, ZBTB16, TP73, MAP3K7, HDAC3, CDKN1A, HSP90B1, GSPT1, BNIP1, POU4F1, IL12B, TNFAIP3, F2R
GO:0007049~cell cycle15 3.435×10⁻³PML, SIRT7, BOLL, TP73, KIF2C, HHEX, HDAC3, CDKN1A, NUMA1, GSPT1, NCAPG2, FANCD2, SKA3, IL12B, GADD45A
GO:0007242~intracellular signaling cascade19 1.030×10⁻²HMGB2, TLR10, ERBB2, MKNK2, PML, FGF13, RAD9A, TP73, TRIB1, LEP, MAP3K7, RPS6KA5, S1PR3, RPS6KA6, RNF4, ARL8B, PRKACB, F2R, IGFBP5
Cellular component GO:0031974~membrane-enclosed lumen34 1.500×10⁻⁷PDP1, HMGB2, PNMA2, POLR2J, PNPT1, PML, ZBTB16, DMAP1, POLR2D, PRPF19, ALAS1, NUMA1, POU3F1, ETFB, PDCD11, CTBP1, ZMYM3, HDAC10, RAD9A, SNW1, SIRT7, ELL3, RPS6KA5, NVL, HSP90B1, CDKN1A, HDAC3, MRPS9, FANCD2, ZMIZ1, SUPT16H, MATR3, EP400, PNMA1
GO:0070013~intracellular organelle lumen33 1.950×10⁻⁷PDP1, HMGB2, PNMA2, POLR2J, PML, ZBTB16, DMAP1, POLR2D, PRPF19, ALAS1, NUMA1, POU3F1, ETFB, PDCD11, CTBP1, ZMYM3, HDAC10, RAD9A, SNW1, SIRT7, ELL3, RPS6KA5, NVL, HSP90B1, CDKN1A, HDAC3, MRPS9, FANCD2, ZMIZ1, SUPT16H, MATR3, EP400, PNMA1
GO:0043233~organelle lumen33 3.300×10⁻⁷PDP1, HMGB2, PNMA2, POLR2J, PML, ZBTB16, DMAP1, POLR2D, PRPF19, ALAS1, NUMA1, POU3F1, ETFB, PDCD11, CTBP1, ZMYM3, HDAC10, RAD9A, SNW1, SIRT7, ELL3, RPS6KA5, NVL, HSP90B1, CDKN1A, HDAC3, MRPS9, FANCD2, ZMIZ1, SUPT16H, MATR3, EP400, PNMA1
GO:0031981~nuclear lumen28 1.320×10⁻⁶HMGB2, PNMA2, POLR2J, PML, ZBTB16, DMAP1, POLR2D, PRPF19, NUMA1, POU3F1, CTBP1, PDCD11, ZMYM3, HDAC10, RAD9A, SNW1, SIRT7, ELL3, NVL, RPS6KA5, CDKN1A, HDAC3, FANCD2, ZMIZ1, SUPT16H, MATR3, EP400, PNMA1
GO:0005654~nucleoplasm19 3.520×10⁻⁵HMGB2, CTBP1, POLR2J, HDAC10, PML, DMAP1, ZBTB16, ELL3, POLR2D, RPS6KA5, PRPF19, HDAC3, NUMA1, CDKN1A, FANCD2, ZMIZ1, SUPT16H, POU3F1, EP400
GO:0043232~intracellular non-membrane-bounded organelle36 3.790×10⁻⁵HMGB2, PNMA2, USP2, PML, ZBTB16, DMAP1, KIF2C, NUMA1, SKA3, TRIP10, CNKSR2, PDCD11, UBE2A, ZMYM3, RNF19A, PDE4D, RAD9A, SNW1, SIRT7, PALLD, TNKS1BP1, NVL, HDAC3, TUBA8, MRPS9, FANCD2, RPS4Y2, TPPP, SUPT16H, TUBA4A, OPHN1, ARL8B, TNFAIP3, EP400, LCP1, PNMA1
GO:0043228~non-membrane-bounded organelle36 3.790×10⁻⁵HMGB2, PNMA2, USP2, PML, ZBTB16, DMAP1, KIF2C, NUMA1, SKA3, TRIP10, CNKSR2, PDCD11, UBE2A, ZMYM3, RNF19A, PDE4D, RAD9A, SNW1, SIRT7, PALLD, TNKS1BP1, NVL, HDAC3, TUBA8, MRPS9, FANCD2, RPS4Y2, TPPP, SUPT16H, TUBA4A, OPHN1, ARL8B, TNFAIP3, EP400, LCP1, PNMA1
GO:0044430~cytoskeletal part15 6.493×10⁻³CNKSR2, USP2, RNF19A, PDE4D, PALLD, KIF2C, NUMA1, HDAC3, TUBA8, TPPP, TUBA4A, SKA3, ARL8B, TNFAIP3, LCP1
GO:0005856~cytoskeleton17 3.066×10⁻²CNKSR2, USP2, RNF19A, PDE4D, PALLD, KIF2C, TUBA8, NUMA1, HDAC3, TPPP, TUBA4A, OPHN1, SKA3, ARL8B, TNFAIP3, TRIP10, LCP1
Molecular function GO:0000166~nucleotide binding31 2.349×10⁻³ERBB2, MKNK2, HELZ, POLR2D, TRIB1, MAP3K7, UBE2D4, KIF2C, ADCK1, ACAD8, PRKACB, UBE2A, CTBP1, SIRT7, ALK, ABCB6, BOLL, ATAD1, RPS6KA5, NVL, RPS6KA6, TUBA8, HSP90B1, GSPT1, PDE5A, TUBA4A, ARL8B, MATR3, MYLK, EP400, ATAD2B
GO:0001883~purine nucleoside binding23 7.436×10⁻³UBE2A, ERBB2, MKNK2, HELZ, ALK, ABCB6, ATAD1, TRIB1, RPS6KA5, NVL, MAP3K7, UBE2D4, RPS6KA6, KIF2C, HSP90B1, ADCK1, PDE5A, ACAD8, ARL8B, PRKACB, MYLK, EP400, ATAD2B
GO:0001882~nucleoside binding23 8.046×10⁻³UBE2A, ERBB2, MKNK2, HELZ, ALK, ABCB6, ATAD1, TRIB1, RPS6KA5, NVL, MAP3K7, UBE2D4, RPS6KA6, KIF2C, HSP90B1, ADCK1, PDE5A, ACAD8, ARL8B, PRKACB, MYLK, EP400, ATAD2B
GO:0017076~purine nucleotide binding26 8.216×10⁻³ERBB2, MKNK2, HELZ, TRIB1, MAP3K7, KIF2C, UBE2D4, ADCK1, ACAD8, PRKACB, UBE2A, ALK, ABCB6, ATAD1, NVL, RPS6KA5, RPS6KA6, HSP90B1, TUBA8, GSPT1, PDE5A, TUBA4A, ARL8B, EP400, MYLK, ATAD2B
GO:0032555~purine ribonucleotide binding25 9.376×10⁻³UBE2A, ERBB2, MKNK2, HELZ, ALK, ABCB6, ATAD1, TRIB1, RPS6KA5, NVL, MAP3K7, UBE2D4, RPS6KA6, KIF2C, TUBA8, HSP90B1, ADCK1, GSPT1, PDE5A, TUBA4A, ARL8B, PRKACB, MYLK, EP400, ATAD2B
GO:0032553~ribonucleotide binding25 9.376×10⁻³UBE2A, ERBB2, MKNK2, HELZ, ALK, ABCB6, ATAD1, TRIB1, RPS6KA5, NVL, MAP3K7, UBE2D4, RPS6KA6, KIF2C, TUBA8, HSP90B1, ADCK1, GSPT1, PDE5A, TUBA4A, ARL8B, PRKACB, MYLK, EP400, ATAD2B
GO:0030554~adenyl nucleotide binding21 2.425×10⁻²UBE2A, ERBB2, MKNK2, HELZ, ALK, ABCB6, ATAD1, TRIB1, RPS6KA5, NVL, MAP3K7, UBE2D4, RPS6KA6, KIF2C, ADCK1, HSP90B1, ACAD8, PRKACB, MYLK, EP400, ATAD2B
GO:0005524~ATP binding20 2.459×10⁻²UBE2A, ERBB2, MKNK2, HELZ, ALK, ABCB6, ATAD1, TRIB1, RPS6KA5, NVL, MAP3K7, UBE2D4, RPS6KA6, KIF2C, ADCK1, HSP90B1, PRKACB, MYLK, EP400, ATAD2B
GO:0032559~adenyl ribonucleotide binding binding20 2.782×10⁻²UBE2A, ERBB2, MKNK2, HELZ, ALK, ABCB6, ATAD1, TRIB1, RPS6KA5, NVL, MAP3K7, UBE2D4, RPS6KA6, KIF2C, ADCK1, HSP90B1, PRKACB, MYLK, EP400, ATAD2B

[i] GO, Gene Ontology.

Furthermore, 11 KEGG pathways were found to be enriched, including the MAPK signaling pathway (P=1.906×10⁻³; MAP3K7, RPS6KA5, RPS6KA6, MKNK2, FGF13, PRKACB and GADD45A), p53 signaling pathway (P=6.723×10⁻³; CDKN1A, GADD45A, and TP73), Wnt signaling pathway (P=8.490×10⁻³; MAP3K7, CTBP1, FZD3, and PRKACB), neuroactive ligand-receptor interaction (P=3.522×10⁻²; LEP, S1PR3, and F2R) and Jak-STAT signaling pathway (P=3.876×10⁻²; LEP and IL12B) (Table IV).

Table IV.

Kyoto Encyclopedia of Genes and Genomes pathway enrichment analysis for the genes in the PPI network.

Table IV.

Kyoto Encyclopedia of Genes and Genomes pathway enrichment analysis for the genes in the PPI network.

TermCountP-valueGenes
hsa05200: Pathways in cancer8 1.631×10⁻³CDKN1A, CTBP1, HSP90B1, ERBB2, PML, FGF13, FZD3, ZBTB16
hsa04010: MAPK signaling pathway7 1.906×10⁻³MAP3K7, RPS6KA5, RPS6KA6, MKNK2, FGF13, RKACB, GADD45A
hsa00230: Purine metabolism5 2.757×10⁻³POLR2J, PNPT1, PDE5A, PDE4D, POLR2D
hsa04621: NOD-like receptor signaling pathway3 5.778×10⁻³MAP3K7, HSP90B1, TNFAIP3
hsa04115: p53 signaling pathway3 6.723×10⁻³CDKN1A, GADD45A, TP73
hsa04120: Ubiquitin mediated proteolysis4 6.914×10⁻³PRPF19, UBE2D4, UBE2A, PML
hsa04310: Wnt signaling pathway4 8.490×10⁻³MAP3K7, CTBP1, FZD3, PRKACB
hsa04540: Gap junction3 1.024×10⁻²TUBA8, TUBA4A, PRKACB
hsa04020: Calcium signaling pathway4 1.153×10⁻²ERBB2, PRKACB, MYLK, F2R
hsa04080: Neuroactive ligand-receptor interaction3 3.522×10⁻²LEP, S1PR3, F2R
hsa04630: Jak-STAT signaling pathway2 3.876×10⁻²LEP, IL12B
Disease-associated pathway network

A total of 162 KEGG pathways and 44 genes were identified to be associated with PCOS in the CTD. After comparing with the genes in the PPI network, one common gene, LEP, was identified. The genes that interacted with LEP, along with the pathways involving LEP or its associated genes, were used to construct the disease-associated pathway network. Four genes (SPP1, F2R, IL12B and RBP4) and two important pathways (the Jak-STAT signaling pathway and neuroactive ligand-receptor interaction) were revealed (Fig. 6). Both SPP1 and RBP4 were found to interact with LEP. Three genes, including F2R, IL12B and LEP, were involved in the Jak-STAT signaling pathway, and LEP was also associated with the neuroactive ligand-receptor interaction. Expression levels of F2R, IL12B, LEP and SPP1 were significantly increased in the PCOS samples, and their methylation levels were clearly reduced in PCOS samples. The expression of RBP4 was found to be downregulated in PCOS samples, whereas methylation of RBP4 was upregulated (Fig. 7).

Discussion

Although large-scale genetic and functional studies have shown that epigenetic mechanisms contributed to the development of PCOS, roles of DNA modification in human PCOS have yet to be completely understood (25). In the present study, 499 genes were identified to have both differential methylation and expression levels. Among these genes, the expression levels of 237 of them were negatively correlated with their methylation levels. One common gene, LEP, was identified between genes in the PPI network and genes associated to PCOS in the CTD.

Leptin, a 167-amino-acid peptide hormone, is secreted mainly by adipose tissue, and the placenta is the second leptin-producing tissue in humans (26). Studies have revealed that the serum leptin concentration in patients with PCOS is significantly higher compared with that in non-PCOS controls, and serum leptin levels were correlated with body mass index, metabolic disorder, infertility and insulin resistance (2729). Nevertheless, the roles of leptin in PCOS pathogenesis have yet to be completely elucidated. In the present study, it was revealed that the expression levels of LEP were significantly increased in the subcutaneous adipose tissue samples of patients with PCOS, and methylation levels were reduced. The pathway network analysis showed that LEP was able to interact with SPP1 and RBP4. The F2R, IL12B and LEP genes were involved in the Jak-STAT signaling pathway, and LEP was also associated with the neuroactive ligand-receptor interaction.

Leptin communicates energy storage status to the central nervous system by binding and activating a cell-surface leptin receptor to regulate appetite, metabolic rate and neuroendocrine function (30). Leptin receptor requires activation of receptor-associated kinases of the Janus family (Jak); subsequently, Jak is autophosphorylated and then tyrosine-phosphorylates various signal transducers and activators of transcription (STATs) (31). Leptin is able to stimulate the Jak-STAT pathway mainly by promoting Jak2 activation, which is the most important Jak isoform to mediate the physiological effects of leptin (32). An increased level of phosphorylation of STAT3 has also been observed in placentas collected from women with PCOS (33). Based on these findings, it is possible to hypothesize that LEP serves an important role in the pathophysiology of PCOS via participating in the Jak-STAT signaling pathway.

In the present study, functional enrichment analysis revealed that IL12B and F2R were also associated with regulation of cell proliferation, regulation of apoptosis, regulation of programmed cell death, regulation of cell death and cell cycle. Meanwhile, RBP4 was also associated with regulation of cell proliferation, and SPP1 participated in the pathway of focal adhesion. The expression levels of F2R, IL12B and SPP1 were significantly increased in PCOS samples, while their methylation levels were clearly reduced in the PCOS samples. The expression of RBP4 was downregulated in PCOS samples, whereas its methylation level was upregulated. PCOS is characterized by hyperandrogenism, which is a fundamental factor in the pathogenesis of PCOS leading to polycystic ovarian morphology and ovulatory dysfunction in women with PCOS (34). Proteins associated with cell survival in the endometria of PCOS may have participatory roles in disruption of the endometrial cell cycle (35). Oocyte apoptosis can trigger atresia during the early phases of follicle development, leading to death of the surrounding granulosa cells that provide oocytes with nutrients and growth regulators, and dysregulation of granulosa cells is responsible for abnormal folliculogenesis and excess production of intraovarian androgens in women with PCOS (36,37). It has been shown that the rates of cell death and proliferation in granulosa cell populations were markedly altered in patients with PCOS, which could be due to differential expression of apoptotic effectors and cell survival factors (37). In addition, miR-16 expression was downregulated, and the expression of its target gene, programmed cell death protein 4 (PDCD4), was upregulated in ovarian cortex tissues and the serum of patients with PCOS, and the targeting of PDCD4 by miR-16 may be involved in the pathogenesis of PCOS by inhibiting facilitating cell proliferation, promoting cell cycle progression and facilitating apoptosis of granulosa cells (38). Moreover, testosterone inhibited cell growth and enhanced apoptosis of granulosa cells, possibly by reducing miR-16 and increasing the level of PDCD4. It could be hypothesized that cell proliferation, cell death and the cell cycle all fulfill important roles in abnormal folliculogenesis of PCOS (38). The present study revealed that four aberrantly methylated and expressed genes (RBP4, SPP1, IL12B and F2R) might also participate in the pathophysiology of PCOS by regulating cell death and the cell cycle as it relates to abnormal folliculogenesis. However, the expression and methylation levels of these important genes, including RBP4, SPP1, IL12B and F2R, need to be further validated by scientific experiments in the laboratory, such as RT-qPCR.

In conclusion, the present study has revealed numerous important genes with altered DNA methylation levels that may affect mRNA expression. Furthermore, information has tentatively been provided concerning their putative functions and pathways in which they participate. These findings may provide novel insights into the pathogenesis of PCOS and the development of therapeutic intervention strategies.

Supplementary Material

Supporting Data

Acknowledgements

Not applicable.

Funding

No funding was received.

Availability of data and materials

All data generated or analyzed during this study are included in this published article.

Authors' contributions

LL was responsible for the conception and design of the research, and drafting the manuscript. DH performed the data acquisition. YW performed the data analysis and interpretation. MS participated in the design of the study and performed the statistical analysis. All authors have read and approved the manuscript.

Ethics approval and consent to participate

Not applicable.

Patient consent for publication

Not applicable.

Competing interests

The authors declare that they have no competing interests.

References

1 

Azziz R, Carmina E, Chen Z, Dunaif A, Laven JS, Legro RS, Lizneva D, Natterson-Horowtiz B, Teede HJ and Yildiz BO: Polycystic ovary syndrome. Nat Rev Dis Primers. 2:160582016. View Article : Google Scholar : PubMed/NCBI

2 

Neven ACH, Laven J, Teede HJ and Boyle JA: A summary on polycystic ovary syndrome: Diagnostic criteria, prevalence, clinical manifestations, and management according to the latest international guidelines. Semin Reprod Med. 36:5–12. 2018. View Article : Google Scholar : PubMed/NCBI

3 

Strauss JF, Modi BP and McAllister JM: The genetics of polycystic ovary syndrome: From genome-wide association to molecular mechanisms. Reproductive Medicine for Clinical Practice. Springer; pp. 25–33. 2018, View Article : Google Scholar

4 

Zhong Z, Li F, Li Y, Qin S, Wen C, Fu Y and Xiao Q: Inhibition of microRNA-19b promotes ovarian granulosa cell proliferation by targeting IGF-1 in polycystic ovary syndrome. Mol Med Rep. 17:4889–4898. 2018.PubMed/NCBI

5 

Barber T and Franks S: Genetic and environmental factors in the etiology of polycystic ovary syndrome. The Ovary. Elsevier; pp. 437–459. 2019, View Article : Google Scholar

6 

Guo F, Li X, Liang D, Li T, Zhu P, Guo H, Wu X, Wen L, Gu TP, Hu B, et al: Active and passive demethylation of male and female pronuclear DNA in the mammalian zygote. Cell Stem Cell. 15:447–459. 2014. View Article : Google Scholar : PubMed/NCBI

7 

Wijaya AD, Febri RR, Hestiantoro A and Asmarinah: DNA methylation analysis of anti-mullerian hormone gene in ovarian granulosa cells in PCOS patients. J Phys Conf Ser. 1073:0320772018. View Article : Google Scholar

8 

Xu N, Azziz R and Goodarzi MO: Epigenetics in polycystic ovary syndrome: A pilot study of global DNA methylation. Fertil Steril. 94:781–783.e1. 2010. View Article : Google Scholar : PubMed/NCBI

9 

Shen HR, Qiu LH, Zhang ZQ, Qin YY, Cao C and Di W: Genome-wide methylated DNA immunoprecipitation analysis of patients with polycystic ovary syndrome. PLoS One. 8:e648012013. View Article : Google Scholar : PubMed/NCBI

10 

Xu J, Xiao B, Peng Z, Wang L, Du L, Niu W and Sun Y: Comprehensive analysis of genome-wide DNA methylation across human polycystic ovary syndrome ovary granulosa cell. Oncotarget. 7:27899–27909. 2016.PubMed/NCBI

11 

Wang XX, Wei JZ, Jiao J, Jiang SY, Yu DH and Li D: Genome-wide DNA methylation and gene expression patterns provide insight into polycystic ovary syndrome development. Oncotarget. 5:6603–6610. 2014.PubMed/NCBI

12 

Parkinson H, Sarkans U, Kolesnikov N, Abeygunawardena N, Burdett T, Dylag M, Emam I, Farne A, Hastings E, Holloway E, et al: ArrayExpress update-an archive of microarray and high-throughput sequencing-based functional genomics experiments. Nucleic Acids Res. 39:D1002–D1004. 2011. View Article : Google Scholar : PubMed/NCBI

13 

Ritchie ME, Phipson B, Wu D, Hu Y, Law CW, Shi W and Smyth GK: Limma powers differential expression analyses for RNA-sequencing and microarray studies. Nucleic Acids Res. 43:e472015. View Article : Google Scholar : PubMed/NCBI

14 

Rao Y, Lee Y, Jarjoura D, Ruppert AS, Liu CG, Hsu JC and Hagan JP: A comparison of normalization techniques for microRNA microarray data. Stat Appl Genet Mol Biol. 7:Article222008. View Article : Google Scholar : PubMed/NCBI

15 

Smyth GK: Limma: Linear models for microarray data. Bioinformatics and computational biology solutions using R and Bioconductor. Springer; pp. 397–420. 2005, View Article : Google Scholar

16 

Benjamini Y and Hochberg Y: Controlling the false discovery rate: A practical and powerful approach to multiple testing. J Royal Stat Soc Series B. 57:289–300. 1995.

17 

Uchino H, Ito M, Kazumata K, Hama Y, Hamauchi S, Terasaka S, Sasaki H and Houkin K: Circulating miRNome profiling in moyamoya disease-discordant monozygotic twins and endothelial microRNA expression analysis using iPS cell line. BMC Med Genomics. 11:722018. View Article : Google Scholar : PubMed/NCBI

18 

Wang L, Cao C, Ma Q, Zeng Q, Wang H, Cheng Z, Zhu G, Qi J, Ma H, Nian H and Wang Y: RNA-seq analyses of multiple meristems of soybean: Novel and alternative transcripts, evolutionary and functional implications. BMC Plant Biol. 14:1692014. View Article : Google Scholar : PubMed/NCBI

19 

Deza MM and Deza E: Encyclopedia of Distances. Encyclopedia of Distances. Springer; Berlin, Heidelberg: 2009, View Article : Google Scholar

20 

Huang da W, Sherman BT and Lempicki RA: Systematic and integrative analysis of large gene lists using DAVID bioinformatics resources. Nat Protoc. 4:44–57. 2009. View Article : Google Scholar : PubMed/NCBI

21 

Huang da W, Sherman BT and Lempicki RA: Bioinformatics enrichment tools: Paths toward the comprehensive functional analysis of large gene lists. Nucleic Acids Res. 37:1–13. 2009. View Article : Google Scholar : PubMed/NCBI

22 

Szklarczyk D, Morris JH, Cook H, Kuhn M, Wyder S, Simonovic M, Santos A, Doncheva NT, Roth A, Bork P, et al: The STRING database in 2017: Quality-controlled protein-protein association networks, made broadly accessible. Nucleic Acids Res. 45:D362–D368. 2017. View Article : Google Scholar : PubMed/NCBI

23 

Shannon P, Markiel A, Ozier O, Baliga NS, Wang JT, Ramage D, Amin N, Schwikowski B and Ideker T: Cytoscape: A software environment for integrated models of biomolecular interaction networks. Genome Res. 13:2498–2504. 2003. View Article : Google Scholar : PubMed/NCBI

24 

Davis AP, Murphy CG, Johnson R, Lay JM, Lennon-Hopkins K, Saraceni-Richards C, Sciaky D, King BL, Rosenstein MC, Wiegers TC and Mattingly CJ: The comparative toxicogenomics database: Update 2013. Nucleic Acids Res. 41:D1104–D1114. 2013. View Article : Google Scholar : PubMed/NCBI

25 

Azziz R: PCOS in 2015: New insights into the genetics of polycystic ovary syndrome. Nat Rev Endocrinol. 12:74–75. 2016. View Article : Google Scholar : PubMed/NCBI

26 

Margetic S, Gazzola C, Pegg GG and Hill RA: Leptin: A review of its peripheral actions and interactions. Int J Obes Relat Metab Disord. 26:1407–1433. 2002. View Article : Google Scholar : PubMed/NCBI

27 

Nomair AM, Aref NK, Rizwan F, Ezzo OH and Hassan N: Serum leptin level in obese women with polycystic ovary syndrome and its relation to insulin resistance. Asian Pac J Reproduction. 3:288–294. 2014. View Article : Google Scholar

28 

Marciniak A and Starczewski A: The role of leptin in polycystic ovary syndrome. Pol Merkur Lekarski. 25:390–393. 2008.(In Polish). PubMed/NCBI

29 

Zheng SH, Du DF and Li XL: Leptin levels in women with polycystic ovary syndrome: A systematic review and a meta-analysis. Reprod Sci. 24:656–670. 2016. View Article : Google Scholar : PubMed/NCBI

30 

Flier JS: Leptin expression and action: New experimental paradigms. Proc Natl Acad Sci USA. 94:4242–4245. 1997. View Article : Google Scholar : PubMed/NCBI

31 

Ghilardi N and Skoda RC: The leptin receptor activates janus kinase 2 and signals for proliferation in a factor-dependent cell line. Mol Endocrinol. 11:393–399. 1997. View Article : Google Scholar : PubMed/NCBI

32 

Kloek C, Haq AK, Dunn SL, Lavery HJ, Banks AS and Myers MG Jr: Regulation of Jak kinases by intracellular leptin receptor sequences. J Biol Chem. 277:41547–41555. 2002. View Article : Google Scholar : PubMed/NCBI

33 

Maliqueo M, Sundström Poromaa I, Vanky E, Fornes R, Benrick A, Åkerud H, Stridsklev S, Labrie F, Jansson T and Stener-Victorin E: Placental STAT3 signaling is activated in women with polycystic ovary syndrome. Hum Reprod. 30:692–700. 2015. View Article : Google Scholar : PubMed/NCBI

34 

Chen MJ, Yang WS, Chen CL, Wu MY, Yang YS and Ho HN: The relationship between anti-Müllerian hormone, androgen and insulin resistance on the number of antral follicles in women with polycystic ovary syndrome. Hum Reprod. 23:952–957. 2008. View Article : Google Scholar : PubMed/NCBI

35 

Maliqueo M, Clementi M, Gabler F, Johnson MC, Palomino A, Sir-Petermann T and Vega M: Expression of steroid receptors and proteins related to apoptosis in endometria of women with polycystic ovary syndrome. Fertil Steril. 80 (Suppl 2):S812–S819. 2003. View Article : Google Scholar

36 

Du Y, Wang J, Lyu B, Yan G and Sun H: Impaired granulosa cells promote self-damage by regulating the generation of macrophage in polycystic ovary syndrome. Int J Clin Exp Pathol. 9:10992–11002. 2016.

37 

Das M, Djahanbakhch O, Hacihanefioglu B, Saridogan E, Ikram M, Ghali L, Raveendran M and Storey A: Granulosa cell survival and proliferation are altered in polycystic ovary syndrome. J Clin Endocrinol Metab. 93:881–887. 2008. View Article : Google Scholar : PubMed/NCBI

38 

Fu X, He Y, Wang X, Peng D, Chen X, Li X and Wan Q: MicroRNA-16 promotes ovarian granulosa cell proliferation and suppresses apoptosis through targeting PDCD4 in polycystic ovarian syndrome. Cell Physiol Biochem. 48:670–682. 2018. View Article : Google Scholar : PubMed/NCBI

Related Articles

Journal Cover

May-2020
Volume 21 Issue 5

Print ISSN: 1791-2997
Online ISSN:1791-3004

Sign up for eToc alerts

Recommend to Library

Copy and paste a formatted citation
x
Spandidos Publications style
Liu L, He D, Wang Y and Sheng M: Integrated analysis of DNA methylation and transcriptome profiling of polycystic ovary syndrome. Mol Med Rep 21: 2138-2150, 2020
APA
Liu, L., He, D., Wang, Y., & Sheng, M. (2020). Integrated analysis of DNA methylation and transcriptome profiling of polycystic ovary syndrome. Molecular Medicine Reports, 21, 2138-2150. https://doi.org/10.3892/mmr.2020.11005
MLA
Liu, L., He, D., Wang, Y., Sheng, M."Integrated analysis of DNA methylation and transcriptome profiling of polycystic ovary syndrome". Molecular Medicine Reports 21.5 (2020): 2138-2150.
Chicago
Liu, L., He, D., Wang, Y., Sheng, M."Integrated analysis of DNA methylation and transcriptome profiling of polycystic ovary syndrome". Molecular Medicine Reports 21, no. 5 (2020): 2138-2150. https://doi.org/10.3892/mmr.2020.11005