Introduction
Rheumatoid arthritis (RA) and osteoarthritis (OA),
which are the two most common chronic inflammatory joint diseases
that culminate in joint deformity and disability worldwide, both
result from persistent inflammatory disorders (1). Both RA and OA involve the destruction
of articular cartilage, which eventually results in joint
dysfunction (2); however, the
pathogenesis of the two diseases is different and remains largely
unknown. RA is a systemic autoimmune disease that involves multiple
pathways and is characterized by hyperplasia of the synovium,
formation of pannus, angiogenesis and T cell infiltration (3); the tumorigenic-like growth of the
synovium causes progressive destruction of the bone and articular
cartilage (4). Rheumatoid
arthritis fibroblast-like synoviocytes (RAFLS) are the most
important components of RA synovial tissue and serve an important
role in joint destruction through the secretion of various
proteases and cytokines (5); the
secretion of pro-inflammatory mediators is the main cause of the
persistent pain in RA (6). In
addition, the contributory role of rheumatoid factor (RF) and
anti-citrullinated peptide antibodies (ACPA) in the deterioration
of joins have also been investigated (7). ACPA leads to production of
pro-inflammatory cytokines and differentiation of osteoclasts
(8). Moreover, systemic appearance
of ACPA precedes the onset of RA by a number of years (9). OA is a chronic degenerative disease,
which is characterized by articular cartilage damage, osteophyte
formation and subchondral bone sclerosis. OA is affected by
multiple factors, such as age, gender, trauma history, obesity,
heredity and joint deformity (10). It is widely accepted that synovitis
is associated with symptoms such as joint pain and swelling, and
may promote cartilage degradation (11).
microRNAs (miRNAs) are a class of small non-coding
RNAs of ~18–25 nucleotides in length, which are highly conserved
throughout evolution and serve as important post-transcriptional
regulators of gene expression. Each miRNA prevents the
transcription of numerous downstream genes by incompletely binding
to the 3′ untranslated region of target mRNAs, whereas complete
complementary base-pairing leads to the degradation of mRNAs
(12). miRNAs play roles in almost
all aspects of cancer biology including cell cycle, programmed cell
death, tumorigenesis, angiogenesis, invasion and migration
(13). Abnormal expression levels
of miRNAs are also involved in the pathogenesis of RA, and their
different functions in the synovium, synovial fluid and serum have
been reported in past decade. MiR-16, miR-146a/b, miR-150, miR-155,
and miR-223 were overexpressed in both the periphery and RA joints
(14). miRNA expression levels
also differ depending on the stage and activity of the disease
(15). Serum miR-22 and miR-103a
may predict RA development (16).
Serum miR-223 levels have been associated with RA activity and
disease relapse (17).
Microarray datasets for RA and OA synovial tissue
samples provide a unique perspective for understanding the
molecular mechanisms of the diseases (18) and facilitate the identification of
potential target genes and pathways for targeted therapy. Due to
the complexity of the genome, most of the genes thought to be
involved in the pathogenesis of RA remain to be identified; thus,
the present study aimed to investigate the molecular mechanisms and
potential therapeutic targets of RA using bioinformatics analysis.
Microarray data from the Gene Expression Omnibus (GEO) database was
obtained and used to identify differentially expressed genes (DEGs)
and differentially expressed miRNAs (DEMs) in RA compared with
patients with OA. In addition, Gene Ontology (GO) analysis and
Kyoto Encylopedia of Genes and Genomes (KEGG) pathway analysis was
used to predict the functional enrichment of DEGs. Selected genes
obtained from the bioinformatic analysis were subsequently
experimentally verified in vitro. These findings may help
identify potential diagnostic biomarkers and therapeutic targets of
RA.
Materials and methods
Microarray data
Microarray datasets GSE55457, GSE55235 (19) and GSE72564 were downloaded from the
GEO database (http://www.ncbi.nlm.nih.gov/geo), a public database
containing gene expression profiles, chips and microarrays.
GSE55457 and GSE55235 were composed of gene expression data using
Affymetrix Human Genome U133A Array platform, whereas GSE72564 was
performed using the Qiagen Human miRNome miScript miRNA PCR array
platform. The GSE55457 dataset comprised the gene expression data
of 10 synovial tissue samples from normal donors (ND), 13 synovial
tissue samples from patients with RA and 10 synovial tissue samples
from patients with OA; the GSE55235 dataset comprised the gene
expression data of 10 synovial tissue samples from NDs, 10 synovial
tissue samples from patients with RA and 10 synovial tissue samples
for patients with OA; and the GSE72564 comprised of gene expression
data of FLSs isolated from 4 patients with RA and 4 patients with
OA, which were cultivated for 4 passages.
Identification of DEGs and DEMs
The DEGS in RA and OA samples of the three datasets
were identified using GEO2R software (https://www.ncbi.nlm.nih.gov/geo/geo2r/). The cut-off
values for DEG selection in the GSE55457 and GSE55235 datasets were
P<0.05 and |log FC| >1.5. The expression of non-coding RNA is
different from coding RNA. The number of DEMs is too small under
the cut-off criteria of DEG. Thus P<0.05 and |log FC|>1 were
used for the GSE72564 dataset. The hierarchical clustering of DEGs
was performed using MeV 4.9.0 software (20). The intersections of DEGs in
different microarrays were visualized using VENNY 2.1.0 software
(21).
GO and KEGG pathway analysis of
DEGs
To determine the biological processes, molecular
functions and significantly altered metabolic pathways enriched by
DEGs, DEGs were subjected to functional term enrichment analysis
using The Database for Annotation, Visualization and Integrated
Discovery (DAVID 6.8; http://david.abcc.ncifcrf.gov/) for GO enrichment
analysis (P<0.05) and signaling pathway enrichment analysis
using the KEGG database (P<0.05).
PPI network and module analysis
A protein-protein interaction (PPI) network of the
DEGs was constructed using the Search Tool for the Retrieval of
Interacting Genes/Proteins (STRING 11.0; http://string-db.org/) database (22), with a threshold combined score of
>0.4 identified as significant, to determine the molecular
mechanisms that discriminate between RA and OA pathology. Cytoscape
v3.7.2 (23) was used to visualize
the PPI network. In the PPI network, the edges represent the
predicted functional interactions, while the network nodes
represent the proteins. The degree of the node was defined as the
number of interactions with other nodes. The highest degree means
the most ‘popular’ gene in the PPI network. Hub genes were defined
as nodes with ≥25 degrees. Interrelation analysis between the hub
genes and pathways was determined using the Cytoscape plug-in
ClueGO (24). The molecular
complex detection (MCODE) (25)
plug-in of Cytoscape was used to detect pivotal modules that may
represent molecular complexes in the PPI network, using a degree
cut-off value of 10 and node number >4, which was presented
using Cytoscape. KEGG pathway analysis of DEGs in modules was
subsequently performed using DAVID.
miRNA and target mRNA network
construction
Target mRNAs of DEMs were identified using starBase
v2.0 (26) and target genes were
predicted using five programs: microT v5.0 (27), miRmap (28), RNA22 (29), PicTar (30) and TargetScan 7.2 (31). Genes predicted by ≥3 databases were
identified as target genes for the DEMs. Subsequently, the
intersection genes of MCODE network and miRNA/mRNA networks were
integrated to investigate the potential interactions between DEGs
and DEMs.
Patient samples
All experiments involving patient samples were
approved by the Clinical Research Ethics Committee of Xi'an
Jiaotong University (approval no. XJTULAC-2018454). Written
informed consent was obtained from all participants. Human synovium
biopsies were obtained from patients with RA and OA undergoing
total knee arthroplasty at Xi'an Honghui Hospital from March 2018
to April 2019, who fulfilled the diagnostic criteria of the
American College of Rheumatology and had a Disease Activity Score
28-joint assessment of ≥3 (32).
Synovial tissue of patients with OA were obtained as the controls.
The clinicopathological features of the patients are presented in
Table SI.
Reverse transcription-quantitative PCR
(RT-qPCR)
Total RNA was extracted from synovial tissues using
TRIzol® reagent (Invitrogen; Thermo Fisher Scientific,
Inc.) according to the manufacturer's protocol. Total RNA (5 µg)
was reverse transcribed into cDNA using the RevertAid First Strand
cDNA Synthesis kit (Thermo Fisher Scientific, Inc.). Total RNA and
primer were mixed and incubated at 65°C for 5 min. Reaction buffer
RiboLock, dNTP MIX and RevertAid were mixed gently and centrifuged
briefly. The mixture was incubated at 40°C for 60 min, 25°C for 5
min, finally heating at 70°C for 5 min for termination and stored
at −20°C. qPCR was subsequently performed using a ChamQ Universal
SYBR qPCR Master mix (Vazyme Biotech Co., Ltd.) according to the
manufacturer's protocol, in a volume of 10 µl, and an Agilent
StrataGene Mx3000P QPCR system (Agilent Technologies, Inc.). The
following primer pairs used for the qPCR are listed in Table I. The following thermocycling
conditions were used for the qPCR: Initial denaturation at 95°C for
10 min; and 45 cycles at 95°C for 10 sec, 60°C for 15 sec and 72°C
for 30 sec. Expression levels were quantified using the
2−ΔΔCq method (33) and
normalized to ACTB.
 | Table I.Primers used for reverse
transcription-quantitative PCR. |
Table I.
Primers used for reverse
transcription-quantitative PCR.
| Gene | Primer sequence
(5′→3′) |
|---|
| PI3CG | F:
CACCCAAAAGCATATCCTAAGC |
|
| R:
TAATGCAGAACATCATCGTCC |
| LCK | F:
GTGTGTGAGAACTGCCATTATC |
|
| R:
GATTGGAGCCTTCGTAGGTAAC |
| ZAP70 | F:
AGAGCTCTGCGAGTTCTACTC |
|
| R:
TCTCGCAGGCAGTCGAAGA |
| LEP | F:
CATCAAGACAATTGTCACCAGG |
|
| R:
GTCGTTGGATATTTGGATCACG |
| HGF | F:
AATCCACTCATTCCTTGGGATT |
|
| R:
TCCCATTTACAACTCGCAATTG |
| CTLA4 | F:
CAGTTAGTTCGGGGTTGTTTTT |
|
| R:
TTTTCACATTCTGGCTCTGTTG |
|
SERPINE1 | F:
AACGTGGTTTTCTCACCCTAT |
|
| R:
CAATCTTGAATCCCATAGCTGC |
| SDC1 | F:
AAGATATCACCTTGTCACAGCA |
|
| R:
GTTCTGGAGACGTGGGAATAG |
| NPY1R | F:
GAGGCGATGTGTAAGTTGAATC |
|
| R:
ACCCAAATCACAGCAATACCTA |
| ACTB | F:
AAGGATTCCTATGTGGGCGAC |
|
| R:
CGTACAGGGATAGCACAGCC |
Statistical analysis
Statistical analysis was performed using SPSS 20.0
software (IBM Corp.) and GraphPad Prism 7.0 software (GraphPad
Software, Inc.). The experimental data are presented as the mean ±
SD. Statistical differences between two groups were determined
using a Student's t-test. P<0.05 was considered to indicate a
statistically significant difference.
Results
Identification of DEGs and DEMs
According to the cut-off criteria (P<0.05 and
|logFC|>1.5), data from each microarray was separately analyzed
using GEO2R to identify DEGs in RA compared with OA (RA-OA). A
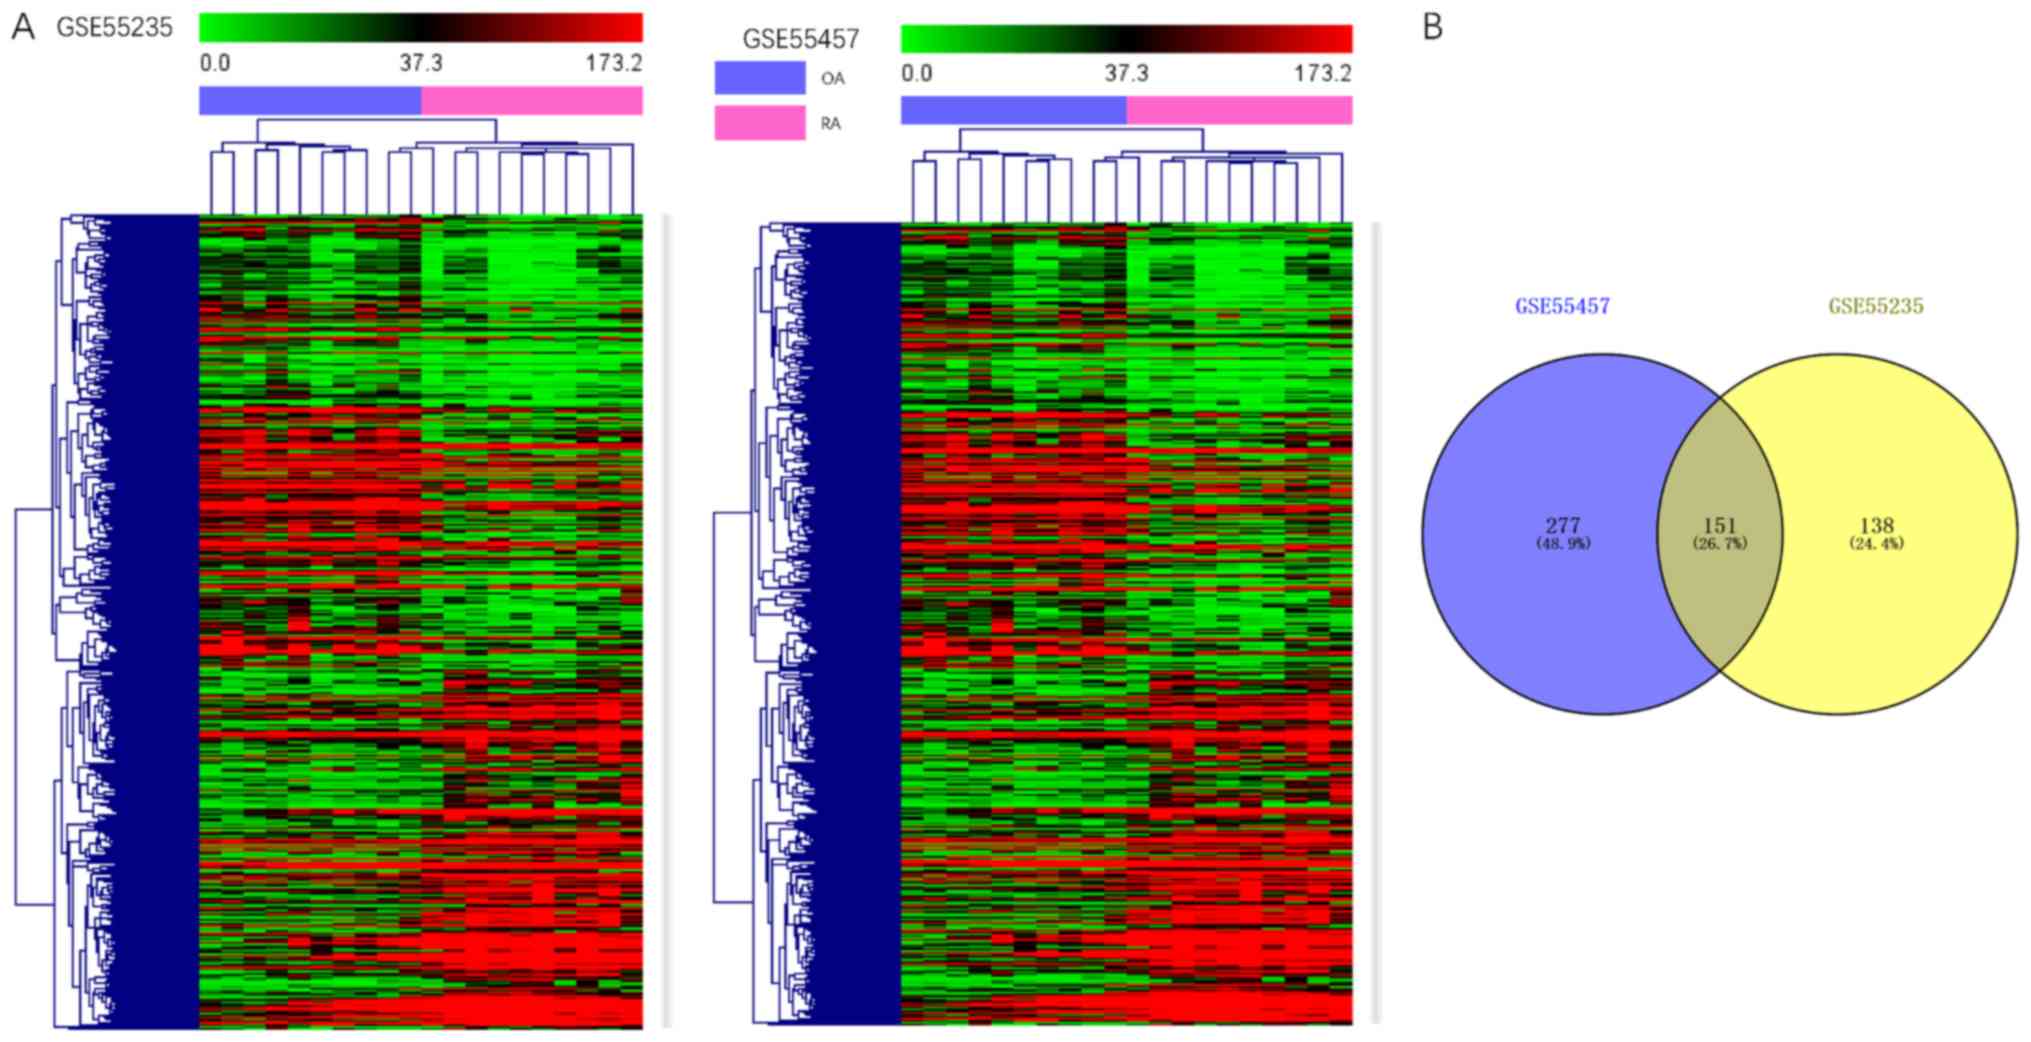
total of 428 DEGs were identified in the GSE55457 dataset and 289
DEGs in the GSE55235 dataset (Fig.
1B). MeV software was used for hierarchical clustering and to
generate expression heat maps (Fig.
1A). To investigate the identified DEGs, DEGs shared between
the two datasets and the genes found to be independently expressed
were selected (Fig. 1B). These 566
genes identified in the two datasets were defined as DEGs, and
consisted of 280 upregulated DEGs (uDEGs) and 286 downregulated
DEGs (dDEGs). In addition, 6 miRNAs were observed to be
downregulated and 17 miRNAs were upregulated in the GSE72564
dataset (Table II).
| Table II.Identification of the differentially
expressed microRNAs in the GSE72564 dataset obtained from the Gene
Expression Omnibus database. |
Table II.
Identification of the differentially
expressed microRNAs in the GSE72564 dataset obtained from the Gene
Expression Omnibus database.
| miRNA ID | P-value | Log, fold
change |
|---|
| hsa-miR-670 | 0.00181 | 1.5375 |
| hsa-miR-26a | 0.00365 | 2.0325 |
| hsa-miR-2116 | 0.00745 | 1.8950 |
| hsa-miR-653 | 0.01371 | −1.2775 |
| hsa-miR-190a | 0.02222 | 1.1625 |
| hsa-miR-2276 | 0.02301 | −1.8875 |
| hsa-miR-548b | 0.02336 | 1.5025 |
| hsa-miR-579 | 0.02551 | 1.2850 |
| hsa-miR-496 | 0.02800 | −1.0725 |
| hsa-miR-1305 | 0.02961 | 1.7775 |
| hsa-miR-30c | 0.02995 | 1.6525 |
| hsa-miR-20b | 0.03323 | 1.1150 |
| hsa-miR-4262 | 0.03394 | 1.1850 |
| hsa-miR-4263 | 0.03396 | −1.0450 |
| hsa-miR-502 | 0.03450 | 1.1650 |
| hsa-miR-1258 | 0.03540 | 1.4250 |
| hsa-miR-708 | 0.03672 | 2.1575 |
| hsa-miR-1193 | 0.04084 | −1.4750 |
| hsa-miR-1299 | 0.04256 | 1.6225 |
| hsa-miR-218 | 0.04671 | 2.7450 |
| hsa-miR-346 | 0.04710 | −1.0200 |
| hsa-miR-3116 | 0.04784 | 1.1275 |
| hsa-miR-499a | 0.04941 | 1.4275 |
GO term enrichment analysis and KEGG
pathway analysis
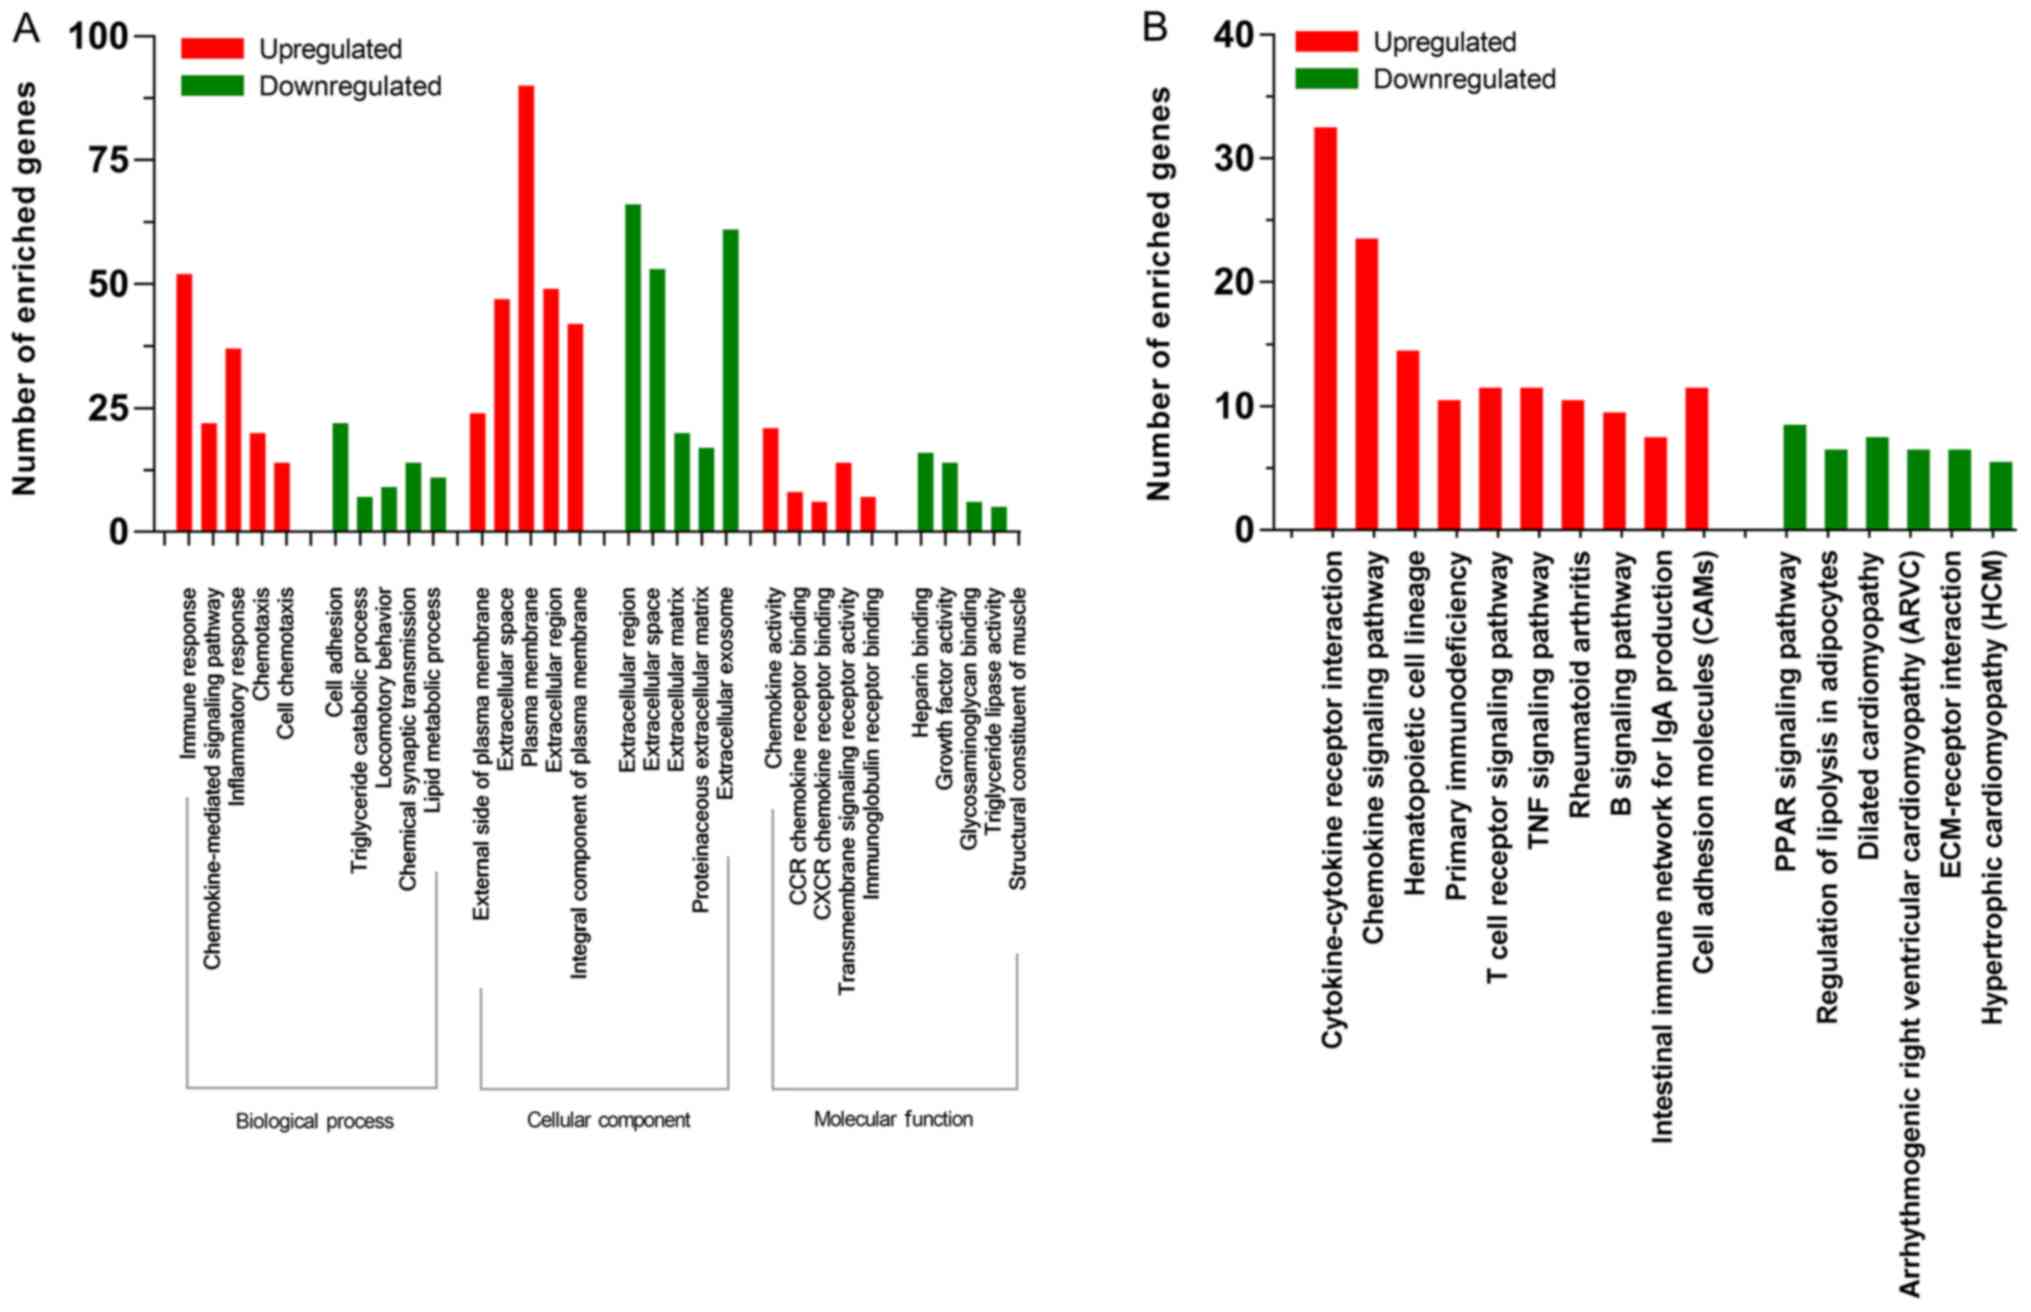
To determine the functions of the identified DEGs,
all DEGs were subjected to functional term enrichment analysis
using DAVID; uDEGs were mostly enriched in biological process (BP),
such as ‘Immune response’, ‘Chemokine-mediated signaling pathway’
and ‘Inflammatory response’, cellular component (CC), such as
‘External side of plasma membrane’ and ‘Plasma membrane’ and
molecular function (MF), such as ‘Chemokine activity’ and
‘Transmembrane signaling receptor activity’. dDEGs were
significantly enriched in BP, such as ‘Cell adhesion’ and ‘Chemical
synaptic transmission’, CC, such as ‘Extracellular region’,
‘Extracellular space’ and ‘Extracellular matrix’ and MF, such as
‘Heparin binding’ and ‘Growth factor activity’ (Fig. 2A). The most significantly enriched
signaling pathways of the uDEGs were identified as
‘Cytokine-cytokine receptor interaction’, ‘Chemokine signaling
pathway’, ‘Hematopoietic cell lineage’, ‘Primary immunodeficiency’
and ‘Cell adhesion molecules (CAMs)’ (Fig. 2B). Only six downregulated pathways
fulfiled the condition of P<0.05; these were ‘PPAR signaling
pathway’, ‘Regulation of lipolysis in adipocytes’, ‘Dilated
cardiomyopathy’, ‘Arrhythmogenic right ventricular cardiomyopathy
(ARVC)’ and’ ECM-receptor interaction’ (Fig. 2B).
PPI network construction and module
screening
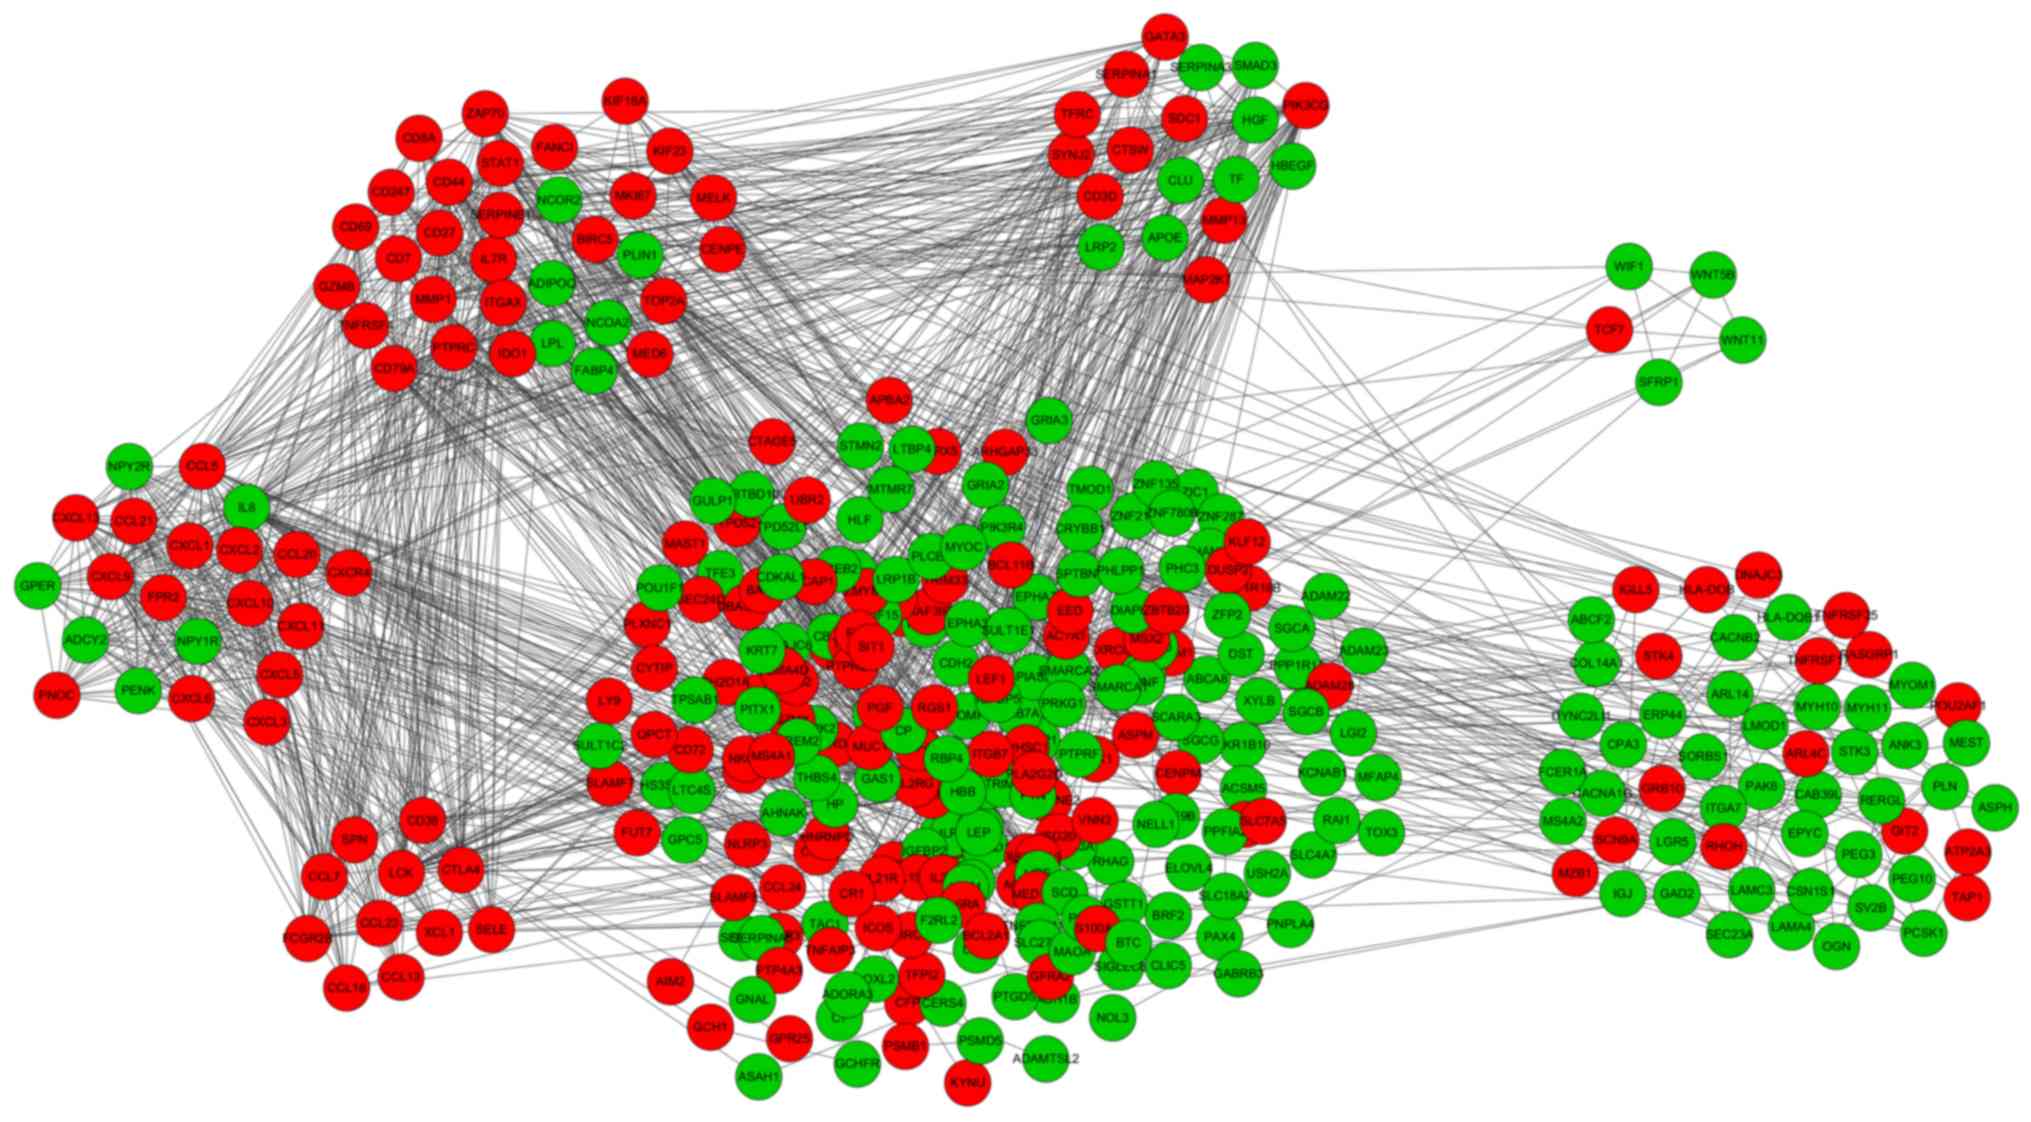
The PPI network of DEGs, constructed using STRING
and visualized using Cytoscape, consisted of 481 nodes and 1,728
edges (Fig. 3). The top 25 nodes
with the highest degree were selected. Pathway crosstalk analysis
of the top 22 nodes identified was performed through performing
KEGG pathway analysis in ClueGO (Fig.
4), with P<0.05 as the cut-off criterion. A total of 17 of
these 23 genes were found to be involved in inflammatory processes
(Table III), with 11 identified
as chemokines and their receptors, which are abundant in the
peripheral blood and in the local inflamed joints of RA (34). Thus, five different hub genes were
selected for further experimental validation:
Phosphatidylinositol-4,5-bisphosphate 3-kinase catalytic subunit γ
(PIKC3G), lymphocyte-specific kinase (LCK), leptin
(LEP), cytotoxic T-lymphocyte antigen (CTLA4) and ζ
chain of T cell receptor associated protein kinase 70
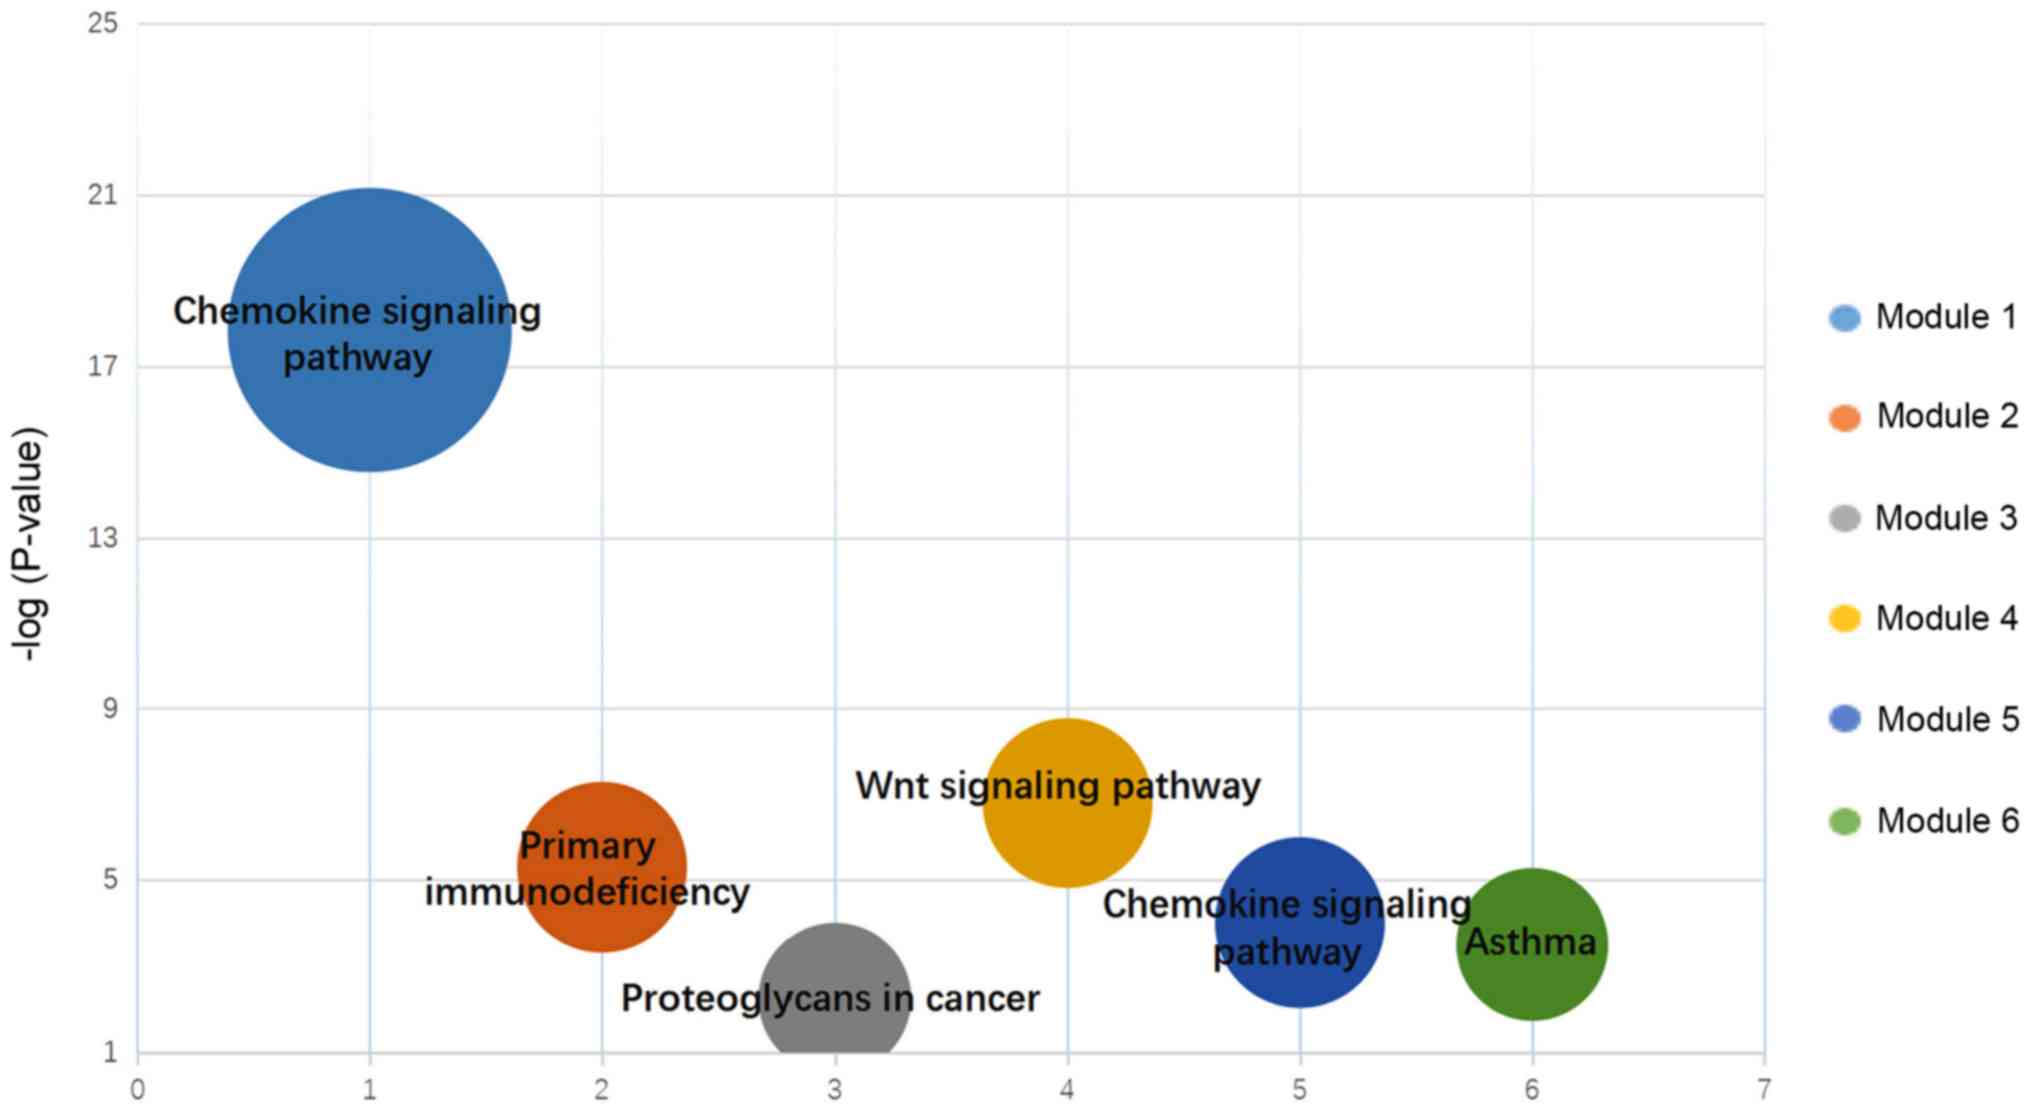
(ZAP70). Module analysis was performed using the MCODE
plug-in of Cytoscape and a total of 6 modules were selected using
the previously mentioned criterion from the whole PPI network
(Fig. 5). KEGG pathway enrichment
analysis of these genes were performed using DAVID and the pathway
analysis demonstrated that the selected genes in the modules were
mostly enriched in the ‘Chemokine signaling pathway’, ‘Primary
immunodeficiency’, ‘Proteoglycans in cancer’, ‘Wnt signaling
pathway’ and ‘Asthma’ (Fig.
5).
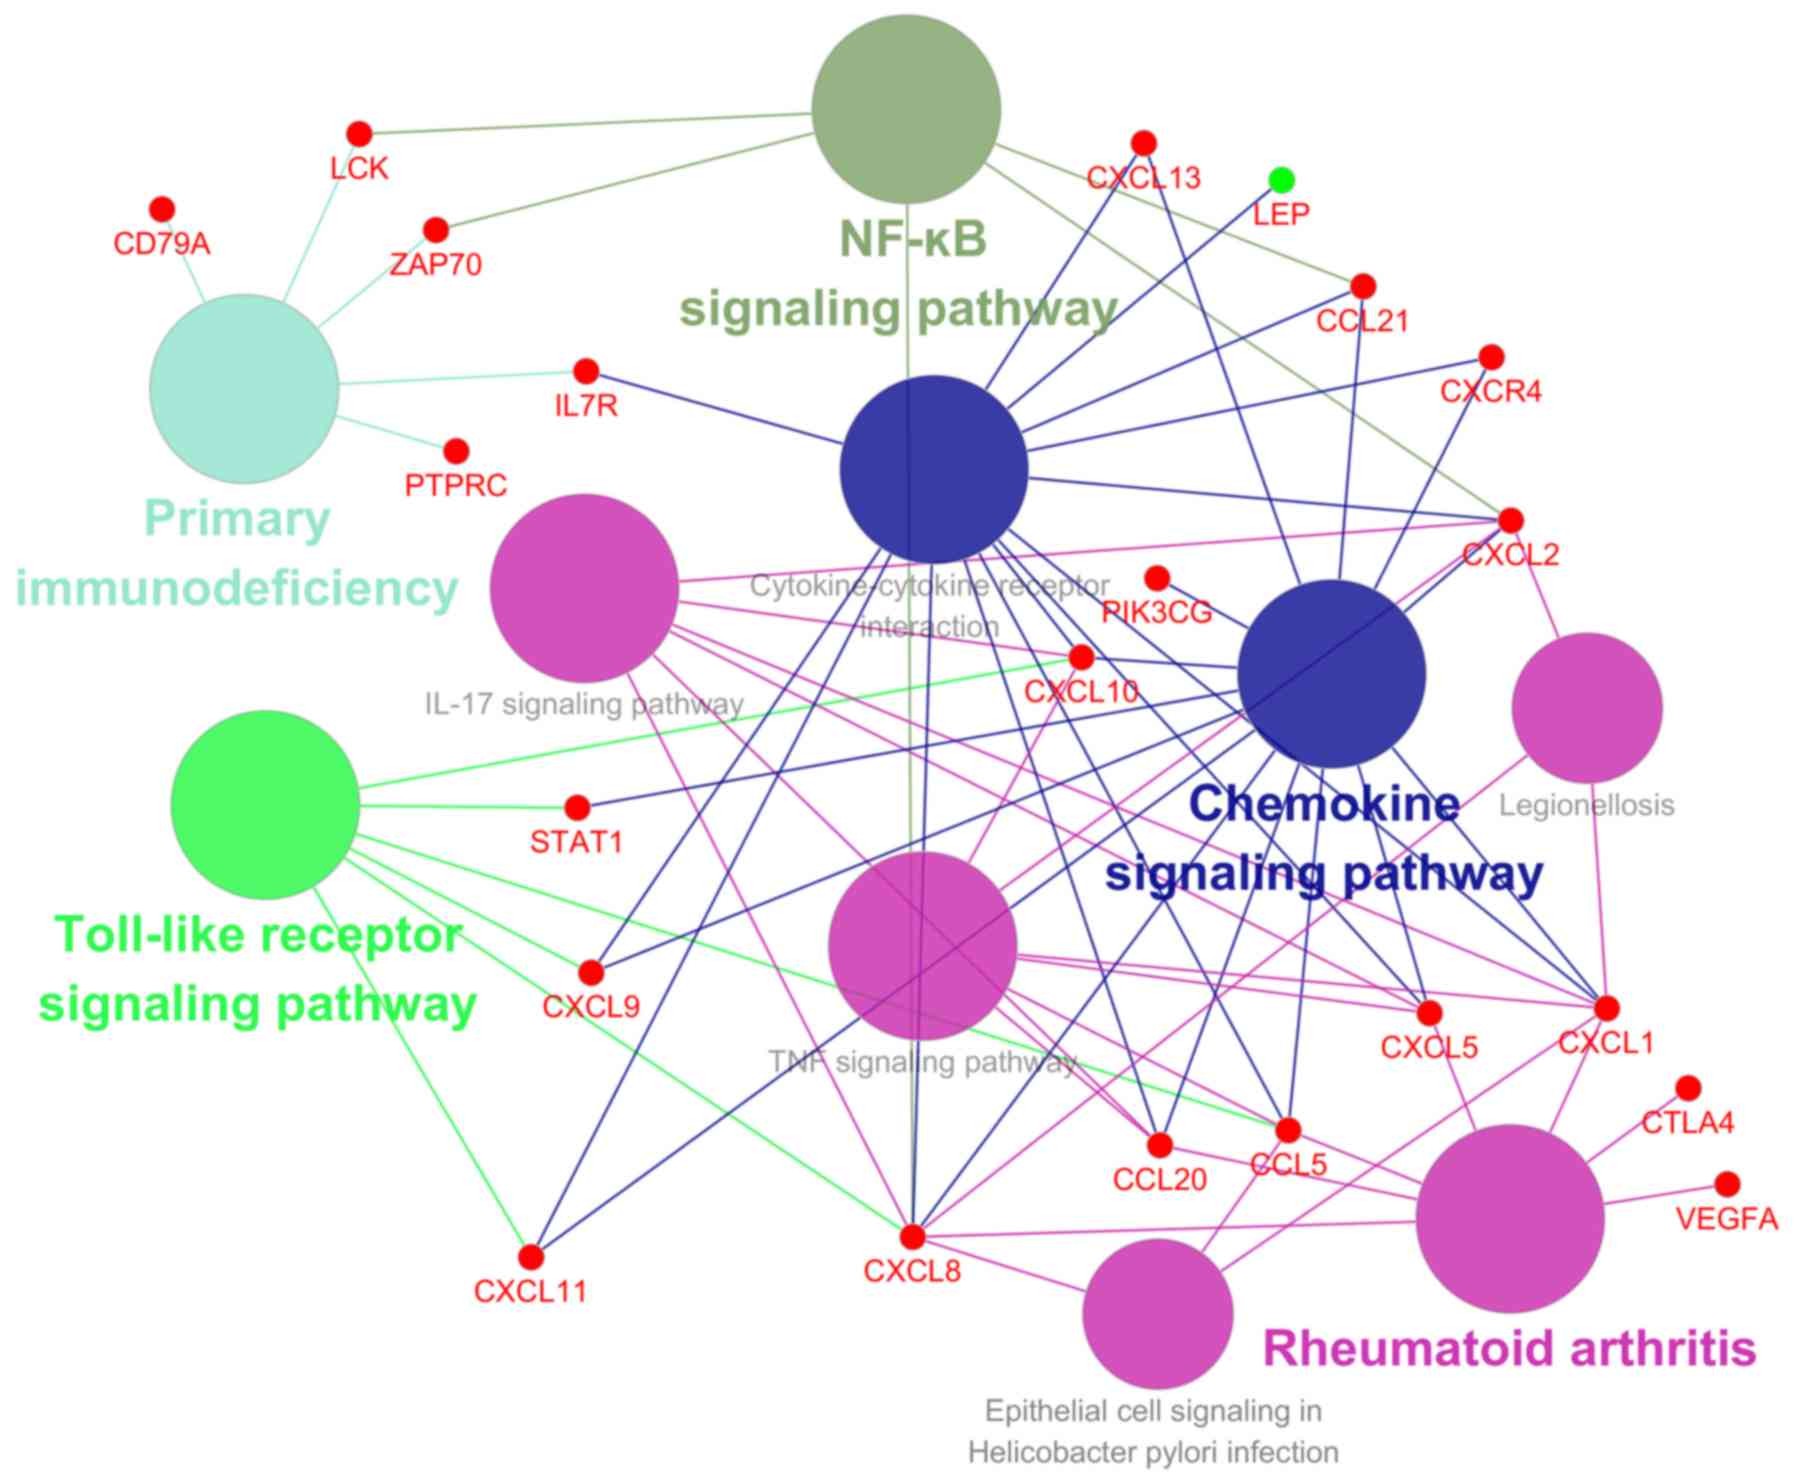 | Figure 4.Pathway crosstalk analysis of the top
25 nodes identified. Upregulated genes are marked in red and
downregulated genes are marked in green. Pathway crosstalk analysis
of the genes with highest degree was identified through performing
KEGG pathway analysis in ClueGO. LCK, LCK proto-oncogene;
ZAP70, ζ chain of T cell receptor-associated protein kinase
70; IL7R, interleukin 7 receptor; PTPRC, protein tyrosine
phosphatase receptor type C; CXCL13, C-X-C motif chemokine
ligand 13; LEP, leptin; CCL21, C-C motif chemokine
ligand 21; CXCR4, C-X-C motif chemokine receptor 4;
CXCL2, C-X-C motif chemokine ligand 2; PIK3CG,
phosphatidylinositol-4,5-bisphosphate 3-kinase catalytic subunit γ;
CXCL10, C-X-C motif chemokine ligand; STAT1, signal
transducer and activator of transcription 1; CXCL9, C-X-C
motif chemokine ligand 9; CXCL11, C-X-C motif chemokine
ligand 11; CXCL8, C-X-C motif chemokine ligand 8;
CCL20, C-C motif chemokine ligand 20; CCL5, C-C motif
chemokine ligand 5; CXCL5, C-X-C motif chemokine ligand;
CXCL1, C-X-C motif chemokine ligand; CTLA4, cytotoxic
T-lymphocyte-associated protein 4; VEGF, vascular endothelial
growth factor. |
| Table III.Hub genes with highest degree in
protein-protein interaction networks and intersected genes in
molecular complex detection analysis and microRNA/target genes. |
Table III.
Hub genes with highest degree in
protein-protein interaction networks and intersected genes in
molecular complex detection analysis and microRNA/target genes.
| Gene symbol
(name) | Degree | Predicted
expression level |
|---|
| CXCL8 (C-X-C
motif chemokine ligand 8) | 78 | Upregulated |
| VEGFA
(vascular endothelial growth factor A) | 64 | Upregulated |
| CXCR4 (C-X-C
motif chemokine receptor 4) | 51 | Upregulated |
| PIK3CG
(phosphatidylinositol-4,5-bisphosphate 3-kinase catalytic subunit
γ) | 50 | Upregulated |
| CCL5 (C-C
motif chemokine ligand 5) | 49 | Upregulated |
| LCK (LCK
proto-oncogene, Src family tyrosine kinase) | 48 | Upregulated |
| LEP
(leptin) | 43 | Downregulated |
| CXCL9 (C-X-C
motif chemokine ligand 9) | 41 | Upregulated |
| CXCL10
(C-X-C motif chemokine ligand 10) | 41 | Upregulated |
| CXCL1 (C-X-C
motif chemokine ligand 1) | 36 | Upregulated |
| ZAP70 (ζ
chain of T cell receptor associated protein kinase 70) | 35 | Upregulated |
| CCL20 (C-C
motif chemokine ligand 20) | 32 | Upregulated |
| IL7R
(interleukin 7 receptor) | 31 | Upregulated |
| CXCL11
(C-X-C motif chemokine ligand 11) | 31 | Upregulated |
| CXCL13
(C-X-C motif chemokine ligand 13) | 30 | Upregulated |
| CXCL2 (C-X-C
motif chemokine ligand 2) | 30 | Upregulated |
| HGF
(hepatocyte growth factor) | 33 | Downregulated |
| CTLA4
(cytotoxic T-lymphocyte associated protein 4) | 29 | Upregulated |
| SERPINE1
(Serpin family E member 1) | 28 | Upregulated |
| CD69 (CD69
molecule) | 28 | Upregulated |
| SDC1
(syndecan 1) | 24 | Upregulated |
| CXCL3 (C-X-C
motif chemokine ligand 3) | 23 | Upregulated |
| NPY1R
(neuropeptide Y receptor Y1) | 22 | Downregulated |
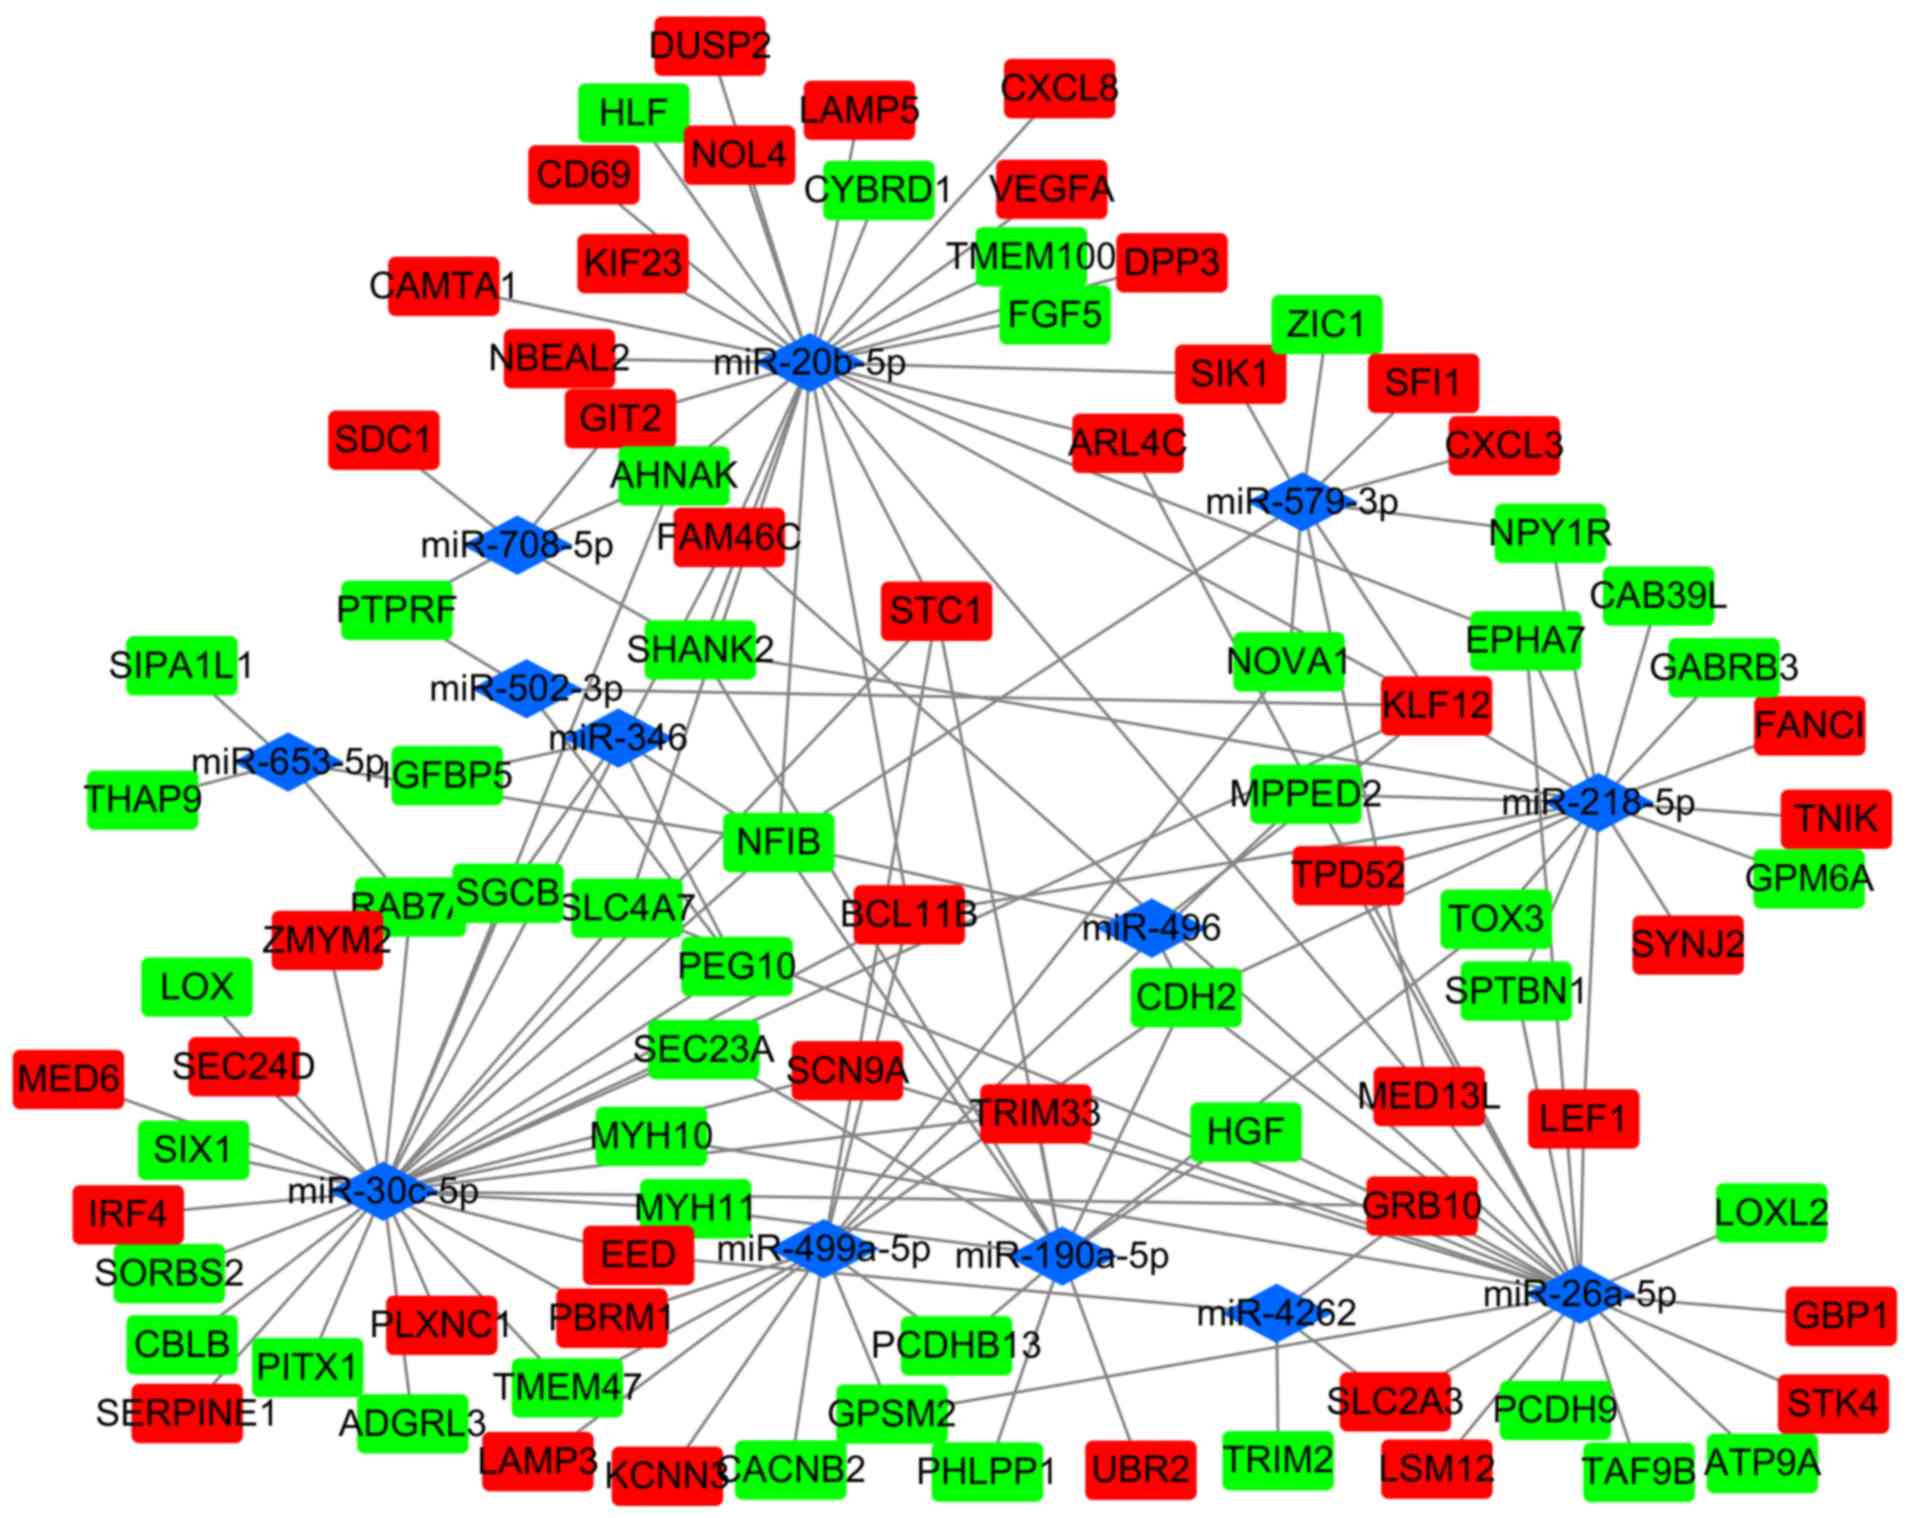
miRNA/mRNA network construction
The target genes were predicted using starBase and
compared with DEGs to identify pivotal target mRNAs as potential
biomarkers. Only the intersection was selected and visualized using
Cytoscape (Fig. 6). The MCODE
results and the miRNA/mRNA network were analyzed and a total of 6
genes were chosen as candidate genes (Table II), consisting of two dDEGs
[hepatocyte growth factor (HGF) and neuropeptide Y receptor
Y1 (NPY1R) and four uDEGs [CD69, serpin family E member 1
(SERPINE1), syndecan 1 (SDC1) and C-X-C motif
chemokine ligand3 (CXCL)3].
Experimental validation
RT-qPCR was performed to verify the expression
levels of the 9 candidate genes in OA and RA synovial tissue. The
expression levels of CTLA4, ZAP70, LCK, PIK3CG, SERPINE1, SDC1,
NPY1R in RA tissue compared with OA tissue were observed to be
consistent with the predictions (Fig.
7). In addition, the experimental validation found that
CTLA4, ZAP70 and LCK expression levels were
significantly increased, whereas HGF expression levels were
significantly decreased in RA synovial tissue compared with OA
synovial tissue (P<0.05; Fig.
7).
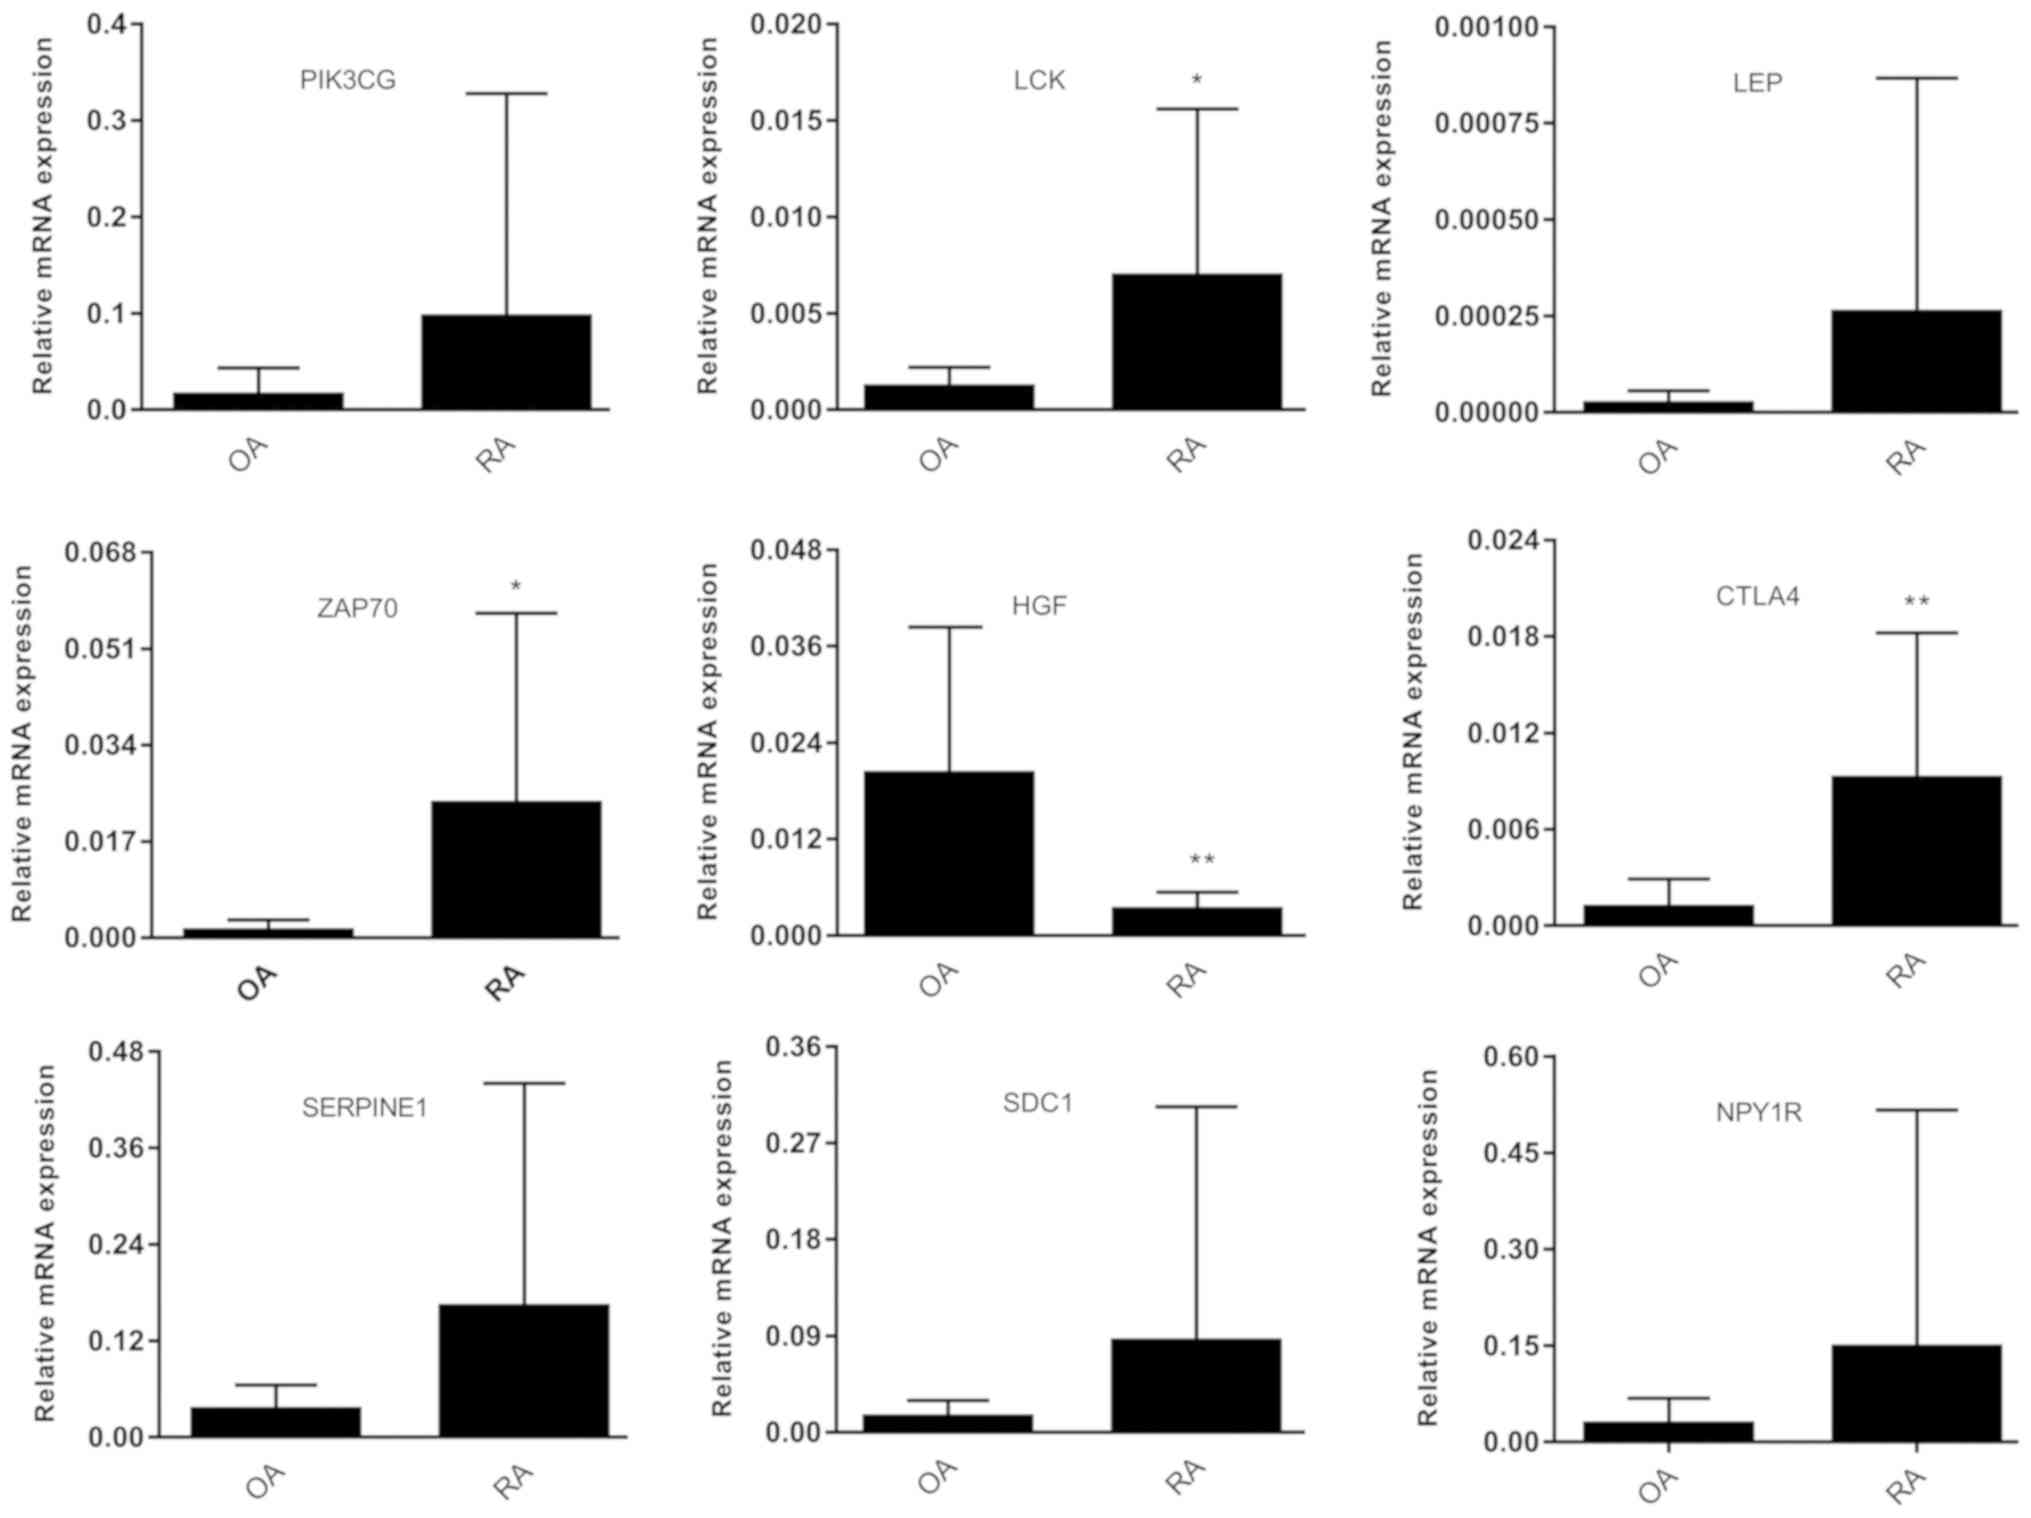 | Figure 7.Reverse transcription-quantitative
PCR results of the expression levels of identified candidate genes
in samples from OA vs. RA. Expression levels of each gene was
normalized to ACTB. *P<0.05, **P<0.01 vs. OA. OA,
osteoarthritis; RA, rheumatoid arthritis. PI3KCG,
phosphatidylinositol-4,5-bisphosphate 3-kinase catalytic sub-unit
γ; LCK, LCK proto-oncogene Src family tyrosine kinase;
ZAP70, ζ chain of T cell receptor-associated protein kinase
70; LEP, leptin; HGF, hepatocyte growth factor;
CTLA4, cytotoxic T-lymphocyte-associated protein 4;
SERPINE1, serpin family E member 1; SDC1, syndecan 1;
NPY1R, neuropeptide Y receptor Y1. |
Discussion
Microarray and bioinformatic analysis is widely used
to investigate the causes and underlying mechanisms of different
types of disease (35), and gene
expression profiling of rheumatoid arthritis (RA) has been
conducted in numerous previous studies. Orange et al
(36) Used RNA-seq of synovial
tissue along with histologic analysis identified three distinct
molecular subtypes of RA that correlated with specific clinical
phenotypes.
In the present study, genome-wide transcriptomic
datasets from the GEO database were used to identify DEGs in
patients with RA or osteoarthritis (OA). Combining the data from
the GSE55457 and GSE55235 dataset revealed that 566 genes were
differentially expressed between OA and RA samples (280 genes were
upregulated and 286 genes were downregulated). In addition, six
miRNAs were found to be downregulated and 17 miRNAs were
upregulated in the GSE72564 dataset.
GO functional term enrichment analysis indicated
that upregulated (u)DEGs were mostly enriched in BP such as ‘Immune
response’, CC such as ‘External side of plasma membrane’ and MF
such as ‘Chemokine receptor activity’, whereas downregulated
(d)DEGs were significantly enriched in ‘cell adhesion’ at the BP
level, ‘Extracellular region’ at CC level and ‘heparin binding’ at
the MF level. These findings are consistent with the previous
studies that reported that immune responses and chemokine activity
were vital processes for RA development and progression (37,38).
KEGG signaling pathway enrichment analysis indicated that uDEGs
were mostly enriched in ‘Cytokine-cytokine receptor interaction’
and ‘Chemokine signaling pathway’. A diverse range of cytokines
have been observed to have important roles in the
pathophysiological processes of RA, such as interleukin (IL)-1,
IL-17 and tumor necrosis factor (TNF)-α (39). In fact, the development of
therapeutic agents, such as rituximab and infliximab, which are
targeted agents against cytokines or their receptors, have
significantly increased the success rate for the treatment of the
disease (40). The dDEGs were
found to be enriched in the ‘PPAR signaling pathway’ and
‘Regulation of lipolysis in adipocytes’. Peroxisome proliferator
activated receptors (PPARs) are transcription factors that belong
to the nuclear receptor family (41) and they have been reported to
inhibit the expression of matrix metalloproteinases (MMP) and the
release of pro-inflammatory cytokines when exposed to IL-1β
(42). Decreased PPAR
activationmay promote FLSs proliferation and expression levels of
c-Myc, Cyclin D1, MMP-1 and MMP-9 (43).
In addition, based on the PPI network constructed of
the DEGs, the top 25 nodes with the highest degree were selected
and pathway interactions of these genes were analyzed using ClueGO;
this revealed that 17 of these genes were involved in the
inflammatory process. Some of these genes identified in the present
study have previously been attributed to the pathogenesis of RA;
for example, 11 of them were chemokines and their receptors,
including C-X-C motif chemokine ligand 1 (CXCL1), CXCL2, CXCL3,
C-X-C motif chemokine receptor 4 (CXCR4), C-C motif chemokine
ligand 5 (CCL5), CXCL8, CXCL9, CXCL10, CXCL11, CXCL13 and CCL20.
Chemokines are divided into four classes depending on the location
of the conserved cysteine in the protein molecule: C-X-C, C-C,
C-X-3-C and X-C (44). Chemokines
and their receptors control hemostasis during recirculation and
promote the recruitment of immune cells during inflammation
(45). Of note, the role of
multiple chemokines and growth factors, such as vascular
endothelial growth factor, in angiogenesis and the inflammatory
response has been reported in RA (46). CXCL8, also known as IL-8, is the
most commonly studied chemokine of the CXC subfamily and the
expression levels of CXCL8 have been closely associated to the
symptoms and disease activity of patients with RA (47). CCL20, also known as liver and
activation-regulated chemokine, is one of the few known chemokine
ligands that only pairs with a sole receptor, CCR6 (45). CCL20 is able to recruit
CCR6+ mononuclear cells to the synovial fluid of
patients with RA and has been found to be significantly neutralized
with the addition of an anti-CCL20 antibody (48). CCL20 has also been reported to
activate osteoblast proliferation and osteoclast differentiation,
which may be maintain bone homeostasis in RA bone destruction
(49). Furthermore, the blockade
of inflammatory cytokines through biological agents, such as
infliximab, inhibited the production of CCL20 (50). CCL5 is found to serve a positive
role in leukocyte recruitment during inflammation (51). In addition, human RAFLS treated
with CCL5 demonstrated significantly increased expression levels of
MMP-1 and MMP-13, which resulted in the degradation of type I
collagenase (52). The CXC
subfamily are the predominant chemotactic cytokines of the
neutrophils; CXCL10 and its receptor CXCR3, have been found to
promote FLS invasion and joint erosion by increasing the expressing
levels of receptor activator of nuclear factor-κ B ligand (RANKL)
in CD4+ T cells in RA (53,54).
Notably, it has been suggested that serum concentrations of CXCL9
and CXCL10 may also serve as sensitive biomarkers for RA (55).
PIK3CG has been demonstrated to serve an important
role in proliferation, apoptosis and adhesion (56). In hTNF-α transgenic mice, reduced
MMP-3 expression levels and invasive properties were observed in
synovial fibroblasts in the absence of PIK3γ (57). In line with this observation, the
pharmacological inhibition of PIK3CG was discovered to effectively
alleviate chronic inflammation in RA (58). Thus, it is thought that the full
therapeutic potential of selective PIK3γ inhibitors remains to be
investigated.
LCK is a member of the Src family of protein
tyrosine kinases (59), which is
only expressed in T cells and natural killer (NK) cells, and is
involved in T cell receptor-mediated T cell proliferation and
differentiation (60). In the
present study, LCK was observed to be significantly over-expressed
in RA synovial tissue and the overexpression of LCK has been found
to contribute to numerous autoimmune diseases, such as inflammatory
bowel diseases and type I diabetes (59). Selective LCK inhibitors have been
developed and have reported potential upon their application in
inflammatory disorders, including RA (60). In addition, previous
bioinformatical analysis indicated that LCK expression was
increased in RA (61), which is
consistent with what was observed in the present study, in which
the aberrant expression of LCK was experimentally validated.
Leptin is one of the most important hormones and
cytokines secreted by adipose tissue and the past decade of
research has proven that leptin controls body weight by inhibiting
food intake (62). As a cytokine,
Leptin modulates inflammatory responses and the immune system by
promoting Th1 cell activation and the production of
pro-inflammatory cytokines, such as IL-6, IL-2 and TNF-α (63,64);
however, the expression levels and role of Leptin in the
pathogenesis of RA remains unclear. Some previous studies have
observed higher expression levels of Leptin in the serum, synovial
fluid and synovial tissue from patients with RA, which suggested
that Leptin expression levels are related to disease activity
(65,66). In contrast, other studies have
reported no change in the expression levels of leptin and no
correlation with disease activity (67), because the individual
characteristics of patients such as age, race and body weight were
inconsistent (66). Thus, further
investigations on Leptin will help determine its mechanism of
action and its potential as a treatment option in RA.
ZAP70, also known as SRK, encodes an enzyme
belonging to the protein tyrosine kinase family. In a previous
study, ZAP70+ B cells were identified as a biomarker of
response to B cell depletion therapy in RA (68) and partial ZAP-70 deficiency was
found to alter the balance between the activation and apoptotic
processes of T cells (69). In the
present study, ZAP70 was found to be significantly enriched in the
NF-κB signaling pathway, which is a widely researched signaling
pathway in RA. Meanwhile, CTLA-4 is a T cell surface glycoprotein,
which helps prevent the development of autoimmune diseases through
the inhibition of T cell activation (70).
The intersected genes in MCODE and target genes of
miRNAs were selected for further experiment. In the present study,
submodules in MCODE analysis were found to be associated with the
‘Chemokine signaling pathway’, ‘Primary immunodeficiency’, ‘Wnt
signaling pathway’, ‘Asthma’ and ‘Proteoglycans in cancer’. HGF,
SERPINE1, SDC1, NPY1R, CTLA4 and CXCL3 were selected as
potential biomarkers. HGF has been discovered to stimulate
hepatocyte proliferation, in addition to promoting proliferation,
angiogenesis, anti-inflammatory and apoptotic processes in cells
other than hepatocytes (71).
SERPINE1 is a member of urokinase plasminogen activating system;
increased expression levels of SERPINE1 have also been related to
invasion and migration in head and neck cancer cells (72). Previous KEGG pathway analysis has
indicated that SERPINE may be related to the HIF-1 signaling
pathway, which alongside its downstream receptors, is activated in
a hypoxic environment during RA (73); however, to the best of our
knowledge, there are currently no studies published on the
differential expression and function of SERPINE1 in the
pathogenesis of RA. SDC1 is expressed in hepatocytes, epithelial
cells and the endothelium, where it interacts with multiple
chemokines and cytokines to regulate differentiation, migration and
proliferation (74). In addition,
SDC is a phenotypic marker and regulator of NKT17; in a previous
study, SDC1 deficiency led to a significant expansion of NKT17
cells, which was detected by the increased expression levels of
IL-17 (75). NPY1 is mediated by
the NPY receptor subtypes 1R-6R (76). NPY accompanied with NPY1 receptor
(NPY1R) and NPY2 receptor (NPY2R) are overexpressed in human OA
cartilage, which results in chondrocyte hypertrophy and cartilage
degradation (77). Increased
expression levels of NPY1R have been found to regulate
proliferation and metastasis in breast cancer (78). In the present study, NPY1R was
discovered to be involved in the ‘regulation of lipolysis in
adipocytes’ pathway.
The present study experimentally validated that
PIK3CG, LCK, ZAP70, HGF, CTLA4, SERPINE1 exhibited
consistent expression trends with the microarray datasets GSE55457
and GSE55235, whereas LEP, SDC-1 and NPY1R were
downregulated, but PCR demonstrated them to be upregulated., which
may be caused by disease activity and ethnic differences. LCK,
ZAP70 and CTLA4 expression levels were observed to be
overexpressed, whereas expression levels of HGF were
significantly decreased in the RA synovium. Conversely, previous
studies have reported significant increases in the expression
levels of serum HGF in patients with RA (79), which is inconsistent with our
findings. Therefore, further research is required to determine the
role of HGF.
To conclude, transcriptome sequencing has been
widely used for research into both cancer and autoimmune diseases.
In the present study, bioinformatics methods were used to analyze
the presence of DEGs in the synovial tissue of patients with RA
compared with OA. The expression levels of LCK, ZAP70 and
CTLA4 were found to be overexpressed, whereas HGF
expression levels were significantly decreased in RA. These genes
and their related signaling pathways may provide diagnostic
biomarkers and future therapeutic targets for RA; however, only
CTLA4, ZAP70, LCK and HGF were validated to be
significantly differentially expressed in the synovial tissue of
patients with RA, which indicated that experimental validation is
necessary following bioinformatics analysis.
Supplementary Material
Supporting Data
Acknowledgements
Not applicable.
Funding
The present study was supported by a grant from the
National Natural Science Foundation of China (grant no.
81772410).
Availability of data and materials
The datasets analyzed during the current study are
available from the GEO database (www.ncbi.nlm.nih.gov/gds/) with the accession nos.
GSE55457, GSE55235 and GSE72564.
Authors' contributions
YA, XT and PX designed the experiments and wrote the
manuscript; JTY collected the data and XYR performed the
experimental validation and statistical analysis. YA wrote the
manuscript All authors read and approved the final version and
agreed to be accountable for all aspects of the work.
Ethics approval and consent to
participate
The present study was approved by the Clinical
Research Ethics Committee of Xi'an Jiaotong University (approval
no. XJTULAC-2018454). Clinical information in this study was
collected after obtaining written informed consent from all
patients.
Patient consent for publication
Not applicable.
Competing interests
The authors declare that they have no competing
interests.
Glossary
Abbreviations
Abbreviations:
|
RA
|
rheumatoid arthritis
|
|
OA
|
osteoarthritis
|
|
DEGs
|
differentially expressed genes
|
|
DEMs
|
differentially expressed microRNAs
|
|
GEO
|
Gene Expression Omnibus
|
|
GO
|
Gene Ontology
|
|
DAVID
|
The Database for Annotation,
Visualization and Integrated Discovery
|
|
PPI
|
protein-protein interaction
|
|
STRING
|
Search Tool for the Retrieval of
Interacting Genes
|
References
|
1
|
Zhang Q, Dehaini D, Zhang Y, Zhou J, Chen
X and Zhang L, Fang RH, Gao W and Zhang L: Neutrophil
membrane-coated nanoparticles inhibit synovial inflammation and
alleviate joint damage in inflammatory arthritis. Nat Nanotechnol.
13:3513–1190. 2018. View Article : Google Scholar
|
|
2
|
Kikuchi H, Shimada W, Nonaka T, Ueshima S
and Tanaka S: Significance of serine proteinase and matrix
metalloproteinase systems in the destruction of human articular
cartilage. Clin Exp Pharmacol Physiol. 23:885–889. 1996. View Article : Google Scholar : PubMed/NCBI
|
|
3
|
Blits M, Jansen G, Assaraf YG, van de Wiel
MA, Lems WF, Nurmohamed MT, van Schaardenburg D, Voskuyl AE,
Wolbink GJ, Vosslamber S and Verweij CL: Methotrexate normalizes
up-regulated folate pathway genes in rheumatoid arthritis.
Arthritis Rheum. 65:2791–2802. 2013. View Article : Google Scholar : PubMed/NCBI
|
|
4
|
Scott DL, Wolfe F and Huizinga TW:
Rheumatoid arthritis. Lancet. 376:1094–1108. 2010. View Article : Google Scholar : PubMed/NCBI
|
|
5
|
Xing R, Yang L, Jin Y, Sun L, Li C, Li Z,
Zhao J and Liu X: Interleukin-21 induces proliferation and
proinflammatory cytokine profile of fibroblast-like synoviocytes of
patients with rheumatoid arthritis. Scand J Immunol. 83:64–71.
2016. View Article : Google Scholar : PubMed/NCBI
|
|
6
|
Zaga-Clavellina V, Parra-Covarrubias A,
Ramirez-Peredo J, Vega-Sanchez R and Vadillo-Ortega F: The
potential role of prolactin as a modulator of the secretion of
proinflammatory mediators in chorioamniotic membranes in term human
gestation. Am J Obstet Gynecol. 211:48.e1–e6. 2014. View Article : Google Scholar
|
|
7
|
Mateen S, Zafar A, Moin S, Khan AQ and
Zubair S: Understanding the role of cytokines in the pathogenesis
of rheumatoid arthritis. Clin Chim Acta. 455:161–171. 2016.
View Article : Google Scholar : PubMed/NCBI
|
|
8
|
Kurowska W, Kuca-Warnawin EH, Radzikowska
A and Maslinski W: The role of anti-citrullinated protein
antibodies (ACPA) in the pathogenesis of rheumatoid arthritis. Cent
Eur J Immunol. 42:390–398. 2017. View Article : Google Scholar : PubMed/NCBI
|
|
9
|
Sokolove J, Bromberg R, Deane KD, Lahey
LJ, Derber LA, Chandra PE, Edison JD, Gilliland WR, Tibshirani RJ,
Norris JM, et al: Autoantibody epitope spreading in the
pre-clinical phase predicts progression to rheumatoid arthritis.
PLoS One. 7:e352962012. View Article : Google Scholar : PubMed/NCBI
|
|
10
|
Zhang W, Zhong B, Zhang C, Luo C and Zhan
Y: miR-373 regulates inflammatory cytokine-mediated chondrocyte
proliferation in osteoarthritis by targeting the P2X7 receptor.
FEBS Open Bio. 8:325–331. 2018. View Article : Google Scholar : PubMed/NCBI
|
|
11
|
Scanzello CR and Goldring SR: The role of
synovitis in osteoarthritis pathogenesis. Bone. 51:249–257. 2012.
View Article : Google Scholar : PubMed/NCBI
|
|
12
|
Trachana V, Ntoumou E, Anastasopoulou L
and Tsezou A: Studying microRNAs in osteoarthritis: Critical
overview of different analytical approaches. Mech Ageing Dev.
171:15–23. 2018. View Article : Google Scholar : PubMed/NCBI
|
|
13
|
Lee YS and Dutta A: MicroRNAs in cancer.
Annu Rev Pathol. 4:199–227. 2009. View Article : Google Scholar : PubMed/NCBI
|
|
14
|
Churov AV, Oleinik EK and Knip M:
MicroRNAs in rheumatoid arthritis: Altered expression and
diagnostic potential. Autoimmun Rev. 14:1029–1037. 2015. View Article : Google Scholar : PubMed/NCBI
|
|
15
|
Evangelatos G, Fragoulis GE, Koulouri V
and Lambrou GI: MicroRNAs in rheumatoid arthritis: From
pathogenesis to clinical impact. Autoimmun Rev. 18:1023912019.
View Article : Google Scholar : PubMed/NCBI
|
|
16
|
Lin J, Huo R, Xiao L, Zhu X, Xie J, Sun S,
He Y, Zhang J, Sun Y, Zhou Z, et al: A novel p53/microRNA-22/Cyr61
axis in synovial cells regulates inflammation in rheumatoid
arthritis. Arthritis Rheumatol. 66:49–59. 2014. View Article : Google Scholar : PubMed/NCBI
|
|
17
|
Dunaeva M, Blom J, Thurlings R and Pruijn
G: Circulating serum miR-223-3p and miR-16-5p as possible
biomarkers of early rheumatoid arthritis. Clin Exp Immunol.
193:376–385. 2018. View Article : Google Scholar : PubMed/NCBI
|
|
18
|
Galligan CL, Baig E, Bykerk V, Keystone EC
and Fish EN: Distinctive gene expression signatures in rheumatoid
arthritis synovial tissue fibroblast cells: Correlates with disease
activity. Genes Immun. 8:480–491. 2007. View Article : Google Scholar : PubMed/NCBI
|
|
19
|
Woetzel D, Huber R, Kupfer P, Pohlers D,
Pfaff M, Driesch D, Häupl T, Koczan D, Stiehl P, Guthke R and Kinne
RW: Identification of rheumatoid arthritis and osteoarthritis
patients by transcriptome-based rule set generation. Arthritis Res
Ther. 16:R842014. View
Article : Google Scholar : PubMed/NCBI
|
|
20
|
Saeed AI, Sharov V, White J, Li J, Liang
W, Bhagabati N, Braisted J, Klapa M, Currier T, Thiagarajan M, et
al: TM4: A free, open-source system for microarray data management
and analysis. Biotechniques. 34:374–378. 2003. View Article : Google Scholar : PubMed/NCBI
|
|
21
|
Oliveros JC: Venny. An interactive tool
for comparing lists with Venn's diagrams, 2007. https://bioinfogp.cnb.csic.es/tools/venny/index.html
|
|
22
|
Szklarczyk D, Gable Al, Lyon D, Junge A,
Wyder S, Huerta-Cepas J, Simonovic M, Doncheva NT, Morris JH, Bork
P, et al: STRING v11: Protein-protein association networks with
increased coverage, supporting functional discovery in genome-wide
experimental datasets. Nucleic Acids Res. 47(D1): D607–D613. 2019.
View Article : Google Scholar : PubMed/NCBI
|
|
23
|
Shannon P, Markiel A, Ozier O, Baliga NS,
Wang JT, Ramage D, Amin N, Schwikowski B and Ideker T: Cytoscape: A
software environment for integrated models of biomolecular
interaction networks. Genome Res. 13:2498–2504. 2003. View Article : Google Scholar : PubMed/NCBI
|
|
24
|
Bindea G, Mlecnik B, Hackl H, Charoentong
P, Tosolini M, Kirilovsky A, Fridman WH, Pagès F, Trajanoski Z and
Galon J: ClueGO: A Cytoscape plug-in to decipher functionally
grouped gene ontology and pathway annotation networks.
Bioinformatics. 25:1091–1093. 2009. View Article : Google Scholar : PubMed/NCBI
|
|
25
|
Bader GD and Hogue CW: An automated method
for finding molecular complexes in large protein interaction
networks. BMC Bioinformatics. 4:22003. View Article : Google Scholar : PubMed/NCBI
|
|
26
|
Li JH, Liu S, Zhou H, Qu LH and Yang JH:
starBase v2.0: Decoding miRNA-ceRNA, miRNA-ncRNA and protein-RNA
interaction networks from large-scale CLIP-Seq data. Nucleic Acids
Res. 42((Database Issue)): D92–D97. 2014. View Article : Google Scholar : PubMed/NCBI
|
|
27
|
Paraskevopoulou MD, Georgakilas G,
Kostoulas N, Vlachos IS, Vergoulis T, Reczko M, Filippidis C,
Dalamagas T and Hatzigeorgiou AG: DIANA-microT web server v5.0:
Service integration into miRNA functional analysis workflows.
Nucleic Acids Res. 41((Web Server Issue)): W169–W173. 2013.
View Article : Google Scholar : PubMed/NCBI
|
|
28
|
Vejnar CE and Zdobnov EM: MiRmap:
Comprehensive prediction of microRNA target repression strength.
Nucleic Acids Res. 40:11673–11683. 2012. View Article : Google Scholar : PubMed/NCBI
|
|
29
|
Loher P and Rigoutsos I: Interactive
exploration of RNA22 microRNA target predictions. Bioinformatics.
28:3322–3323. 2012. View Article : Google Scholar : PubMed/NCBI
|
|
30
|
Krek A, Grün D, Poy MN, Wolf R, Rosenberg
L, Epstein EJ, MacMenamin P, da Piedade I, Gunsalus KC, Stoffel M
and Rajewsky N: Combinatorial microRNA target predictions. Nat
Genet. 37:495–500. 2005. View
Article : Google Scholar : PubMed/NCBI
|
|
31
|
Agarwal V, Bell GW, Nam JW and Bartel DP:
Predicting effective microRNA target sites in mammalian mRNAs.
Elife. 4:2015. View Article : Google Scholar
|
|
32
|
Buckley L, Guyatt G, Fink HA, Cannon M,
Grossman J, Hansen KE, Humphrey MB, Lane NE, Magrey M, Miller M, et
al: 2017 American college of rheumatology guideline for the
prevention and treatment of glucocorticoid-induced osteoporosis.
Arthritis Rheumatol. 69:1521–1537. 2017. View Article : Google Scholar : PubMed/NCBI
|
|
33
|
Livak KJ and Schmittgen TD: Analysis of
relative gene expression data using real-time quantitative PCR and
the 2(-Delta Delta C(T)) method. Methods. 25:402–408. 2001.
View Article : Google Scholar : PubMed/NCBI
|
|
34
|
Elemam NM, Hannawi S and Maghazachi AA:
Role of chemokines and chemokine receptors in rheumatoid arthritis.
Immunotargets Ther. 9:43–56. 2020. View Article : Google Scholar : PubMed/NCBI
|
|
35
|
Wu S, Wu F and Jiang Z: Identification of
hub genes, key miRNAs and potential molecular mechanisms of
colorectal cancer. Oncol Rep. 38:2043–2050. 2017. View Article : Google Scholar : PubMed/NCBI
|
|
36
|
Orange DE, Agius P, DiCarlo EF, Robine N,
Geiger H, Szymonifka J, McNamara M, Cummings R, Andersen KM, Mirza
S, et al: Identification of three rheumatoid arthritis disease
subtypes by machine learning integration of synovial histologic
features and RNA sequencing data. Arthritis Rheumatol. 70:690–701.
2018. View Article : Google Scholar : PubMed/NCBI
|
|
37
|
Wigerblad G, Bas DB, Fernades-Cerqueira C,
Krishnamurthy A, Nandakumar KS, Rogoz K, Kato J, Sandor K, Su J,
Jimenez-Andrade JM, et al: Autoantibodies to citrullinated proteins
induce joint pain independent of inflammation via a
chemokine-dependent mechanism. Ann Rheum Dis. 75:730–738. 2016.
View Article : Google Scholar : PubMed/NCBI
|
|
38
|
Firestein GS and Mcinnes IB:
Immunopathogenesis of rheumatoid arthritis. Immunity. 46:183–196.
2017. View Article : Google Scholar : PubMed/NCBI
|
|
39
|
Kuwabara T, Ishikawa F, Kondo M and
Kakiuchi T: The role of IL-17 and related cytokines in inflammatory
autoimmune diseases. Mediators Inflamm. 2017:39080612017.
View Article : Google Scholar : PubMed/NCBI
|
|
40
|
Siebert S, Tsoukas A, Robertson J and
Mcinnes I: Cytokines as therapeutic targets in rheumatoid arthritis
and other inflammatory diseases. Pharmacol Rev. 67:280–309. 2015.
View Article : Google Scholar : PubMed/NCBI
|
|
41
|
Kwon EJ, Park EJ, Choi S, Kim SR, Cho M
and Kim J: PPARγ agonist rosiglitazone inhibits migration and
invasion by downregulating Cyr61 in rheumatoid arthritis
fibroblast-like synoviocytes. Int J Rheum Dis. 20:1499–1509. 2017.
View Article : Google Scholar : PubMed/NCBI
|
|
42
|
Fahmi H, Pelletier JP, Di Battista JA,
Cheung HS, Fernandes JC and Martel-Pelletier J: Peroxisome
proliferator-activated receptor gamma activators inhibit MMP-1
production in human synovial fibroblasts likely by reducing the
binding of the activator protein 1. Osteoarthr Cartilage.
10:100–108. 2002. View Article : Google Scholar
|
|
43
|
Li XF, Sun YY, Bao J, Chen X, Li YH, Yang
Y, Zhang L, Huang C, Wu BM, Meng XM and Li J: Functional role of
PPAR-γ on the proliferation and migration of fibroblast-like
synoviocytes in rheumatoid arthritis. Sci Rep. 7:126712017.
View Article : Google Scholar : PubMed/NCBI
|
|
44
|
Zhebrun DA, Totolyan AA, Maslyanskii AL,
Titov AG, Patrukhin AP, Kostareva AA and Gol'tseva IS: Synthesis of
some CC chemokines and their receptors in the synovium in
rheumatoid arthritis. Bull Exp Biol Med. 158:192–196. 2014.
View Article : Google Scholar : PubMed/NCBI
|
|
45
|
Lee AY and Körner H: CCR6 and CCL20:
Emerging players in the pathogenesis of rheumatoid arthritis.
Immunol Cell Biol. 92:354–358. 2014. View Article : Google Scholar : PubMed/NCBI
|
|
46
|
Su CM, Hsu CJ, Tsai CH, Huang CY, Wang SW
and Tang CH: Resistin promotes angiogenesis in endothelial
progenitor cells through inhibition of MicroRNA206: Potential
implications for rheumatoid arthritis. Stem Cells. 33:2243–2255.
2015. View Article : Google Scholar : PubMed/NCBI
|
|
47
|
Kraan MC, Patel DD, Haringman JJ, Smith
MD, Weedon H, Ahern MJ, Breedveld FC and Tak PP: The development of
clinical signs of rheumatoid synovial inflammation is associated
with increased synthesis of the chemokine CXCL8 (interleukin-8).
Arthritis Res. 3:65–71. 2001. View
Article : Google Scholar : PubMed/NCBI
|
|
48
|
Tanida S, Yoshitomi H, Nishitani K,
Ishikawa M, Kitaori T, Ito H and Nakamura T: CCL20 produced in the
cytokine network of rheumatoid arthritis recruits CCR6+ mononuclear
cells and enhances the production of IL-6. Cytokine. 47:112–118.
2009. View Article : Google Scholar : PubMed/NCBI
|
|
49
|
Lisignoli G, Piacentini A, Cristino S,
Grassi F, Cavallo C, Cattini L, Tonnarelli B, Manferdini C and
Facchini A: CCL20 chemokine induces both osteoblast proliferation
and osteoclast differentiation: Increased levels of CCL20 are
expressed in subchondral bone tissue of rheumatoid arthritis
patients. J Cell Physiol. 210:798–806. 2007. View Article : Google Scholar : PubMed/NCBI
|
|
50
|
Kawashiri SY, Kawakami A, Iwamoto N,
Fujikawa K, Aramaki T, Tamai M, Arima K, Kamachi M, Yamasaki S,
Nakamura H, et al: Proinflammatory cytokines synergistically
enhance the production of chemokine ligand 20 (CCL20) from
rheumatoid fibroblast-like synovial cells in vitro and serum CCL20
is reduced in vivo by biologic disease-modifying antirheumatic
drugs. J Rheumatol. 36:2397–2402. 2009. View Article : Google Scholar : PubMed/NCBI
|
|
51
|
Luterek-Puszyńska K, Malinowski D,
Paradowska-Gorycka A, Safranow K and Pawlik A: CD28, CTLA-4 and
CCL5 gene polymorphisms in patients with rheumatoid arthritis. Clin
Rheumatol. 36:1129–1135. 2017. View Article : Google Scholar : PubMed/NCBI
|
|
52
|
Agere SA, Akhtar N, Watson JM and Ahmed S:
RANTES/CCL5 induces collagen degradation by activating MMP-1 and
MMP-13 expression in human rheumatoid arthritis synovial
fibroblasts. Front Immunol. 8:13412017. View Article : Google Scholar : PubMed/NCBI
|
|
53
|
Toyoda Y, Tabata S, Kishi J, Kuramoto T,
Mitsuhashi A, Saijo A, Kawano H, Goto H, Aono Y, Hanibuchi M, et
al: Thymidine phosphorylase regulates the expression of CXCL10 in
rheumatoid arthritis fibroblast-like synoviocytes. Arthritis
Rheumatol. 66:560–568. 2014. View Article : Google Scholar : PubMed/NCBI
|
|
54
|
Laragione T, Brenner M, Sherry B and Gulko
PS: CXCL10 and its receptor CXCR3 regulate synovial fibroblast
invasion in rheumatoid arthritis. Arthritis Rheum. 63:3274–3283.
2011. View Article : Google Scholar : PubMed/NCBI
|
|
55
|
Kuan WP, Tam LS, Wong CK, Ko FW, Li T, Zhu
T and Li EK: CXCL 9 and CXCL 10 as Sensitive markers of disease
activity in patients with rheumatoid arthritis. J Rheumatol.
37:257–264. 2010. View Article : Google Scholar : PubMed/NCBI
|
|
56
|
Sasaki T, Irie-Sasaki J, Jones RG,
Oliveira-dos-Santos AJ, Stanford WL, Bolon B, Wakeham A, Itie A,
Bouchard D, Kozieradzki I, et al: Function of PI3Kgamma in
thymocyte development, T cell activation, and neutrophil migration.
Science. 287:1040–1046. 2000. View Article : Google Scholar : PubMed/NCBI
|
|
57
|
Hayer S, Pundt N, Peters MA, Wunrau C,
Kühnel I, Neugebauer K, Strietholt S, Zwerina J, Korb A, Penninger
J, et al: PI3Kgamma regulates cartilage damage in chronic
inflammatory arthritis. FASEB J. 23:4288–4298. 2009. View Article : Google Scholar : PubMed/NCBI
|
|
58
|
Camps M, Rückle T, Ji H, Ardissone V,
Rintelen F, Shaw J, Ferrandi C, Chabert C, Gillieron C, Françon B,
et al: Blockade of PI3Kgamma suppresses joint inflammation and
damage in mouse models of rheumatoid arthritis. Nat Med.
11:936–943. 2005. View
Article : Google Scholar : PubMed/NCBI
|
|
59
|
Kumar Singh P, Kashyap A and Silakari O:
Exploration of the therapeutic aspects of Lck: A kinase target in
inflammatory mediated pathological conditions. Biomed Pharmacother.
108:1565–1571. 2018. View Article : Google Scholar : PubMed/NCBI
|
|
60
|
Farag AK, Elkamhawy A, Londhe AM, Lee KT,
Pae AN and Roh EJ: Novel LCK/FMS inhibitors based on
phenoxypyrimidine scaffold as potential treatment for inflammatory
disorders. Eur J Med Chem. 141:657–675. 2017. View Article : Google Scholar : PubMed/NCBI
|
|
61
|
Xiong Y, Mi BB, Liu MF, Xue H, Wu QP and
Liu GH: Bioinformatics analysis and identification of genes and
molecular pathways involved in synovial inflammation in rheumatoid
arthritis. Med Sci Monitor. 25:2246–2256. 2019. View Article : Google Scholar
|
|
62
|
Procaccini C, Pucino V, Mantzoros CS and
Matarese G: Leptin in autoimmune diseases. Metabolism. 64:92–104.
2015. View Article : Google Scholar : PubMed/NCBI
|
|
63
|
La Cava A: Leptin in inflammation and
autoimmunity. Cytokine. 98:51–58. 2017. View Article : Google Scholar : PubMed/NCBI
|
|
64
|
Batún-Garrido JAJ, Salas-Magaña M,
Juárez-Rojop IE, Hernández-Núñez E and Olán F: Relationship between
leptin concentrations and disease activity in patients with
rheumatoid arthritis. Med Clin (Barc). 150:341–344. 2018.(In
English, Spanish). View Article : Google Scholar : PubMed/NCBI
|
|
65
|
Tian G, Liang JN, Wang ZY and Zhou D:
Emerging role of leptin in rheumatoid arthritis. Clin Exp Immunol.
177:557–570. 2014. View Article : Google Scholar : PubMed/NCBI
|
|
66
|
Toussirot É, Michel F, Binda D and
Dumoulin G: The role of leptin in the pathophysiology of rheumatoid
arthritis. Life Sci. 140:29–36. 2015. View Article : Google Scholar : PubMed/NCBI
|
|
67
|
Toussirot E, Grandclément E, Gaugler B,
Michel F, Wendling D, Saas P and Dumoulin G; CBT-506: Serum
adipokines and adipose tissue distribution in rheumatoid arthritis
and ankylosing spondylitis. A comparative study. Front Immunol.
4:4532013. View Article : Google Scholar : PubMed/NCBI
|
|
68
|
Gremese E, Tolusso B, Fedele AL, Canestri
S, Alivernini S and Ferraccioli G: ZAP-70+ B cell subset influences
response to B cell depletion therapy and early repopulation in
rheumatoid arthritis. J Rheumatol. 39:2276–2285. 2012. View Article : Google Scholar : PubMed/NCBI
|
|
69
|
Kugyelka R, Prenek L, Olasz K, Kohl Z,
Botz B, Glant TT, Berki T and Boldizsár F: ZAP-70 regulates
autoimmune arthritis via alterations in T cell activation and
apoptosis. Cells. 8(pii): E5042019. View Article : Google Scholar : PubMed/NCBI
|
|
70
|
Romo-Tena J, Gómez-Martín D and
Alcocer-Varela J: CTLA-4 and autoimmunity: New insights into the
dual regulator of tolerance. Autoimmun Rev. 12:1171–1176. 2013.
View Article : Google Scholar : PubMed/NCBI
|
|
71
|
Molnarfi N, Benkhoucha M, Funakoshi H,
Nakamura T and Lalive PH: Hepatocyte growth factor: A regulator of
inflammation and autoimmunity. Autoimmun Rev. 14:293–303. 2015.
View Article : Google Scholar : PubMed/NCBI
|
|
72
|
Pavón MA, Arroyo-Solera I, Céspedes MV,
Casanova I, León X and Mangues R: uPA/uPAR and SERPINE1 in head and
neck cancer: Role in tumor resistance, metastasis, prognosis and
therapy. Oncotarget. 7:57351–57366. 2016. View Article : Google Scholar : PubMed/NCBI
|
|
73
|
Deng W, Feng X, Li X, Wang D and Sun L:
Hypoxia-inducible factor 1 in autoimmune diseases. Cell Immunol.
303:7–15. 2016. View Article : Google Scholar : PubMed/NCBI
|
|
74
|
Teng YH, Aquino RS and Park PW: Molecular
functions of syndecan-1 in disease. Matrix Biol. 31:3–16. 2012.
View Article : Google Scholar : PubMed/NCBI
|
|
75
|
Jaiswal AK, Sadasivam M and Hamad ARA:
Unexpected alliance between syndecan-1 and innate-like T cells to
protect host from autoimmune effects of interleukin-17. World J
Diabetes. 9:220–225. 2018. View Article : Google Scholar : PubMed/NCBI
|
|
76
|
Bedoui S, Miyake S, Lin Y, Miyamoto K, Oki
S, Kawamura N, Beck-Sickinger A, von Hörsten S and Yamamura T:
Neuropeptide Y (NPY) suppresses experimental autoimmune
encephalomyelitis: NPY1 receptor-specific inhibition of
autoreactive Th1 responses in vivo. J Immunol. 171:3451–3458. 2003.
View Article : Google Scholar : PubMed/NCBI
|
|
77
|
Kang X, Qian Z, Liu J, Feng D, Li H, Zhang
Z, Jin X, Ma Z, Xu M, Li F, et al: Neuropeptide Y acts directly on
cartilage homeostasis and exacerbates progression of osteoarthritis
through NPY2R. J Bone Miner Res. Feb 26–2020.(Epub ahead of print).
View Article : Google Scholar
|
|
78
|
Liu L, Xu Q, Cheng L, Ma C, Xiao L, Xu D,
Gao Y, Wang J and Song H: NPY1R is a novel peripheral blood marker
predictive of metastasis and prognosis in breast cancer patients.
Oncol Lett. 9:891–896. 2015. View Article : Google Scholar : PubMed/NCBI
|
|
79
|
Kara F, Yildirim A, Gumusdere M, Karatay
S, Yildirim K and Bakan E: Association between hepatocyte growth
factor (HGF) gene polymorphisms and serum HGF levels in patients
with rheumatoid arthritis. Eurasian J Med. 46:176–185. 2014.
View Article : Google Scholar : PubMed/NCBI
|