Introduction
Asthma is a major public health problem affecting
300 million individuals worldwide, and its incidence is increasing
annually (1). In 2013, the
National Pediatric Asthma Collaborative Group conducted an
epidemiological survey on children aged 0–14 years in 27 provinces
and cities across China. It was identified that the prevalence of
asthma among children in urban areas of China was 3.02%, which is
50.6% higher compared with the prevalence in 2000 (2). Asthma is becoming an ‘invisible
killer’ that seriously affects children's health. A total of 72.5%
of asthmatic children have a history of allergic diseases (3). Pollen, house dust mites (HDMs),
animal dander and fungi in the living environment are common
allergens (4). HDMs are the most
common aeroallergen in Asian countries (4). To manage allergic asthma, both
avoidance measures and pharmacological treatments are used
(5). However, due to the
widespread existence of these allergens, it is very difficult to
avoid them completely. In fact, asthma can be considered more as a
syndrome as opposed to a single disease. Childhood asthma is
usually mediated by a type 2 immune response (5). Type 2 immune-mediated (allergic)
asthma is characterized by the presence of serum immunoglobulin E
(IgE) antibodies and/or a positive skin-prick test for allergens
(5). Allergen immunotherapy (AIT)
is the only disease-modifying treatment option for patients with
IgE-mediated inhalant allergies. Although it has been used in
clinical practice for >100 years, most innovations in terms of
AIT efficacy and safety have been developed in the last two
decades. Major recent developments in AIT include subcutaneous
immunotherapy (SCIT) and sublingual immunotherapy (6). SCIT involves the administration of
gradually increasing quantities of an allergen vaccine to an
allergic subject and inducing immunological tolerance to decrease
symptom severity and decrease the need for pharmacotherapeutic
interventions, ultimately improving the quality of life. SCIT is
the only treatment that can change the natural course of allergic
disease (6).
Although SCIT is now commonly used throughout the
world and data for its efficacy are accumulating, certain patients
do not respond to the treatment (7). There is no consensus on candidate
surrogate biomarkers to predict its efficacy, or biomarker
combinations that would be prognostic, predictive and/or surrogate
for the clinical response to SCIT (8). The identification and validation of
specific predictive biomarkers of the SCIT response is currently an
active field of research and could improve the selection process
and clinical management of patients receiving SCIT. Proteomics is a
powerful method for studying new diagnostic and therapeutic
targets. Owing to the rapid development of mass spectrometry (MS),
the consistency of peptide identification and protein sequence
coverage in complex biological samples has been significantly
improved (9). Isobaric labeling
with relative and absolute quantification (iTRAQ) is considered to
be a reliable technique due to its high proteomic coverage and high
labeling efficiency, particularly when information is not available
from two-dimensional electrophoresis, and is widely used in
quantitative proteomics (10). In
the present study, iTRAQ-based proteomics was used to screen
candidate biomarkers for HDM-associated asthma in order to
understand the mechanism of the disease. The purpose of the present
study was to provide a theoretical basis for the early clinical
diagnosis of the disease and make early intervention possible .
The present study compared the serum proteomics of
children with HDM-associated allergic asthma prior and subsequent
to dust mite SCIT, and explored the molecular mechanisms of SCIT in
the treatment of HDM-associated asthma, which could provide a
comprehensive theoretical basis for more effective clinical
treatment options.
Materials and methods
Study population
A total of 60 samples collected from 40 pediatric
patients who met the inclusion criteria for HDM allergy-related
asthma were enrolled. The patients included: A random sample from a
group of 10 patients with HDM-related allergic asthma prior to SCIT
therapy; a group of 10 patients with HDM-related allergic asthma
following SCIT therapy; and a group of 20 patients with HDM-related
allergic asthma before and after receiving SCIT therapy. A total of
30 age- and gender-matched normal children served as the control
group. Patients were enrolled from the biobank of Foshan Maternal
and Children's Hospital Affiliated to Southern Medical University
between July 2016 and January 2019. The key inclusion criteria were
as follows: Patients were diagnosed with mild or moderate allergic
asthma according to the Global Initiative for Asthma (GINA)
guidelines (10); and were between
4–14 years old. All patients were sensitized to HDM
(Dermatophagoides pteronyssinus and Dermatophagoides
farinae) allergens; this was measured by a positive skin prick
test (SPT) and/or serum-specific IgE levels > class 2, and
allergic asthma symptoms triggered by exposure to HDMs. Positivity
to allergens on the SPT was determined when the size of the wheals
caused by an allergen was ≥ the size of the wheals induced by
histamine. A cutoff value of 0.35 kU/l for specific IgE was
regarded as a positive result (class 1, 0.35–0.7 kU/l; class 2,
0.7–3.5 IU/l; class 3, 3.5–17.5 IU/l; class 4, 17.5–50 IU/l; class
5, 50–100 IU/l; and class 6, >100 IU/l). Patients were excluded
if they had: i) Severe or uncontrolled asthma; ii) a specific IgE
level of <0.7 IU/l for any other allergic reasons, including
cat/dog dander, Artemisia pollen and fungi; iii) a history of
congenital cardiopulmonary diseases, malignant tumors,
bronchiectasis, chronic rhinosinusitis or psychological or
neurological diseases that may affect the outcome assessments; iv)
received intercurrent treatment with β-blockers or
angiotensin-converting enzyme inhibitors.
Among these patients, 30 children were first
diagnosed with HDM-related allergic asthma without immunotherapy
treatment, labeled as the -Treatment group, and 30 children
exhibited well-controlled HDM-related allergic asthma after 3 years
of SCIT treatment, and were labeled as the +Treatment group. Those
patients that received the SCIT treatment also received control
therapy such as inhalant corticosteroids, inhalant long-acting β2
agonists, or antileukotrienes according to the GINA guidelines
throughout the SCIT course. Asthma syndrome score (ASS), total
medicine score (TMS), serum total (t)IgE, HDM specific (s)IgE,
eosinophil count, the SPT and lung function were measured and
recorded for each individual. TMS, total medicine score, ranging
from 0 to 6 points, was assessed according to the total medicine
intake on a 4-point scale: 0, not taking medication; 1, taking
antihistamines or inhalant β2 agonists; 2, taking topical
corticosteroids; and 3, taking oral corticosteroids.; ASS, asthma
syndrome score was calculated as the total score of the four asthma
symptoms and ranged from 0 to 12 points.
This study was approved by the Ethics Committee of
Foshan Maternal and Children Hospital Affiliated to Southern
Medical University(policy no. FSFY-MEC-2019-013). Written informed
consent was obtained from the guardians of each participant.
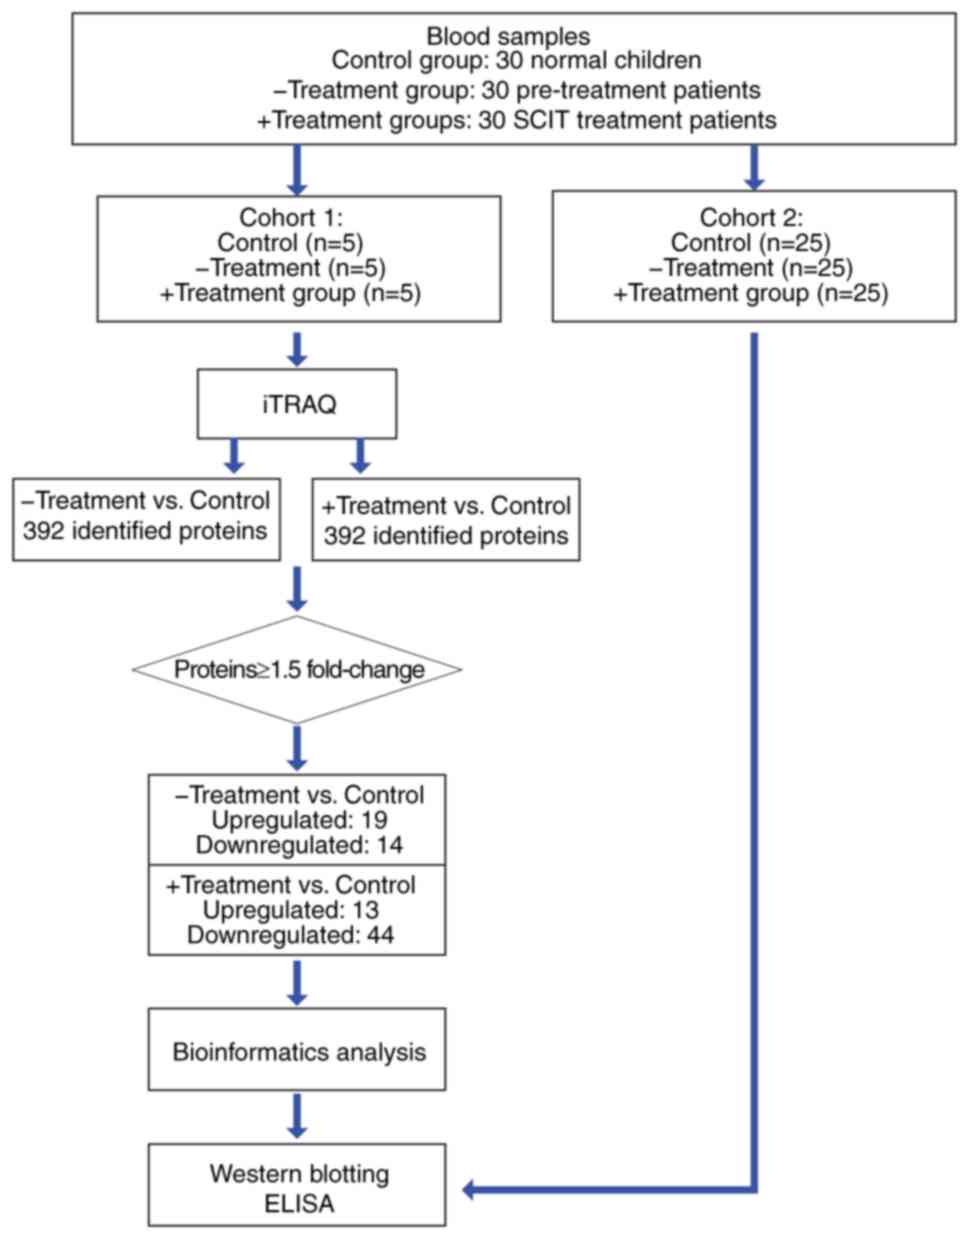
Preparation of serum samples
Serum samples were processed to remove albumin and
immunoglobulin G (IgG) using a ProteoPrep® Blue Albumin
& IgG Depletion kit (Sigma-Aldrich; Merck KGaA). The protein
concentration of each was determined using a Bradford protein assay
kit (Bio-Rad Laboratories, Inc.). Serum samples were then randomly
assembled into two cohorts, the two cohorts were divided into three
groups (control, -Treatment and +Treatment). Each group contained
five samples in the first cohort and each group contained 25
samples in the second cohort. The first cohort was subsequently
analyzed using iTRAQ® Reagent (SCIEX), and the second
was analyzed by western blot analysis (Fig. 1).
Protein identification and
analysis
ITRAQ tags were based on the manufacturer's
protocols (SCIEX). Each protein sample was reduced by 100 µg with
Tris (2-carboxyethyl) phosphine hydrochloride reductant (SCIEX) at
60°C for 1 h and alkylated with methyl methanethiosulfonate
cysteine blocker (SCIEX) at room temperature for 30 min. Then, the
protein was digested overnight by 2% trypsin (Promega Corporation)
at 37°C at a ratio of 1:50 (enzymes: Substrates). Each sample was
labeled with iTRAQ labels and then centrifuged in a vacuum
centrifuge at a speed of 6,000 × g for 4 h at a temperature of
25°C.
ITRAQ-labeled samples were first diluted to 100 µl
with a H2O buffer (NH3 + H2O, pH 10.0) prior
to high-performance liquid chromatography on a LC-20AD pump
(Shimadzu Corporation) at 25°C on a Gemini® 3 µm NX-C18
110 A, 150 × 2.00 mm Phenomenex column (from Phenomenex). The flow
rate used for reversed-phase column separation was 0.2 ml/min with
H2O (mobile phase A) and 80% acetonitrile (mobile phase
B) with the following gradient system parameters: 5–10% B for 0–10
min; 10–40% B for 10–60 min; 40–95% B for 60–65 min; and 95% B for
65–75 min. Elution was monitored by absorbance at 214/280 nm, and
the fractions were collected every 50 sec; fractions were pooled
for each sample and dehydrated by centrifugation at 6,000 × g for 4
h at 25°C in vacuum centrifugation. Peptides were separated with
mobile phase A (0.1% formic acid) and 5–40% mobile phase B (0.1%
formic acid and 80% acetonitrile) for 99 min (0.3 ml/min flow
rate). MS analysis was performed on a Q Exactive™ Hybrid
Quadrupole-Orbitrap™ Mass Spectrometer (Thermo Fisher Scientific,
Inc.) with the following parameters: MS spectra were acquired
across the scan range of 350–1,800 m/z in high-resolution mode
(>35,000), and 100 msec was accumulated per spectrum. A maximum
of 20 precursors per cycle were selected for fragmentation, with
120 msec set as the minimum accumulation time for each precursor
and 10 sec for dynamic exclusion. A search for raw MS data was
conducted against the human protein database using ProteinPilot™
Software 4.5 (SCIEX). The search parameters were set as ‘cys
alkylation’ and ‘methyl methanethiosulfonate’, additionally
‘digestion’ and ‘trypsin’ were allowed; the false discovery rate
was set to <0.01.
Western blot analysis
Proteins from the 25 samples of each group in cohort
two were stored overnight with 4 times the volume acetone to obtain
precipitate protein. The precipitate protein was then lysed in
lysis buffer (Beyotime Institute of Biotechnology), and protein
concentrations were measured using a Bradford protein assay kit
(Bio-Rad Laboratories, Inc.). Following electrophoresis with 25 µg
protein/lane via 10–15% SDS-PAGE, the separated proteins were
transferred onto PVDF membranes (Sigma-Aldrich; Merck KGaA) and
blocked with 5% skimmed milk for 2 h at room temperature. They were
then incubated with primary antibodies (1:1,000; all purchased from
Abcam) against keratin (KRT)1 (cat. no. ab93652), apolipoprotein
(APO)B (cat. no. ab27626), fibronectin 1 (FN1; cat. no. ab2413),
antithrombin III (SERPINC1; cat. no. ab126598), α-1-antitrypsin
(SERPINA1; cat. no. ab207303) and GAPDH (cat. no. ab9485) overnight
at 4°C. Subsequently, horseradish peroxidase-conjugated goat
anti-rabbit IgG (1:2,000; cat. no. ab6721; Abcam) was applied to
the primary antibody-treated PVDF membranes at room temperature for
2 h. The specific bands on these membranes were visualized using
the SuperSignal™ chemiluminescent HRP substrates (Thermo Fisher
Scientific, Inc.). Band intensities were quantitated using ImageJ
software (version 2.0; National Institutes of Health).
ELISA
Serum concentrations of keratin 1 (KRT1; cat. no.
KTE61888; Abbkine Scientific Co., Ltd.), apolipoprotein B (APOB;
cat. no. KA1028; Abnova), fibronectin 1 (FN1; cat. no. KA3039;
Abnova), antithrombin III (SERPINC1; cat. no. KA5093; Abnova) and
α-1-antitrypsin (SERPINA1; cat. no. KA0459; Abnova) of the 25
samples in each group were determined according to the
manufacturers' protocols from the ELISA kits. Absorbance was
measured at 450 nm using an ELISA reader. All samples were analyzed
in triplicate, and the average concentration for each patient was
calculated
Functional distribution analysis of
differentially expressed proteins
Clustering of differentially expressed protein
families and subfamilies was identified using the Protein analysis
through evolutionary relationships (PANTHER) database (11–13),
and analysis of functional Gene Ontology (GO) terms was performed
with the online tool Metascape (http://metascape.org) (14). The enrichment-analyzed terms
included ‘biological processes’, ‘cellular components’ and
‘molecular functions’. In addition, a Kyoto Encyclopedia of Genes
and Genomes (KEGG) pathways enrichment analysis was conducted
(15–17). All genes in the genome were used as
the enrichment background. Associations between proteins were also
identified by using the protein-protein interaction (PPI) network
generated from the Metascape database and visualized in Cytoscape
(version 3.7.1) (18). A molecular
complex detection (MCODE) algorithm was used by the Metascape tool
to identify a densely connected network of protein-protein
interactions.
Search Tool for the Retrieval of
Interacting Genes/Proteins (STRING) PPI analysis
An association network of the identified proteins
was established using the STRING database version 11 (19) (https://string-db.org) with the highest confidence
interaction score (0.9). In addition, candidate proteins were
selected according to their total PPI connection degrees, which is
a rough representation of the importance of the network. These
proteins may be the core proteins or key candidate genes that have
significant physiological regulatory functions.
Statistical analysis
Data were analyzed using SPSS statistical software
for Windows (version 19.0; IBM Corp.), and experimental
non-parametric and parametric data were presented as median
(interquartile range) or mean ± standard deviation. Descriptive
parameters were presented in Table
I. Shapiro-Wilk normality test and Levene homogeneity test were
used to assess the normal distribution and variance homogeneity of
data. χ2 test was used for the comparison of categorical
data (sex) in Table I (data not
shown). Mann-Whitney U test (for two-group comparison of the skin
prick test, FEV1, forced vital capacity, ASS and TMS values) or
Kruskal-Wallis test followed by Dunn-Bonferroni post hoc method
(for multi-group comparison of the age, EO, total IgE and specific
IgE values) were applied to evaluate non-parametric values in
Table I. The differences in
protein expression levels of multiple groups (control group,
-Treatment group and +Treatment groups) were analyzed using
analysis of variance or Welch test, based on the results of the
Levene test. Dunnett's test or Dunnett's T3 test was performed for
post-hoc pairwise comparisons (control vs. -Treatment or control
vs. +Treatment). For western blotting and ELISA validation, each
group contained 25 samples, and each sample was repeated three
times to obtain the mean value. P<0.05 was considered to
indicate a statistically significant difference.
 | Table I.Characteristics values of the
subjects in patients with HDM-related asthma and normal
children. |
Table I.
Characteristics values of the
subjects in patients with HDM-related asthma and normal
children.
|
|
|
|
| P-value |
|---|
|
|
|
|
|
|
|---|
|
Characteristics | -Treatment
(n=30) | +Treatment
(n=30) | Normal control
(n=30) | -Treatment vs.
+Treatment | -Treatment vs.
Normal control | +Treatment vs.
Normal control |
|---|
| Sex, male/female,
n | 16/14 | 15/15 | 15/15 | NA | NA | NA |
| Age, median (IQR)
years | 6 (5–9) | 72 (5–12) | 6 (5–9) | 0.051 | 1.00 | 0.221 |
| Laboratory values,
median (IQR) |
|
|
|
|
|
|
| EO,
109/l | 0.65 | 0.33 | 0.21 | 1.00 | 0.001 | 0.001 |
|
| (0.11–0.91) | (0.10–0.47) | (0.10–0.36) |
|
|
|
| Total
IgE, IU/ml | 852.20 | 910.00 | 18.00 | 1.00 | <0.001 | <0.001 |
|
|
(412.80–1,513.00) |
(312.00–1,456.00) | (10.00–41.91) |
|
|
|
|
Specific IgE of | 85.00 | 70.00 | 0 | 1.00 | <0.001 | <0.001 |
| HDM,
IU/ml | (35.00–200) | (35.00–145) |
|
|
|
|
| Skin
prick test of | 8.60 | 6.40 | NA | <0.001 | NA | NA |
| HDM,
cm | (6.20–10.10) | (5.00–8.00) |
|
|
|
|
| Forced
expiratory | 1.50 | 2.22 | NA | <0.001 | NA | NA |
| volume
in 1 sec, l | (1.30–1.75) | (1.82–2.50) |
|
|
|
|
| Forced
vital | 2.30 | 2.85 | NA | <0.001 | NA | NA |
|
capacity, l | (1.90–2.68) | (2.43–3.20) |
|
|
|
|
|
ASS | 10.00 | 1.00 | NA | <0.001 | NA | NA |
|
| (7.00–12.00) | (0.00–3.00) |
|
|
|
|
|
TMS | 3.0 (1.00–3.0) | 0 (0–0) | NA | <0.001 | NA | NA |
Results
Characteristics of subjects
The clinical characteristics and demographic
profiles of the patients with HDM-induced asthma and normal
children are summarized in Table
I. All subjects in each group were gender- and age-matched.
Following SCIT treatment, the patients with allergies exhibited a
significant decrease in their symptoms, as measured by the ASS,
which decreased from a score of 10.00 prior to treatment to 1.00
following treatment. Similarly, the use of medication significantly
decreased the symptoms, as measured by TMS, which decreased from a
score of 3.00 prior to treatment to 0.00 following SCIT treatment.
The eosinophil counts were also significantly decreased by SCIT
treatment. The levels of tIgE and sIgE were slightly, but not
significantly, decreased from the beginning of treatment to 3 years
after SCIT. Lung function parameters [forced expiratory volume in
one second (FEV1%) and forced vital capacity]
demonstrated significant improvements following SCIT treatment.
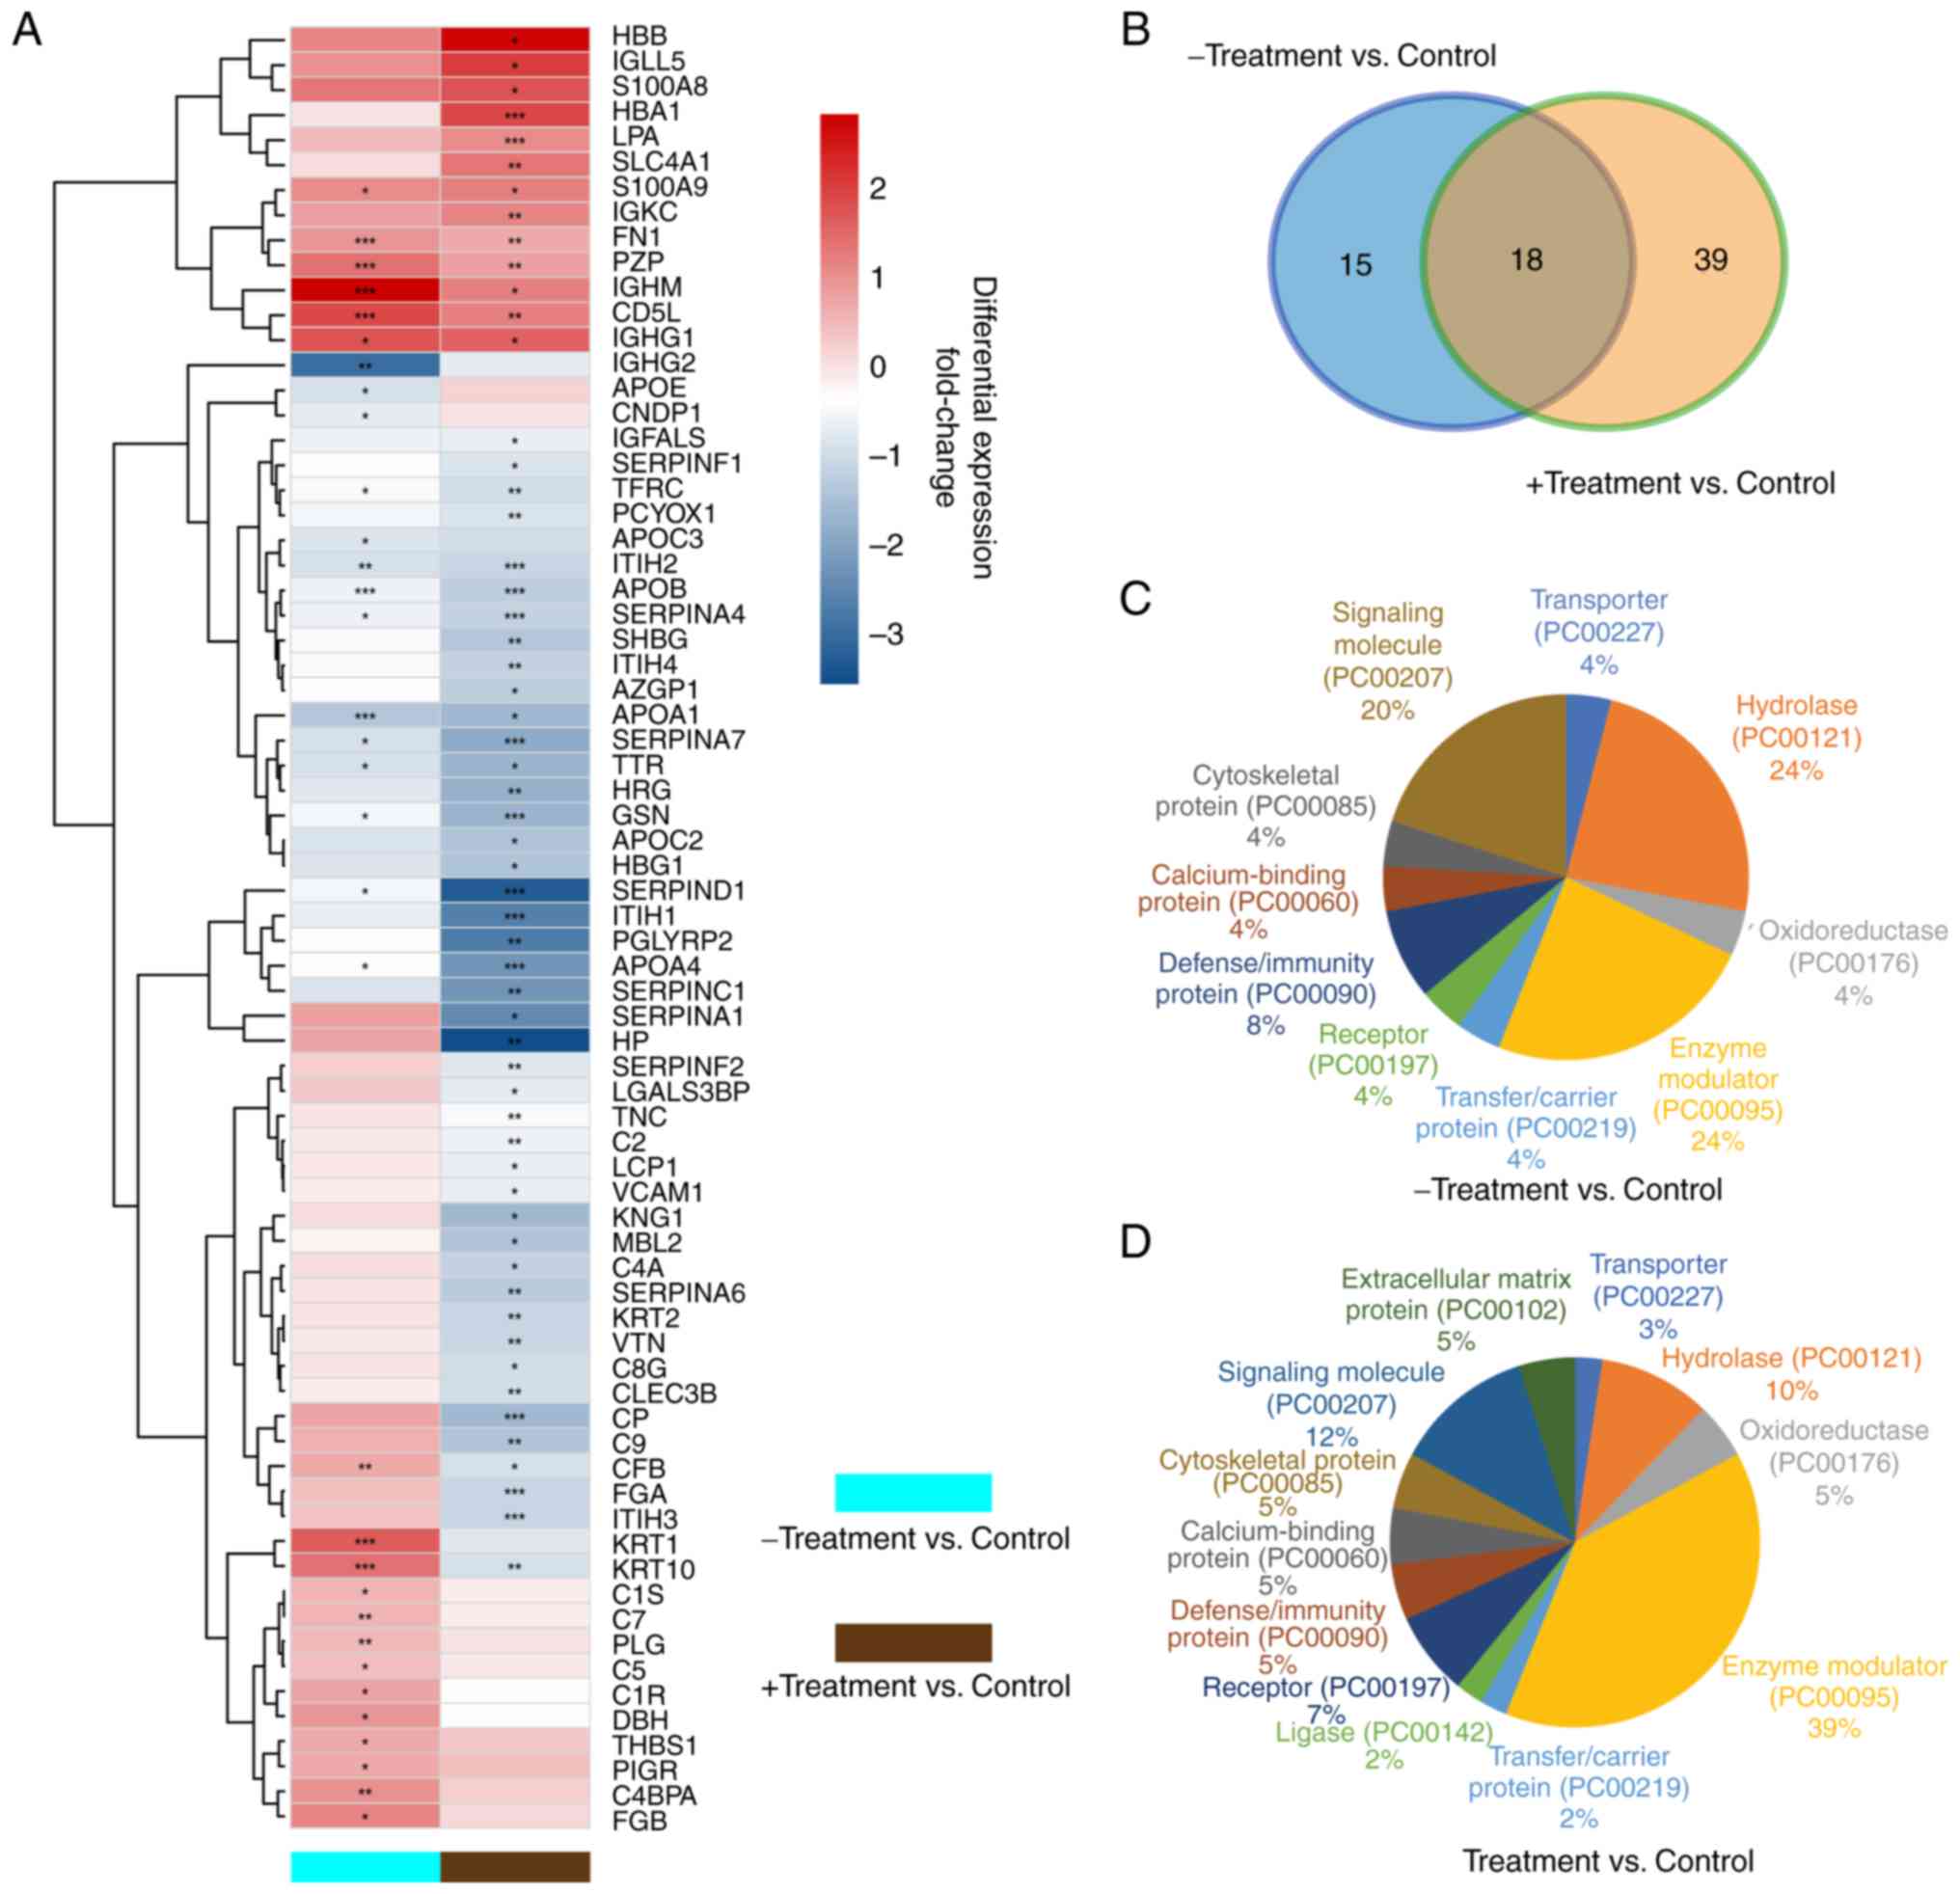
Identification of differentially
expressed proteins
Through iTRAQ technology, a total of 72
differentially expressed proteins were identified between the
healthy children and -Treatment or +Treatment patients (defined as
fold change ratio >1.5 in control group vs. at least one in
either the -Treatment or +Treatment groups), and the normalized
fold change levels of these proteins are shown in a heatmap
(Fig. 2A). A total of 33 (19
upregulated and 14 downregulated) and 57 (13 upregulated and 44
downregulated) significantly differently expressed proteins were
identified in the -Treatment and +Treatment groups, respectively,
compared with those in the control group (Tables II and III). A total of 18 overlapping
differentially expressed proteins were identified in both groups,
while 15 proteins were identified only in the -Treatment group and
39 proteins only in the +Treatment group (Fig. 2B).
| Table II.Differentially expressed proteins
identified between -Treatment samples and control samples using
isobaric tags for relative and absolute quantitation
technology. |
Table II.
Differentially expressed proteins
identified between -Treatment samples and control samples using
isobaric tags for relative and absolute quantitation
technology.
| Number | Accession
number | Gene name | Peptides average
coverage rate, % | Fold change | P-value |
|---|
| 1 | P01871 | IGHM | 87.86 | 7.31 |
1.09×10⁻⁴ |
| 2 | O43866 | CD5L | 80.4 | 3.84 |
4.89×10⁻⁶ |
| 3 | P01857 | IGHG1 | 88.79 | 3.37 |
3.03×10⁻² |
| 4 | P04264 | KRT1 | 51.09 | 3.10 |
3.41×10⁻⁷ |
| 5 | P13645 | KRT10 | 51.88 | 2.58 |
3.22×10⁻⁴ |
| 6 | P20742 | PZP | 49.66 | 2.56 |
4.60×10⁻⁵ |
| 7 | P02675 | FGB | 29.33 | 2.19 |
3.56×10⁻² |
| 8 | P06702 | S100A9 | 90.35 | 2.05 |
4.54×10⁻² |
| 9 | P04003 | C4BPA | 63.32 | 2.01 |
8.82×10⁻³ |
| 10 | P02751 | FN1 | 57.04 | 1.89 |
1.31×10⁻⁴ |
| 11 | P09172 | DBH | 37.76 | 1.89 |
2.24×10⁻² |
| 12 | P00736 | C1R | 64.96 | 1.63 |
4.41×10⁻² |
| 13 | P00751 | CFB | 68.19 | 1.61 |
7.29×10⁻³ |
| 14 | P07996 | THBS1 | 48.55 | 1.57 |
1.94×10⁻² |
| 15 | P01833 | PIGR | 34.03 | 1.57 |
2.42×10⁻² |
| 16 | P00747 | PLG | 81.36 | 1.56 |
9.69×10⁻³ |
| 17 | P10643 | C7 | 53.5 | 1.53 |
7.44×10⁻³ |
| 18 | P01031 | C5 | 52.21 | 1.52 |
1.58×10⁻² |
| 19 | P09871 | C1S | 67.3 | 1.54 |
4.36×10⁻² |
| 20 | P06727 | APOA4 | 89.39 | 0.62 |
4.01×10⁻² |
| 21 | P06396 | GSN | 70.84 | 0.66 |
2.81×10⁻² |
| 22 | P05546 | SERPIND1 | 70.34 | 0.66 |
1.03×10⁻² |
| 23 | P04114 | APOB | 82.05 | 0.64 |
1.82×10⁻⁶ |
| 24 | P29622 | SERPINA4 | 58.08 | 0.63 |
2.24×10⁻² |
| 25 | P02786 | TFRC | 40.79 | 0.60 |
4.47×10⁻² |
| 26 | Q96KN2 | CNDP1 | 50.69 | 0.57 |
3.58×10⁻² |
| 27 | P02656 | APOC3 | 79.8 | 0.53 |
3.64×10⁻² |
| 28 | P05543 | SERPINA7 | 64.34 | 0.52 |
1.96×10⁻² |
| 29 | P19823 | ITIH2 | 60.68 | 0.51 |
6.49×10⁻³ |
| 30 | P02649 | APOE | 89.59 | 0.51 |
1.73×10⁻² |
| 31 | P02766 | TTR | 86.39 | 0.50 |
1.31×10⁻² |
| 32 | P02647 | APOA1 | 94.01 | 0.37 |
2.13×10⁻⁵ |
| 33 | P01859 | IGHG2 | 85.58 | 0.12 |
6.22×10⁻³ |
| Table III.Differentially expressed proteins
identified between +Treatment samples and control samples using
isobaric tags for relative and absolute quantitation
technology. |
Table III.
Differentially expressed proteins
identified between +Treatment samples and control samples using
isobaric tags for relative and absolute quantitation
technology.
| Number | Accession
number | Gene name | Peptides average
coverage rate, % | Fold change | P-value |
|---|
| 1 | P68871 | HBB | 99.32 | 6.73 |
1.02×10⁻² |
| 2 | B9A064 | IGLL5 | 63.08 | 4.06 |
3.94×10⁻² |
| 3 | P69905 | HBA1 | 80.99 | 3.80 |
7.55×10⁻⁵ |
| 4 | P05109 | S100A8 | 65.59 | 3.44 |
1.29×10⁻² |
| 5 | P01857 | IGHG1 | 88.79 | 2.99 |
2.51×10⁻² |
| 6 | P02730 | SLC4A1 | 28.98 | 2.54 |
6.58×10⁻³ |
| 7 | P06702 | S100A9 | 90.35 | 2.33 |
1.44×10⁻² |
| 8 | O43866 | CD5L | 80.40 | 2.31 |
3.38×10⁻³ |
| 9 | P01871 | IGHM | 87.86 | 2.25 |
3.20×10⁻² |
| 10 | P01834 | IGKC | 98.13 | 2.15 |
3.76×10⁻³ |
| 11 | P08519 | LPA | 45.32 | 2.13 |
2.07×10⁻⁴ |
| 12 | P20742 | PZP | 49.66 | 1.75 |
9.19×10⁻³ |
| 13 | P02751 | FN1 | 57.04 | 1.57 |
9.39×10⁻³ |
| 14 | P06681 | C2 | 58.38 | 0.63 |
6.54×10⁻³ |
| 15 | P35858 | IGFALS | 55.54 | 0.61 |
2.13×10⁻² |
| 16 | P19320 | VCAM1 | 31.12 | 0.61 |
4.17×10⁻² |
| 17 | P13796 | LCP1 | 48.64 | 0.60 |
3.29×10⁻² |
| 18 | P24821 | TNC | 16.45 | 0.59 |
1.69×10⁻³ |
| 19 | Q08380 | LGALS3BP | 47.01 | 0.59 |
3.36×10⁻² |
| 20 | P08697 | SERPINF2 | 67.01 | 0.55 |
8.73×10⁻³ |
| 21 | P36955 | SERPINF1 | 70.57 | 0.54 |
1.02×10⁻² |
| 22 | Q9UHG3 | PCYOX1 | 41.19 | 0.52 |
7.92×10⁻³ |
| 23 | P00751 | CFB | 68.19 | 0.52 |
1.90×10⁻² |
| 24 | P13645 | KRT10 | 51.88 | 0.50 |
8.22×10⁻³ |
| 25 | P07360 | C8G | 76.24 | 0.49 |
1.49×10⁻² |
| 26 | P05452 | CLEC3B | 71.29 | 0.49 |
6.74×10⁻³ |
| 27 | P02786 | TFRC | 40.79 | 0.48 |
1.53×10⁻³ |
| 28 | P35908 | KRT2 | 49.92 | 0.45 |
4.68×10⁻³ |
| 29 | Q06033 | ITIH3 | 60.67 | 0.44 |
6.01×10⁻⁴ |
| 30 | P04004 | VTN | 46.86 | 0.44 |
8.08×10⁻³ |
| 31 | P19823 | ITIH2 | 60.68 | 0.43 |
4.55×10⁻⁴ |
| 32 | P02671 | FGA | 50.58 | 0.43 |
2.76×10⁻⁵ |
| 33 | P29622 | SERPINA4 | 58.08 | 0.43 |
8.52×10⁻⁴ |
| 34 | Q14624 | ITIH4 | 78.17 | 0.42 |
1.22×10⁻³ |
| 35 | P0C0L4 | C4A | 84.52 | 0.42 |
2.49×10⁻² |
| 36 | P25311 | AZGP1 | 74.50 | 0.41 |
3.44×10⁻² |
| 37 | P04114 | APOB | 82.05 | 0.39 |
1.15×10⁻¹² |
| 38 | P08185 | SERPINA6 | 58.52 | 0.39 |
1.02×10⁻³ |
| 39 | P04278 | SHBG | 53.73 | 0.37 |
1.52×10⁻³ |
| 40 | P02748 | C9 | 52.77 | 0.36 |
7.84×10⁻³ |
| 41 | P69891 | HBG1 | 80.27 | 0.36 |
1.24×10⁻¹ |
| 42 | P11226 | MBL2 | 52.42 | 0.35 |
1.18×10⁻² |
| 43 | P02655 | APOC2 | 82.18 | 0.35 |
2.85×10⁻² |
| 44 | P02647 | APOA1 | 94.01 | 0.31 |
1.84×10⁻² |
| 45 | P01042 | KNG1 | 68.79 | 0.31 |
2.96×10⁻² |
| 46 | P00450 | CP | 84.41 | 0.30 |
9.02×10⁻⁵ |
| 47 | P06396 | GSN | 70.84 | 0.30 |
1.49×10⁻⁷ |
| 48 | P02766 | TTR | 86.39 | 0.29 |
4.14×10⁻² |
| 49 | P04196 | HRG | 63.43 | 0.28 |
5.48×10⁻³ |
| 50 | P05543 | SERPINA7 | 64.34 | 0.25 |
2.47×10⁻⁴ |
| 51 | P06727 | APOA4 | 89.39 | 0.20 |
1.45×10⁻⁷ |
| 52 | P01008 | SERPINC1 | 74.35 | 0.19 |
1.14×10⁻³ |
| 53 | P01009 | SERPINA1 | 93.54 | 0.17 |
1.75×10⁻² |
| 54 | P19827 | ITIH1 | 63.67 | 0.15 |
4.77×10⁻⁴ |
| 55 | Q96PD5 | PGLYRP2 | 63.89 | 0.14 |
1.41×10⁻³ |
| 56 | P05546 | SERPIND1 | 70.34 | 0.09 |
1.24×10⁻⁶ |
| 57 | P00738 | HP | 92.61 | 0.08 |
3.00×10⁻³ |
Functional analysis of differentially
expressed proteins
The differentially expressed proteins were
characterized based on their functions. The protein class pie chart
of the -Treatment vs. control group (Fig. 2C) demonstrates a high percentage of
hydrolase, enzyme modulator and signaling molecule class proteins.
In the +Treatment group (Fig. 2D),
the percentages of hydrolase and signaling molecule class proteins
were decreased, while the percentage of enzyme modulator class
proteins was increased. These differences in protein class between
the -Treatment and +Treatment groups suggested that enzyme
modulator proteins potentially serve a major role in the treatment
process and should be investigated in greater detail.
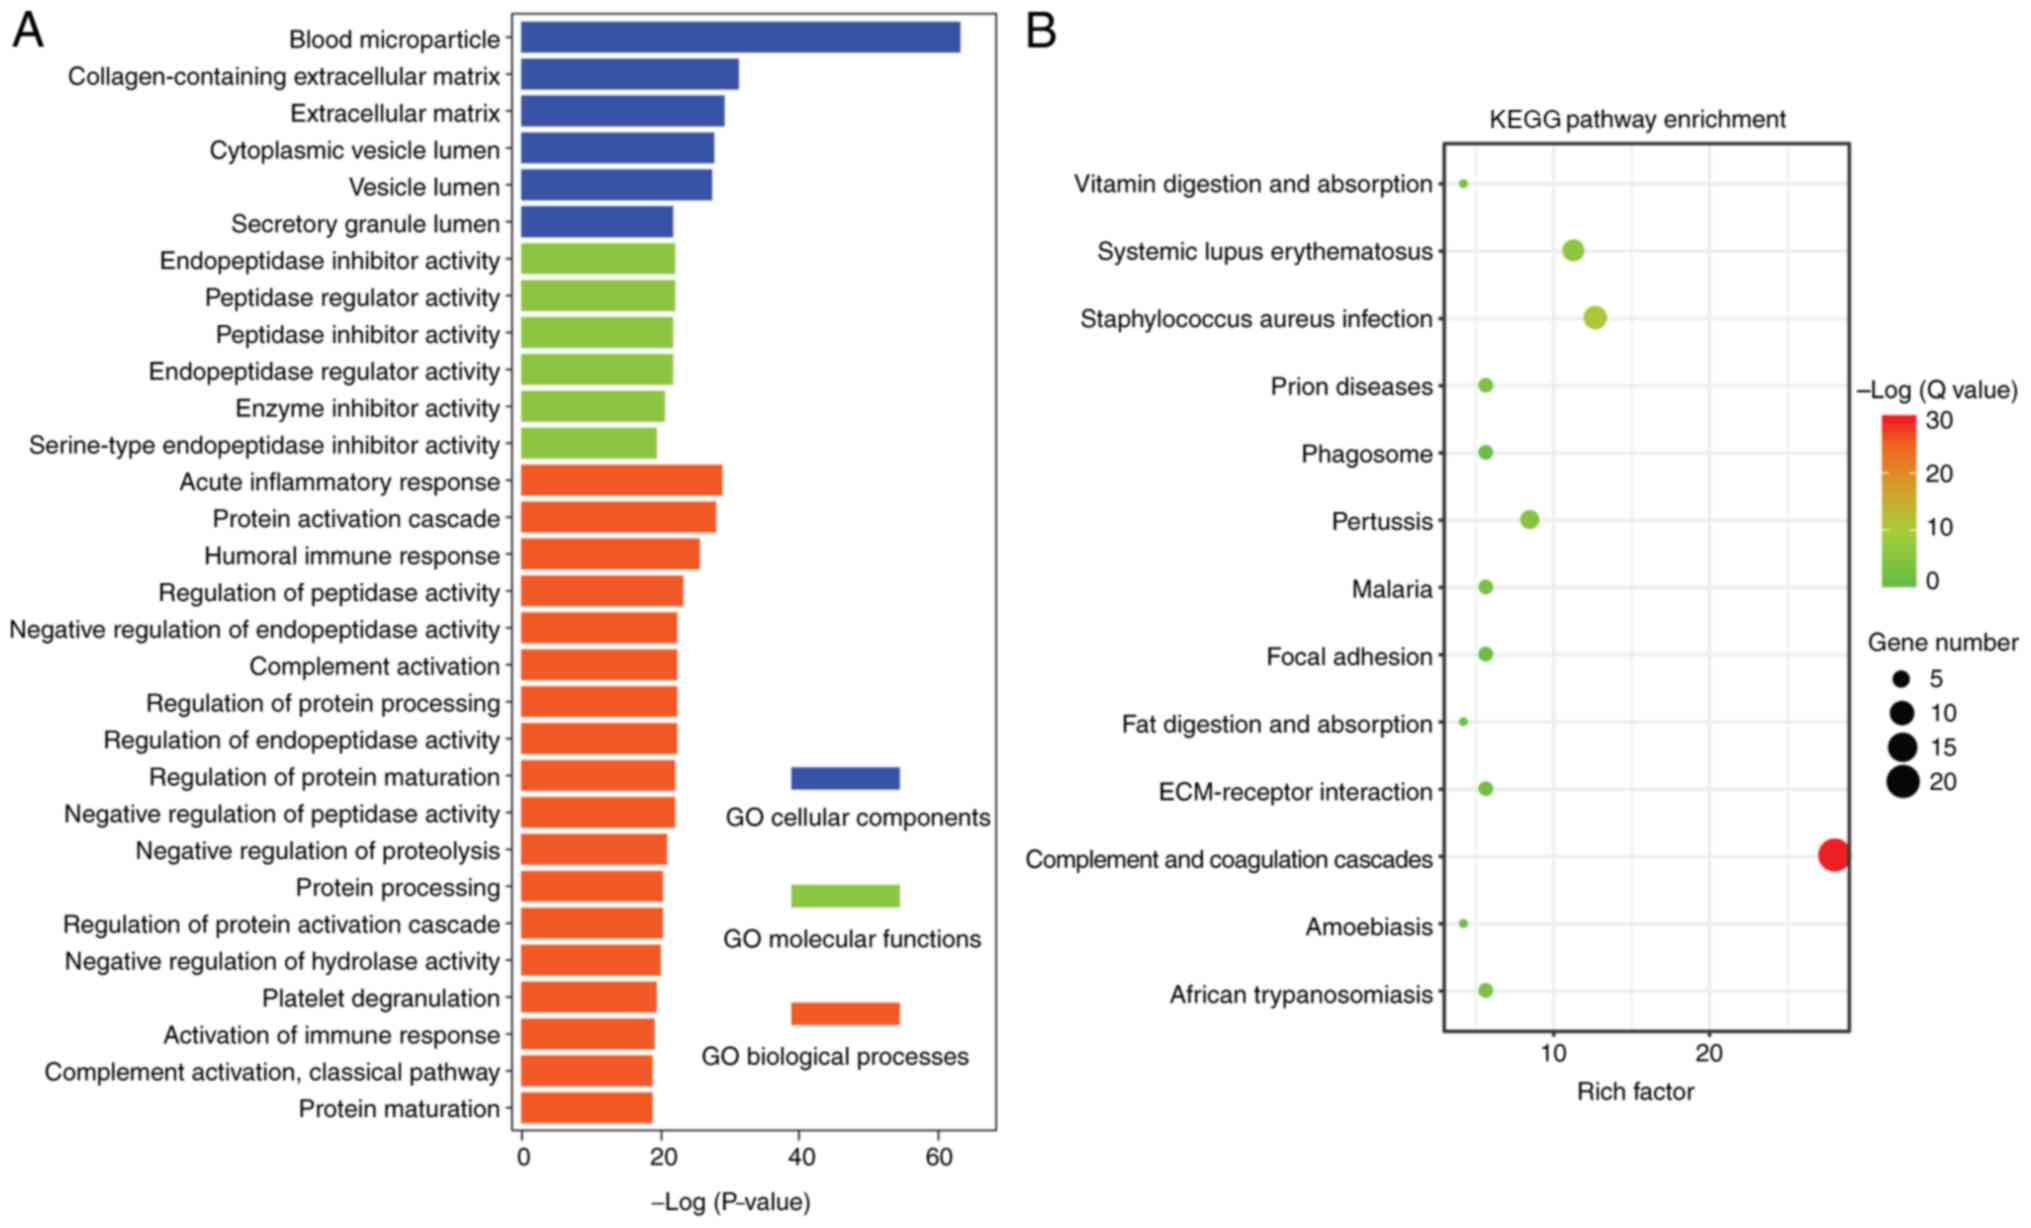
The enriched cellular components (blue), molecular
functions (green) and biological processes (orange) GO terms for
the proteins are presented in Fig.
3A. GO analysis revealed proteins mainly associated with blood
microparticle and collagen-containing extracellular matrix (ECM).
In addition, this analysis suggested that proteins were mainly
enriched for biological processes associated with the acute
inflammatory response and protein activation cascade (Fig. 3A). The top enriched KEGG pathways
for the differentially expressed proteins included complement and
coagulation cascades, systemic lupus erythematosus and
Staphylococcus aureus infection (Fig. 3B).
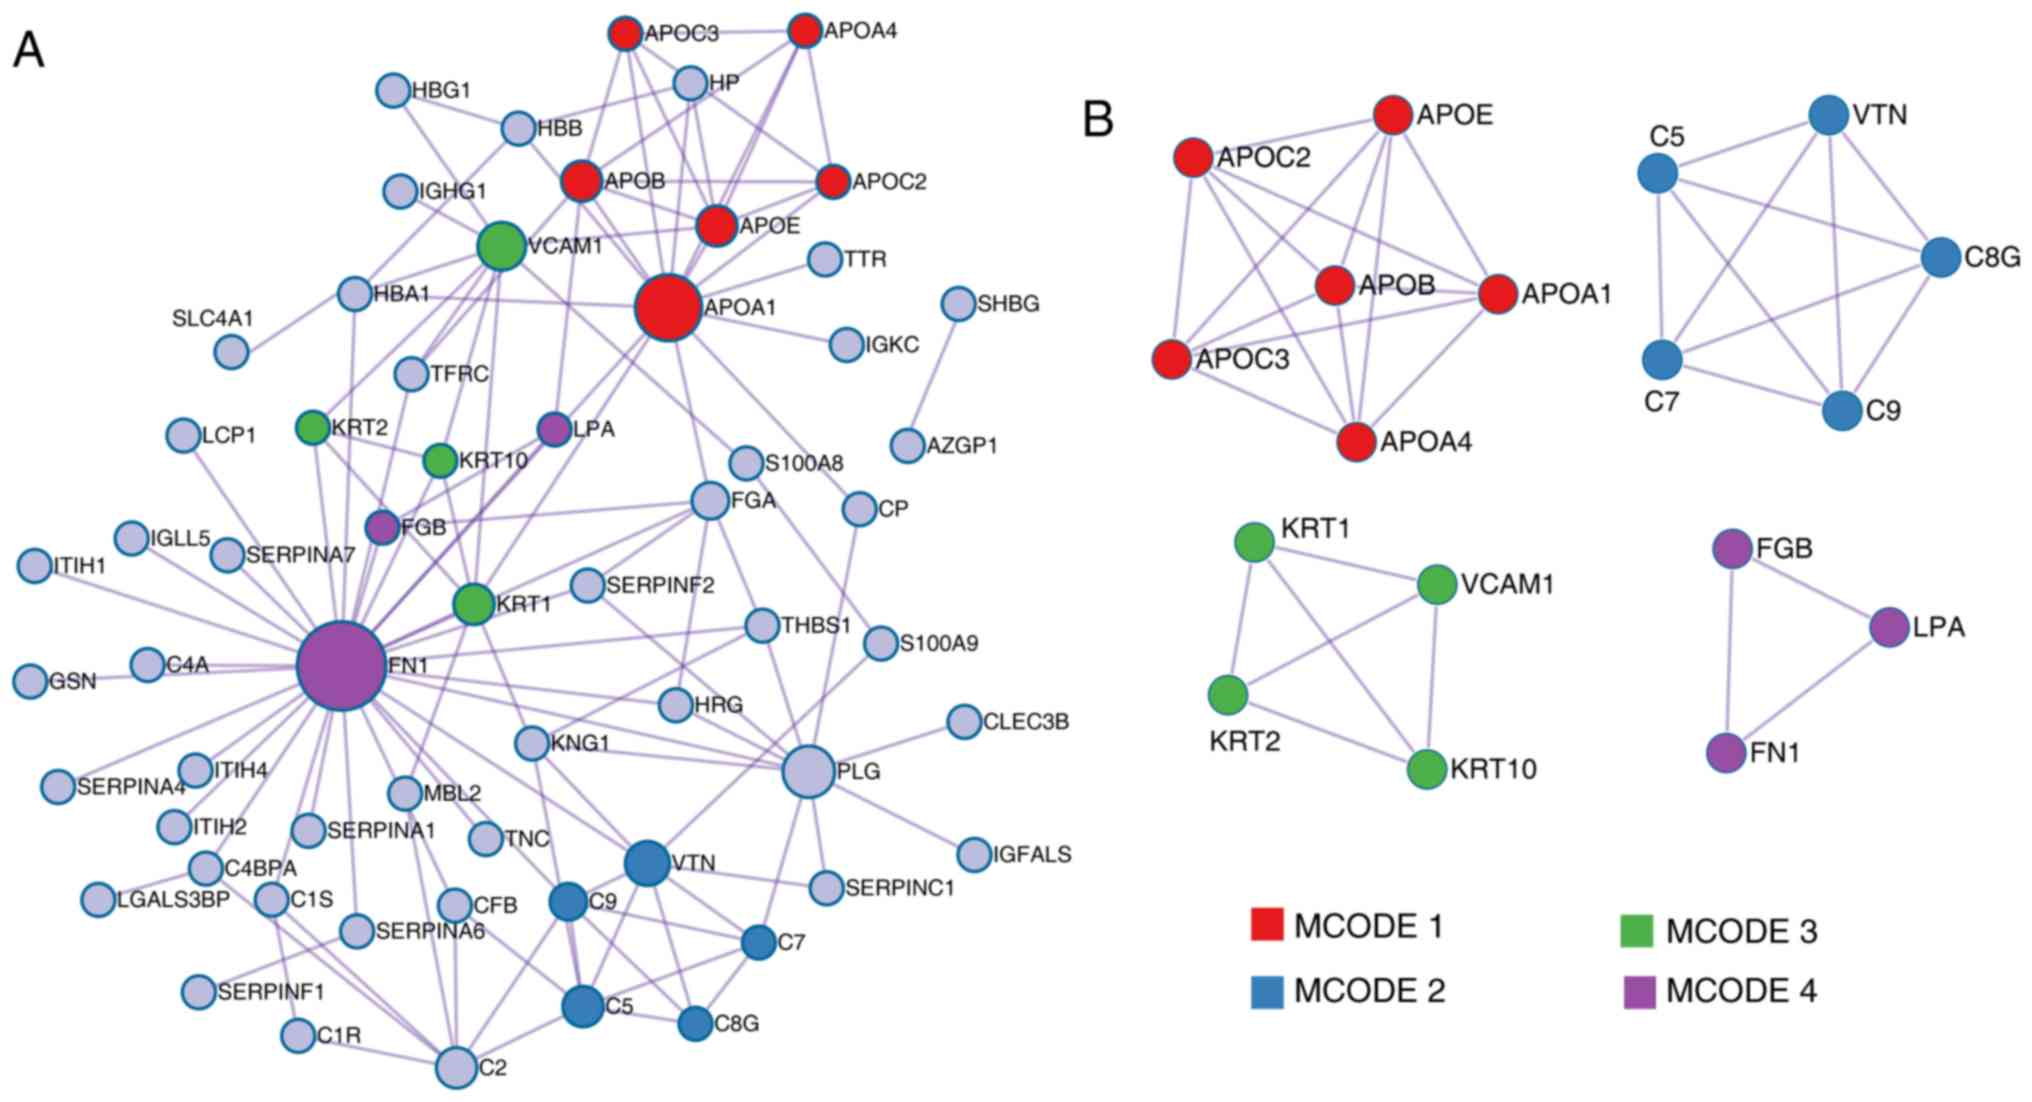
According to the MCODE method, four sub-clusters of
proteins were identified, as shown in Fig. 4B (MCODE1, MCODE2, MCODE3 and
MCODE4); proteins in each cluster shared the same GO terms and KEGG
pathways. Cluster MCODE1 included the proteins APOC2, APOE, APOB,
APOA4, APOC3 and APOA1, which are associated with chylomicron
remodeling (GO:0034371), chylomicron assembly (GO:0034378) and
triglyceride-rich lipoprotein particle remodeling (GO:0034370).
Cluster MCODE2 included complement component 5, vitronectin,
complement 8 γ, complement component 9 and complement component 7,
which are associated with membrane attack complex (GO:0005579),
complement and coagulation cascades (hsa04610), and complement
activation and alternative pathway (GO:0006957). Cluster MCODE3
included KRT10, KRT2, KRT1 and vascular cell adhesion molecule 1,
which are associated with structural constituent of epidermis
(GO:0030280), peptide cross-linking (GO:0018149) and cornified
envelope (GO:0001533). Finally, cluster MCODE4 included fibrinogen
β chain (FGB), lipoprotein A and FN1, which are involved in
extracellular structure organization (GO:0043062). Further
screening and analysis are required for these proteins.
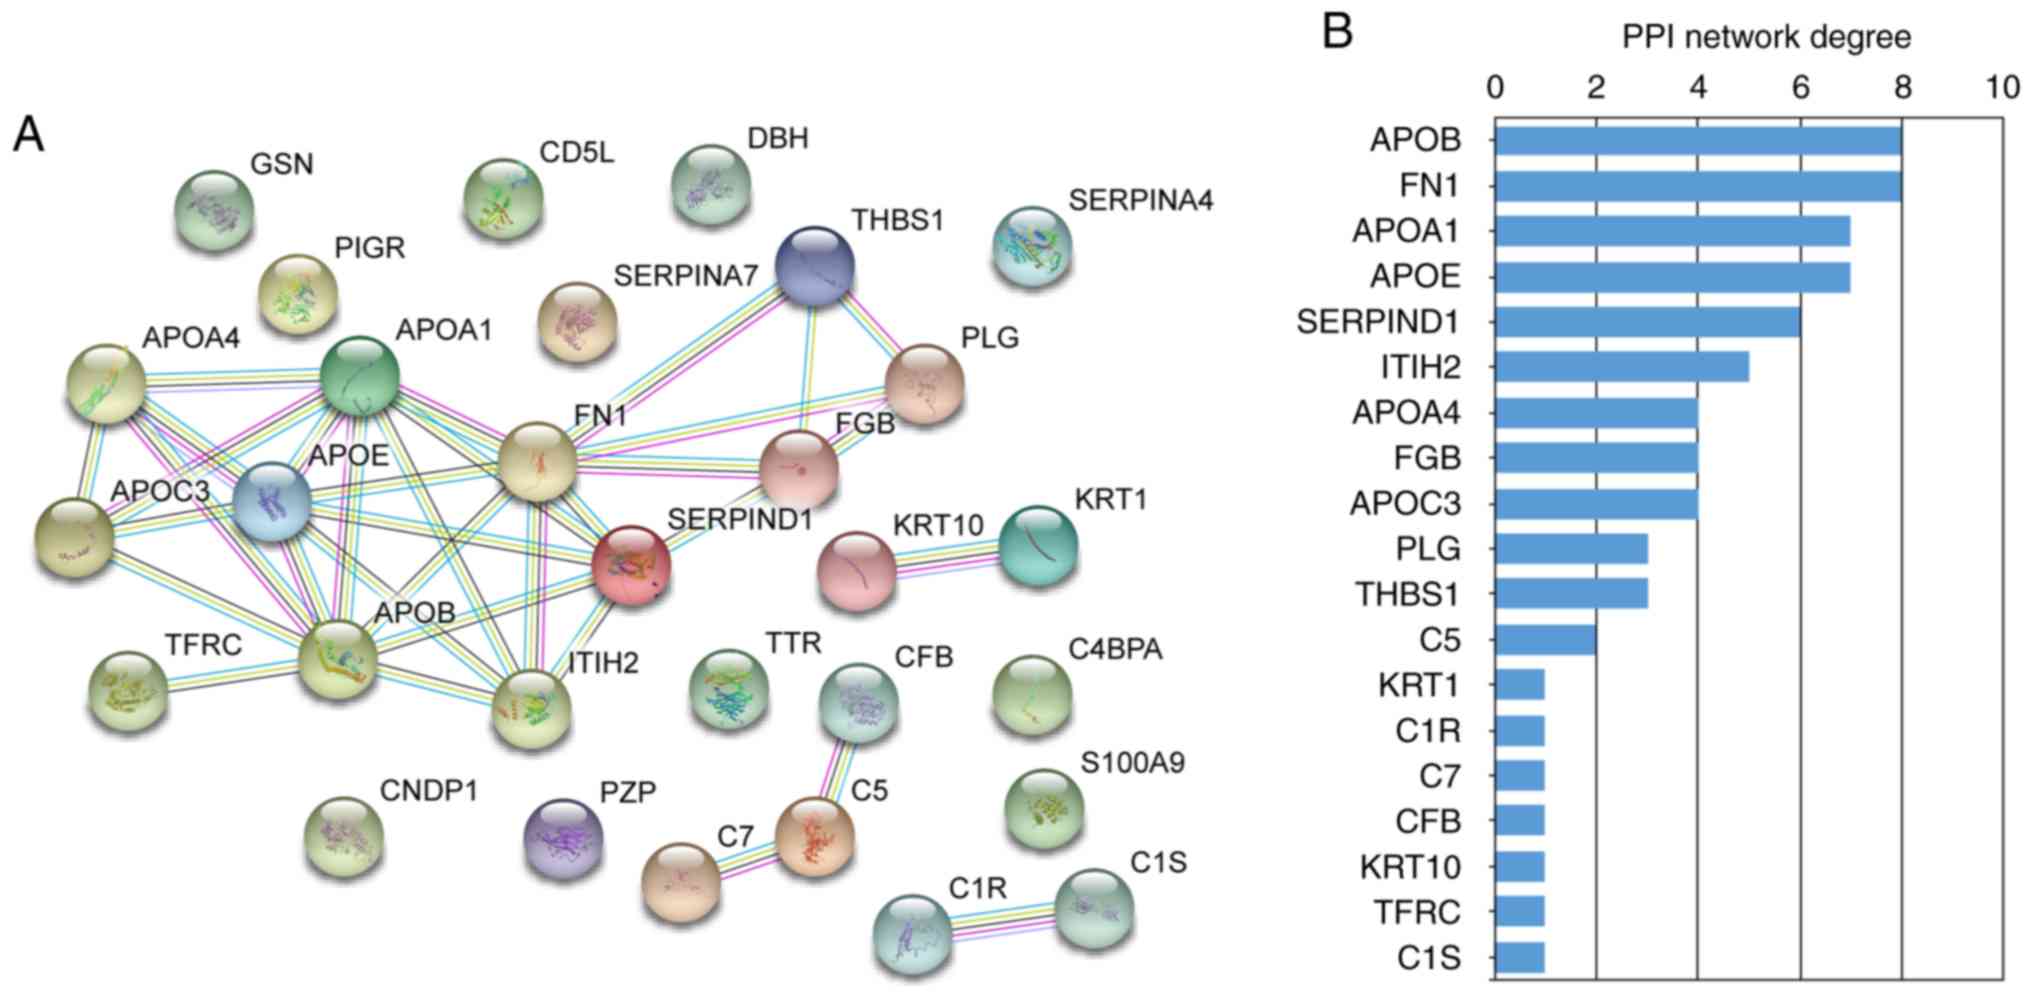
STRING PPI network analysis
Next, PPI networks were constructed using STRING
data concerning the differentially expressed proteins in the
-Treatment (Fig. 5) and +Treatment
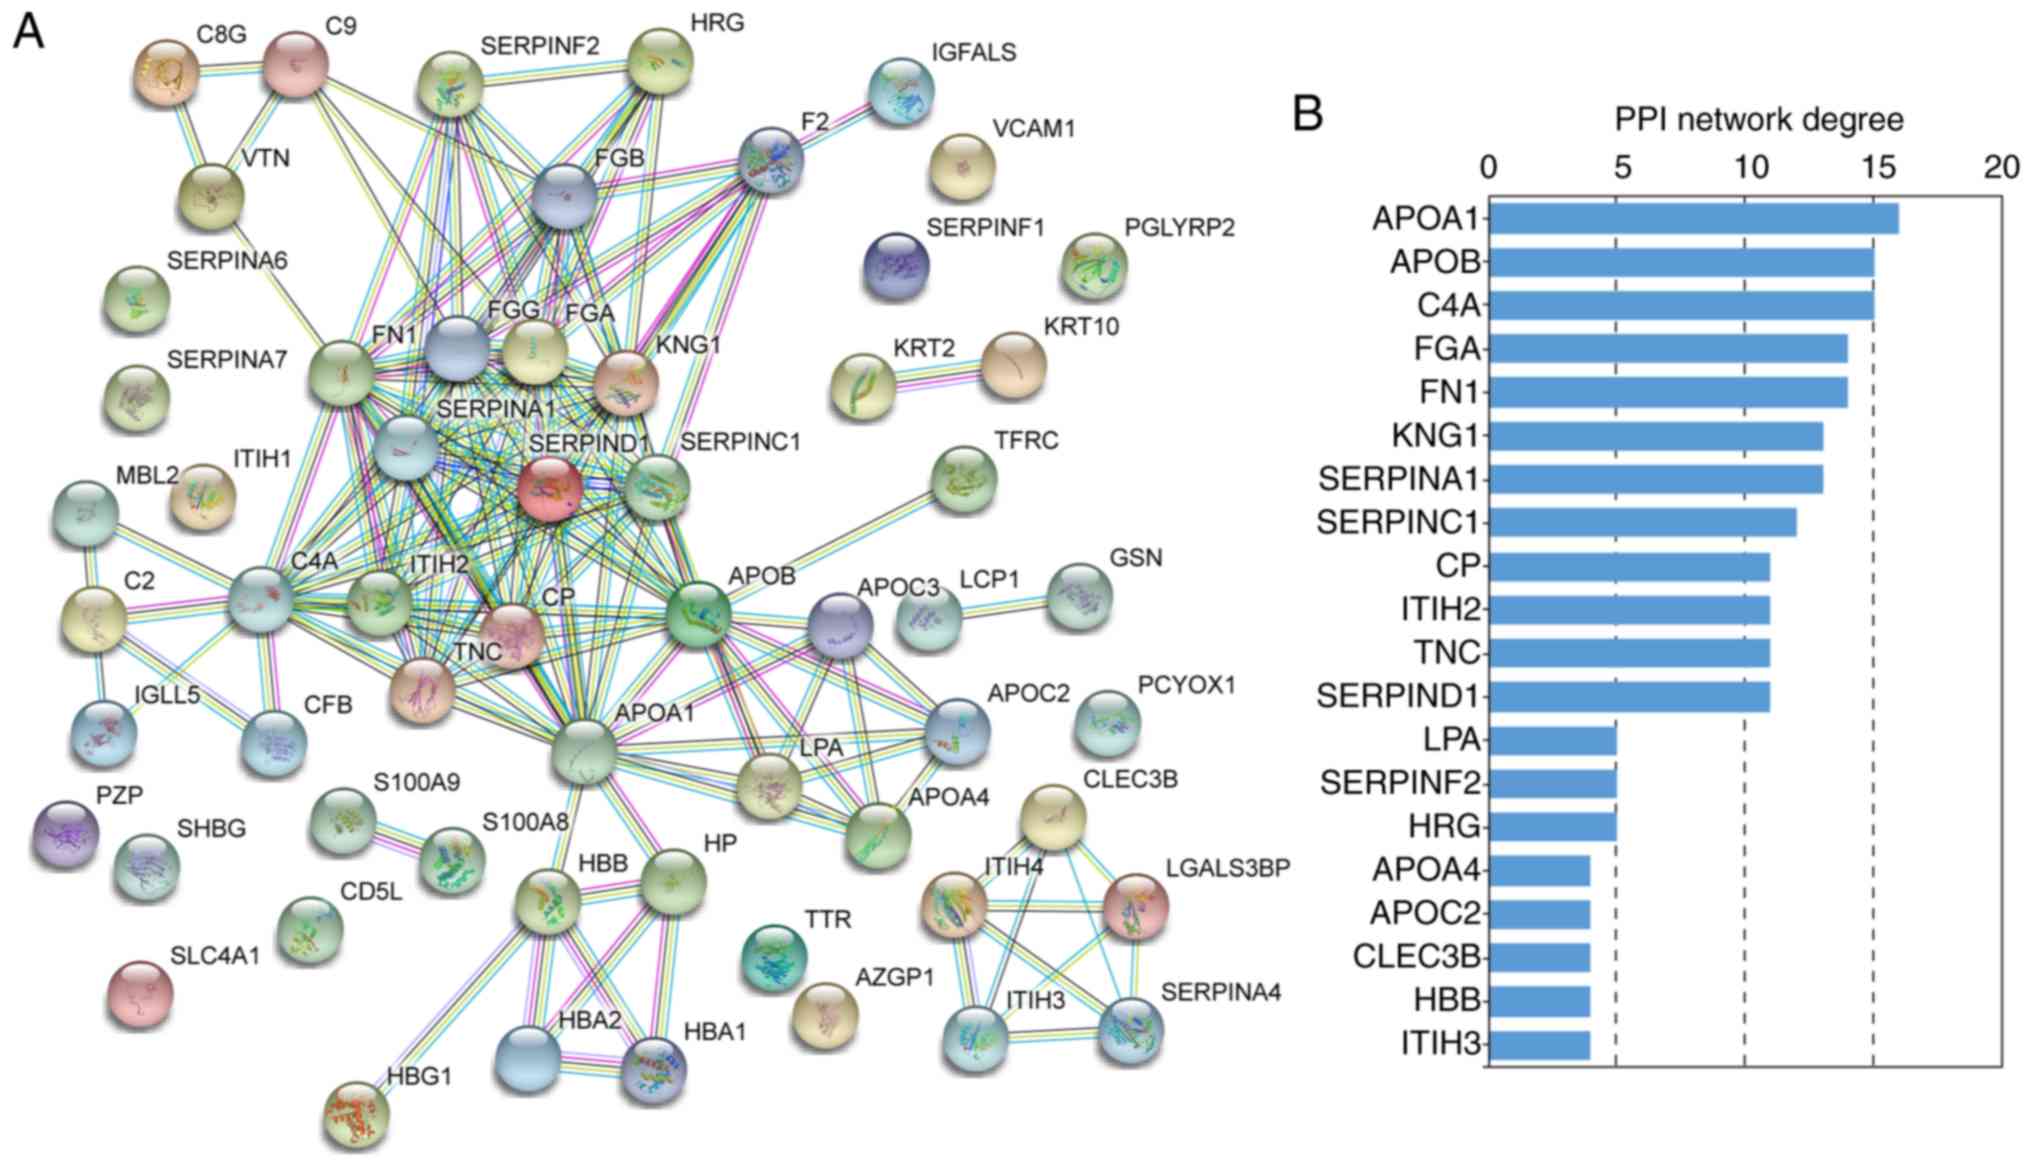
groups (Fig. 6). These data
allowed the major proteins to be determined in the PPI network. In
the -Treatment vs. control analysis, 30/33 differentially expressed
proteins were filtered to form the PPI network complex (Fig. 5A). The network contained 30 nodes
and 34 edges. Among the 30 nodes, the top 10 most strongly
connected PPI nodes were selected as hub proteins. These hub
proteins were APOB, FN1, APOA1, APOE, SERPIND1, inter-α-trypsin
inhibitor heavy chain 2 (ITIH2), APOA4, FGB, APOC3 and plasminogen
(Fig. 5B). APOB exhibited the
highest network connectivity in this PPI network. In the +Treatment
vs. control comparison, 54/57 differentially expressed proteins
were filtered to form the PPI network complex (Fig. 6A). The PPI network contained 54
nodes and 117 edges. Among these nodes, the major hub proteins were
APOA1, APOB, complement C4A (C4A), FGA, FN1, kininogen 1 (KNG1),
SERPINA1, SERPINC1, ceruloplasmin and ITIH2 (Fig. 6B). Thus, APOB had the second
highest degree of connectivity in this PPI network.
A more comprehensive PPI network complex was formed
with protein nodes from all the differentially expressed proteins
in both the -Treatment and +Treatment groups compared to the
control group (Fig. S1). This
comprehensive network contained 68 nodes and 188 edges, and the top
ten hub proteins were C4A, APOA1, FGA, FN1, KNG1, APOB, APOE,
SERPINA1, SERPINC1 and SERPIND1. KRT1 was not a top PPI network
connectivity protein, but was an MCODE hub protein (Fig. 4B) that was significantly
differently expressed. Based on the above results, and as candidate
proteins should exhibit strongly significant differences in
expression, KRT1, APOB, FN1, SERPINC1 and SERPINA1 were selected as
candidate proteins for further validation.
Validation of candidate proteins by
western blot analysis and ELISA
To validate the results from the iTRAQ-based
proteomic analysis, the expression levels of several candidate
proteins were examined by western blot analysis and ELISA The
western blot analysis results demonstrated that the expression
levels of APOB and SERPINC1 were significantly downregulated in the
+Treatment and -Treatment group compared with those in the control
groups. Compared with the control group, SERPINA1 was significantly
downregulated in the +Treatment group, but not in the -Treatment
group. Compared with that in the control group, KRT1 expression was
upregulated in the -Treatment group, and showed no significant
difference compared with the +Treatment group. The expression of
FN1 was slightly higher in the -Treatment group than in the
+Treatment and control groups, but this difference was not
significant (Fig. 7). The same
expression changes of KRT1, APOB, FN1, SERPINC1 and SERPINA1 were
further confirmed by the ELISA experiments (Fig. 8).
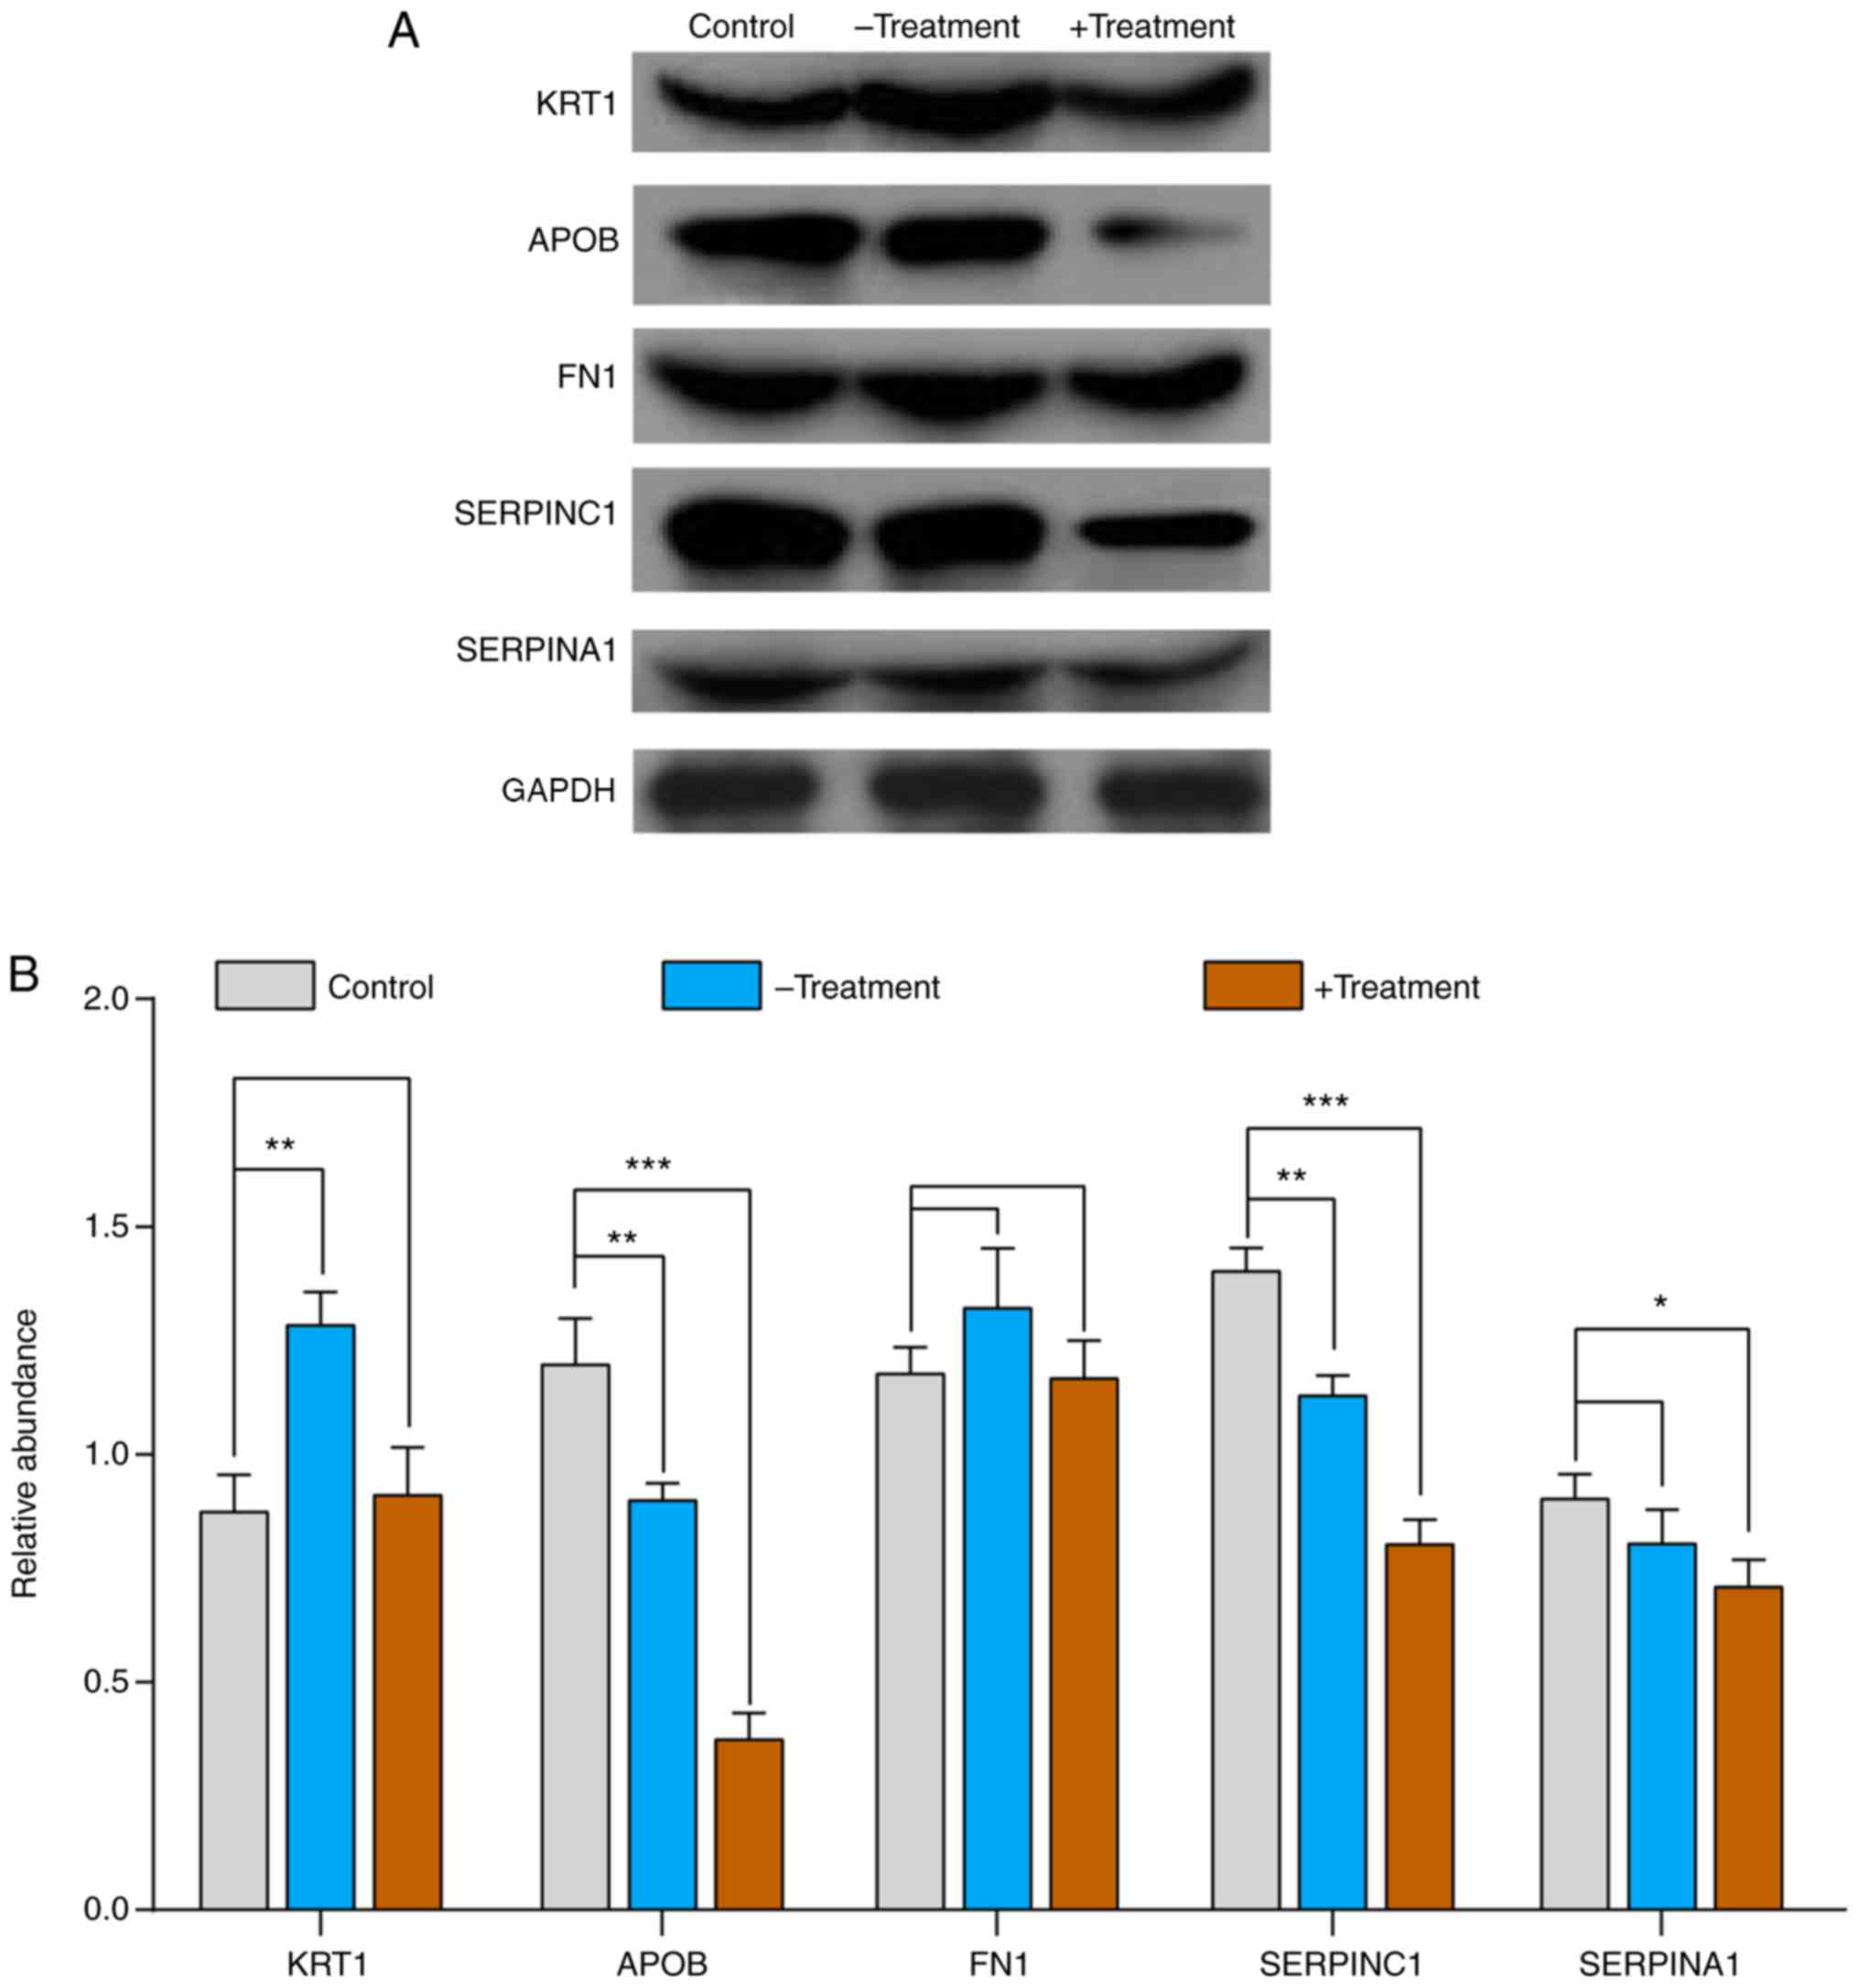 | Figure 7.Validation of proteomics results by
western blot analysis. (A) Western blot analysis was used for the
validation of 5 proteins (KRT1, APOB, FN1, SERPINC1 and SERPINA1)
from control, -Treatment and +Treatment samples; β-actin was used
as an internal control. (B) Histogram of western blot analysis. The
control group is shown in gray, the -Treatment group is blue and
the +Treatment group is brown. Data are expressed as mean ±
standard deviation (n=25 biological replicates in each group). The
multiple comparisons test of control vs. -Treatment and control vs.
+Treatment are performed using analysis of variance with Dunnett's
test. *P<0.05, **P<0.01 and ***P<0.001 vs. control. KRT1,
keratin 1; APOB, apolipoprotein B; FN1, fibronectin 1; SERPINC1,
antithrombin III; SERPINA1, α-1-antitrypsin. |
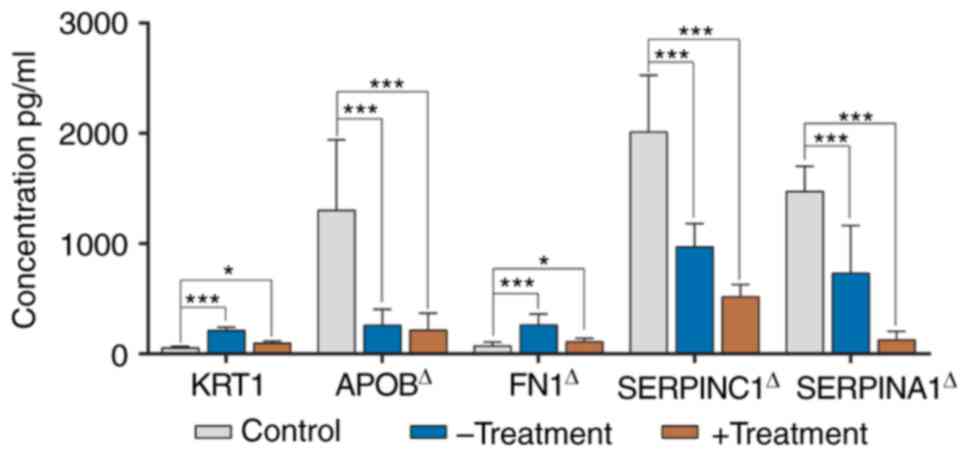 | Figure 8.Validation of the 5 candidate
proteins (KRT1, APOB, FN1, SERPINC1 and SERPINA1) by ELISA in the
control children, and -Treatment and +Treatment patients. The
control group is shown in gray, the -Treatment in blue and the
+Treatment in brown. Data are expressed as mean ± standard
deviation (n=25 biological replicates in each group). The multiple
comparisons test of control vs. -Treatment and control vs.
+Treatment are performed using ANOVA with Dunnett or Welch with
Dunnett's T3 test based on the result of variance homogeneity.
Except for KRT1 (ANOVA statistics), the variances of APOB, FN1,
SERPINC1 and SERPINA1 were not homogenous. ΔData were
analyzed using a Welch test. *P<0.05 and ***P<0.001 vs.
control. KRT1, keratin 1; APOB, apolipoprotein B; FN1, fibronectin
1; SERPINC1, antithrombin III; SERPINA1, α-1-antitrypsin; ANOVA,
analysis of variance. |
Discussion
In living organisms, proteins are the primary
catalysts of all physiological changes (10). Protein profiling can reveal the
molecular mechanisms of pathophysiological changes during disease
progression and yield plausible markers that could be used for
asthma diagnosis and prognosis, as well as serve as therapeutic
targets. There is a vast network of complex interactions underlying
disease development; no protein can account for all disease states,
particularly when investigating complex diseases such as asthma.
The iTRAQ technique is widely used for proteomics analysis and has
the advantages of adequate sensitivity, high reproducibility and a
wide linear dynamic range over traditional proteomics (10,20).
However, there is a lack of studies on proteomic analysis prior and
subsequent to SCIT treatment in HDM-related asthma. In the present
study, iTRAQ technology was used to analyze proteomic changes in
HDM-related asthma. KRT1, APOB, SERPINC1 and SERPINA1 were
identified as potential targets and biomarkers for the occurrence
and treatment of childhood HDM-related asthma.
KRT1 is a cytoskeleton-associated type II keratin
with high abundance in the epidermal cells of the spinous layer; it
affects 2 important cell kinase signaling pathways associated with
protein kinase C and SRC proto-oncogene, non-receptor tyrosine
kinase (21). Studies into KRT1
have primarily focused on skin diseases such as dermatitis,
ichthyosis and psoriasis (22);
therefore, little is known about the association between KRT1 and
HDM-related asthma. The present results indicated that KRT1 was a
core protein in MCODE3 (Fig. 4B),
which is mainly involved in the cellular component as a constituent
of the epidermis (GO:0030280). Keratin family proteins can promote
the proliferation of epithelial cells via multiple immune response
pathways, and the epidermal cells are known to serve a key role in
airway remodeling during asthma (23). Previous research has indicated that
KRT1 was involved in the regulation of the Notch signaling pathway
and affected the repair of vascular endothelial cell damage
(24,25). It has been identified that the
specific expression of KRT1 affects complex traits (26). A previous study analyzed
differential gene expression in peripheral blood mononuclear cells,
airway brushing cells and bronchioalveolar lavage cells from
asthmatic and healthy volunteers, and it was demonstrated that the
major keratin family genes (KRT1, KRT4, KRT5, KRT6, KRT8 and KRT18)
served important biological functions in asthma and immune
responsiveness (27). In the
present study, compared with the control group, the levels of KRT1
were increased three-fold in the -Treatment group, and were
marginally decreased in the +Treatment group based on iTRAQ
identification. This result was verified by western blot analysis
and ELISA. Combined with previous studies, the present results
indicated that KRT1 were strongly associated with HDM-related
asthma, and may serve as a potential biomarker.
APOB is an apolipoprotein involved in the transport
of lipoproteins and is associated with cholesterol metabolism
(28). Previous studies
investigating APOB-related genes and proteins have generally
focused on diabetes, cardiovascular disease and rheumatoid diseases
(28–30). It has been reported that APOB has a
role in the regulation of cellular inflammation and cardiovascular
inflammation after viral infections, as well as having a role in
the inflammatory response during the progression of rheumatoid
arthritis (31,32). In the current study, APOB was
identified to be associated with the most significantly enriched
biological process term regarding acute inflammatory responses, and
was predicted be a major hub protein in the PPI network. However,
the role of APOB in the molecular pathogenesis of asthma has been
disputed in several studies (33–37).
A previous study found no association between the levels of APOB in
plasma and asthma symptoms (33).
By contrast, subsequent studies have revealed a significant
positive correlation between APOB and platelet activating factor
(PAF) in allergic reactions, and concluded that PAF is a key
pathogenic regulator of asthma, whose stability is affected by APOB
(34,35). Furthermore, it has been suggested
that the expression of APOB in the asthma and control groups may be
affected by polymorphisms in the pro-inflammatory gene ORMDL
sphingolipid biosynthesis regulator 3 (36). In addition, some researchers
identified that the expression level of APOB was negatively
correlated with the severity index of asthma (FEV1%)
(37). Therefore, APOB may serve
as a candidate asthma-associated target or biomarker and may be
involved in the pathological progression of asthma. However, little
attention has been given to determining how APOB expression may
change in asthma following SCIT treatment. In the present study, it
was identified that the expression of APOB was downregulated in the
-Treatment and +Treatment groups compared with that in the control
group. Combined with the results of previous studies, it was
proposed that APOB could be a potential target for HDM-related
asthma.
FN1 is a fibroadenoma protein involved in cell
adhesion and migration; it can affect wound healing and host immune
processes. Studies have shown that the FN1 gene is differentially
expressed in asthma caused by viral infection (38). Yang et al (39) identified that WISP1 initiates and
propagates the pathological airway remodeling process of asthma by
inducing fibroblast proliferation and ECM deposition in mouse and
HFL-1 cell models, and that FN1 may be involved in this regulatory
mechanism. A previous study has also identified that interleukin 33
promotes the pathological process of asthmatic airway remodeling by
inducing the over-expression of FN1 in HLF-1 cells (40). In the present study it was
identified that FN1 was upregulated in HDM-related asthma groups
(-Treatment and +Treatment) compared with the control group by
iTRAQ analysis and ELISA; however, there was no significant
difference in FN1 expression based on the data from the western
blot analysis. This suggested that FN1 may exhibit high
heterogeneity in HDM-associated asthma subjects, but the role of
FN1 in asthma remains to be clarified.
SERPINC1 belongs to the serine protease family
encoding a plasma protease inhibitor, which serves a key role in
coagulation regulation. In the past decade, considerable research
has identified that genetic variants of SERPINC1 were associated
with a risk of thrombosis (41–44).
Furthermore, an epidemiological study suggested that patients with
asthma have a significantly increased risk of venous
thromboembolism and pulmonary embolism (45). A further study has shown that the
coagulation and fibrinolysis parameters of endogenous thrombin
potential plasminogen activator inhibitor type 1 and D-dimer, and
von Willebrand factor levels increased with increasing asthma
severity (46). The previous study
also indicated a significant positive correlation between the
prothrombotic state and disease severity in patients with asthma
(46). These results explain the
increased risk of venous thromboembolism and pulmonary embolism in
patients with asthma. Few studies have focused on the role of
SERPINC1 in asthma; therefore, it remains unknown whether the
increased risk of venous thrombosis in patients with asthma is
associated with SERPINC1. Recently, a large-scale epigenome-wide
association study found that SERPINC1 methylation was strongly
associated with asthma in children (47). These results suggested that
SERPINC1 may serve as a sympathetic molecule for the development of
asthma, vascular thrombosis and pulmonary embolism; thus, it is an
important finding with academic value. In the current study,
compared with the control group, the levels of SERPINC1 were
significantly decreased in the +Treatment asthma group based on
iTRAQ analysis, western blot analysis and ELISA verification. To
the best of our knowledge, the present study provided the first
demonstration that the protein expression of SERPINC1 was
associated with HDM-related asthma, which may provide novel
insights into its pathogenesis.
SERPINA1 encodes a serine proteinase inhibitor α-1
antitrypsin (ATT) that inactivates elastase, proteinase 3 and
cathepsin G in neutrophils, protecting the lower respiratory tract
and lungs against attacks by these proteases (48,49).
ATT deficiencies have been associated with a number of diseases,
such as pulmonary emphysema, chronic obstructive pulmonary disease
and cystic fibrosis liver disease, but its role in the development
of asthma remains controversial (48–51).
Several studies have suggested that SERPINA1 mutations resulted in
a deficiency in ATT, leading to allergic asthma (52–54).
In the present study, it was identified that SERPINA1 was
marginally downregulated in the +Treatment group compared with the
control group, confirming that SERPINA1 was associated with the
development of HDM-related asthma.
There were certain limitations to the present study.
Serum samples were used instead of blood cells to perform proteome
analysis, as the protein composition of blood cells is more
complex; furthermore, there are several different types of blood
cells, each of which may be associated with the pathophysiology of
asthma. Therefore, this limits the comparisons of the present study
with previous studies that investigated blood cells samples. In
addition, 5 samples from each group were mixed into a pooled group
sample in iTRAQ, which can lead to more significant systematic
errors. To address this problem, an independent cohort was used for
validation; however, the role of KRT1, APOB, SERPINC1 and SERPINA1
in HDM-related asthma requires further validation in a broader
cohort.
In conclusion, 72 differentially expressed proteins
that serve a role in the progression of HDM-related asthma were
identified. A panel of 4 proteins (KRT1, APOB, SERPINC1 and
SERPINA1), which were validated as differentially expressed using
western blot analysis, show potential as biomarkers for HDM-related
asthma. Functional classification and PPI network analysis of the
identified proteins provided insights into the complex pathogenesis
of asthma. Moreover, the role of SERPINC1 in HDM-related asthma
will improve the understanding of the progression of asthma. In
future studies, further validation of the roles of KRT1, APOB,
SERPINC1 and SERPINA1 in a larger HDM-related asthma cohort is
required to confirm these data.
Supplementary Material
Supporting Data
Acknowledgements
The authors would like to thank Professor Yin Guan
(Southern Medical University, Guangzhou, China) for her help with
the statistical analysis.
Funding
The present study was supported by the Foundation of
Hunan Double First-rate Discipline Construction Projects of
Bioengineering, and the Major Project for Guangzhou Collaborative
Innovation of Industry-University-Research (grant no. 201704020196
to RH).
Availability of data and materials
The datasets used and/or analyzed during the current
study are available from the corresponding author on reasonable
request.
Authors' contributions
JB and SPL conceived and designed the study. WL and
LC prepared the samples and completed the molecular biology
experiments. XJW, JYZ and RH analyzed the data. SPL and XJW drafted
the manuscript. All authors read and approved the final
manuscript.
Ethics approval and consent to
participate
This study was approved by the Ethics Committee of
Foshan Maternal and Children's Hospital Affiliated to Southern
Medical University (policy no. FSFY-MEC-2019-013). Written informed
consent was obtained from the guardians of each participant.
Patient consent for publication
The written informed consent for the publication was
obtained from the guardians of each participant.
Competing interests
The authors declare that they have no competing
interests.
References
|
1
|
Global Initiative for Asthma, . Global
Strategy for Asthma Management and Prevention. 2018, http://www.ginasthma.org
|
|
2
|
Asthma Group, Society of Respiratory
Diseases, Chinese Medical Association, . Guidelines for the
prevention and treatment of bronchial asthma. Chin J Tuberculosis
Respir. 39:675–697. 2016.
|
|
3
|
Bateman ED, Hurd SS, Barnes PJ, Bousquet
J, Drazen JM, FitzGerald JM, Gibson P, Ohta K, O'Byrne P, Pedersen
SE, et al: Global strategy for asthma management and prevention:
GINA executive summary. Eur Respir J. 31:143–178. 2008. View Article : Google Scholar : PubMed/NCBI
|
|
4
|
Huang FL, Liao EC and Yu SJ: House dust
mite allergy: Its innate immune response and immunotherapy.
Immunobiology. 223:300–302. 2018. View Article : Google Scholar : PubMed/NCBI
|
|
5
|
Eyerich S, Metz M, Bossios A and Eyerich
K: New biological treatments for asthma and skin allergies.
Allergy. 75:546–560. 2020. View Article : Google Scholar : PubMed/NCBI
|
|
6
|
Pfaar O, Lou H, Zhang Y, Klimek L and
Zhang L: Recent developments and highlights in allergen
immunotherapy. Allergy. 73:2274–2289. 2018. View Article : Google Scholar : PubMed/NCBI
|
|
7
|
Shamji M, Kappen J, Akdis M,
Jensen-Jarolim E, Knol EF, Kleine-Tebbe J, Bohle B, Chaker AM, Till
SJ, Valenta R, et al: Biomarkers for monitoring clinical efficacy
of allergen immunotherapy for allergic rhinoconjunctivitis and
allergic asthma: An EAACI position paper. Allergy. 72:1156–1173.
2017. View Article : Google Scholar : PubMed/NCBI
|
|
8
|
Keles S, Karakoc-Aydiner E, Ozen A, Izgi
AG, Tevetoglu A, Akkoc T, Bahceciler NN and Barlan I: A novel
approach in allergen-specific immunotherapy: Combination of
sublingual and subcutaneous routes. J Allergy Clin Immunol.
128:808–815 e7. 2011. View Article : Google Scholar : PubMed/NCBI
|
|
9
|
Celis JE, Gromov P, Cabezon T, Moreira
JMA, Ambartsumian N, Sandelin K, Rank F and Gromova I: Proteomic
characterization of the interstitial fluid perfusing the breast
tumor microenvironment: A novel resource for biomarker and
therapeutic target discovery. Mol Cell Proteomics. 3:327–344. 2004.
View Article : Google Scholar : PubMed/NCBI
|
|
10
|
Ray S, Reddy PJ, Jain R, Gollapalli K,
Moiyadi A and Srivastava S: Proteomic technologies for the
identification of disease biomarkers in serum: Advances and
challenges ahead. Proteomics. 11:2139–2161. 2011. View Article : Google Scholar : PubMed/NCBI
|
|
11
|
Thomas PD, Campbell MJ, Kejariwal A, Mi H,
Karlak B, Daverman R, Diemer K, Muruganujan A and Narechania A:
PANTHER: A library of protein families and subfamilies indexed by
function. Genome Res. 13:2129–2141. 2003. View Article : Google Scholar : PubMed/NCBI
|
|
12
|
Mi H, Muruganujan A and Thomas PD: PANTHER
in 2013: Modeling the evolution of gene function, and other gene
attributes, in the context of phylogenetic trees. Nucleic Acids
Res. 41:D377–D386. 2013. View Article : Google Scholar : PubMed/NCBI
|
|
13
|
Mi H, Muruganujan A, Ebert D, Huang X and
Thomas PD: PANTHER version 14: More genomes, a new PANTHER GO-slim
and improvements in enrichment analysis tools. Nucleic Acids Res.
47:D419–D426. 2019. View Article : Google Scholar : PubMed/NCBI
|
|
14
|
Tripathi S, Pohl M, Zhou Y,
Rodriguez-Frandsen A, Wang G, Stein DA, Moulton HM, DeJesus P, Che
J, Mulder LCF, et al: Meta- and orthogonal integration of influenza
‘OMICs’ data defines a role for UBR4 in virus budding. Cell Host
Microbe. 18:723–735. 2015. View Article : Google Scholar : PubMed/NCBI
|
|
15
|
Kanehisa M and Goto S: KEGG: Kyoto
encyclopedia of genes and genomes. Nucleic Acids Res. 28:27–30.
2000. View Article : Google Scholar : PubMed/NCBI
|
|
16
|
Kanehisa M, Sato Y, Furumichi M, Morishima
K and Tanabe M: New approach for understanding genome variations in
KEGG. Nucleic Acids Res. 47:D590–D595. 2019. View Article : Google Scholar : PubMed/NCBI
|
|
17
|
Kanehisa M: Toward understanding the
origin and evolution of cellular organisms. Protein Sci.
28:1947–1951. 2019. View
Article : Google Scholar : PubMed/NCBI
|
|
18
|
Shannon P, Markiel A, Ozier O, Baliga NS,
Wang JT, Ramage D, Amin N, Schwikowski B and Ideker T: Cytoscape: A
software environment for integrated models of biomolecular
interaction networks. Genome Res. 13:2498–2504. 2003. View Article : Google Scholar : PubMed/NCBI
|
|
19
|
Szklarczyk D, Gable AL, Lyon D, Junge A,
Wyder S, Huerta-Cepas J, Simonovic M, Doncheva NT, Morris JH, Bork
P, et al: STRING v11: Protein-protein association networks with
increased coverage, supporting functional discovery in genome-wide
experimental datasets. Nucleic Acids Res. 47:D607–D613. 2019.
View Article : Google Scholar : PubMed/NCBI
|
|
20
|
Aggarwal K, Choe LH and Lee KH: Shotgun
proteomics using the iTRAQ isobaric tags. Brief Funct Genomics
Proteomic. 5:112–120. 2006. View Article : Google Scholar
|
|
21
|
Roth W, Kumar V, Beer HD, Richter M,
Wohlenberg C, Reuter U, Thiering S, Staratschek-Jox A, Hofmann A,
Kreusch F, et al: Keratin 1 maintains skin integrity and
participates in an inflammatory network in skin through
interleukin-18. J Cell Sci. 125:5269–5279. 2012. View Article : Google Scholar : PubMed/NCBI
|
|
22
|
Choate KA, Lu Y, Zhou J, Elias PM, Zaidi
S, Paller AS, Farhi A, Nelson-Williams C, Crumrine D, Milstone LM
and Lifton RP: Frequent somatic reversion of KRT1 mutations in
ichthyosis with confetti. J Clin Invest. 125:1703–1707. 2015.
View Article : Google Scholar : PubMed/NCBI
|
|
23
|
Depianto D, Kerns M, Dlugosz A and
Coulombe PA: Keratin 17 promotes epithelial proliferation and tumor
growth by polarizing the immune response in skin. Nat Genet.
42:910–914. 2010. View
Article : Google Scholar : PubMed/NCBI
|
|
24
|
Gao Z, Ji X, Gu J, Wang XY, Ding L and
Zhang H: microRNA-107 protects against inflammation and endoplasmic
reticulum stress of vascular endothelial cells via KRT1-dependent
Notch signaling pathway in a mouse model of coronary
atherosclerosis. J Cell Physiol. 234:12029–12041. 2019. View Article : Google Scholar : PubMed/NCBI
|
|
25
|
Fang HC, Wu BQ, Hao YL, Luo Y, Zhao HL,
Zhang WY, Zhang ZL, Liang JJ, Liu W and Chen XH: KRT1 gene
silencing ameliorates myocardial ischemia-reperfusion injury via
the activation of the Notch signaling pathway in mouse models. J
Cell Physiol. 234:3634–3646. 2019. View Article : Google Scholar : PubMed/NCBI
|
|
26
|
Tao H, Cox D and Frazer K: Allele-specific
KRT1 expression is a complex trait. PLoS Genet. 2:e932006.
View Article : Google Scholar : PubMed/NCBI
|
|
27
|
Gao P, Grigoryev D, Breslin L, Cheadle C,
Mathias RA, Beaty TH, Togias A and Barnes K: Keratins: Important
candidate genes for asthma and immune responsiveness to cockroach.
J Allergy Clin Immunol. 119 (Suppl):S1762007. View Article : Google Scholar
|
|
28
|
Whitfield AJ, Barrett PH, Van Bockxmeer FM
and Burnett JR: Lipid disorders and mutations in the APOB gene.
Clin Chem. 50:1725–1732. 2004. View Article : Google Scholar : PubMed/NCBI
|
|
29
|
Duvillard L, Pont F, Florentin E,
Galland-Jos C, Gambert P and Vergès B: Metabolic abnormalities of
apolipoprotein B-containing lipoproteins in non-insulin-dependent
diabetes: A stable isotope kinetic study. Eur J Clin Invest.
30:685–694. 2000. View Article : Google Scholar : PubMed/NCBI
|
|
30
|
Walldius G and Jungner I: The apoB/apoA-I
ratio: A strong, new risk factor for cardiovascular disease and a
target for lipid-lowering therapy-a review of the evidence. J
Intern Med. 259:493–519. 2006. View Article : Google Scholar : PubMed/NCBI
|
|
31
|
Tort O, Escribà T, Egaña-Gorroño L, de
Lazzari E, Cofan M, Fernandez E, Gatell JM, Martinez E, Garcia F
and Arnedo M: Cholesterol efflux responds to viral load and CD4
counts in HIV+ patients and is dampened in HIV exposed. J Lipid
Res. 59:2108–2115. 2018. View Article : Google Scholar : PubMed/NCBI
|
|
32
|
Lee J, Kang M, Choi J, Park JS, Park JK,
Lee EY, Lee EB, Pap T, Yi EC and Song YW: Apolipoprotein B binds to
enolase-1 and aggravates inflammation in rheumatoid arthritis. Ann
Rheum Dis. 77:1480–1489. 2018. View Article : Google Scholar : PubMed/NCBI
|
|
33
|
Nagel G, Weiland S, Rapp K, Link B,
Zoellner I and Koenig W: Association of apolipoproteins with
symptoms of asthma and atopy among schoolchildren. Int Arch Allergy
Immunol. 149:259–266. 2009. View Article : Google Scholar : PubMed/NCBI
|
|
34
|
Pettersson ME, Koppelman GH, Flokstra-de
Blok BM, van Ginkel CD, Roozendaal C, Muller-Kobold AC, Kollen BJ
and Dubois AEJ: Apolipoprotein B: A possible new biomarker for
anaphylaxis. Ann Allergy Asthma Immunol. 118:515–516. 2017.
View Article : Google Scholar : PubMed/NCBI
|
|
35
|
Perelman B, Adil A and Vadas P:
Relationship between platelet activating factor acetylhydrolase
activity and apolipoprotein B levels in patients with peanut
allergy. Allergy Asthma Clin Immunol. 10:202014. View Article : Google Scholar : PubMed/NCBI
|
|
36
|
Wang BJ, Wang GL, Chen DH, Wang WX, Huang
J, Rong JY, Liu XT and Yang S: Association of ORMDL3 single
nucleotide polymorphisms with lysophosphatidylcholine and
apolipoprotein B levels in children with asthma. Zhongguo Dang Dai
Er Ke Za Zhi. 17:241–244. 2015.(In Chinese). PubMed/NCBI
|
|
37
|
Barochia AV, Kaler M, Cuento RA, Gordon
EM, Weir NA, Sampson M, Fontana JR, MacDonald S, Moss J,
Manganiello V, et al: Serum apolipoprotein A-I and large
high-density lipoprotein particles are positively correlated with
FEV1 in atopic asthma. Am J Respir Crit Care Med. 191:990–1000.
2015. View Article : Google Scholar : PubMed/NCBI
|
|
38
|
Bochkov Y, Hanson K, Keles S,
Brockman-Schneider RA, Jarjour NN and Gern JE: Rhinovirus-induced
modulation of gene expression in bronchial epithelial cells from
subjects with asthma. Mucosal Immunol. 3:69–80. 2010. View Article : Google Scholar : PubMed/NCBI
|
|
39
|
Yang M, Zhao X, Liu Y, Tian Y, Ran X and
Jiang Y: A role for WNT1-inducible signaling protein-1 in airway
remodeling in a rat asthma model. Int Immunopharmacol. 17:350–357.
2013. View Article : Google Scholar : PubMed/NCBI
|
|
40
|
Guo Z, Wu J, Zhao J, Liu F, Chen Y, Bi L
and Dong L: IL-33/ST2 promotes airway remodeling in asthma by
activating the expression of fibronectin 1 and type 1 collagen in
human lung fibroblasts. Xi Bao Yu Fen Zi Mian Yi Xue Za Zhi.
30:975–979. 2014.(In Chinese). PubMed/NCBI
|
|
41
|
Bezemer ID, Bare LA, Doggen CJ, Arellano
AR, Tong C, Rowland CM, Catanese J, Young BA, Reitsma PH, Devlin JJ
and Rosendaal FR: Gene variants associated with deep vein
thrombosis. JAMA. 299:1306–1314. 2008. View Article : Google Scholar : PubMed/NCBI
|
|
42
|
de Haan H, Bezemer I, Doggen C, Cessie SL,
Reitsma PH, Arellano AR, Tong CH, Devlin JJ, Bare LA, Rosendaal FR
and Vossen CY: Multiple SNP testing improves risk prediction of
first venous thrombosis. Blood. 120:656–663. 2012. View Article : Google Scholar : PubMed/NCBI
|
|
43
|
Luxembourg B, Pavlova A, Geisen C,
Spannagl M, Bergmann F, Krause M, Alesci S, Seifried E and
Lindhoff-Last E: Impact of the type of SERPINC1 mutation and
subtype of antithrombin deficiency on the thrombotic phenotype in
hereditary antithrombin deficiency. Thromb Haemost. 111:249–257.
2014. View Article : Google Scholar : PubMed/NCBI
|
|
44
|
Rosendaal F: Causes of venous thrombosis.
Thromb J. 14 (Suppl 1):S242016. View Article : Google Scholar
|
|
45
|
Majoor CJ, Kamphuisen PW, Zwinderman AH,
Ten Brinke A, Amelink M, Rijssenbeek-Nouwens L, Sterk PJ, Büller HR
and Bel EH: Risk of deep vein thrombosis and pulmonary embolism in
asthma. Eur Respir J. 42:655–661. 2013. View Article : Google Scholar : PubMed/NCBI
|
|
46
|
Sneeboer MMS, Majoor CJ, de Kievit A,
Meijers JCM, van der Poll T, Kamphuisen PW and Bel EH:
Prothrombotic state in patients with severe and
prednisolone-dependent asthma. J Allergy Clin Immunol.
137:1727–1732. 2016. View Article : Google Scholar : PubMed/NCBI
|
|
47
|
Xu CJ, Söderhäll C, Bustamante M, Baïz N,
Gruzieva O, Gehring U, Mason D, Chatzi L, Basterrechea M, Llop S,
et al: DNA methylation in childhood asthma: An epigenome-wide
meta-analysis. Lancet Respir Med. 6:379–388. 2018. View Article : Google Scholar : PubMed/NCBI
|
|
48
|
Cosio MG, Bazzan E, Rigobello C, Tinè M,
Turato G, Baraldo S and Saetta M: Alpha-1 antitrypsin deficiency:
Beyond the protease/antiprotease paradigm. Ann Am Thorac Soc. 4
(Suppl 13):S305–S310. 2016. View Article : Google Scholar
|
|
49
|
McCarthy C, Reeves EP and McElvaney NG:
The role of neutrophils in alpha-1 antitrypsin deficiency. Ann Am
Thorac Soc. 4 (Suppl 13):S297–S304. 2016. View Article : Google Scholar
|
|
50
|
De Serres F and Blanco I: Role of alpha-1
antitrypsin in human health and disease. J Intern Med. 276:311–335.
2014. View Article : Google Scholar : PubMed/NCBI
|
|
51
|
Janciauskiene S and Welte T: Well-known
and less well-known functions of alpha-1 antitrypsin. Its role in
chronic obstructive pulmonary disease and other disease
developments. Ann Am Thorac Soc. 4 (Suppl 13):S280–S288. 2016.
View Article : Google Scholar
|
|
52
|
Bragina EY, Goncharova IA, Garaeva AF,
Nemerov EV, Babovskaya AA, Karpov AB, Semenova YV, Zhalsanova IZ,
Gomboeva DE, Saik OV, et al: Molecular relationships between
bronchial asthma and hypertension as comorbid diseases. J Integr
Bioinform. 15:201800522018. View Article : Google Scholar
|
|
53
|
Suárez-Lorenzo I, de Castro FR,
Cruz-Niesvaara D, Herrera-Ramos E, Rodríguez-Gallego C and
Carrillo-Diaz T: Alpha 1 antitrypsin distribution in an allergic
asthmatic population sensitized to house dust mites. Clin Transl
Allergy. 8:442018. View Article : Google Scholar : PubMed/NCBI
|
|
54
|
Hernández-Pérez JM, Ramos-Díaz R and Pérez
JA: Identification of a new defective SERPINA1 allele (PI*Z la
palma) encoding an alpha-1-antitrypsin with altered glycosylation
pattern. Respir Med. 131:114–117. 2017. View Article : Google Scholar : PubMed/NCBI
|