Introduction
Glioma is the most common type of primary malignant
brain tumor and the leading cause of intrinsic brain tumor-related
mortality worldwide (1,2). The annual incidence rate of glioma is
6 new cases per 100,000 individuals per year in China (2,3).
Glioblastoma is the most malignant pathological type of glioma. The
recommended standard therapy for glioblastoma includes maximal
surgical resection followed by concurrent radiation therapy with
temozolomide and subsequent adjuvant temozolomide therapy (2). Although a markedly higher survival
time along with an acceptable quality of life was achieved in
patients with gliomas, their treatment remains challenging. The
median survival time of patients with glioblastoma is estimated to
be only 15 months, with the 5-year survival rate of patients at 5%
(2,4). These epidemiologic results reflect the
low efficiency of current treatments, suggesting the urgent
requirement for new therapeutic strategies.
Gene amplified in squamous cell carcinoma 1 (GASC1),
also known as Lysine Demethylase 4C (KDM4C) and Jumonji C
domain-containing oxygenase D2C (JMJD2C), is a gene on chromosome
9p24.1 that encodes lysine-specific demethylase 4C, which
demethylates histone H3 and generates formaldehyde and succinate
(5). GASC1 can regulate the
expression of important cancer genes via the demethylation of tri-
or di-methylation of histone H3 at lysine 9 (H3K9me3/me2) at
corresponding promoter regions (6).
Previous studies have revealed that GASC1 is widely expressed and
serves as a transforming oncogene in several types of cancer,
including lymphoma, medulloblastoma, lung, prostate and breast
cancer (7–14). Moreover, GASC1 was found to be
highly expressed in the brain astrocytes, and the brain of
GASC1-hypomorphic mutant mice displayed an increased number of
astrocytes (12), suggesting a
possible role of GASC1 in the development of glioma. However, to
date, the link between the GASC1 expression and the progression of
glioma remains unknown.
Due to the capabilities of self-renewal,
differentiation and tumorigenicity, glioma stem cells (GSCs) have
been suggested to be key contributors to glioma tumorigenesis,
treatment resistance and tumor recurrence (15,16).
Due to the promising results of treatment using molecular targets,
there has been increasing interest in therapeutic strategies using
small-molecule targeted drugs against cancer stem cells. Our
previous studies revealed that GASC1 promotes stemness of
esophageal squamous cell carcinoma, and that nuclear-enriched
abundant transcript 1 silencing suppresses glioma stem-like
properties (14,17). In the present study, the GASC1
expression was examined in World Health Organization (WHO) grade
II, III and IV glioma tissues. The proliferation, invasion,
migration and stemness of glioma cells in vitro and in
vivo under GASC1 inhibition exposure were also determined in
invasion Transwell, clonogenic and wound healing assays.
Materials and methods
Reagent and antibodies
GASC1 (cat. no. ab85454), notch receptor 1 (NOTCH1)
(cat. no. ab8925), GLI family zinc finger 1 (Gli1; cat. no.
ab49314), hes family bHLH transcription factor 1 (Hes1; cat. no.
ab71559), Bax (cat. no. ab32503), S100 (cat. no. ab52642),
β-catenin (cat. no. ab16051), CD133 (cat. no. ab16518), nestin
(cat. no. ab105389) and Ki67 (sp6; cat. no. ab16667) antibodies
were obtained from Abcam. Cyclin D1 (cat. no. sc-8396) and β-actin
(cat. no. sc-81178) primary antibodies were purchased from Santa
Cruz Biotechnology, Inc.
Glioma specimens
The study protocol was approved by the Research
Ethics Committee of The First Affiliated Hospital of Henan
University of Science and Technology Institutional Review Board
(approval no. 2013-08). Written informed consent was obtained from
all patients. Gliomas were diagnosed with preoperative magnetic
resonance imaging and postoperative histopathology, based on the
WHO guidelines for the diagnosis and treatment of glioma (18). All patients (9 males, 9 females; age
range 28–71 years; mean age, 51 years; interquartile range, 40–62
years) received surgery between July 2013 and July 2019 at the
Department of Neurosurgery, The First Affiliated Hospital of Henan
University of Science and Technology. Each tissue sample was
bisected. One half was frozen for protein and RNA extraction, and
the other half were fixed with 10% neutral buffered formalin (cat.
no. DF0111; Beijing Leagene Biotechnology Co., Ltd.) overnight at
room temperature (RT) followed by an embedding in paraffin wax.
Cell lines and culture protocols
The U87 human glioblastoma of unknown origin (cat.
no. Tchu 138) and U251 human glioblastoma cell line (cat. no. Tchu
58) were purchased from the Cell Bank of Chinese Academy of
Sciences. In this study, the U87 cell line was authenticated using
STR profiling (data not shown). As described in our previous study
(17), cells were maintained in
DMEM (cat. no. DZPYG0051; Wuhan Boster Biotechnology Co., Ltd.)
containing 10% FBS (Gibco; Thermo Fisher Scientific, Inc.), 100
U/ml penicillin and 50 µg/ml streptomycin at 37°C in a humidified
CO2 incubator (5% CO2, 95% air).
For glioma primary cultured cells, the Human Tumor
Dissociation kit (cat. no. 130-095-929; Miltenyi Biotec GmbH) was
used with the gentleMACS™ Dissociator (cat. no. DXT-130-096-730;
Miltenyi Biotec GmbH) to enzymatically digest the tissues, and
human Anti-Fibroblast MicroBeads (cat. no. 130-050-601; Miltenyi
Biotec GmbH) were used to filter the tissue lysates. For each
experiment, tissues from one patient were used. In order to obtain
enough prolactinoma tissues for primary culture, only huge and
invasive prolactinoma tissues were selected. Following surgery,
tumor specimens were placed in complete DMEM on ice and transferred
to the lab. Fresh resected brain glioma tissues were washed in PBS
at 37°C. Then, 1 ml Human Tumor Dissociation reagent (cat. no.
130-095-929; Miltenyi Biotec, Inc.) was added, the tissues were
placed into a 37°C CO2 incubator for 60 min, and the
suspension was pipetted every 10 min. To obtain adenoma cell
preparations deprived from rapidly dividing fibroblasts, dispersed
cells were filtered through a magnetic bead column coated with
human Anti-Fibroblast MicroBeads (cat. no. 130-050-601; Miltenyi
Biotec GmbH), according to the manufacturers instructions. The
tissue-digested solution was filtered using a 40-µm steel mesh. The
cell suspensions were cultured in DMEM containing 10% FBS and 100
U/100 µg/ml penicillin-streptomycin in a humidified incubator at
37°C with 5% CO2.
CD133+ cell isolation
As described in our previous study (17), U87 cells, U251 cells or human glioma
primary culture cells were isolated using CD133 magnetic
microbeads. The cell suspensions were collected, washed with PBS
and incubated with magnetic microbeads conjugated with the
anti-CD133 antibody at 20 µg/ml and 4°C for 30 min.
CD133+ cells were isolated using CD133 (cat. no.
130097049; Miltenyi Biotec GmbH). The QuadroMACS™ Separation Unit
(Miltenyi Biotec GmbH) was used for isolation. Prior to
purification, the MACS® (25 LD columns; Miltenyi Biotec
GmbH) columns were filled with warmed (37°C) RPMI (cat. no.
PYG0006; Wuhan Boster Biotechnology Co., Ltd.) or PBS. When the
purification was conducted in order to synchronize the culture, the
experimentation was performed under sterile conditions. The cells
were digested and scattered, cells were then deposited on the top
of the column (typically, 1 ml at 25–50% hematocrit), which was
held in a Quadro MACS® magnetic support (cat. no.
130-091-051; Miltenyi Biotec GmbH). The column was removed from the
magnetic support, a further 4 ml culture medium was added and the
eluent was recovered. This eluent was then centrifuged (800 × g,
4°C for 3 min) and the supernatant was discarded. The pellet was
resuspended and cultured. The purity of the isolated cells was
confirmed via flow cytometric analysis using a Guava®
easyCyte™ 8 flow cytometer (EMD Millipore) with ModFit software 5.0
(Verity Software House). The isolated CD133+ cells were
then cultured in DMEM-Nutrient F-12 (F12) supplemented with 20
ng/µl hEGF, 20 ng/µl bFGF (both from Gibco; Thermo Fisher
Scientific, Inc.), 1× B27 and 100 U/100 µg/ml
penicillin-streptomycin in a humidified incubator at 37°C with 5%
CO2.
Cell transfection
pPLK/GFP+Puro-GASC1 short hairpin (sh)RNA (cat. no.
23081), pPLK/GFP+Puro non-targeting control vector,
pIRES2-EGFP-NOTCH1 system (cat. no. PPL00782-2a) and pIRES2-EGFP
lentiviral interference control vector (cat. no. 6029-1) were
obtained from Geneppl Biotechnology Co., Ltd. A total of
2×10⁵ glioma primary culture cells in DMEM were seeded
into 6-well plates and cultured till they reached ~70% confluence.
The cells were then transfected with 100 nM control or sample shRNA
using the Lipofectamine® 3000 (cat. no. L3000001; Thermo
Fisher Scientific, Inc.) transfection reagent, following the
manufacturers instructions. Briefly, 25 µl Opti-MEM™ I medium (cat.
no. L3000001; Thermo Fisher Scientific, Inc.) and 1.5 µl
Lipofectamine 3000 reagent were mixed in tube 1. Next, 25 µl
Opti-MEM I medium, 250 ng DNA (2.5 µg/µl) and 0.5 µl P3000™ reagent
were mixed in tube 2. Then, tube 2 solution was added to tube 1 and
mixed well. The mixture was incubated at room temperature for 15
min and 50 µl complex (tube 1 and 2) was added to cells. The plate
was gently swirled to ensure homogeneous distribution of complex to
the entire well. After 12 h, the medium was replaced with fresh
medium. The next day, the cells were selected using puromycin (2
mg/ml) for at least 3–4 days. A total of 48 h after transfection,
cells were evaluated for further experiments.
Cell proliferation assay
A Cell Counting Kit-8 (CCK-8) kit (Roche
Diagnostics) was used for the cell viability assay according to the
manufacturers instructions. Cells (1×10³ cells/well)
were transiently transfected and seeded in 96-well plates overnight
at 37°C, and then treated with stimulants for 3 days. CCK-8 (10 µl)
was then added and the cells were incubated at 37°C for a further 4
h. Colorimetric absorbance was measured at 450 nm using an ELISA
microplate reader, with six replicates per experimental sample.
Tumorsphere formation assay
GSC growth medium was prepared by combining DMEM/F12
medium with B27 supplement (final concentration, 1×), EGF (final
concentration, 20 ng/ml), bFGF (final concentration, 10 ng/ml) and
penicillin/streptomycin (final concentration, 1×). Tumorsphere
formation assays were performed on CD133+ cells in
96-well plates in growth medium. A cell count was performed using
Trypan Blue staining (room temperature for 4 min) and a
hemocytometer. Single tumorsphere cells were seeded at a density of
50 cells/ml in 100 µl GSC growth medium in a 96-well dish. The
cells were incubated at 37°C, 5% CO2 for 1 week to
generate clonal neurospheres. The tumorspheres were then
dissociated into single cells. Single cells from tumorspheres were
seeded at a density of 20,000 cells/ml in a 10 ml GSC growth medium
in a 10-cm culture dish. The cells were incubated at 37°C, 5%
CO2 for 5 days to generate bulk cultured tumorspheres.
The number of tumorspheres formed in each well was counted using a
light Nikon ECLIPSE E100 microscope at a magnification of ×40 or
×100.
Cell cycle and apoptosis analysis
A total of 1×10⁴ cells/plate were
transiently transfected for 24 h. The cells were then collected and
fixed in 70% ethanol overnight at −20°C. Following washing, the
fixed cells were incubated in PBS with FxCycle™ PI/RNase Staining
Solution (cat. no. F10797; Invitrogen; Thermo Fisher Scientific,
Inc.) with RNase A (0.5 mg/ml) and propidium iodide (PI; 50 µg/ml)
for 30 min at 37°C. The percentage of cells in each phase of the
cell cycle or apoptosis was quantified using a Guava®
easyCyte 8 flow cytometer (EMD Millipore) with ModFit software 5.0
(Verity Software House). Blue sub-G1 accumulation represented
apoptotic cells containing only fractional DNA content. The cells
in each group were quantified based on three independent
experiments.
Western blot analysis
Western blotting was routinely performed. Protein
extraction from cells was performed using RIPA Lysis and Extraction
Buffer (cat. no. 89901; Thermo Fisher Scientific, Inc.) following
the manufacturers protocol. Briefly, cells were washed using cold
PBS for twice. Then 1 per 75-cm2 flask containing cells
were added with 1 ml Cold RIPA Buffer on ice for 5 min and the
plate was swirled occasionally for uniform spreading. The lysate
was collected and transferred to a microcentrifuge tube. The tube
was centrifuged at ~14,000 × g for 15 min to collect the cell
debris.
Protein determination was performed using the
Pierce™ Rapid Gold BCA Protein Assay kit (cat. no. A53225; Thermo
Fisher Scientific, Inc.). First, 20 µl of each standard sample
replicate was pipetted into a microplate well, while 200 µl of the
wash buffer was added to each well. The plate was thoroughly mixed
on a plate shaker for 30 sec and subsequently incubated at room
temperature for 5 min. The absorbance at 480 nm was measured on a
plate reader. Subtracted the average 480 nm absorbance measurement
of the blank standard replicates from the 480 nm measurements of
all other individual standard and unknown sample replicates. A
standard curve was prepared by plotting the average blank-corrected
480 nm measurement for each BSA standard vs. its concentration in
µg/ml. The standard curve was used to determine the protein
concentration of each sample.
Equal quantities of protein (50 µg) were loaded onto
a 10% SDS gel, resolved using 10% SDS-PAGE, and transferred to a
nitrocellulose membrane for western blot analysis. After blocking
the membrane in 5% milk in 0.1% TBST for 1 h at room temperature,
the membranes were incubated in diluted primary antibodies
(1:1,000) overnight at 4°C. Subsequently, the membranes were washed
and incubated in HRP-labeled secondary antibodies (1:5,000) for 1.5
h at room temperature. SuperSignal West Pico ECL solution (Thermo
Fisher Scientific, Inc.) was added to the membranes to enhance the
chemiluminescent signal. Protein bands were imaged using a
FluorChemE imager (Alpha Innotech). The ImageJ analysis of the
western-blot strip grayscale value (band density) was used for
relative quantification. Average pixel intensity was obtained
following image inversion from black to white pixels using the
freeware ImageJ (1.8.0 172; National Institutes of Health).
RNA extraction and reverse
transcription-quantitative polymerase chain reaction (RT-qPCR)
For qPCR, total RNA was extracted using
TRIzol® reagent (cat. no. 15596026; Thermo Fisher
Scientific, Inc.), and 1 µg RNA was used for the RT reaction with
random primer (cat. no. 48190011; Thermo Fisher Scientific, Inc.),
dNTP mix (cat. no. 18427013; Thermo Fisher Scientific, Inc.) and
M-MuLV Reverse Transcriptase (cat. no. M0253L; New England
Biolabs). mRNA quantification was performed using a SYBR-Green
supermix (cat. no. 1708880; Bio-Rad Laboratories, Inc.). The PCR
conditions were as follows: Initial denaturation at 94°C for 2 min,
followed by 40 cycles of 94°C for 30 sec, 56°C for 30 sec, 72°C for
30 sec and 20–60 sec at 72°C. The triplicate samples were amplified
in 20 µl reactions with gene-specific primers. The mRNA abundance
for each gene of interest was normalized to that of GAPDH. The PCR
primers used were as follows: GASC1 forward,
5′-TGGATCCCAGATGCAATGA-3′ and reverse, 5′-TGTCTTCAAATCGCATGTCA-3′;
NOTCH1 forward, 5′-CCCAATGGGCAAGAAGTCTA-3′ and reverse, 5′-CAC
AATGTGGTGGTGGGATA-3′; Gli1 forward, 5′-CCTTTA GCAATGCCAGTGACC-3′
and reverse, 5′-GAGCGAGCT GGGATCTGTGTAG-3′; Hes1 forward,
5′-AGTGAAGCACCTCCGGAAC-3′ and reverse, 5′-TCACCTCGTTCATGC ACTC-3′;
β-catenin forward, 5′-AAAATGGCAGTGCGT TTAG-3′ and reverse,
5′-TTTGAAGGCAGTCTGTCTGA-3′; GAPDH forward, 5′-GAACATCATCCCTGC
CTCTACT-3′ and reverse, 5′-CGCCTGCTT CACCACCTT-3′.
Animals and treatments
All procedures involving mice were performed with
the approval of the Henan University of Science and Technologys
Institutional Animal Care and Use Committee and were conducted in
accordance with the National Institutes of Health Guide for the
Care and Use of Laboratory Animals (19). A total number of 16 (8 male, 8
female) nude mice were used in this study. Upon arrival, at 6 weeks
of age, animals were weighed (18–20 g), ear tagged and divided into
control, NOTCH inhibitor DAPT, GASC1 inhibitor caffeic acid (CA)
and DAPT+CA group (n=4) following a stratified randomization scheme
so that all groups had a similar body weight distribution at the
beginning. All mice were housed in type II polycarbonate cages in
individually ventilated caging systems with bedding and water and
food ad libitum with a standardized NIH-31 diet (cat. no.
LAD-NIH-31 diet, Nantong trophic company). Cages were cleaned every
week. On those occasions, mice were also examined to evaluate their
health. The animal room had a controlled 12/12-h light/dark cycle
(lights on at 6:00 am), temperature (22±2°C) and relative humidity
(45–65%). Food intake was measured by weighing the uneaten pellets.
The nude mice were acclimatized for 1 week prior to the start of
the experiment.
For the tumor grafting experiment, human glioma
tissues were digested and 1×10⁶ suspension cells were
subcutaneously injected into the flank of nude mice (n=4 for each
groups). Palpable tumors were formed after 6 days. The mice were
treated with 15 mg/kg DAPT (cat. no. D5492; Sigma-Aldrich; Merck
KGaA), 100 mg/kg CA (cat. no. 205546; Sigma-Aldrich; Merck KGaA) or
both, every 3 days for a total of eight treatments. The treatments
were administered via an intraperitoneal injection. Tumor volumes
were measured every other day. After the experiment was completed,
mice were humanely sacrificed by cervical dislocation following
CO2 inhalation. The mouse was placed in the chamber and
100% CO2 was introduced at a displacement rate of 70%
the chamber volume per min. After a lack of breathing and faded eye
color were observed, the mouse was removed from the cage, and
cervical dislocation was carried out. Tumor grafts were removed and
processed for further analysis. The experiment was carried out for
1 month. The experiment was completed in July and August 2019. No
mice died unexpectedly in the experiment.
With regards to humane endpoints, the tumor size
must not exceed 20 mm (2.0 cm) in any direction in any mice.
General criteria for euthanasia include: Weight loss >20%; tumor
size equal to 15% of body weight; tumor ulceration; discharge or
hemorrhage from tumor; tumor interferes with normal body functions,
including but not limited to ambulation, eating, drinking,
defecation or urination; tumor negatively affects animals gait or
posture independent of tumor size; labored breathing; lack of
movement; hypothermia and self-mutilation.
Immunohistochemical staining
Tissue sections were fixed with 10% neutral buffered
formalin (cat. no. DF0111; Beijing Leagene Biotechnology Co., Ltd.)
overnight at room temperature followed by embedding in paraffin
wax. Section thickness is 5 µm. Following antigen retrieval and
blocking with 10% goat serum at room temperature for 1 h, tumor
tissues were incubated with Ki67, GASC1 and S100 (diluted 1:100)
overnight at 4°C. The slides were then incubated with biotinylated
anti-rabbit IgG secondary antibody (cat. no. PK-7200; 1:1,000;
Vectastain Elite ABC-HRP kit; Vector Laboratories, Inc.) for 30 min
at room temperature, followed by incubation in Vectastain Elite ABC
Reagent for 30 min at room temperature. For all slides, a
diaminobenzidine detection kit (Vector Laboratories, Inc.) was used
according to the manufacturers protocol. For hematoxylin and eosin
staining, sections were cleaned with distilled water. Nuclei were
stained with Meyers hematoxylin for ~5 min then rinsed with tap
water and stained with eosin for 2 min at 37°C. Cells were rinsed
with tap water, dehydrated and mounted. Slides were observed and
imaged using a light Nikon ECLIPSE E100 microscope at a
magnification of ×40 or ×100.
Invasion Transwell and clonogenic
assays
After glioma cells grew to 70–90% confluence, cells
were serum-starved for 24 h and then diluted at a cell
concentration of 1×10⁵ cells/ml. Cell suspension (500
µl; 5×10⁴ cells) was added into the upper Transwell
chamber, and 600 µl 10% FBS-DMEM was pipetted into the lower
Transwell chamber. Transwell plates were then cultured in the
Matrigel-coated inserts in a humidified incubator (37°C, 5%
CO2) for 48 h. Non-migrated cells on the upper side of
the membrane were removed using a cotton swab. The cells were then
fixed with 1 ml methanol at room temperature for 20 min and stained
with 0.1% crystal violet for 10 min at room temperature. In total,
six fields per Transwell were imaged using an inverted microscope
at ×10 magnification, and the migrated cells on the lower site of
the membrane were counted. Each condition in the experiment must be
performed at least in duplicate.
For the clonogenic assay, after glioma cells grew to
70–90% confluence, cells were serum-starved for 24 h and then
diluted at a cell concentration of 1×10⁵ cells/ml. Cells
were seeded into 6-well plates at a density of 500 cells/well and
then cultured for 5 days, followed by crystal violet staining for
20 min at room temperature. The cells were washed twice with PBS
and the blue colonies were counted using a light Nikon ECLIPSE E100
microscope at a magnification of ×10. The data were expressed as %
survival relative to the control. Each condition in the experiment
was performed at least in duplicate.
Wound healing assay
Cells (1×10⁵) were incubated with 10
µg/ml mitomycin C at 37°C for 2 h, seeded into a 24-well tissue
culture plate and cultured in DMEM/F12 medium containing 10% FBS
(20). After glioma cells grew to
70–80% confluence a monolayer wound was made by gently and slowly
scratching the monolayer with a new 1-ml pipette tip across the
center of the well. Following scratching, the well was gently
washed twice with medium to remove the detached cells. The well was
replenished with fresh serum-starved medium. Cells were cultured
for an additional 48 h. the cells were fixed with 4%
paraformaldehyde for 30 min and stained with 0.1% crystal violet
for 30 min at room temperature. Images of the stained monolayer
were captured on a light Nikon ECLIPSE E100 microscope at a
magnification of ×10. The same configurations of the microscope
were used when capturing images for different views of the stained
monolayer. The gap distance was quantitatively evaluated using
ImageJ software (1.8.0 172 version; National Institutes of Health),
and each experiment was repeated in triplicate.
Sphere formation assay
A total of 1 ml cell suspension (1×10³
cells) was plated per well in triplicate in a 24-well Corning
ultra-low attachment plate in DMEM/F12 medium, supplemented with 10
µg/ml insulin (Sigma-Aldrich; Merck KGaA), 1 µg/ml hydrocortisone
(Sigma-Aldrich; Merck KGaA), 1X B27 (Thermo Fisher Scientific,
Inc.), 20 ng/ml EGF, 20 ng/ml bFGF and 4 µg/ml heparin (all from
Stemcell Technologies, Inc.). After 24 h, parental or
NOTCH1-overexpressing CD133+ U87 or U251 cells were
cultured with GASC1 inhibitor CA (10 µm) in the presence or absence
of NOTCH1 inhibitor DAPT (10 µm) for 7 days to form primary
spheres. Cells were nourished every 3 days through the addition of
50–100 µl medium per well. Sphere formation was determined by
dividing the total number of spheres by the number of cells plated.
Primary sphere assays were performed in at least triplicates.
Statistical analysis
Data analysis was performed using GraphPad Prism 8
software (GraphPad Software, Inc.). An unpaired Students t-tests
were used to compare continuous variables between two groups.
One-way ANOVA followed by Duncans new multiple range test or
One-way ANOVA followed by Tukeys post hoc test was used to assess
differences between multiple groups. All statistical data were
derived from ≥3 independent biological replicates. Data are
presented as the mean±SD or SEM. P<0.05 was considered to
indicate a statistically significant difference.
Results
An elevated GASC1 expression is
associated with malignancy grade and stemness of glioma
tissues
Based on certain pathological characteristics,
gliomas are classified into four grades (WHO grades I, II, III and
IV). Grade I or II tumors are low grade astrocytomas, grade III
tumors are anaplastic astrocytomas, and grade IV tumors are
glioblastomas multiforme (21,22).
To determine the correlation between GASC1 expression levels and
clinicopathological parameters in glioma tissues, fresh glioma
samples were collected from 18 patients undergoing resection in
Neurosurgery Department. There were 6 grade IV, 6 grade III and 6
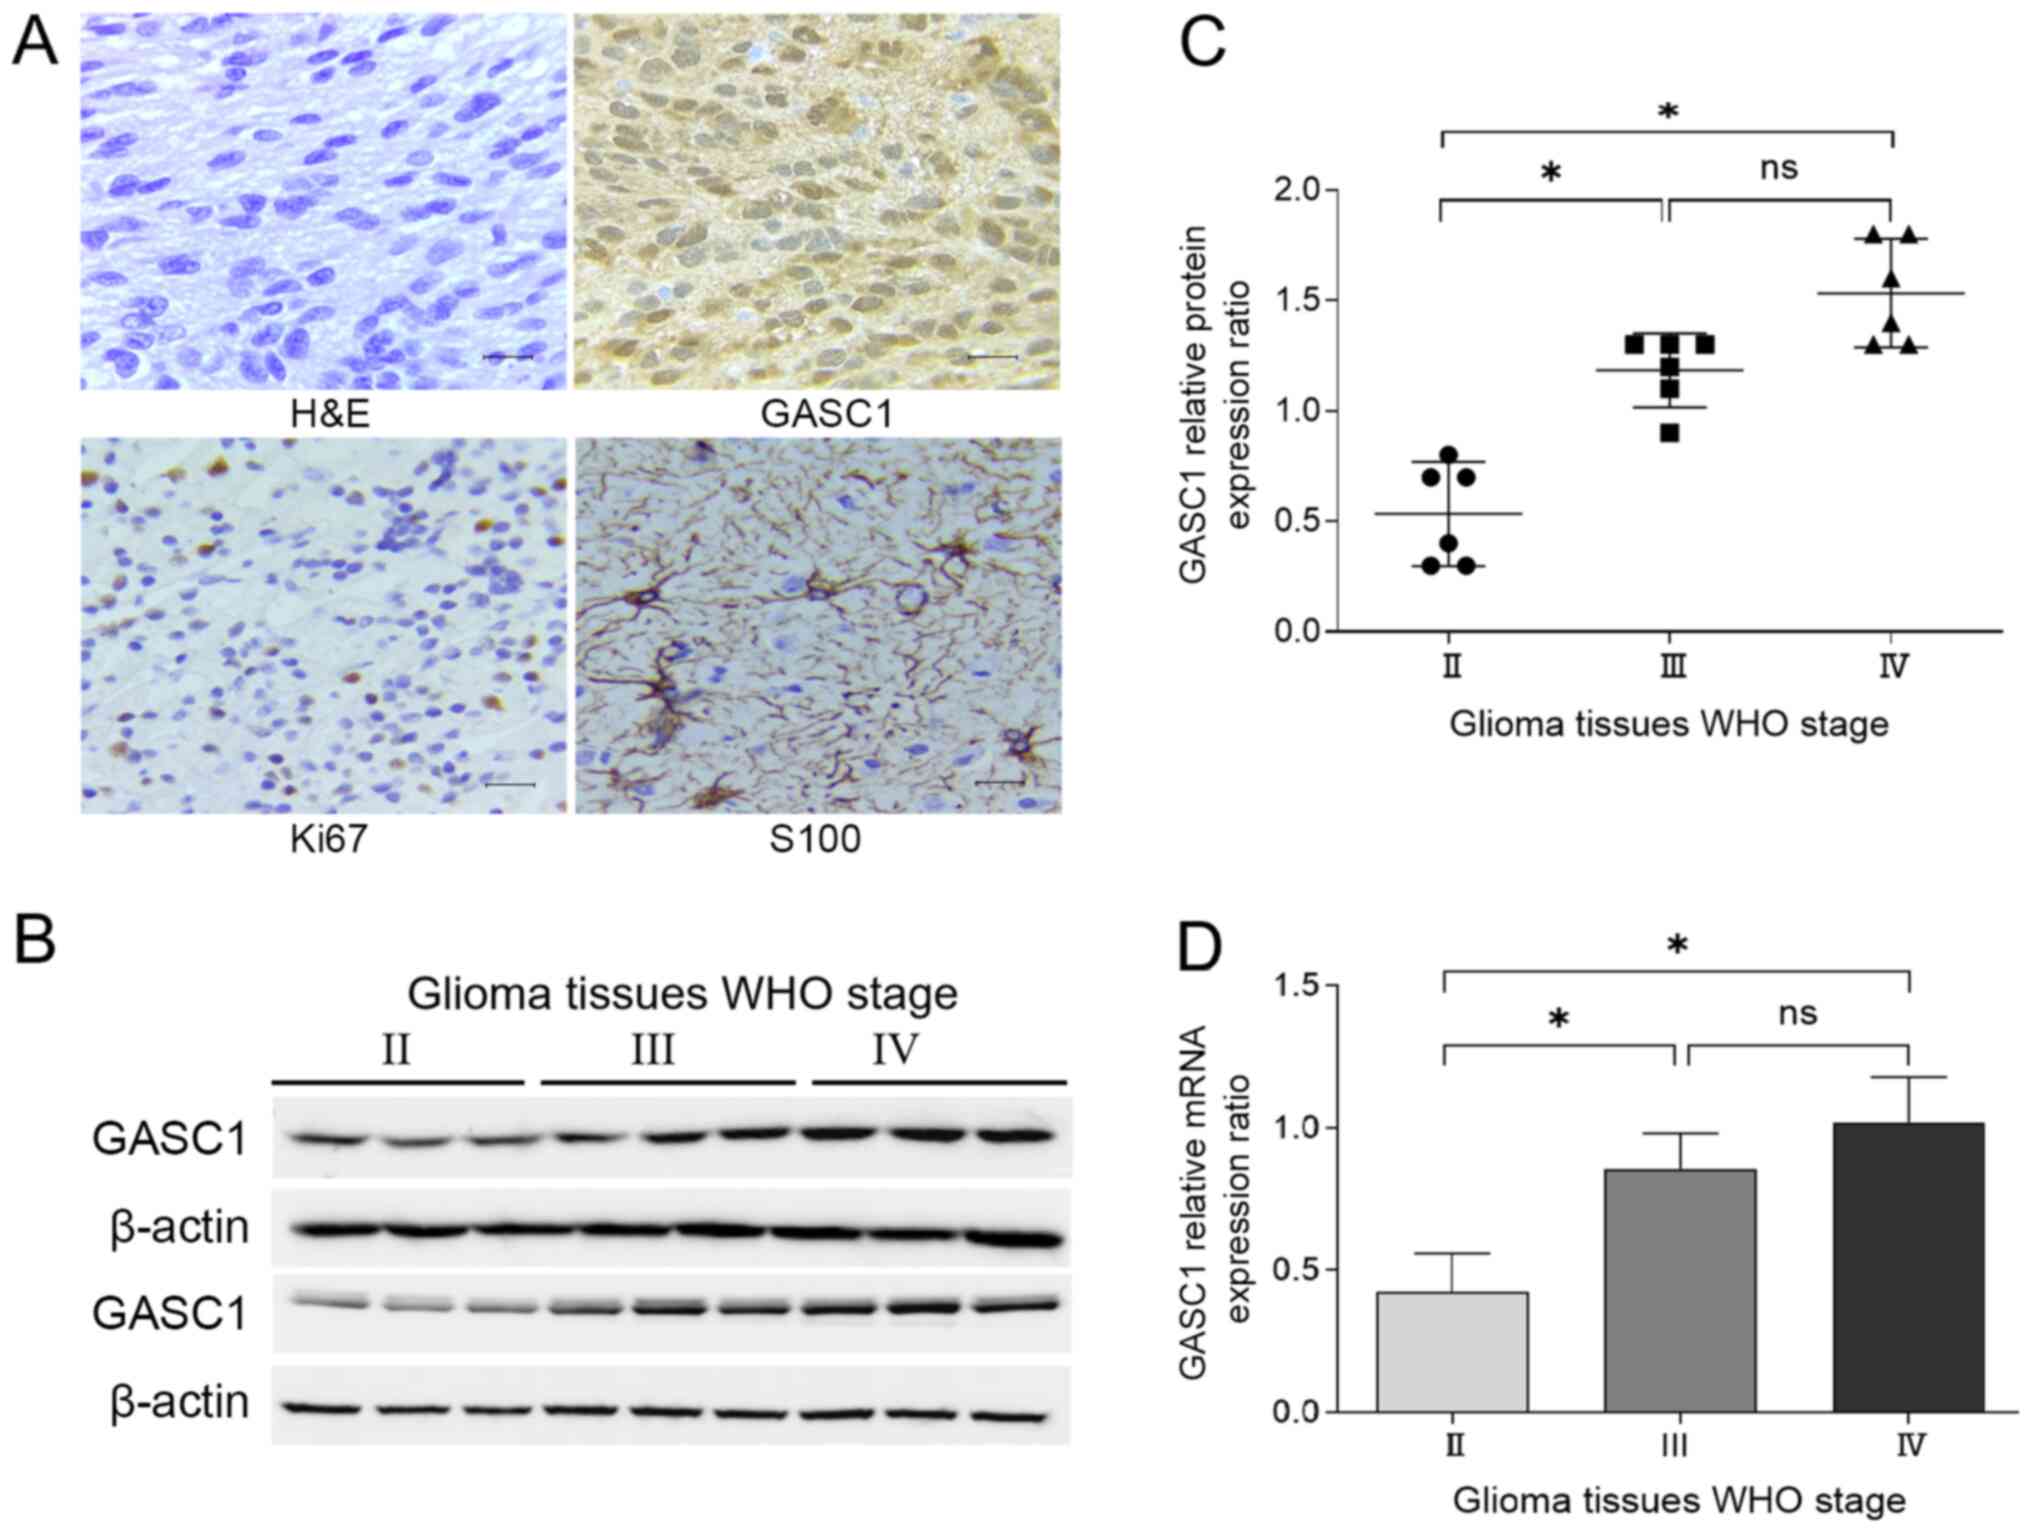
grade II glioma tissues. Immunohistochemical and hematoxylin and
eosin staining was performed on these specimens (Fig. 1A). In the present study, GASC1
expression was primarily immunolocalized in the nuclei and
occasionally present in the cytoplasm. Since GASC1 is a nuclear
protein, only the GASC1 nuclear expression was analyzed via
immunohistochemical staining. The GASC1 protein expression was also
examined via western blotting, and higher GASC1 protein expression
levels were observed in WHO grade III and IV glioma tissues, as
compared to Grade II glioma tissues (Fig. 1B and C). WHO grade III and IV glioma
tissues displayed a higher GASC1 nuclear expression compared with
Grade II tumors. However, no significant difference in the GASC1
expression levels was identified between WHO grade III and IV
glioma tissues (Fig. 1B and C). In
addition, in the immunohistochemical staining, a positive GASC1
immunohistochemical nuclear staining and cytoplasm staining was
found in all WHO grade III and IV glioma tissues. However, a low
level of GASC1 positive staining was observed in the nuclei and
cytoplasm of some Grade II tumors. Since GASC1 staining was
identified mainly in the nuclei and occasionally in the cytoplasm,
the results of the nuclear immunohistochemical staining may be more
convincing compared with those of western blotting.
The GASC1 mRNA expression levels were also examined.
RT-qPCR analysis demonstrated a higher mRNA expression of GASC1 in
grade III and IV glioma tissues compared with grade II tumors
(Fig. 1D). In combination, these
results indicated that a high malignancy in grade glioma tissue
(WHO grade III and IV) was associated with a high GASC1
expression.
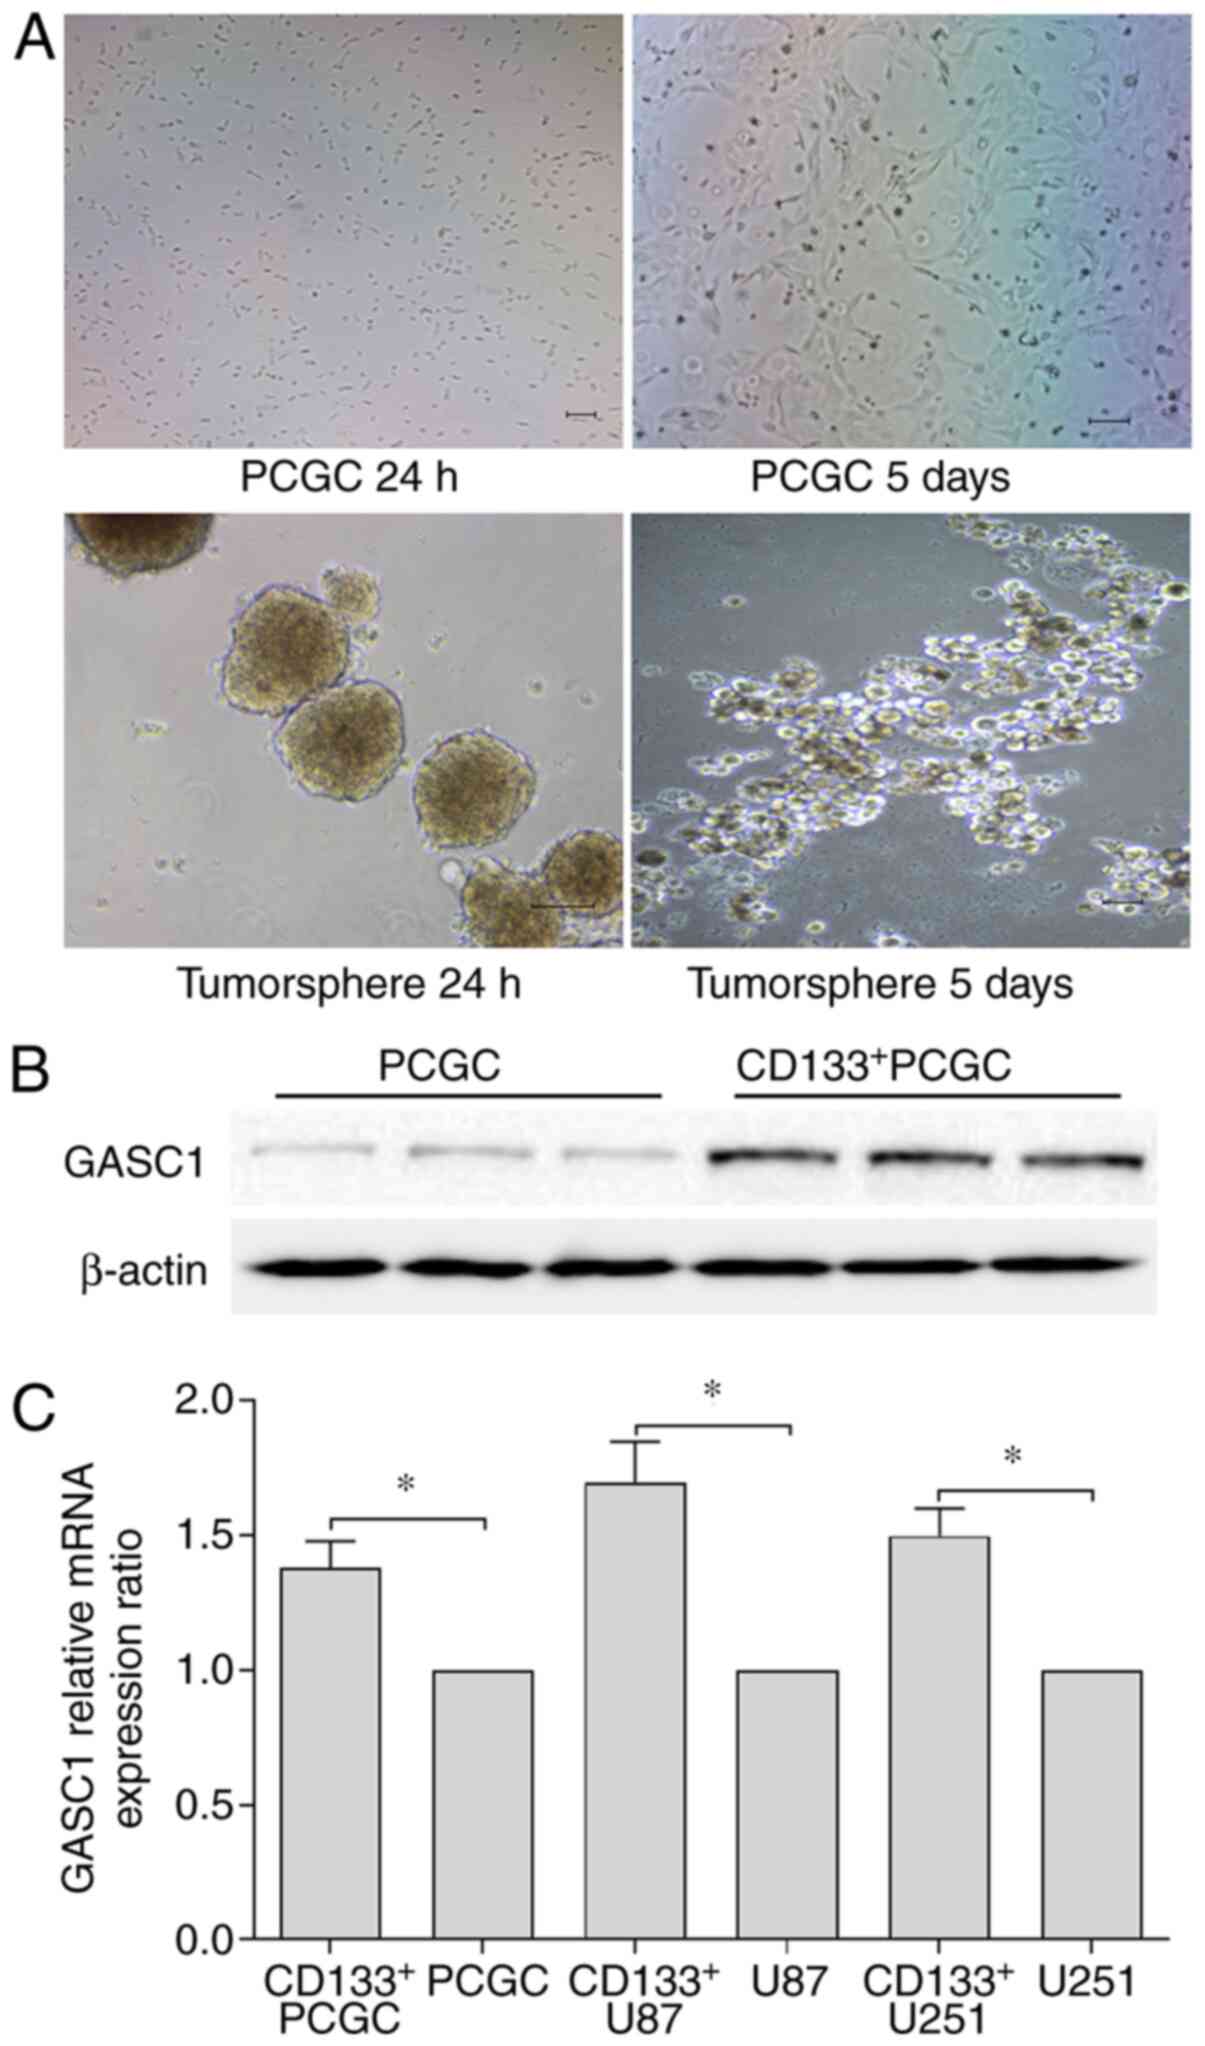
In the present study, primary human glioma cells
were isolated from human glioma tissues, and GSCs were sorted using
CD133 magnetic cell separation. CD133+ isolated cells in
the present study formed neurospheres. As confirmed in our previous
study (17), the neurospheres can
be dissociated and cultured for ≥3 passages. The cells
differentiated into cells adherent to the culture plate and grew in
a monolayer following culture with regular cell culture medium
(Fig. 2A). This observation
suggested that CD133+ isolated glioma cells have, at
least to some extent, the following cancer stem-like cell
properties: Self-renewal and self-differentiation abilities.
Following isolation, the GASC1 protein expression was further
analyzed, and higher GASC1 protein expression levels were observed
in CD133+ isolated primary culture human glioma cells,
as compared with their parental cells (Fig. 2B). As expected, RT-qPCR results
identified significant differences in the GASC1 mRNA expression
levels between the CD133+ isolated glioma cells and
their parental primary culture human glioma cells (Fig. 2C). Moreover, higher mRNA expression
levels of CD133+ U87 and U251 were observed in glioma
cells, as compared with their parental cells (Fig. 2C). These results indicated that the
GASC1 protein may be associated with glioma stemness.
GASC1 inhibition suppresses the
viability and migration of glioma cells
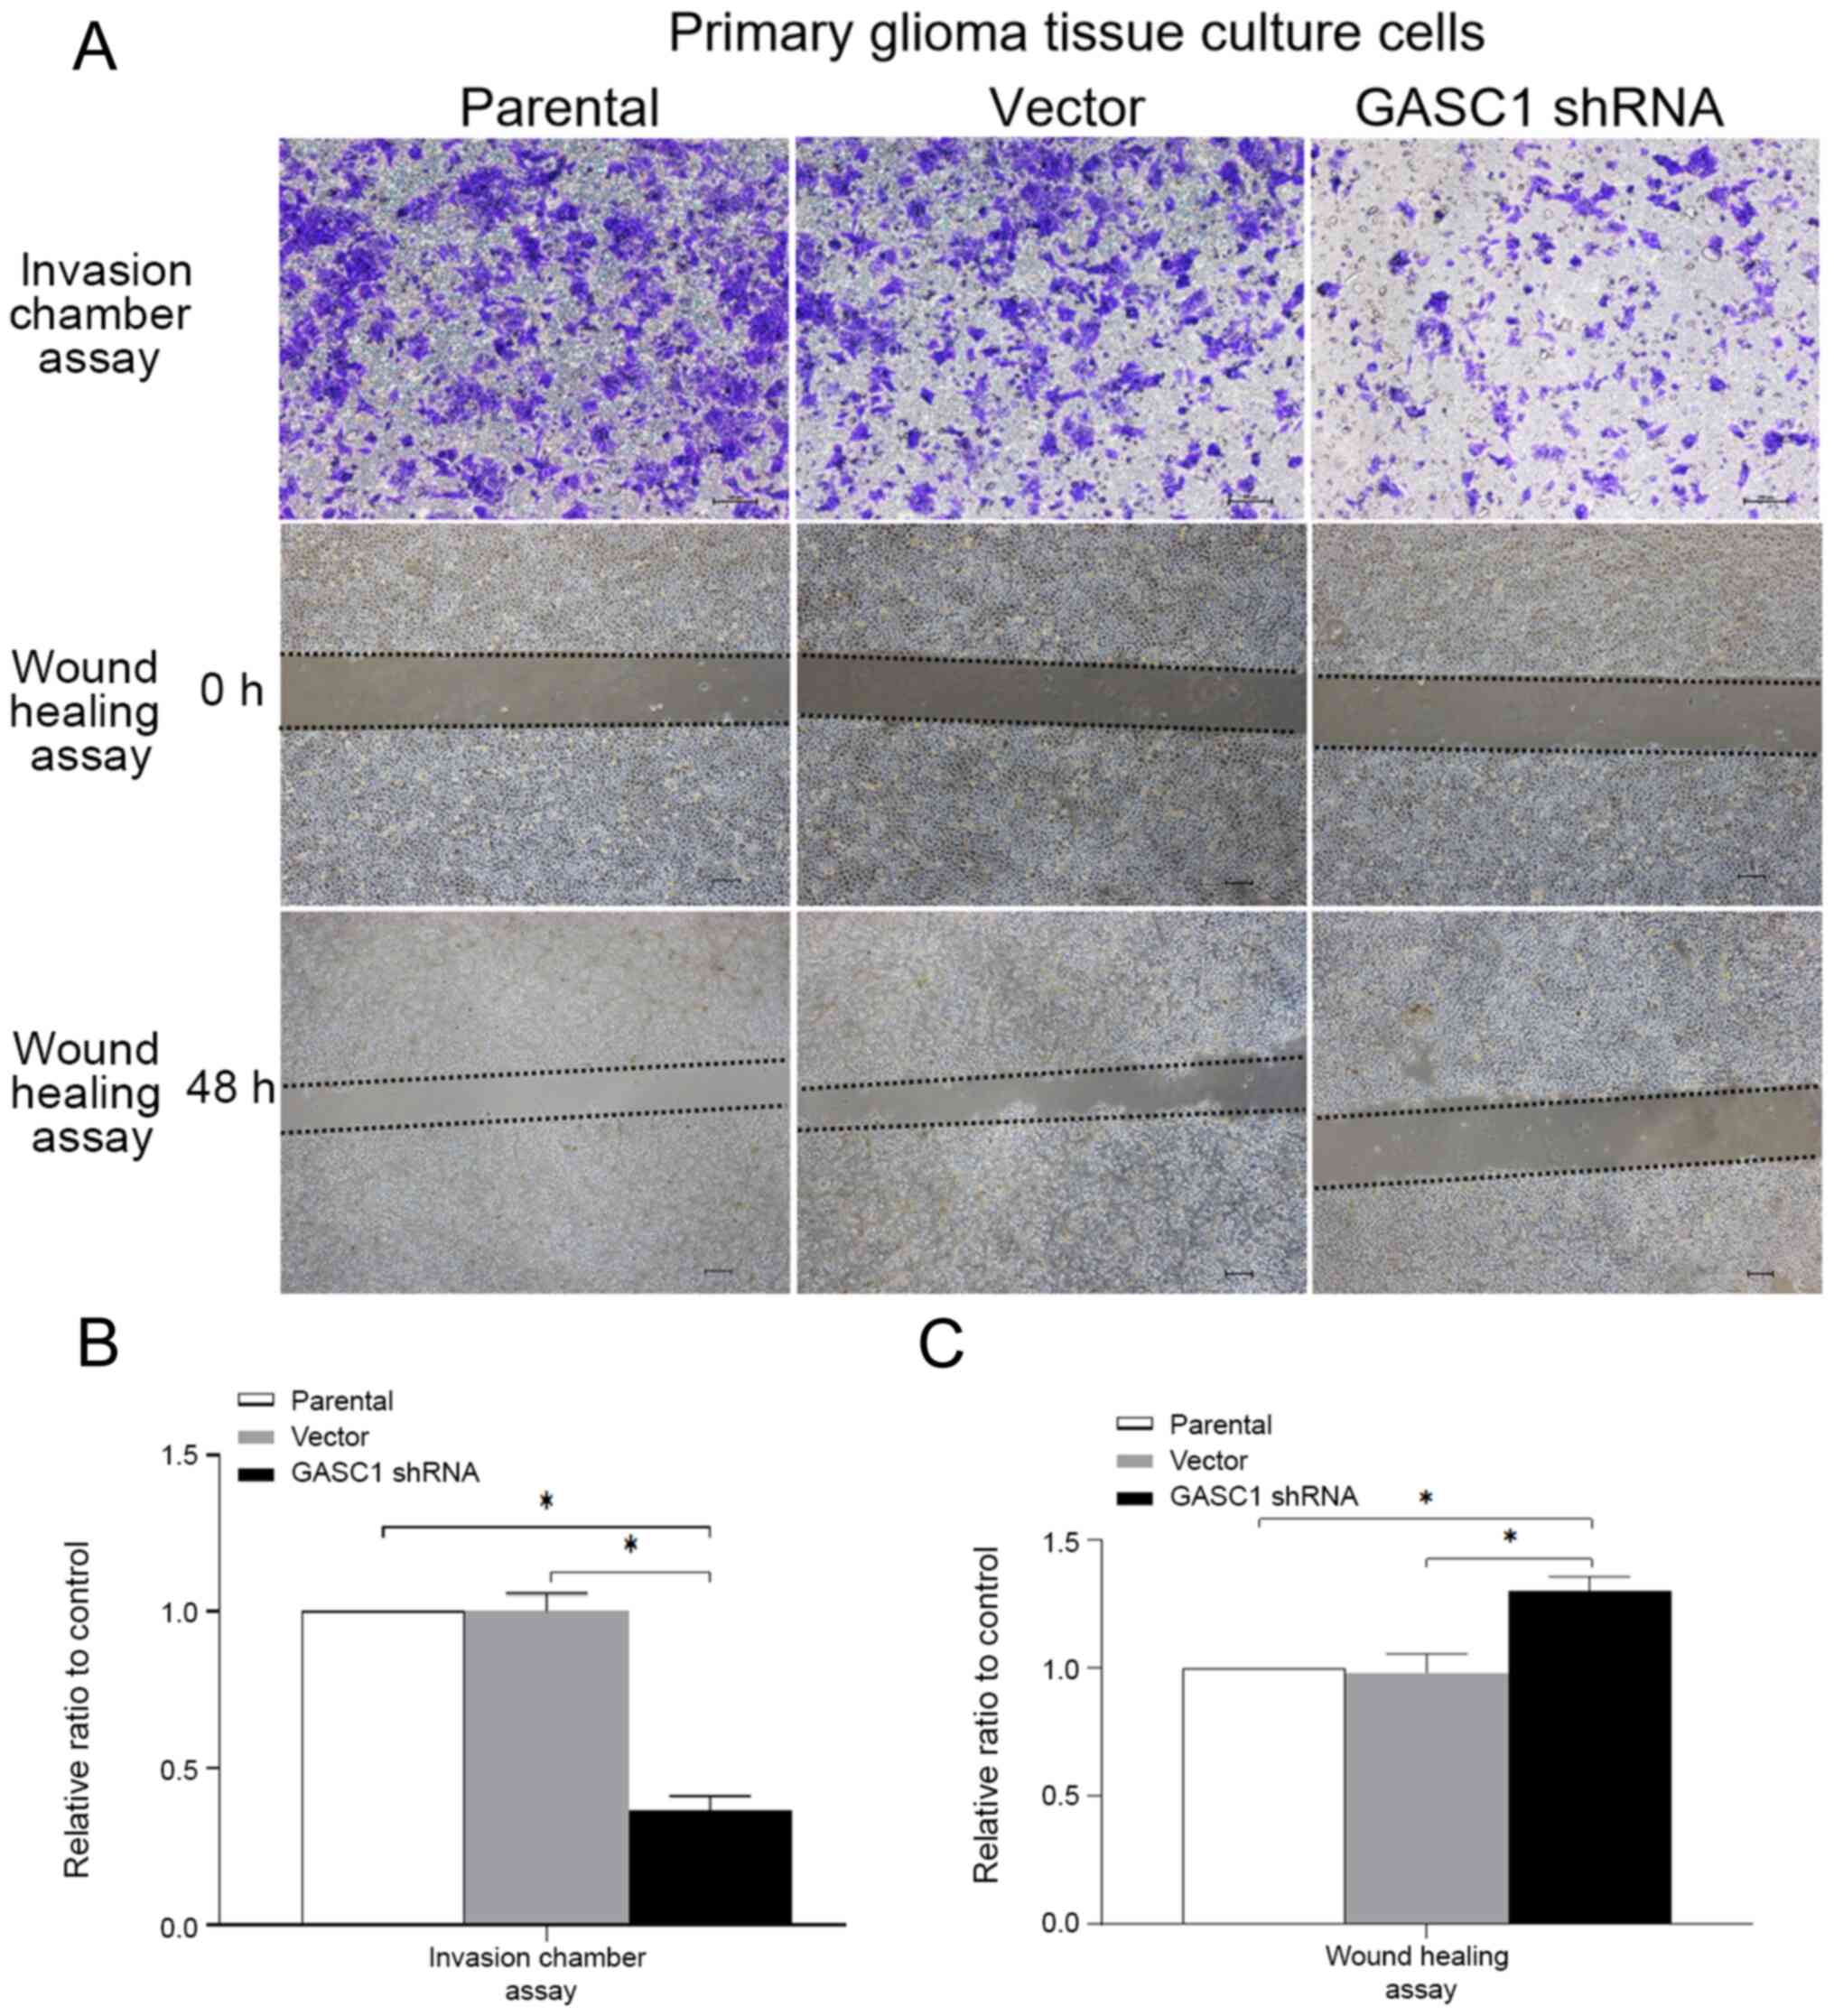
To further investigate the association between GASC1
expression and glioma progression, a CCK-8 assay was used to
examine the effect of the GASC1 inhibition on the viability of
primary culture human glioma cells. GASC1 was knocked down using
shRNA, and this significantly decreased the viability of primary
culture human glioma cells after 48 h (data not shown). The
invasive and migratory abilities of primary culture human glioma
cells were examined using an invasion chamber assay and a wound
healing test (Fig. 3A and B). The
results demonstrated that the invasive and migratory abilities of
GASC1-knockdown primary culture human glioma cells were
significantly suppressed compared with the control.
GASC1 inhibition suppresses the clone
forming ability and tumorsphere formation in CD133+ U87
or U251 glioma stem-like cells
The effect of GASC1-knockdown on CD133+
GSCs was further analyzed. First, the U87 or U251 cells were
transiently transfected with GASC1 shRNA for the clone formation
assay. A lower clone forming ability was observed in U87 or U251
cells with GASC1 shRNA (Fig. 4A and
D). Furthermore, the CD133+ U87 or CD133+
U251 cells were transiently transfected with GASC1 shRNA and
examined with a tumorsphere assay and flow cytometry (Fig. 4B, C, E and F). As expected, a
decreased tumorsphere forming ability, increased apoptotic rate and
G1 phase accumulation were observed in GASC1-knockdown
CD133+ U87 or CD133+ U251 cells, as compared
with the relative control group. Collectively, these results
demonstrated that GASC1 inhibition suppresses the viability and
stemness of glioma cells.
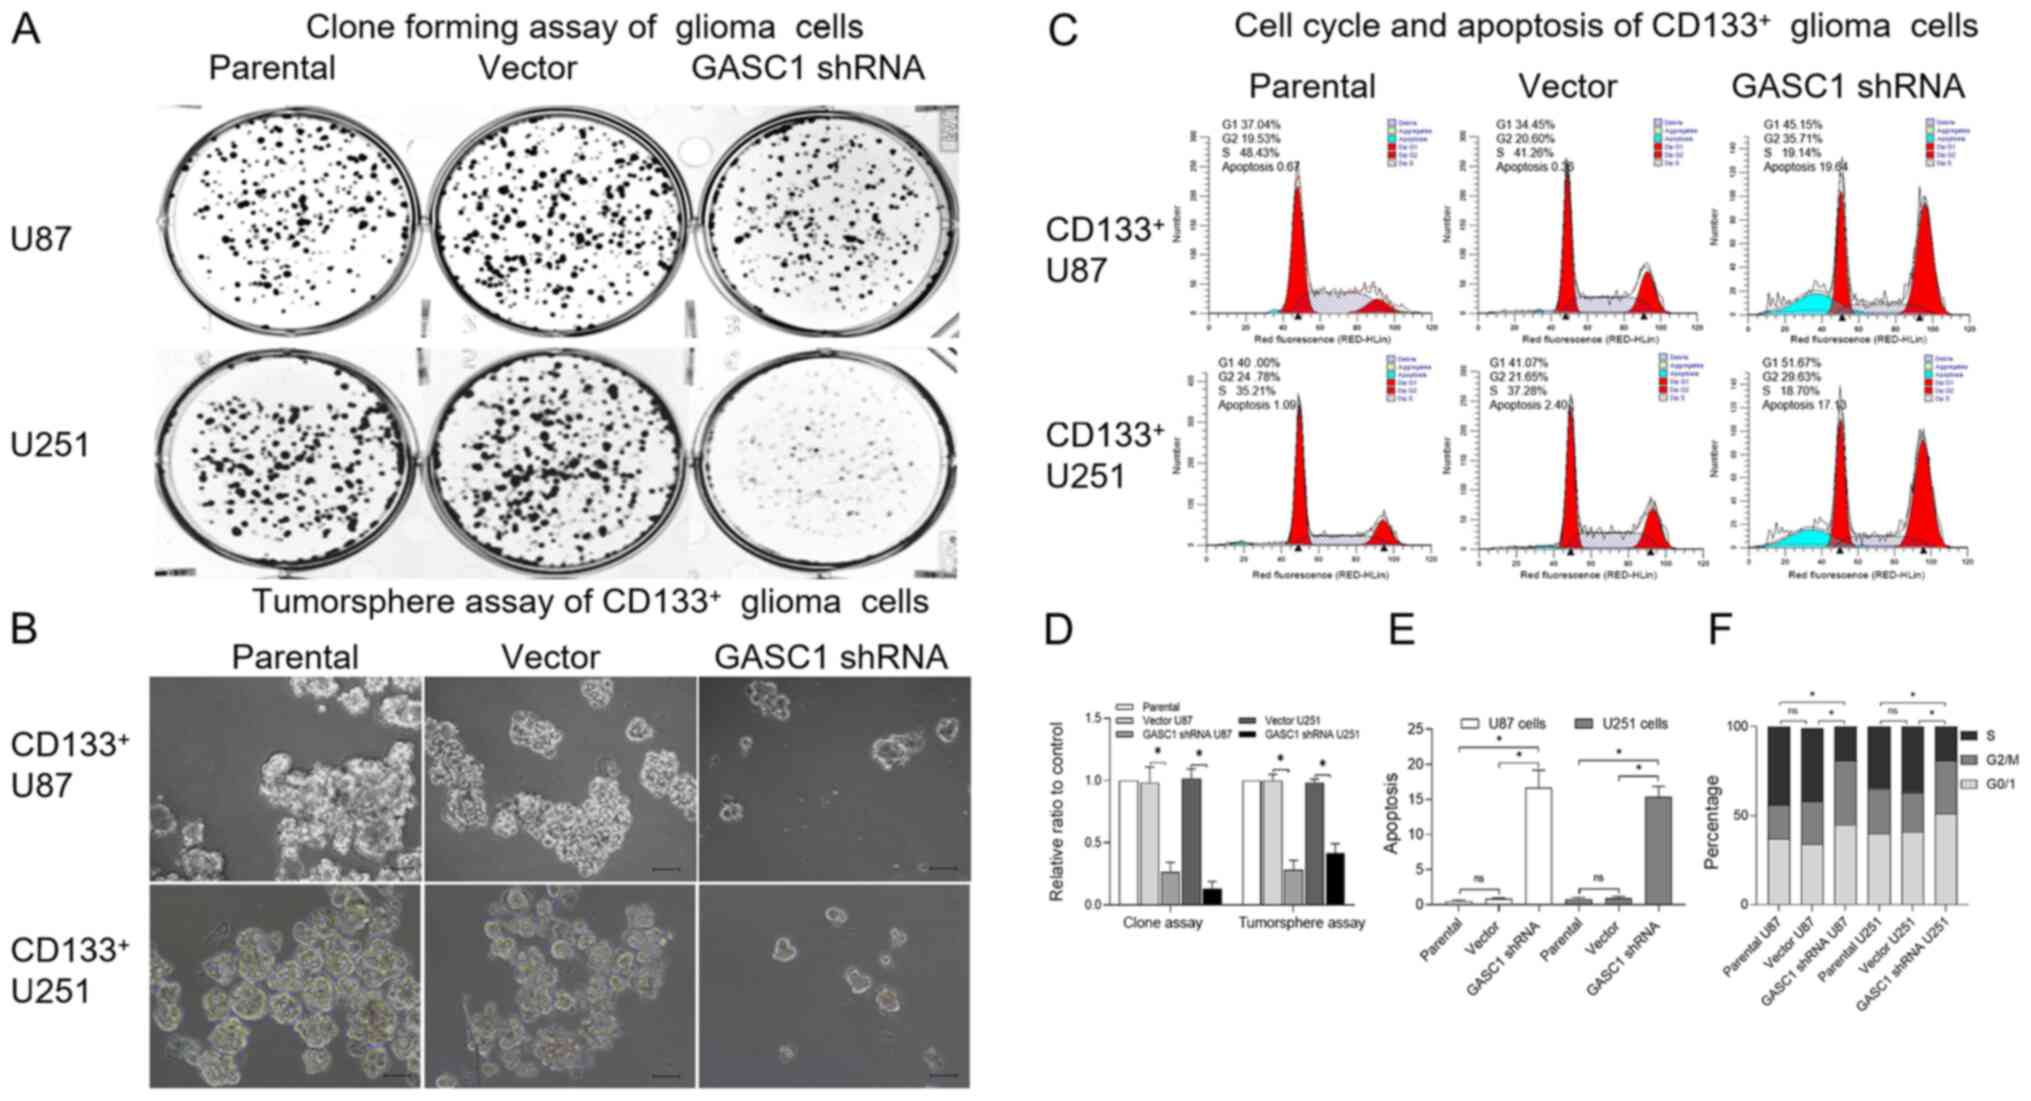 | Figure 4.GASC1 inhibition suppresses the clone
forming ability and tumorsphere formation in CD133+ U87
or U251 glioma stem-like cells. (A) Clonogenic assays examining the
effects of GASC1-knockout on cell proliferation in U87 or U251
glioma cells with or without GASC1-knockdown. Cells were seeded
into 6-well plates at a density of 500 cells/well and then cultured
for 5 days, followed by crystal violet staining. (B) Tumorsphere
assay of GASC1-knockout on CD133+ U87 or U251 glioma
cells with or without GASC1-knockdown (scale bar, 100 µm). Single
cells from tumorspheres were seeded at a density of 20,000 cells/ml
in a 10 ml GSC growth medium in a 10-cm culture dish. The cells
were incubated at 37°C, 5% CO2 for 5 days to generate
bulk cultured tumorspheres. (C) Representative flow cytometry
images of cell cycle distribution and apoptosis in
CD133+ U87 or U251 glioma cells with or without
GASC1-knockdown. (D) Quantitative analysis for stained colonies and
tumorspheres in different group panels. shRNA-mediated GASC1
silencing significantly decreased the cloning ability of U87 or
U251 glioma cells and the tumorsphere formation ability of
CD133+ U87 or U251 glioma cells. Data are expressed as
the mean±SD (n=3). Unpaired Student t-test, *P<0.05. (E)
Quantification of the percentage of G0/1, G2/M and S cells in
CD133+ U87 or U251 glioma cells with or without
GASC1-knockdown. Data are expressed as the mean±SEM (n=3). Unpaired
Student t-test, *P<0.05. (F) Quantification of the percentage of
apoptosis in CD133+ U87 or U251 glioma cells with or
without GASC1-knockdown. Data are expressed as the mean±SEM (n=3).
Unpaired Student t-test, *P<0.05. ns, non-significant; GASC1,
gene amplified in squamous cell carcinoma 1; shRNA, short hairpin
RNA. |
GASC1 inhibition-mediated suppression
of cancer cell viability is dependent on NOTCH1 activation
It is known that GSCs upregulate a number of
signaling pathways required for maintaining glioma stemness; these
signaling pathways include the NOTCH, sonic hedgehog (Shh) and Wnt
pathways (15,23). To understand the mechanism
underlying the anti-stemness of glioma cells caused by
GASC1-knockdown, the key markers of the specific pathways that are
required for maintaining GSC stemness, including Gli1 (Shh), Hes1
(NOTCH) and β-catenin (Wnt) (23–26),
were examined in control and GASC1-knockdown cells. Our results
have shown that GASC1-knockdown downregulated the expression levels
of Gli1, Hes1 and active β-catenin (Fig. 5A), suggesting that all three
pathways were affected in the CD133+ U87 or U251 cells
following GASC1-knockdown. Moreover, Our mRNA analysis has shown
that the Hes1 gene from the NOTCH1 pathway was downregulated to the
greatest extent (Fig. 5B). These
results indicated that the NOTCH1 pathway may be the main mediator
of GASC1-knockdown on the CD133+ U87 or U251 cells.
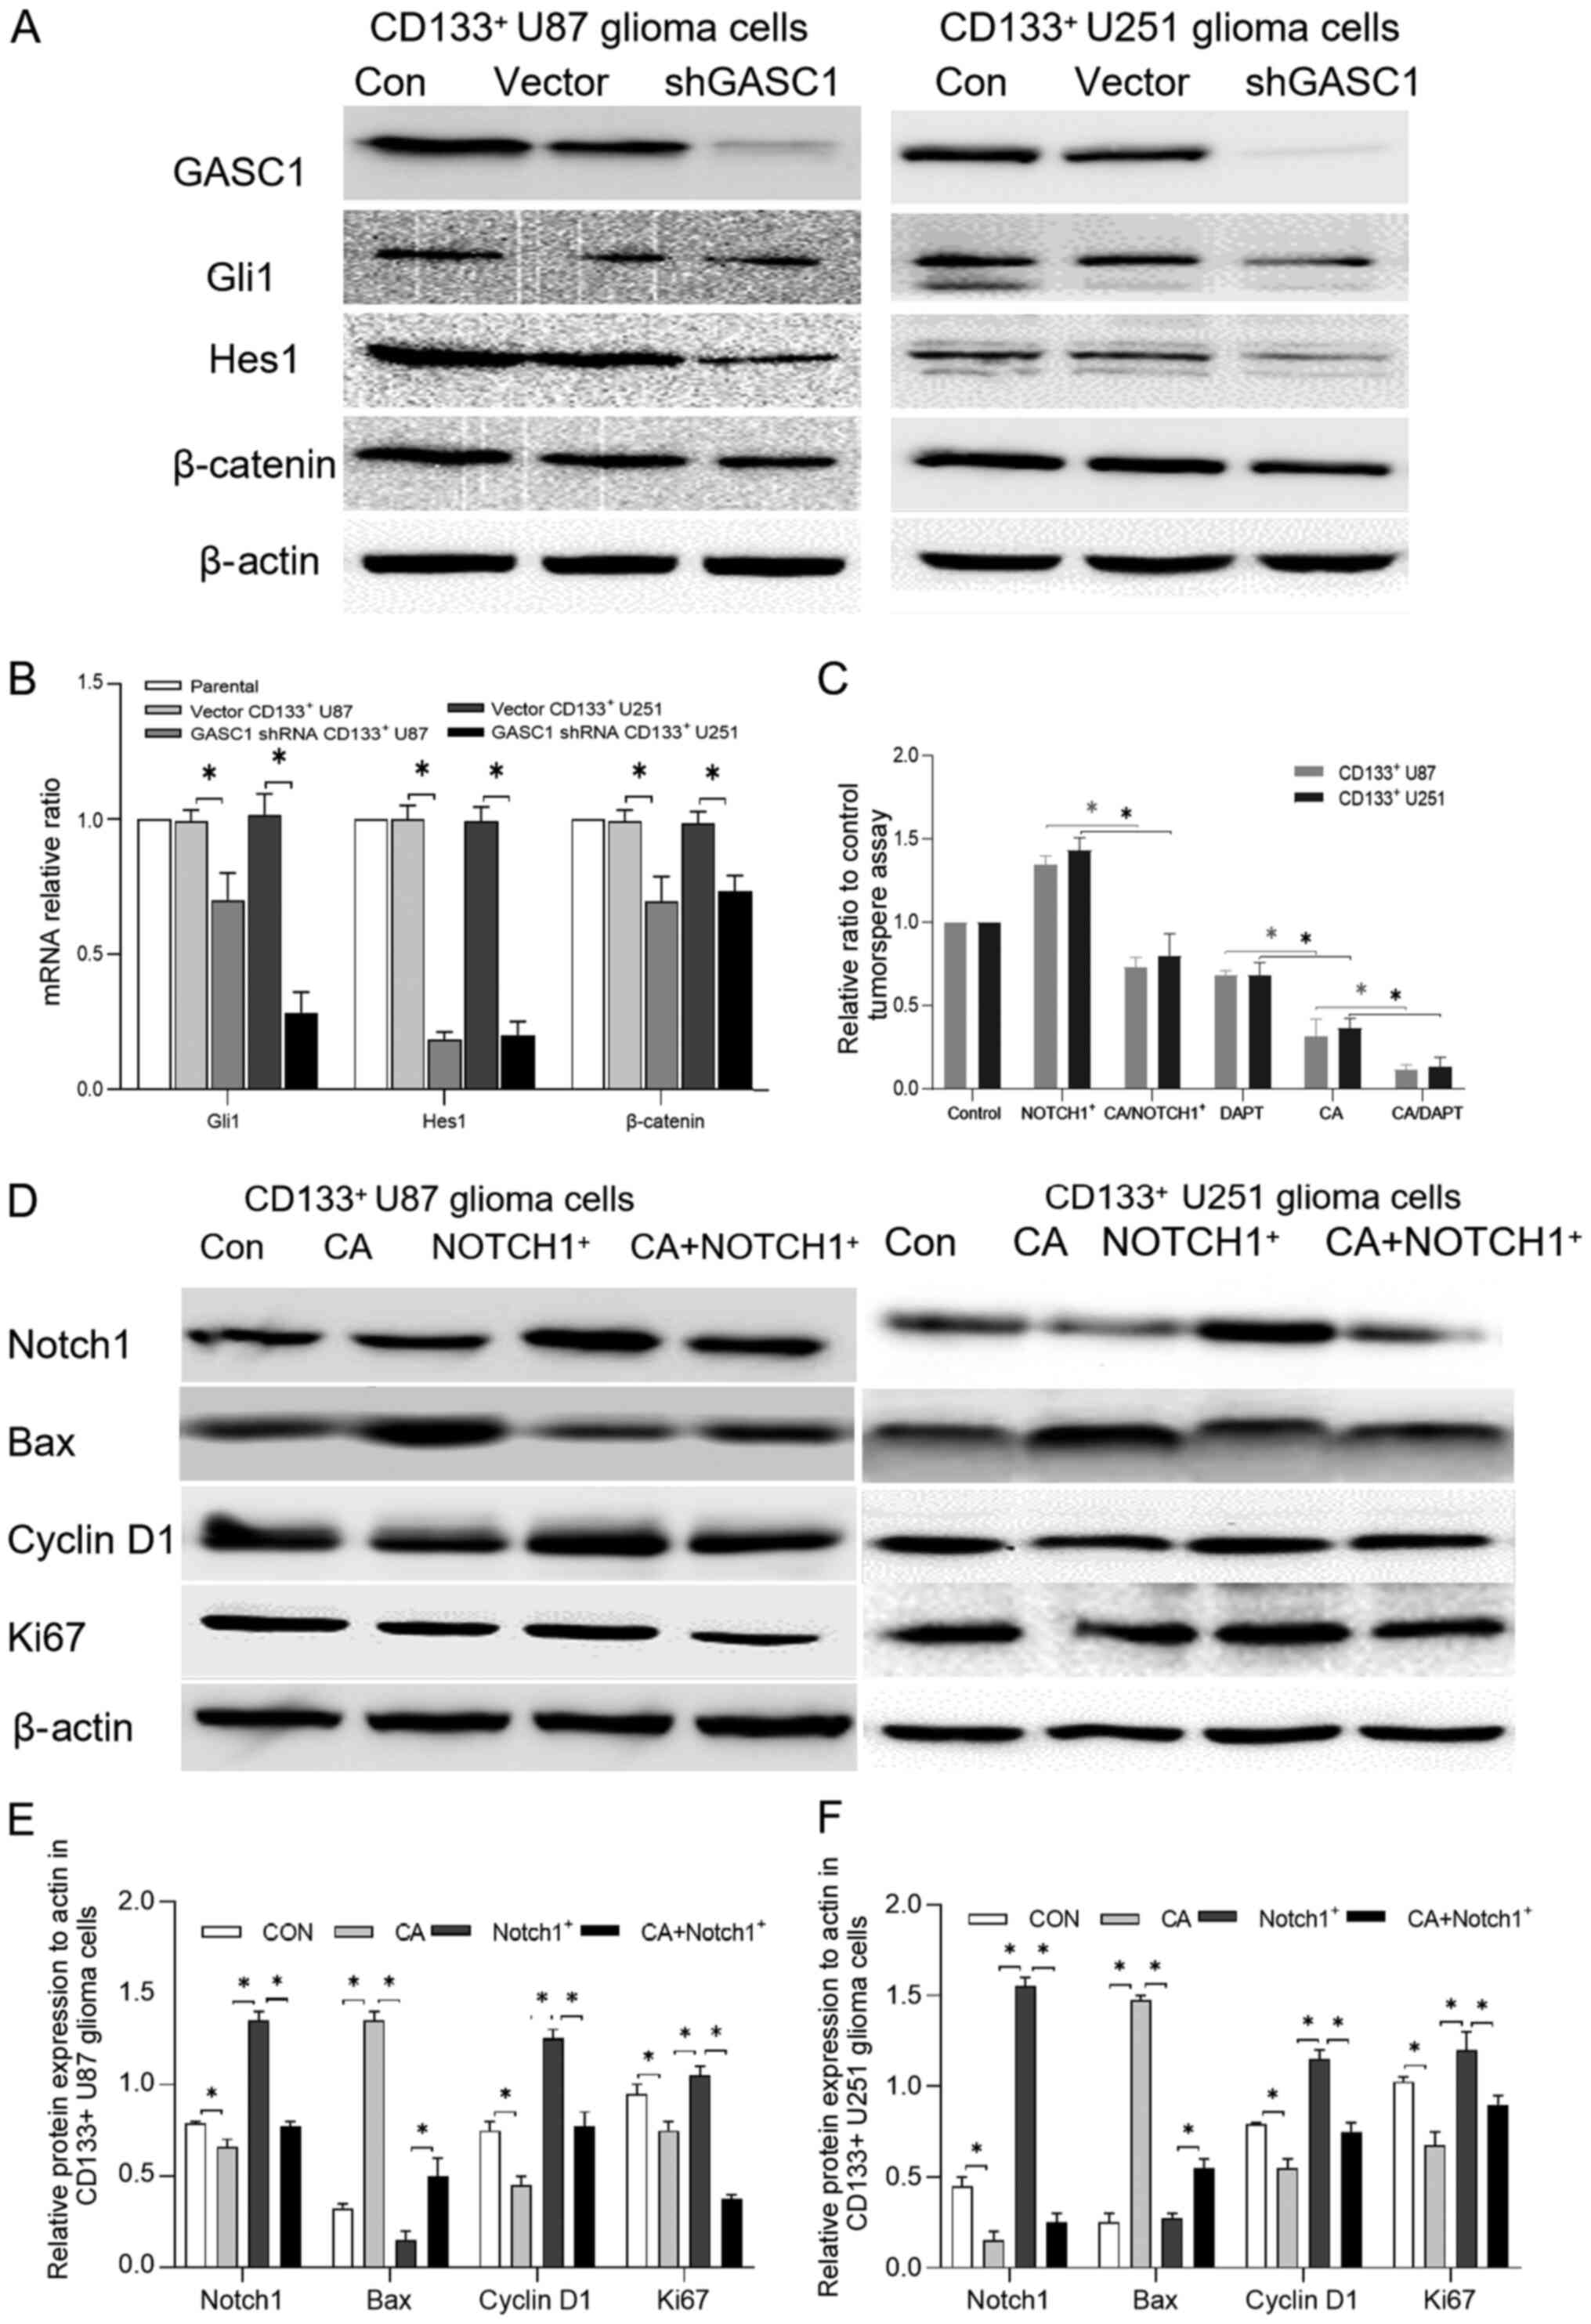 | Figure 5.Effect of GASC1 inhibition on key
markers of GSC stemness-related signaling pathways. (A) Protein
expression levels of key markers of GSC stemness-related signaling
pathways, such as Gli1 (Shh), Hes1 (NOTCH) and β-catenin (Wnt) in
GASC1-knockdown or vector CD133+ U87 or U251 glioma
cells. Decreased Gli1, Hes1 and β-catenin protein expression levels
were observed in GASC1-knockdown CD133+ U87 glioma
cells. (B) GASC1-knockdown decreased Gli1, Hes1 and β-catenin mRNA
expression levels in CD133+ U87 or U251 glioma cells. One-way ANOVA
followed by Tukey's post hoc test. (C) Effect of GASC1 inhibitor
CA, NOTCH1 inhibitor DAPT and NOTCH1 overexpression on the
tumorsphere formation ability of CD133+ U87 or U251
glioma cells. The parental or NOTCH1-overexpressing
CD133+ U87 or U251 cells were cultured with GASC1
inhibitor CA (10 µm) for 48 h for the tumorsphere assay. The
CD133+ U87 or U251 cells were also treated with GASC1
inhibitor CA (10 µm) in the presence or absence of NOTCH1 inhibitor
DAPT (10 µm) for 48 h, followed by the tumorsphere assay.
NOTCH1-overexpression partly abrogated the CA-induced tumorsphere
formation inhibition. NOTCH1 inhibitor DAPT enhanced the
suppressive effect of the GASC1 inhibitor on the tumorsphere
formation of CD133+ U87 or U251 cells. Data are
expressed as the mean±SD (n=3). Unpaired Student t-test,
*P<0.05. (D) Following overnight serum-starvation,
CD133+ U87 or U251 glioma cells transiently transfected
with vector control or NOTCH1-overexpression were stimulated with
CA (10 µM) for 48 h and the cells were harvested for western
blotting using the indicated antibodies. CA decreased the NOTCH1,
cyclin D1 and Ki67 expression levels, while increased the Bax
expression. NOTCH1 overexpression partially reversed CA-induced
Bcl-2, cyclin D1 and Ki67 downregulation (except in U87 cells) and
Bax upregulation in CD133+ U87 or U251 glioma cells.
Semi-quantification of NOTCH1, Bax, cyclin D1 and Ki67 protein
expression levels in (E) CD133+ U87 and (F) U251 glioma
cells treated with vector control, CA, NOTCH1-overexpression or CA
combined with NOTCH1-overexpression. Data are expressed as the
mean±SD (n=3). One-way ANOVA followed by Tukey's post hoc test.
*P<0.05. GASC1, gene amplified in squamous cell carcinoma 1; CA,
caffeic acid; NOTCH1, notch receptor 1. |
To determine whether NOTCH1 participates in the
regulation of the stemness of gliomas by GASC1, NOTCH1
overexpression vectors were successfully constructed. The parental
or NOTCH1-overexpressing CD133+ U87 or U251 cells were
cultured with GASC1 inhibitor CA (10 µm) for 48 h for the
tumorsphere assay. Furthermore, the cells were treated with GASC1
inhibitor CA (10 µm) in the presence or absence of NOTCH1 inhibitor
DAPT (10 µm) for 48 h, and the individual tumorspheres were then
scored. The results demonstrated that the blockade of GASC1,
including GASC1-knockdown and CA treatment, significantly decreased
the key NOTCH1 target Hes1 protein and mRNA expression levels.
NOTCH1-overexpression was found to partly abrogate the GASC1
inhibitor CA-induced inhibition of tumorsphere formation (Fig. 5C). By contrast, the NOTCH1 inhibitor
DAPT enhanced the suppressive effect of the GASC1 inhibitor on the
tumorsphere forming ability of CD133+ U87 or U251 cells
(Figs. 5C and S1). Furthermore, western blotting
demonstrated that NOTCH1-overexpression partially reversed the
CA-induced cyclin D1 and Ki67 inhibition (except for in U87 cells)
and Bax upregulation, as compared with the Notch1+ and CA+Notch1+
group (Fig. 5D-F). Moreover, CA
decreased the NOTCH1, cyclin D1 and Ki67 expression levels, while
increased the Bax expression. NOTCH1 overexpression partially
reversed CA-induced Bcl-2, cyclin D1 and Ki67 downregulation
(except for in U87 cells) and Bax upregulation in CD133+
U87 or U251 glioma cells. Collectively, these results demonstrated
that the ability of GASC1 inhibition to suppress the viability of
glioma cells is dependent, at least in part, on the activity of
NOTCH1.
Inhibition of GASC1/NOTCH1 signaling
suppresses the progression of glioma tumor-bearing mice
To evaluate the effects of the GASC1/NOTCH1
signaling activity on the growth of glioma in vivo, human
glioma primary culture cells were inoculated under the skin of nude
mice to generate a tumor-bearing mouse model. The mice were treated
with NOTCH inhibitor DAPT (15 mg/kg), GASC1 inhibitor CA (100
mg/kg) or both, every 3 days for a total of eight treatments. Tumor
measurement and Ki67 staining showed that both DAPT and CA
suppressed tumor growth, and a combination of the two decreased
tumor growth more significantly, as compared with either treatment
alone (Fig. 6). However, no
significant differences were observed between treatment with DAPT
and CA alone. Western blotting showed that the expression of Ki67
was decreased in the tumor tissues of DAPT- or CA-treated mice,
with the most significant effect observed in the DAPT+CA-treated
mice. The differences in tumor volume between the control and
DAPT+CA-treated mice were statistically significant. These data
suggested that GASC1-NOTCH1, at least to some extent, contributed
to the development of glioma in vivo and may serve as potent
therapeutic targets for the control of gliomas.
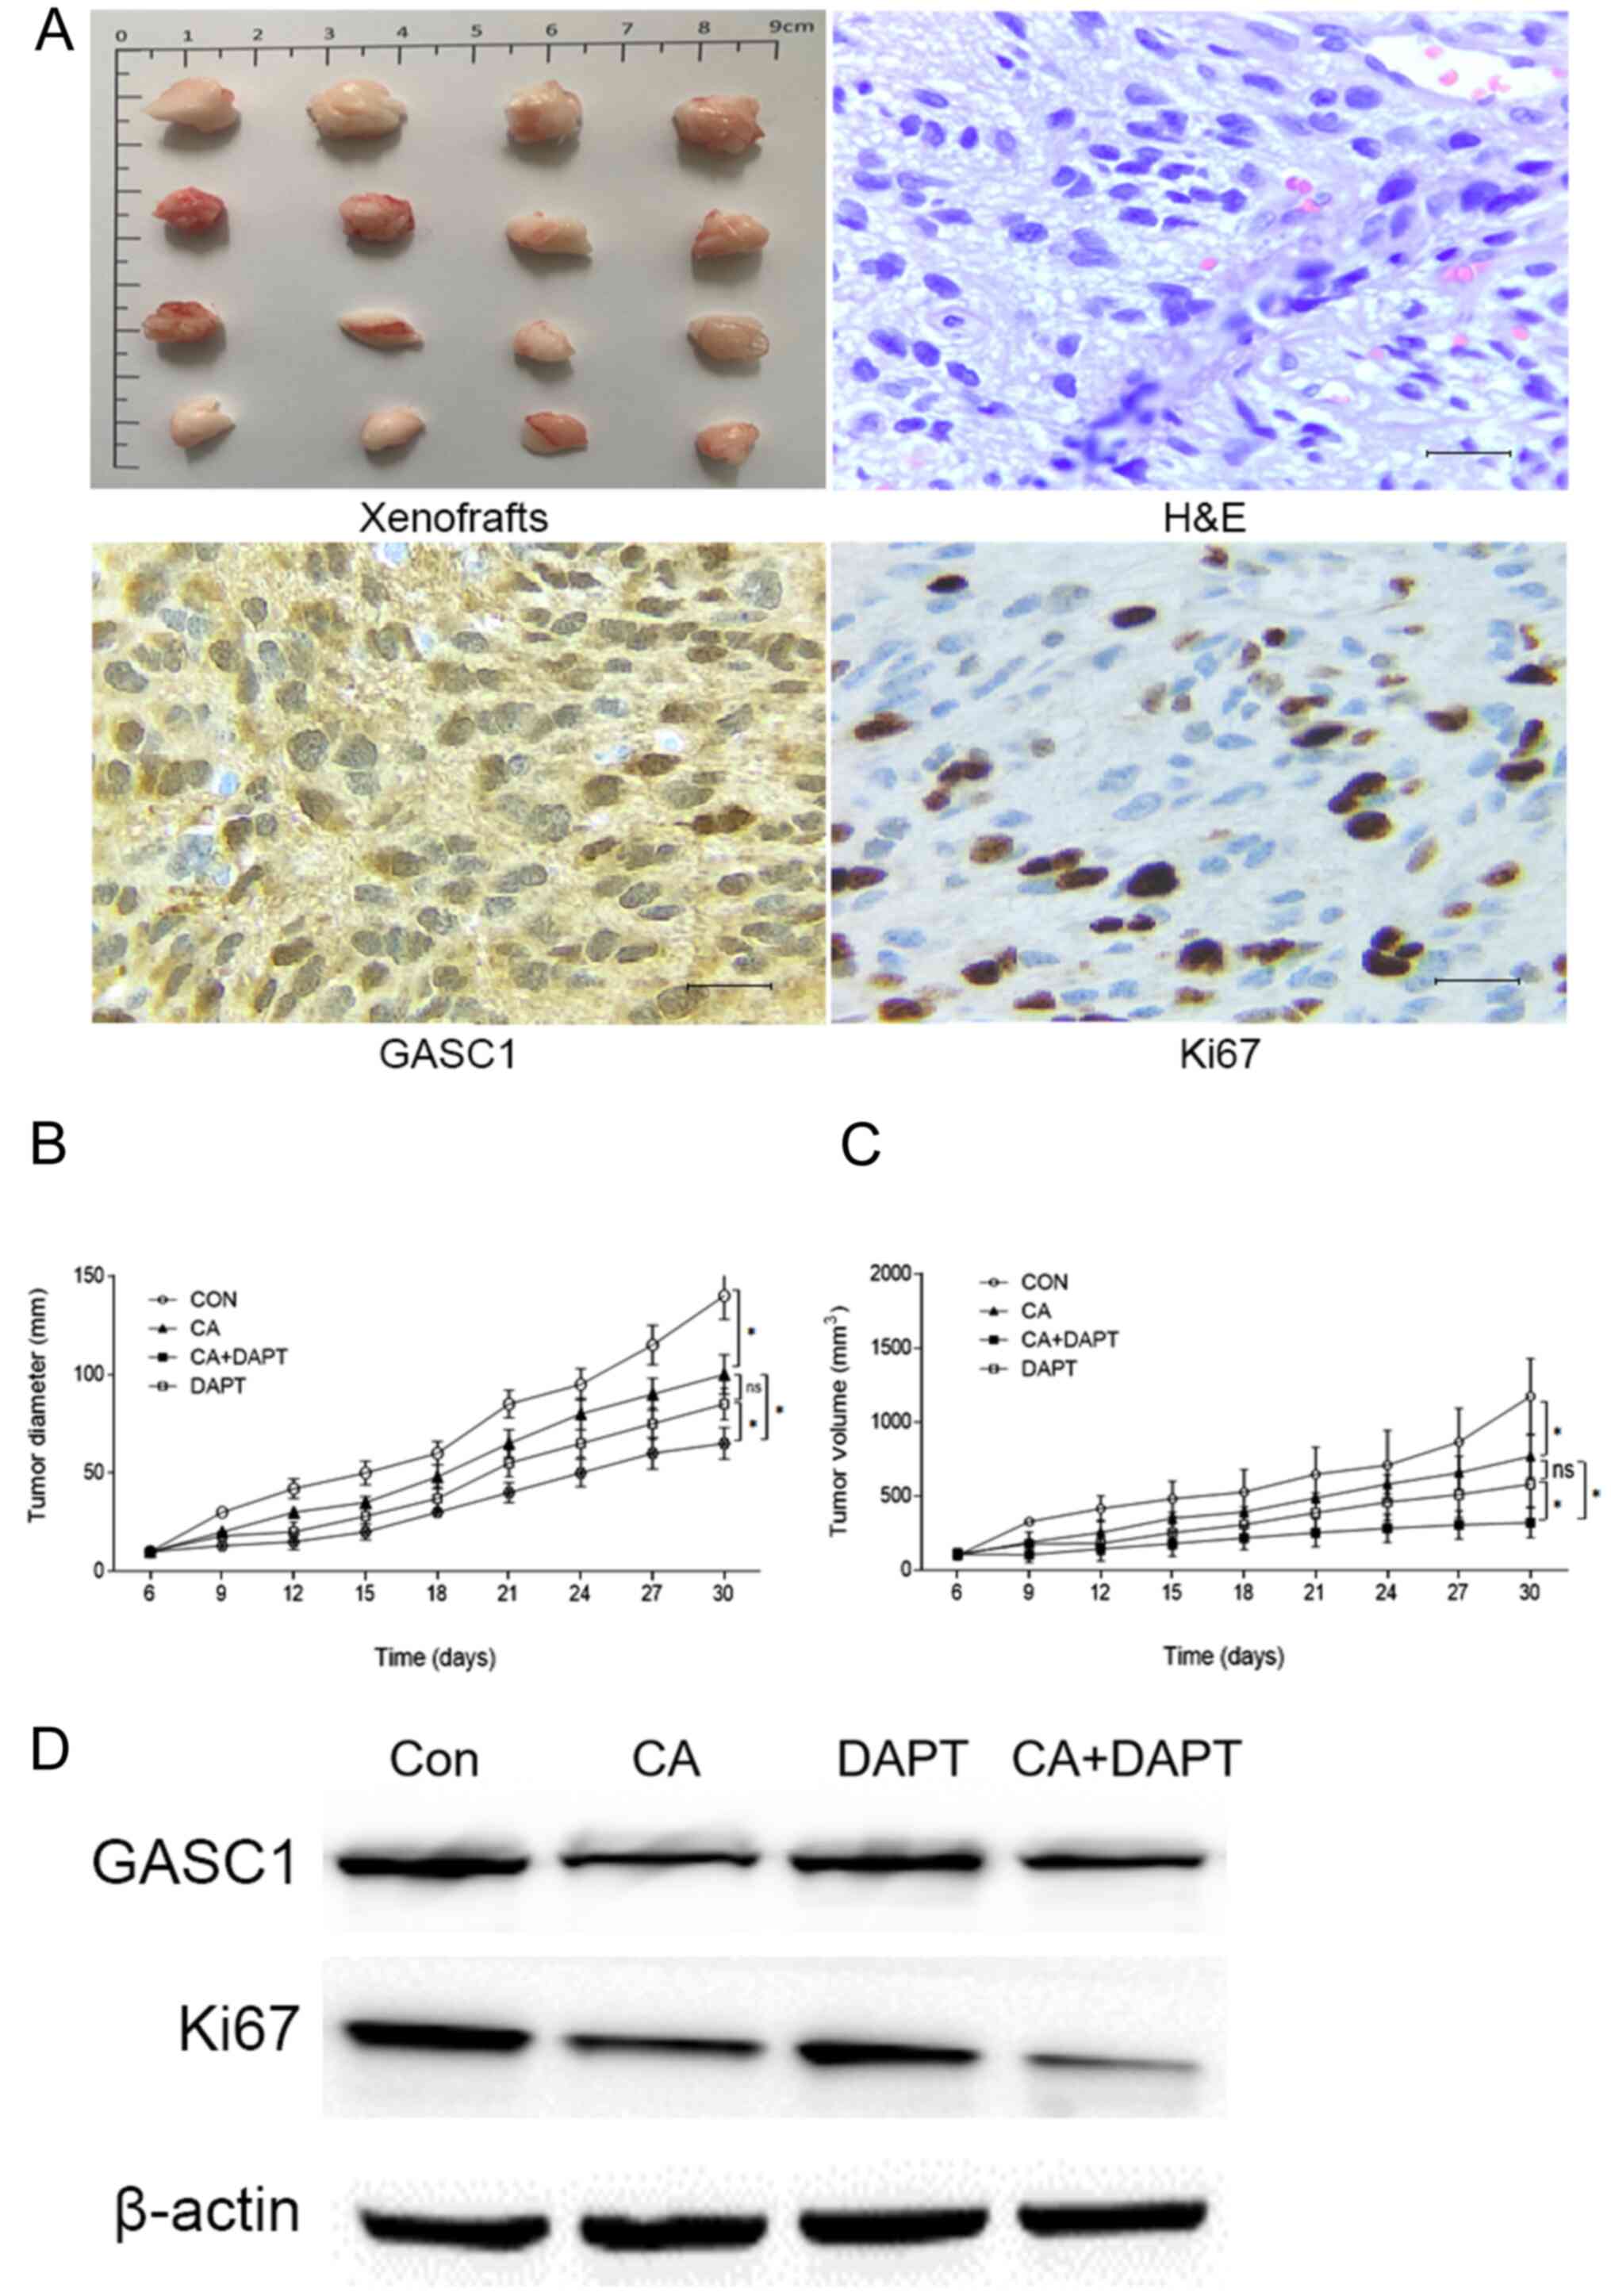 | Figure 6.CA and DAPT decreases the growth of
human glioma xenografts synergistically. (A) Histopathologic
features of the human glioma xenografts, HE staining and
immunohistochemistry for GASC1 and Ki67 expression in primary
cultured human glioma cell xenograft tissues from mice (scale bar,
50 µm). Primary cultured human glioma cells were implanted in the
flanks of the mice (n=16) and the tumors were allowed to develop to
an appreciable size for 6 days (60–80 mm3). Next, CA
(100 mg/kg), DAPT (15 mg/kg) or both, were injected
intraperitoneally beginning on day 6 and were administered every 3
days for a total of eight treatments. The average (B) diameter and
(C) volume was calculated at the indicated time points. Both DAPT
and CA suppressed tumor growth, and the combined use of DAPT and CA
decreased tumor growth more significantly than either treatment
alone. Data are presented as the mean±SD. One-way ANOVA followed by
Tukey's post hoc test, *P<0.05. (D) Western blotting of GASC1
and Ki67 expression in xenograft tissues of different groups.
GASC1, gene amplified in squamous cell carcinoma 1; CA, caffeic
acid; ns, non-significant; HE, hematoxylin and eosin; CON,
control. |
Discussion
Epigenetics are alterations in gene expression
without changes in the DNA sequence (27). Since epigenetic changes have long
been documented to govern a variety of cellular processes,
including gene expression, DNA replication and stem cell
maintenance, aberrant epigenetic modifications can cause abnormal
gene silencing or activation leading to disease, such as cancer and
mental disorders (28). To date,
several epigenetic studies have identified a large number of tumor
suppressor genes silenced in glioblastoma, such as dickkopf WNT
signaling pathway inhibitor 1 (DKK1) and frizzled-related protein 1
(SFRP1) (29,30). Thus, epigenetic modifications have
been proposed to be potential prognostic and response factors for
glioblastoma treatment (31,32).
Since epigenetic silencing of tumor suppressor genes is reversible,
there is extensive interest in developing inhibitors against DNA
methyltransferases and histone deacetylases (33). Thus, finding key molecular targets
that lead to tumoriogenesis and discovering more specific
inhibitors of histone deacetylases and histone methyltransferases
may need to be considered in future diagnostics and treatment for
glioblastoma.
Recently, epigenetic research has provided several
important histone modifier genes. One of the most clinically
relevant observations was the discovery of GASC1 (10). As a member of the JMJD2 family,
GASC1 is located at human chromosome 9p23-24 and encodes a histone
demethylase for H3K9me3/2 and H3K36me3/2 (5–7).
H3K9me3/2 mark is associated with transcriptional repression and
the formation of heterochromatin, while H3K36me3/2 is involved in
the suppression of incorrect transcription (34). Since GASC1 can either remove the
repressive H3K9me3/2 or the active H3K36me3/2 factor in modifying
the H3 process, GASC1 has been reported to promote proliferation
and survival in various cancer cells by activating several
classical oncogenes, such as MYC, NOTCH1, SOX2 and MDM2
proto-oncogene (MDM2) (7–14). For example, GASC1 overexpression in
the non-tumorigenic breast cell line MCF10A induces transformed
phenotypes (6,7), while GASC1-knockdown in skin squamous
cell carcinoma and breast cancer cells inhibits proliferation
(6,7,9,11).
GASC1 can also crosstalk with other molecules to
promote carcinogenesis, as previous studies indicated that GASC1
can cooperate with JAK2 to modify the epigenome of 9p24-amplified
lymphomas and promote proliferation and survival (35–37).
Since GASC1 expression is identified in >50% of gliomas
(8,12), it is highly likely that GASC1
contributes to the genesis and/or development of glioma. There was
direct evidence in the present study of a higher expression of the
GASC1 in the WHO grade III and IV glioma tissues. It was also found
that the inhibition of GASC1/NOTCH signaling significantly
suppressed the viability, migration and stemness of glioma cells.
Thus, the present data indicated that GASC1 has the potential to
serve as a valuable prognostic biomarker, and could facilitate the
development of personalized therapies targeting GASC1/NOTCH
signaling as an innovative treatment for glioma in the future.
It is known that GSCs are responsible for cancer
progression and recurrence, and the elimination of GSCs is crucial
for treating glioblastoma (38,39).
To the best of our knowledge, the association between GASC1
expression and the clinical progression of glioma remains unknown.
Thus, further studies are required to understand the biological
features of GASC1 in gliomas and GSCs. In the present study, the
function and mechanism of GASC1 in the proliferation, invasion and
stemness of glioma cells was analyzed. In line with a previous
study (12), GASC1 expression was
found in most glioma tissues. Moreover, for the first time, a
higher GASC1 expression was identified in WHO grade III and IV
glioma tissues, as compared with the Grade II glioma tumor tissues.
Although the statistical association between the GASC1 expression
and poor prognosis has not been confirmed, the present data
suggested that high-grade gliomas tend to express GASC1, suggesting
that the GASC1 expression may be associated with glioma malignancy.
In the present study, GASC1 inhibition suppressed the viability,
invasion and stemness of glioma cells. Further mechanistic studies
demonstrated that GASC1 affected the stemness of gliomas by
modifying the activity of the NOTCH, Shh and Wnt signaling
pathways, with the most significant effect observed in the NOTCH1
mRNA expression levels. In addition, the present in vivo
data demonstrated the suppressive effect of a GASC1 inhibitor on
the viability of glioma cells in xenograft tumors. These
experiments suggested a pro-tumorigenesis role of GASC1 in the
development of gliomas in vitro and in vivo. The
results also indicated that a GASC1 inhibitor could be a potential
molecular therapeutic agent in the control of gliomas.
NOTCH signaling is a key well-known player in cell
proliferation, apoptosis, stem cell maintenance and tissue
homeostasis (26,40–42).
GSCs have been found to exhibit higher NOTCH1 expression levels
(42,43). The NOTCH1 pathway serves a vital
role in GSC maintenance (44).
Moreover, NOTCH1 has been suggested to mediate in chemotherapeutic
resistance and tumor recurrence by crosstalk with other molecules.
Since NOTCH1 signaling activates downstream Hes1, Hes1 is
recognized as a biomarker of NOTCH1 pathway activation (26,45).
NOTCH1 can regulate several target genes, such as p53, EGFR and
PTEN, in mediating the PI3K/AKT/mTOR pathway (26,41,45).
Moreover, the molecular mechanism and crosstalk of NOTCH1 in
glioma-initiating cells was also reported. HIF-1-depletion can
block the interaction between HIF-1α and Notch intracellular domain
(NICD), and suppress GSC proliferation (46). HIF-1α can also displace the NOTCH
inhibitor HIF-2α from the NICD under hypoxic conditions (47). Currently, most NOTCH inhibitors
remain in clinical phase I and II trials, but several NOTCH
inhibitors had only a modest efficacy in the initial stage, with an
unsatisfactory outcome (48,49).
Since the tumor microenvironment contains a complex mixture of
biochemical and biophysical cues that modulate cell behavior
(33,50), possible reasons for these
unsatisfied results may have been the heterogeneity of glioma and
the crosstalk between the NOTCH pathway and other molecules.
In the present study, GASC1 inhibition decreased
NOTCH1 expression, which was in line with previous studies
(14,37). The present data suggested that GASC1
may be one of the major factors affecting NOTCH1 activity. Besides
NOTCH1, the current data revealed that GASC1 also affects the Shh
and Wnt signaling pathways. In support of this notion, previous
studies reported that GASC1 can regulate numerous other molecules,
such as MYC, NOTCH1, SOX2, MDM2, JAK2, peroxisome proliferator
activated receptor gamma, Nanog homeobox and HIF-1α in cancer cells
(5–14,35,51).
All the data suggested that GASC1 may regulate NOTCH1 and other
signaling pathways to control the viability, migration and stemness
of cancer cells.
To date, neither NOTCH inhibitors nor siRNA clinical
trials have elicited satisfactory results, which suggests that a
complex network of multiple signals on different regulatory levels
controls cancer cell behavior (49). Another possible reason for this
trait may be the low delivery efficiency of siRNA particles or
inhibitors to the specific irregular cells (13). Since epigenetic processes and
changes are so widespread, it is necessary to specifically target
abnormal cells with minimal damage to normal cells. On this issue,
a recent study revealed that nanobioconjugates of GASC1 siRNA and
nanoparticles significantly increased the therapeutic growth
inhibition of GASC1-knockdown in basal-like breast cancer cells
(13). This study showed promise
for the possible therapeutic application of siRNA in future
clinical application.
Cancer cells can communicate with stromal cells,
including osteoblastic cells, adipocytic cells, macrophages,
fibroblasts and other immune cells (52,53).
Cancer cells can also influence the microenvironment cells to
promote pathways that benefit the cancer cells, such as EGFR and
NOTCH1 signaling pathways (33).
GASC1 has been reported to be regulated by IL-6 (5), suggesting that GASC1 can communicate
with other signaling pathways. It is therefore necessary to conduct
high-through-put analysis of GASC1/NOTCH1 signaling in the
development of glioma. It is known that Wnt signaling and Shh
signaling pathways are among the major pathways aberrantly
activated in human glioma tissues (54). The World Health Organization 2016
classification of central nervous system described that 10% of the
medulloblastomas were Wnt activated tumors, and 30% of the
medulloblastomas were Shh activated (55). In the present study, besides the
NOTCH1 signaling, the Shh and Wnt pathways were also inhibited by
GASC1 knockdown, which, to the best of our knowledge, has not been
previously reported. However, further research is required to
examine the influence of GASC1 on the Shh and Wnt signaling.
There were numerous inherent limitations in the
present study. The most important one was the small number of
enrolled patients. This limited the ability to determine the
significance of the GASC1 difference in survival among the various
malignant stage group patients. The present study found no
statistically significant association between the GASC1 expression
and the glioma malignancy stages III and IV. This result does not
rule out the possible role of GASC1 in glioma progression. The
results need to be confirmed in a larger number of patients for a
longer treatment period before the overall role of GASC1 in the
progression of glioma can be completely verified. Due to the great
variation in the transfection efficiency of GSCs from different
patients, U87 glioma cells were used to isolate GSCs to obtain
homogeneity. Previous data have suggested several cell markers for
GSCs; among them, CD133+ cells in glioblastoma display
cancer stem cell-like properties and CD133 is known to be highly
expressed in GSCs (15,56). However, more rigorous research will
be required to establish whether CD133 is an effective marker of
GSCs. There is a need to define CSCs using more precise functional
markers to improve the purity and stemness of the isolated GSCs. In
addition, the present study only recorded the diameter of the
xenografts, and the weight of the tumors was not tested in this
study. This has to some extent undermined the significance of the
current in vivo experiments, which should be improved in
future research.
In conclusion, the present study provided evidence
that GASC1 signaling was highly activated in WHO grade III and IV
glioma tissues. This finding was in line with previous studies
showing that >50% of gliomas exhibit a higher GASC1 expression
(30,57,58).
The data from the current and previous studies also indicated that
GASC1 can regulate NOTCH1 signaling in glioma tissues and is
enriched in GSCs (14,59). Thus, GASC1 may coordinate with
several other signaling molecules to rapidly and transiently
activate NOTCH1 signaling and mediate stemness maintenance in GSCs.
Subsequently, the present study demonstrated that GASC1/NOTCH1
downregulation could significantly inhibit the growth of glioma
cells and GSCs in vitro and in vivo. The current
research elucidated a novel mechanism of GASC1-mediated glioma
carcinogenesis and provided new perspectives for the therapeutic
targets of GASC1/NOTCH1 axis in the clinical treatment of glioma.
Since epigenetic modifiers occur frequently in gliomas (31–33,60),
further studies are required to determine the detailed GASC1/NOTCH1
signaling network, in order to develop possible specific markers
and therapeutic targets that are effective in treating glioma.
Supplementary Material
Supporting Data
Acknowledgements
Not applicable.
Funding
The present study was supported by the funding from
The National Natural Science foundation of China (grant no.
U1404822).
Availability of data and materials
The datasets used and/or during the present study
are available from the corresponding author upon reasonable
request.
Authors contributions
ZX designed the study and wrote the manuscript. XBW,
KZ and ZhL supervised the study, contributed to data acquisition
and revised the manuscript. XY, ZS, CJS and ZL collected and
analyzed the data and conducted the experiments. ZX, XBW, KZ, ZhL,
XY, ZS, CJS and ZL confirmed the authenticity of all the raw data.
All authors read and approved the manuscript and agreed to be
accountable for all aspects of the research in ensuring that the
accuracy or integrity of any part of the work were appropriately
investigated and resolved.
Ethics approval and consent to
participate
This study was approved by The First Affiliated
Hospital of Henan University of Science and Technology
Institutional Review Board (approval no. 2013-08). Written informed
consent was obtained from each donor and patient. All procedures
involving mice were approved by the Henan University of Science and
Technology Institutional Animal Care and Use Committee and were
performed in accordance with the National Institutes of Health
Guide for the Care and Use of Laboratory Animals, 8th edition.
Washington (DC): National Academies Press (US); 2011.
Patient consent for publication
Not applicable.
Competing interests
The authors declare that they have no competing
interests.
References
|
1
|
Ostrom QT, Cote DJ, Ascha M, Kruchko C and
Barnholtz-Sloan JS: Adult glioma incidence and survival by race or
ethnicity in the United States from 2000 to 2014. JAMA Oncol.
4:1254–1262. 2018. View Article : Google Scholar : PubMed/NCBI
|
|
2
|
Yang P, Wang Y, Peng X, You G, Zhang W,
Yan W, Bao Z, Wang Y, Qiu X and Jiang T: Management and survival
rates in patients with glioma in China (2004–2010): A retrospective
study from a single-institution. J Neurooncol. 113:259–266. 2013.
View Article : Google Scholar : PubMed/NCBI
|
|
3
|
Zhao YD, Zhang QB, Chen H, Fei XF, Shen
YT, Ji XY, Ma JW, Wang AD, Dong J, Lan Q, et al: Research on human
glioma stem cells in China. Neural Regen Res. 12:1918–1926. 2017.
View Article : Google Scholar : PubMed/NCBI
|
|
4
|
Li K, Lu D, Guo Y, Wang C, Liu X, Liu Y
and Liu D: Trends and patterns of incidence of diffuse glioma in
adults in the United States, 1973–2014. Cancer Med. 7:5281–5290.
2018. View Article : Google Scholar : PubMed/NCBI
|
|
5
|
Cloos PA, Christensen J, Agger K, Maiolica
A, Rappsilber J, Antal T, Hansen KH and Helin K: The putative
oncogene GASC1 demethylates tri- and dimethylated lysine 9 on
histone H3. Nature. 442:307–311. 2006. View Article : Google Scholar : PubMed/NCBI
|
|
6
|
Liu G, Bollig-Fischer A, Kreike B, van de
Vijver MJ, Abrams J, Ethier SP and Yang ZQ: Genomic amplification
and oncogenic properties of the GASC1 histone demethylase gene in
breast cancer. Oncogene. 28:4491–4500. 2009. View Article : Google Scholar : PubMed/NCBI
|
|
7
|
Berdel B, Nieminen K, Soini Y, Tengström
M, Malinen M, Kosma VM, Palvimo JJ and Mannermaa A: Histone
demethylase GASC1 - a potential prognostic and predictive marker in
invasive breast cancer. BMC Cancer. 12:5162012. View Article : Google Scholar : PubMed/NCBI
|
|
8
|
Sun LL, Holowatyj A, Xu XE, Wu JY, Wu ZY,
Shen JH, Wang SH, Li EM, Yang ZQ and Xu LY: Histone demethylase
GASC1, a potential prognostic and predictive marker in esophageal
squamous cell carcinoma. Am J Cancer Res. 3:509–517.
2013.PubMed/NCBI
|
|
9
|
Uimonen K, Merikallio H, Pääkkö P, Harju
T, Mannermaa A, Palvimo J, Kosma VM and Soini Y: GASC1 expression
in lung carcinoma is associated with smoking and prognosis of
squamous cell carcinoma. Histol Histopathol. 29:797–804.
2014.PubMed/NCBI
|
|
10
|
Kupershmit I, Khoury-Haddad H, Awwad SW,
Guttmann-Raviv N and Ayoub N: KDM4C (GASC1) lysine demethylase is
associated with mitotic chromatin and regulates chromosome
segregation during mitosis. Nucleic Acids Res. 42:6168–6182. 2014.
View Article : Google Scholar : PubMed/NCBI
|
|
11
|
Ozaki Y, Fujiwara K, Ikeda M, Ozaki T,
Terui T, Soma M, Inazawa J and Nagase H: The oncogenic role of
GASC1 in chemically induced mouse skin cancer. Mamm Genome.
26:591–597. 2015. View Article : Google Scholar : PubMed/NCBI
|
|
12
|
Sudo G, Kagawa T, Kokubu Y, Inazawa J and
Taga T: Increase in GFAP-positive astrocytes in histone demethylase
GASC1/KDM4C/JMJD2C hypomorphic mutant mice. Genes Cells.
21:218–225. 2016. View Article : Google Scholar : PubMed/NCBI
|
|
13
|
Movassaghian S, Xie Y, Hildebrandt C,
Rosati R, Li Y, Kim NH, Conti DS, da Rocha SR, Yang ZQ and Merkel
OM: Post-transcriptional regulation of the GASC1 oncogene with
active tumor-targeted siRNA-nanoparticles. Mol Pharm. 13:2605–2621.
2016. View Article : Google Scholar : PubMed/NCBI
|
|
14
|
Jia R, Yang L, Yuan X, Kong J, Liu Y, Yin
W, Gao S and Zhang Y: GASC1 promotes stemness of esophageal
squamous cell carcinoma via NOTCH1 promoter demethylation. J Oncol.
2019:16210542019. View Article : Google Scholar : PubMed/NCBI
|
|
15
|
Natsume A, Kinjo S, Yuki K, Kato T, Ohno
M, Motomura K, Iwami K and Wakabayashi T: Glioma-initiating cells
and molecular pathology: Implications for therapy. Brain Tumor
Pathol. 28:1–12. 2011. View Article : Google Scholar : PubMed/NCBI
|
|
16
|
Roussel MF and Hatten ME: Cerebellum
development and medulloblastoma. Curr Top Dev Biol. 94:235–282.
2011. View Article : Google Scholar : PubMed/NCBI
|
|
17
|
Yang X, Xiao Z, Du X, Huang L and Du G:
Silencing of the long non-coding RNA NEAT1 suppresses glioma
stem-like properties through modulation of the miR-107/CDK6
pathway. Oncol Rep. 37:555–562. 2017. View Article : Google Scholar : PubMed/NCBI
|
|
18
|
Wesseling P and Capper D: WHO 2016
Classification of gliomas. Neuropathol Appl Neurobiol. 44:139–150.
2018. View Article : Google Scholar : PubMed/NCBI
|
|
19
|
Weichbrod RH, Thompson GA and Norton JN:
Management of Animal Care and Use Programs in Research, Education,
and Testing. CRC Press/Taylor & Francis; Boca Raton, FL:
2018
|
|
20
|
Chen Y: Scratch wound healing assay. Bio
Protoc. 2:e1002012.
|
|
21
|
Bai J, Varghese J and Jain R: Adult glioma
WHO classification update, genomics, and imaging: What the
radiologists need to know. Top Magn Reson Imaging. 29:71–82. 2020.
View Article : Google Scholar : PubMed/NCBI
|
|
22
|
Delev D, Heiland DH, Franco P, Reinacher
P, Mader I, Staszewski O, Lassmann S, Grau S and Schnell O:
Surgical management of lower-grade glioma in the spotlight of the
2016 WHO classification system. J Neurooncol. 141:223–233. 2019.
View Article : Google Scholar : PubMed/NCBI
|
|
23
|
Cordeiro BM, Oliveira ID, Alves MT,
Saba-Silva N, Capellano AM, Cavalheiro S, Dastoli P and Toledo SR:
SHH, WNT, and NOTCH pathways in medulloblastoma: When cancer stem
cells maintain self-renewal and differentiation properties. Childs
Nerv Syst. 30:1165–1172. 2014.PubMed/NCBI
|
|
24
|
Xu A, Yang H, Gao K, Zhan Z, Song Z, Huang
T and Song Y: Expression profiles and prognostic significance of
WNT family members in glioma via bioinformatic analysis. Biosci
Rep. 40:402020. View Article : Google Scholar
|
|
25
|
Shahi MH, Farheen S, Mariyath MP and
Castresana JS: Potential role of Shh-Gli1-BMI1 signaling pathway
nexus in glioma chemoresistance. Tumour Biol. 37:15107–15114. 2016.
View Article : Google Scholar : PubMed/NCBI
|
|
26
|
Yi L, Zhou X, Li T, Liu P, Hai L, Tong L,
Ma H, Tao Z, Xie Y, Zhang C, et al: Notch1 signaling pathway
promotes invasion, self-renewal and growth of glioma initiating
cells via modulating chemokine system CXCL12/CXCR4. J Exp Clin
Cancer Res. 38:3392019. View Article : Google Scholar : PubMed/NCBI
|
|
27
|
Morovic W and Budinoff CR: Epigenetics: A
new frontier in probiotic research. Trends Microbiol.
2020.PubMed/NCBI
|
|
28
|
Wimalasena VK, Wang T, Sigua LH, Durbin AD
and Qi J: Using chemical epigenetics to target cancer. Mol Cell.
78:1086–1095. 2020. View Article : Google Scholar : PubMed/NCBI
|
|
29
|
Foltz G, Yoon JG, Lee H, Ma L, Tian Q,
Hood L and Madan A: Epigenetic regulation of wnt pathway
antagonists in human glioblastoma multiforme. Genes Cancer.
1:81–90. 2010. View Article : Google Scholar : PubMed/NCBI
|
|
30
|
Nagarajan RP and Costello JF: Epigenetic
mechanisms in glioblastoma multiforme. Semin Cancer Biol.
19:188–197. 2009. View Article : Google Scholar : PubMed/NCBI
|
|
31
|
Danussi C and Huse JT: Novel insights into
the epigenetics of diffuse glioma. Mol Cell Oncol. 5:e14720552018.
View Article : Google Scholar : PubMed/NCBI
|
|
32
|
Gusyatiner O and Hegi ME: Glioma
epigenetics: From subclassification to novel treatment options.
Semin Cancer Biol. 51:50–58. 2018. View Article : Google Scholar : PubMed/NCBI
|
|
33
|
Buczkowicz P and Hawkins C: Pathology,
molecular genetics, and epigenetics of diffuse intrinsic pontine
glioma. Front Oncol. 5:1472015. View Article : Google Scholar : PubMed/NCBI
|
|
34
|
Kallestad L, Christensen K, Woods E and
Milavetz B: Transcriptional repression is epigenetically marked by
H3K9 methylation during SV40 replication. Clin Epigenetics.
6:212014. View Article : Google Scholar : PubMed/NCBI
|
|
35
|
Yang ZQ, Imoto I, Fukuda Y, Pimkhaokham A,
Shimada Y, Imamura M, Sugano S, Nakamura Y and Inazawa J:
Identification of a novel gene, GASC1, within an amplicon at
9p23-24 frequently detected in esophageal cancer cell lines. Cancer
Res. 60:4735–4739. 2000.PubMed/NCBI
|
|
36
|
Hélias C, Struski S, Gervais C, Leymarie
V, Mauvieux L, Herbrecht R and Lessard M: Polycythemia vera
transforming to acute myeloid leukemia and complex abnormalities
including 9p homogeneously staining region with amplification of
MLLT3, JMJD2C, JAK2, and SMARCA2. Cancer Genet Cytogenet.
180:51–55. 2008. View Article : Google Scholar : PubMed/NCBI
|
|
37
|
Italiano A, Attias R, Aurias A, Pérot G,
Burel-Vandenbos F, Otto J, Venissac N and Pedeutour F: Molecular
cytogenetic characterization of a metastatic lung sarcomatoid
carcinoma: 9p23 neocentromere and 9p23-p24 amplification including
JAK2 and JMJD2C. Cancer Genet Cytogenet. 167:122–130. 2006.
View Article : Google Scholar : PubMed/NCBI
|
|
38
|
Sun Z, Wang L, Zhou Y, Dong L, Ma W, Lv L,
Zhang J and Wang X: Glioblastoma stem cell-derived exosomes enhance
stemness and tumorigenicity of glioma cells by transferring Notch1
protein. Cell Mol Neurobiol. 40:767–784. 2020. View Article : Google Scholar : PubMed/NCBI
|
|
39
|
Zhang L, Yu H, Yuan Y, Yu JS, Lou Z, Xue Y
and Liu Y: The necessity for standardization of glioma stem cell
culture: A systematic review. Stem Cell Res Ther. 11:842020.
View Article : Google Scholar : PubMed/NCBI
|
|
40
|
Engh JA: Notch1 identified as a prognostic
factor for glioma patients. Neurosurgery. 68:N22–N23. 2011.
View Article : Google Scholar : PubMed/NCBI
|
|
41
|
Jiang L, Wu J, Chen Q, Hu X, Li W and Hu
G: Notch1 expression is upregulated in glioma and is associated
with tumor progression. J Clin Neurosci. 18:387–390. 2011.
View Article : Google Scholar : PubMed/NCBI
|
|
42
|
Li J, Cui Y, Gao G, Zhao Z, Zhang H and
Wang X: Notch1 is an independent prognostic factor for patients
with glioma. J Surg Oncol. 103:813–817. 2011. View Article : Google Scholar : PubMed/NCBI
|
|
43
|
Sun ZF, Wang L, Gu F, Fu L, Li WL and Ma
YJ: Expression of Notch1, MMP-2 and MMP-9 and their significance in
glioma patients. Zhonghua Zhong Liu Za Zhi. 34:26–30. 2012.(In
Chinese). PubMed/NCBI
|
|
44
|
Yu X, Zhang W, Ning Q and Luo X:
MicroRNA-34a inhibits human brain glioma cell growth by
down-regulation of Notch1. J Huazhong Univ Sci Technolog Med Sci.
32:370–374. 2012. View Article : Google Scholar : PubMed/NCBI
|
|
45
|
Ming J, Sun B, Li Z, Lin L, Meng X, Han B,
Wang R, Wu P, Li J, Cai J, et al: Aspirin inhibits the SHH/GLI1
signaling pathway and sensitizes malignant glioma cells to
temozolomide therapy. Aging (Albany NY). 9:1233–1247. 2017.
View Article : Google Scholar : PubMed/NCBI
|
|
46
|
Qiang L, Wu T, Zhang HW, Lu N, Hu R, Wang
YJ, Zhao L, Chen FH, Wang XT, You QD, et al: HIF-1α is critical for
hypoxia-mediated maintenance of glioblastoma stem cells by
activating Notch signaling pathway. Cell Death Differ. 19:284–294.
2012. View Article : Google Scholar : PubMed/NCBI
|
|
47
|
Hu YY, Fu LA, Li SZ, Chen Y, Li JC, Han J,
Liang L, Li L, Ji CC, Zheng MH, et al: Hif-1α and Hif-2α
differentially regulate Notch signaling through competitive
interaction with the intracellular domain of Notch receptors in
glioma stem cells. Cancer Lett. 349:67–76. 2014. View Article : Google Scholar : PubMed/NCBI
|
|
48
|
Espinoza I and Miele L: Notch inhibitors
for cancer treatment. Pharmacol Ther. 139:95–110. 2013. View Article : Google Scholar : PubMed/NCBI
|
|
49
|
Locatelli M and Curigliano G: Notch
inhibitors and their role in the treatment of triple negative
breast cancer: Promises and failures. Curr Opin Oncol. 29:411–427.
2017. View Article : Google Scholar : PubMed/NCBI
|
|
50
|
Komori T: Brain Tumor. Brain Nerve.
72:399–405. 2020.(In Japanese). PubMed/NCBI
|
|
51
|
Yang ZQ, Imoto I, Pimkhaokham A, Shimada
Y, Sasaki K, Oka M and Inazawa J: A novel amplicon at 9p23-24 in
squamous cell carcinoma of the esophagus that lies proximal to
GASC1 and harbors NFIB. Jpn J Cancer Res. 92:423–428. 2001.
View Article : Google Scholar : PubMed/NCBI
|
|
52
|
Marino S: Medulloblastoma: Developmental
mechanisms out of control. Trends Mol Med. 11:17–22. 2005.
View Article : Google Scholar : PubMed/NCBI
|
|
53
|
de Bont JM, Packer RJ, Michiels EM, den
Boer ML and Pieters R: Biological background of pediatric
medulloblastoma and ependymoma: A review from a translational
research perspective. Neuro Oncol. 10:1040–1060. 2008. View Article : Google Scholar : PubMed/NCBI
|
|
54
|
Mishra S: CSNK1A1 and Gli2 as novel
targets identified through an integrative analysis of gene
expression data, protein-protein interaction and pathways networks
in glioblastoma tumors: Can these two be antagonistic proteins?
Cancer Inform. 13:93–108. 2014. View Article : Google Scholar : PubMed/NCBI
|
|
55
|
Louis DN, Perry A, Reifenberger G, von
Deimling A, Figarella-Branger D, Cavenee WK, Ohgaki H, Wiestler OD,
Kleihues P and Ellison DW: The 2016 world health organization
classification of tumors of the central nervous system: A summary.
Acta Neuropathol. 131:803–820. 2016. View Article : Google Scholar : PubMed/NCBI
|
|
56
|
Vora P, Seyfrid M, Venugopal C, Qazi MA,
Salim S, Isserlin R, Subapanditha M, OFarrell E, Mahendram S, Singh
M, et al: Bmi1 regulates human glioblastoma stem cells through
activation of differential gene networks in CD133+ brain
tumor initiating cells. J Neurooncol. 143:417–428. 2019. View Article : Google Scholar : PubMed/NCBI
|
|
57
|
Chang S, Yim S and Park H: The cancer
driver genes IDH1/2, JARID1C/KDM5C, and UTX/KDM6A: Crosstalk
between histone demethylation and hypoxic reprogramming in cancer
metabolism. Exp Mol Med. 51:1–17. 2019. View Article : Google Scholar : PubMed/NCBI
|
|
58
|
Sanchez-Martin M: Brain tumour stem cells:
Implications for cancer therapy and regenerative medicine. Curr
Stem Cell Res Ther. 3:197–207. 2008. View Article : Google Scholar : PubMed/NCBI
|
|
59
|
Jia R, Mi Y, Yuan X, Kong D, Li W, Li R,
Wang B, Zhu Y, Kong J, Ma Z, et al: GASC1-adapted neoadjuvant
chemotherapy for resectable esophageal squamous cell carcinoma: A
prospective clinical biomarker trial. J Oncol. 2020:16078602020.
View Article : Google Scholar : PubMed/NCBI
|
|
60
|
Mintz A and Debinski W: Cancer
genetics/epigenetics and the X chromosome: Possible new links for
malignant glioma pathogenesis and immune-based therapies. Crit Rev
Oncog. 11:77–95. 2000. View Article : Google Scholar : PubMed/NCBI
|