Introduction
Diabetes mellitus refers to a complex metabolic
syndrome that is primarily characterized by hyperglycemia, and
aggravation of the disease can lead to symptoms, including weight
loss, blurry vision, extreme fatigue and increased hunger (1). It was reported that there were >400
million individuals with diabetes worldwide in 2017 (2), with the majority of patients with
diabetes suffering from type 2 diabetes mellitus (T2DM), which
occurs when the body fully resists the production of insulin
(3). The incidence rate of T2DM has
increased rapidly in the last ten years in Asia (4), and it is estimated that >642
million individuals in Asia will be diagnosed with T2DM in 2040
(5). Insulin resistance majorly
contributes to the development of T2DM (6). Hepatic cell dysfunction might directly
induce insulin resistance, thereby leading to T2DM development
(7). Although T2DM has been
documented as one of the risk factors of human hepatocellular
carcinoma (HCC), whether the occurrence of human HCC induces and
aggravates insulin resistance has not been previously reported
(8,9). Moreover, the pathogeneses of T2DM and
HCC are not completely understood. Therefore, identifying the
molecular mechanism underlying the mutually promoting effect
between T2DM and HCC would aid with the development of therapeutic
strategies for the two diseases.
Hepatocyte growth factor (HGF) was first identified
as a mitogen of hepatocytes that promoted hepatocyte proliferation
and differentiation (10). In 2011,
the HGF/Met axis was reported to facilitate hepatic glucose uptake
and restrain hepatic glucose output, thus restoring insulin
responsiveness in an insulin-resistant mouse model (11). Moreover, the HGF/Met axis was
reported to be the key signaling pathway inhibited during hepatic
steatosis and insulin resistance caused by mineralocorticoid
receptor deficiency in macrophages (12). Another study suggested that HGF
activation in liver tissues prevented insulin resistance (13). Nevertheless, the effect of HGF on
insulin resistance and the molecule regulating the functions of HGF
in the human HCC cell line model are yet to be explored.
MicroRNAs (miRNAs/miRs) are a class of
single-stranded RNAs that are 18–25 nucleotides in length (14). Although they do not encode proteins,
miRNAs suppress the expression of protein-coding genes at the
post-transcriptional level by degrading target mRNAs or preventing
mRNA translation, thereby affecting pathophysiological processes,
including tumorigenesis, insulin resistance and the occurrence of
T2DM (15–20). Several studies have investigated the
role of miR-93-5p in human HCC formation. One study reported that
miR-93-5p expression was upregulated in human HCC, where it exerted
a positive effect on hepatoma progression (21). Similarly, another study suggested
that miR-93-5p overexpression facilitated hepatoma occurrence and
development by targeting PPARG coactivator 1α (22). In the present study, the
bioinformatics analysis results revealed that miR-93-5p was a key
aberrantly expressed miRNA in HCC tissues that might directly
target HGF. Given the regulatory function of HGF in insulin
resistance, investigating the role of miR-93-5p in insulin
resistance and human HCC is important.
The HepG2 cell line is a human hepatic embryonal
tumor cell line with a phenotype identical to hepatocytes (23). It has been reported that high level
insulin treatment stimulates insulin receptors on the surface of
HepG2 cells by 58%, but the remaining receptors dampen insulin
internalization (24). The
decreased number of surface insulin receptors on HepG2 cells was
positively related to the insulin level and stimulation duration,
which indicated that HepG2 cells are an appropriate model for
studying the mechanism underlying the pathogenesis of insulin
resistance in vitro. The present study aimed to investigate
whether miR-93-5p participated in insulin resistance and
tumorigenesis by using an insulin-resistant HepG2 cell model. The
results of the present study may provide a novel diagnostic and
therapeutic strategy for T2DM and HCC.
Materials and methods
Bioinformatics analysis
The GSE84402 (25),
GSE45050 (26) and GSE15652
(27) datasets, which were
downloaded from Gene Expression Omnibus (GEO, http://www.ncbi.nlm.nih.gov/gds/), are mRNA
expression microarrays involving liver cancer and T2DM. The
GSE108724 dataset (28), which was
downloaded from GEO, is a miRNA expression microarray involving
liver cancer. Limma 3.26.8 (https://bioconductor.org/packages/release/bioc/html/limma.html)
was employed to identify downregulated differentially expressed
genes (DEGs) with an adjusted (adj.)P-value <0.05 and log fold
change (logFC) <-1. The upregulated differentially expressed
miRNAs with an adj.P-value <0.05 and logFC >1 were screened
out using Limma 3.26.8. Gene Expression Profiling Interactive
Analysis (GEPIA, http://gepia.cancer-pku.cn/index.html), an online
tool, was further used to analyze gene expression in liver HCC
(LIHC) tumor and non-tumor samples. StarBase (https://string-db.org/) was also employed to predict
the miRNAs targeting the gene of interest. Venny 2.1.0 (https://bioinfogp.cnb.csic.es/tools/venny/) was
applied to overlap the common genes and miRNAs.
Patient sample collection
A total of 62 patients (46–68 years old) diagnosed
with HCC with T2DM (n=31) or without T2DM (n=31) were recruited
from Wuhan Third Hospital (Wuhan, China) between April 2015 and
December 2019. HCC tissues and adjacent healthy hepatic tissues
(distance from tumor margin, ≤3 cm) confirmed by pathology were
collected by performing a tumorectomy. Once the tissues were
collected, the patients received first-line chemotherapy. All
patients provided written informed consent. The present study was
approved by the Ethics Committee of Wuhan Third Hospital (approval
no. KY2020-015). The clinical characteristics of the patients are
presented in Table I.
 | Table I.Clinical characteristics of 62
patients with hepatocellular carcinoma. |
Table I.
Clinical characteristics of 62
patients with hepatocellular carcinoma.
| Characteristic | Number of patients
(n=62) |
|---|
| Age, n (%) |
|
|
≤55 | 34 (55) |
|
>55 | 28 (45) |
| Sex, n (%) |
|
|
Male | 33 (53) |
|
Female | 29 (47) |
| Tumor size (cm), n
(%) |
|
| ≥5 | 30 (48) |
|
<5 | 32 (52) |
| Histologic grade, n
(%) |
|
| G1 | 20 (32) |
| G2 | 26 (42) |
| G3 | 16 (26) |
| TNM stage (43), n
(%) |
|
|
I–II | 36 (58) |
|
III–IV | 26 (42) |
| T2DM |
|
|
Absence, n (%) | 31 (50) |
|
HOMA-IR | 1.8±0.5 |
|
HbA1c (%) | 7.4±0.3 |
|
Presence, n (%) | 31 (50) |
|
HOMA-IR | 4.3±0.9 |
|
HbA1c (%) | 5.1±0.4 |
Cell culture and insulin-resistant
cell model
The HepG2 cell line, which was identified as a human
HCC cell line by STR profiling, was obtained from China
Infrastructure of Cell Line Resources, Institute of Basic Medical
Sciences, Chinese Academy of Medical Sciences. HepG2 cells were
cultured in Minimum Essential Medium Eagles with Earle's Balanced
Salts (MEM-EBSS; Table II)
supplemented with 10% FBS (cat. no. 10093; Gibco; Thermo Fisher
Scientific, Inc.) and 1% non-essential amino acids (cat. no.
11140050; Gibco; Thermo Fisher Scientific, Inc.) at 37°C with 5%
CO2. To establish the insulin-resistant cell model,
HepG2 cells were cultured for 48 h in high glucose content [30 mM
glucose; insulin resistance group (IR)] at 37°C with 5%
CO2. In the control group (CON), HepG2 cells were
cultured for 48 h in normal culture medium at 37°C with 5%
CO2.
| Table II.Formulation of Minimum Essential
Medium Eagles with Earles Balanced Salts. |
Table II.
Formulation of Minimum Essential
Medium Eagles with Earles Balanced Salts.
| A, Inorganic
salts |
|---|
|
|---|
| Component | Quantity (g/l) |
|---|
| CaCl2
(anhydrous) | 0.20000 |
| MgSO4
(anhydrous) | 0.09767 |
| KCl | 0.40000 |
|
NaHCO3 | 1.50000 |
| NaCl | 6.80000 |
|
NaH2PO4·H2O | 0.14000 |
|
| B,
Vitamins |
|
|
Component | Quantity
(g/l) |
|
| Choline
Chloride | 0.00100 |
| Folic Acid | 0.00100 |
| myo-Inositol | 0.00200 |
| Nicotinamide | 0.00100 |
| D-Pantothenic Acid
(hemicalcium) | 0.00100 |
| Pyridoxine·HCl | 0.00100 |
| Riboflavin | 0.00010 |
| Thiamine·HCl | 0.00100 |
|
| C, Amino
acids |
|
| Component | Quantity (g/l) |
| L-Alanine | 0.00890 |
| L-Arginine·HCl | 0.12640 |
|
L-Asparagine·H2O | 0.01500 |
| L-Aspartic
Acid | 0.01330 |
| L-Cystine·2HCl | 0.03120 |
| L-Glutamic
Acid | 0.01470 |
| L-Glutamine | 0.29200 |
| Glycine | 0.00750 |
|
L-Histidine·HCl·H2O | 0.04190 |
| L-Isoleucine | 0.05250 |
| L-Leucine | 0.05250 |
| L-Lysine·HCl | 0.07250 |
| L-Methionine | 0.01500 |
|
L-Phenylalanine | 0.03250 |
| L-Proline | 0.01150 |
| L-Serine | 0.01050 |
| L-Threonine | 0.04760 |
| L-Tryptophan | 0.01000 |
|
L-Tyrosine·2Na·2H2O | 0.05190 |
| L-Valine | 0.04680 |
|
| D,
Other |
|
| Component | Quantity (g/l) |
| D-Glucose | 1.00000 |
| Phenol Red, Sodium
Salt | 0.01000 |
| Sodium
Pyruvate | 0.11000 |
Glucose consumption assay
Glucose concentrations in HepG2 cell culture medium
were assessed using the Glucose Colorimetric Detection kit
(Invitrogen; Thermo Fisher Scientific, Inc.). Briefly, HepG2 cells
were seeded (2×10⁵ cells/well) into a 96-well plate with
five blank wells. Cells were cultured in high glucose solution (30
mM). At 80% confluence, culture conditions were returned to normal
culture conditions. Subsequently, 100 nM insulin (Gibco; Thermo
Fisher Scientific, Inc.) was added to cells and incubated for 15
min at 37°C. Glucose consumption was detected at 0, 4, 8, 12, 24
and 30 h. Glucose consumption was calculated according to the
following formula: Glucose concentration of blank wells - glucose
concentration of cell-containing wells.
Glycogen synthesis assay
HepG2 cell glycogen synthesis was determined using
the EnzyChrom Glycogen Assay kit (BioAssay Systems) according to
the manufacturer's protocol. HepG2 cells were cultured in high
glucose medium or normal glucose medium for 24 h. Subsequently,
cells were treated with 100 nM insulin for 15 min at 37°C. Cells
were then harvested, lysed in lysis buffer (BioAssay Systems) and
homogenized in 25 mM citrate. Following centrifugation (37°C,
10,000 × g, 5 min) to remove debris, the supernatant (10 µl) was
seeded into each well. Subsequently, 90 µl working reagent
(containing 87 µl Assay Buffer, 1 µl Enzyme A, 1 µl Enzyme B and 1
µl Dye Reagent) was added to each reaction well and incubated at
room temperature for 30 min. The optical density at a wavelength of
570 nm was examined using a microplate reader. Glycogen
concentrations were calculated according to the standard curve.
Reverse transcription-quantitative PCR
(RT-qPCR)
Total RNA was extracted from tissues and cells using
RNAiso reagents (Takara Bio, Inc.) according to the manufacturer's
protocol. Total RNA was quantified using a NanoDrop2000
spectrophotometer (Thermo Fisher Scientific, Inc.). Subsequently,
RNA (2 µg) was reverse transcribed into cDNA using the One Step
PrimeScript miRNA cDNA synthesis kit (Takara Bio, Inc.) at 37°C for
20 min and 80°C for 2 min or the PrimeScript™ Double Strand cDNA
Synthesis kit (Takara Bio, Inc.) at 65°C for 5 min and 42°C for 1
h. Next, qPCR was performed using ChamQ Universal SYBR qPCR Master
Mix (Vazyme BioTech Co., Ltd.) with thermocycling conditions as
follows: Initial denaturation at 95°C for 30 sec, 40 cycles at 95°C
for 5 sec and 60°C for 20 sec. The sequences of the primers used
for qPCR are presented in Table
III. miRNA and mRNA expression levels were quantified using the
2−ΔΔCq method (29) and
normalized to the internal reference genes U6 and GAPDH,
respectively.
| Table III.Sequences of primers used for reverse
transcription-quantitative PCR. |
Table III.
Sequences of primers used for reverse
transcription-quantitative PCR.
| Gene | Primer sequences
(5→3) |
|---|
| HGF | F:
GTAAATGGGATTCCAACACGAACAA |
|
| R:
TGTCGTGCAGTAAGAACCCAACTC |
| GAPDH | F:
GGGTGGTGCAAAGAGAGTCA |
|
| R:
GCAGGAGGCATTGCTTACAAC |
| miR-93-5p | F:
ACACTCCAGCTGGGCAAAGTGCTGTTCGTGC |
|
| R:
CTCAACTGGTGTCGTGGAGTCGGCAATTCAGTTGAGCTACCTGC |
| U6 | F:
GATTAGCATGGCCCCTGC |
|
| R:
GTCGTATCCAGTGCGTGTCGTCCAGTCGGCAATTGCACTGGATACGACAAAATATG |
Cell transfection
The HGF overexpression (OE) vector (OE-HGF), HGF
small interfering RNA (si; si-HGF), miR-93-5p mimic, miR-93-5p
inhibitor and their corresponding negative controls (NCs) were
purchased from Shanghai GenePharma Co., Ltd. (Table SI). pcDNA3.1 empty vector was used
as the NC for OE-HGF. HepG2 cells were seeded (2×10⁴
cells/well) into a 6-well plate. Subsequently, cells were
transfected with OE-HGF (2.5 µg), si-HGF (2.5 µg), miR-93-5p mimic
(50 nM), miR-93-5p inhibitor (50 nM) or the corresponding NCs (50
nM) using Lipofectamine® 3000 Transfection Reagent
(Invitrogen; Thermo Fisher Scientific, Inc.) at 37°C for 48 h. The
transfection efficiency and the subsequent assays were performed 48
h after transfection. Cells in the NC group were transfected with
mimic-NC and inhibitor-NC, or empty vector and si-NC due to the
similar transfection efficiency of their NC (Figs. S1 and S2).
Western blotting
Total protein was extracted from tissue lysates or
HepG2 cells using RIPA lysis buffer (Beyotime Institute of
Biotechnology) according to the manufacturer's protocol. Protein
concentrations were determined using the BCA protein assay kit
(Beyotime Institute of Biotechnology). Proteins (10 µg) were
separated via 10% SDS-PAGE, and subsequently transferred onto PVDF
membranes (EMD Millipore). Following blocking with 5% skimmed milk
for 1 h at 25°C, the membranes were washed three times with PBS.
Subsequently, the membranes were incubated with anti-HGF (1:500;
cat. no. ab83760; Abcam) and anti-GAPDH (1:5,000; cat. no.
ab181602; Abcam) primary antibodies at 4°C overnight. After washing
with PBS, the membranes were incubated with a Goat Anti-Rabbit IgG
H&L secondary antibody (1:5,000; cat. no. ab205718; Abcam) for
1 h at 25°C. Protein bands were visualized using the ECL Substrate
kit (cat. no. ab133406; Abcam). Protein expression levels were
semi-quantified using Image-Pro Plus software (version 6.0; Media
Cybernetics, Inc.) with GAPDH as the loading control.
Immunoprecipitation
To detect the Met-INSR complex in HepG2 cells, the
Protein A/G Immunoprecipitation kit (Beijing Solarbio Science &
Technology Co., Ltd.) was used according to the manufacturer's
protocol. HepG2 cells were cultured in high glucose or normal
glucose medium for 24 h. Subsequently, cells were treated with 100
nM insulin for 15 min at 37°C. Cells were harvested and lysed using
200 µl RIPA lysis buffer (Beyotime Institute of Biotechnology).
After lysing the cells for 10 min, the cells were centrifuged at
10,000 × g, 4°C for 5 min. INSR-β antibody-conjugated magnetic
beads (1:30; cat. no. ab227831; Abcam) were prepared, added to the
whole-cell protein extracts and incubated overnight at 4°C.
Immunoprecipitates were collected using a magnetic separator and
washed three times with lysis buffer. Subsequently,
immunoprecipitates were separated via SDS-PAGE and subjected to
western blotting with INSR-β (1:1,000; cat. no. ab227831; Abcam)
and HGF antibodies as described above.
Dual-luciferase reporter assay
The wild-type (WT) sequence of HGF 3′UTR (HGF-WT)
and the mutant (MUT) type sequence of HGF 3′UTR (HGF-MUT) were
synthesized by GeneCreate. HGF-MUT was generated by altering the
sequence of the binding sites from ‘CACGAAC’ to ‘GUGCUU’ and
‘CACUUU’ to ‘GUGAAA’. Subsequently, HGF-WT and HGF-MUT were cloned
into the pmiR-GLO vector (Promega Corporation). HepG2 cells were
co-transfected with 2.5 µg HGF-WT or HGF-MUT and 50 nM miR-93-5p
mimic or mimic NC using Lipofectamine 3000 reagent. At 48 h
post-transfection, cells were treated with lysis buffer
(GeneCreate). Relative luciferase activities were detected with a
Dual-Luciferase Reporter Assay System (Promega Corporation) and
normalized against Renilla luciferase activity.
RNA pull-down assay
Both miR-93-5p mimic-biotin (Bio; Bio-miR-93-5p,
5′-CAAAGUGCUGUUCGUGCAGGUAG-biotin-3′) and mimic-Bio-NC (Bio-NC,
5′-UCACAACCUCCUAGAAAGAGUAGA-biotin-3′) were synthesized by
Guangzhou RiboBio Co., Ltd. HepG2 cells were cultured in a 6-well
plate. At 70–80% confluence, cells were transfected with 50 nM
Bio-miR-93-5p mimic or Bio-NC for 48 h using Lipofectamine 3000
reagent at 37°C. Subsequently, HepG2 cells were collected and
treated with Cell Lysis Buffer (EMD Millipore). Proteinase K
solution and DNase I (EMD Millipore) were added to remove the
protein and DNA at 4°C for 20 min. After the protein and DNA were
removed, samples were incubated with streptavidin magnetic beads
(Invitrogen; Thermo Fisher Scientific, Inc.) at 4°C for 4 h.
Streptavidin magnetic beads were absorbed using a magnetic grate
(Thermo Fisher Scientific, Inc.). Subsequently, RNA was extracted
and evaluated via RT-qPCR.
Cell Counting Kit-8 (CCK-8) assay
HepG2 cells were seeded into a 96-well plate at a
density of 2×10⁴ cells/ml. At 12, 24, 48 and 72 h
post-transfection, cell proliferation was assessed by performing
the CCK-8 assay (Abcam). Briefly, 10 µl CCK-8 solution was added to
each well and incubated at 37°C for 4 h. The optical density was
measured at a wavelength of 450 nm using a microplate reader
(BioTek Instruments, Inc.).
BrdU cell proliferation assay
BrdU Cell Proliferation Assay kit (cat. no. 6813;
Cell Signaling Technology, Inc.) was purchased to perform the BrdU
cell proliferation assay. HepG2 cells (2×10⁴ cells/ml)
were seeded into a 96-well plate. Following culture for 48 h at
37°C, the culture medium was replaced with BrdU solution and
incubated for 1 h. Subsequently, the culture medium was replaced
with 100 µl fixing/denaturing solution and incubated for 30 min at
room temperature. The solution was removed and the BrdU detection
antibody (1:100) was added to the cells for 1 h at room
temperature. Subsequently, anti-mouse IgG secondary antibody
(1:100) and HRP solution were successively added to the cells to
induce the chromogenic reaction at 25°C. Absorbance was measured at
a wavelength of 450 nm using a microplate reader.
Caspase-3 activity assay
To assess cell apoptosis, the caspase-3 Activity
Assay kit (Beyotime Institute of Biotechnology) was used. At 48 h
post-transfection, 2.5% trypsin (Gibco; Thermo Fisher Scientific,
Inc.) was used for the digestion and collection of cells.
Subsequently, total protein was extracted from cells using lysis
solution. Then, 40 µl buffer solution, 50 µl sample and 10 µl
Ac-DEVD-pNA were gently mixed and then incubated for 2 h at 37°C.
Absorbance was measured at a wavelength of 405 nm using a
microplate reader.
Statistical analysis
Statistical analyses were performed using SPSS
software (version 23.0; IBM Corp.). For each experiment, three
independent tests were performed. Data are presented as the mean ±
SD. An unpaired Student's t-test was used to analyze comparisons
between two groups. One-way or two-way ANOVA followed by Tukey's
post hoc test were used to analyze comparisons among multiple
groups. Pearson's correlation coefficient analysis was performed to
assess the correlation between miR-93-5p expression and HGF
expression. P<0.05 was considered to indicate a statistically
significant difference.
Results
HGF is a biomarker of insulin
resistance
To analyze downregulated DEGs associated with liver
cancer and T2DM (adj.P <0.05 and logFC <-1), three datasets
(GSE8442, GSE45050 and GSE15653) were downloaded from GEO. After
performing Venny 2.1.0 analysis, the only overlapping gene among
all three microarrays was HGF (Fig.
1A). Subsequently, GEPIA was used to assess HGF expression in
LIHC. The GEPIA results demonstrated that HGF expression was
significantly reduced in LIHC samples compared with non-tumor
samples (Fig. 1B). RT-qPCR analysis
of HGF mRNA expression levels in HCC and adjacent healthy samples
from patients with HCC with or without T2DM was performed. The
results demonstrated that HGF expression was significantly lower in
both HCC tissues and adjacent healthy tissues isolated from
patients with T2DM compared with adjacent healthy tissues isolated
from patients without T2DM (Fig.
1C).
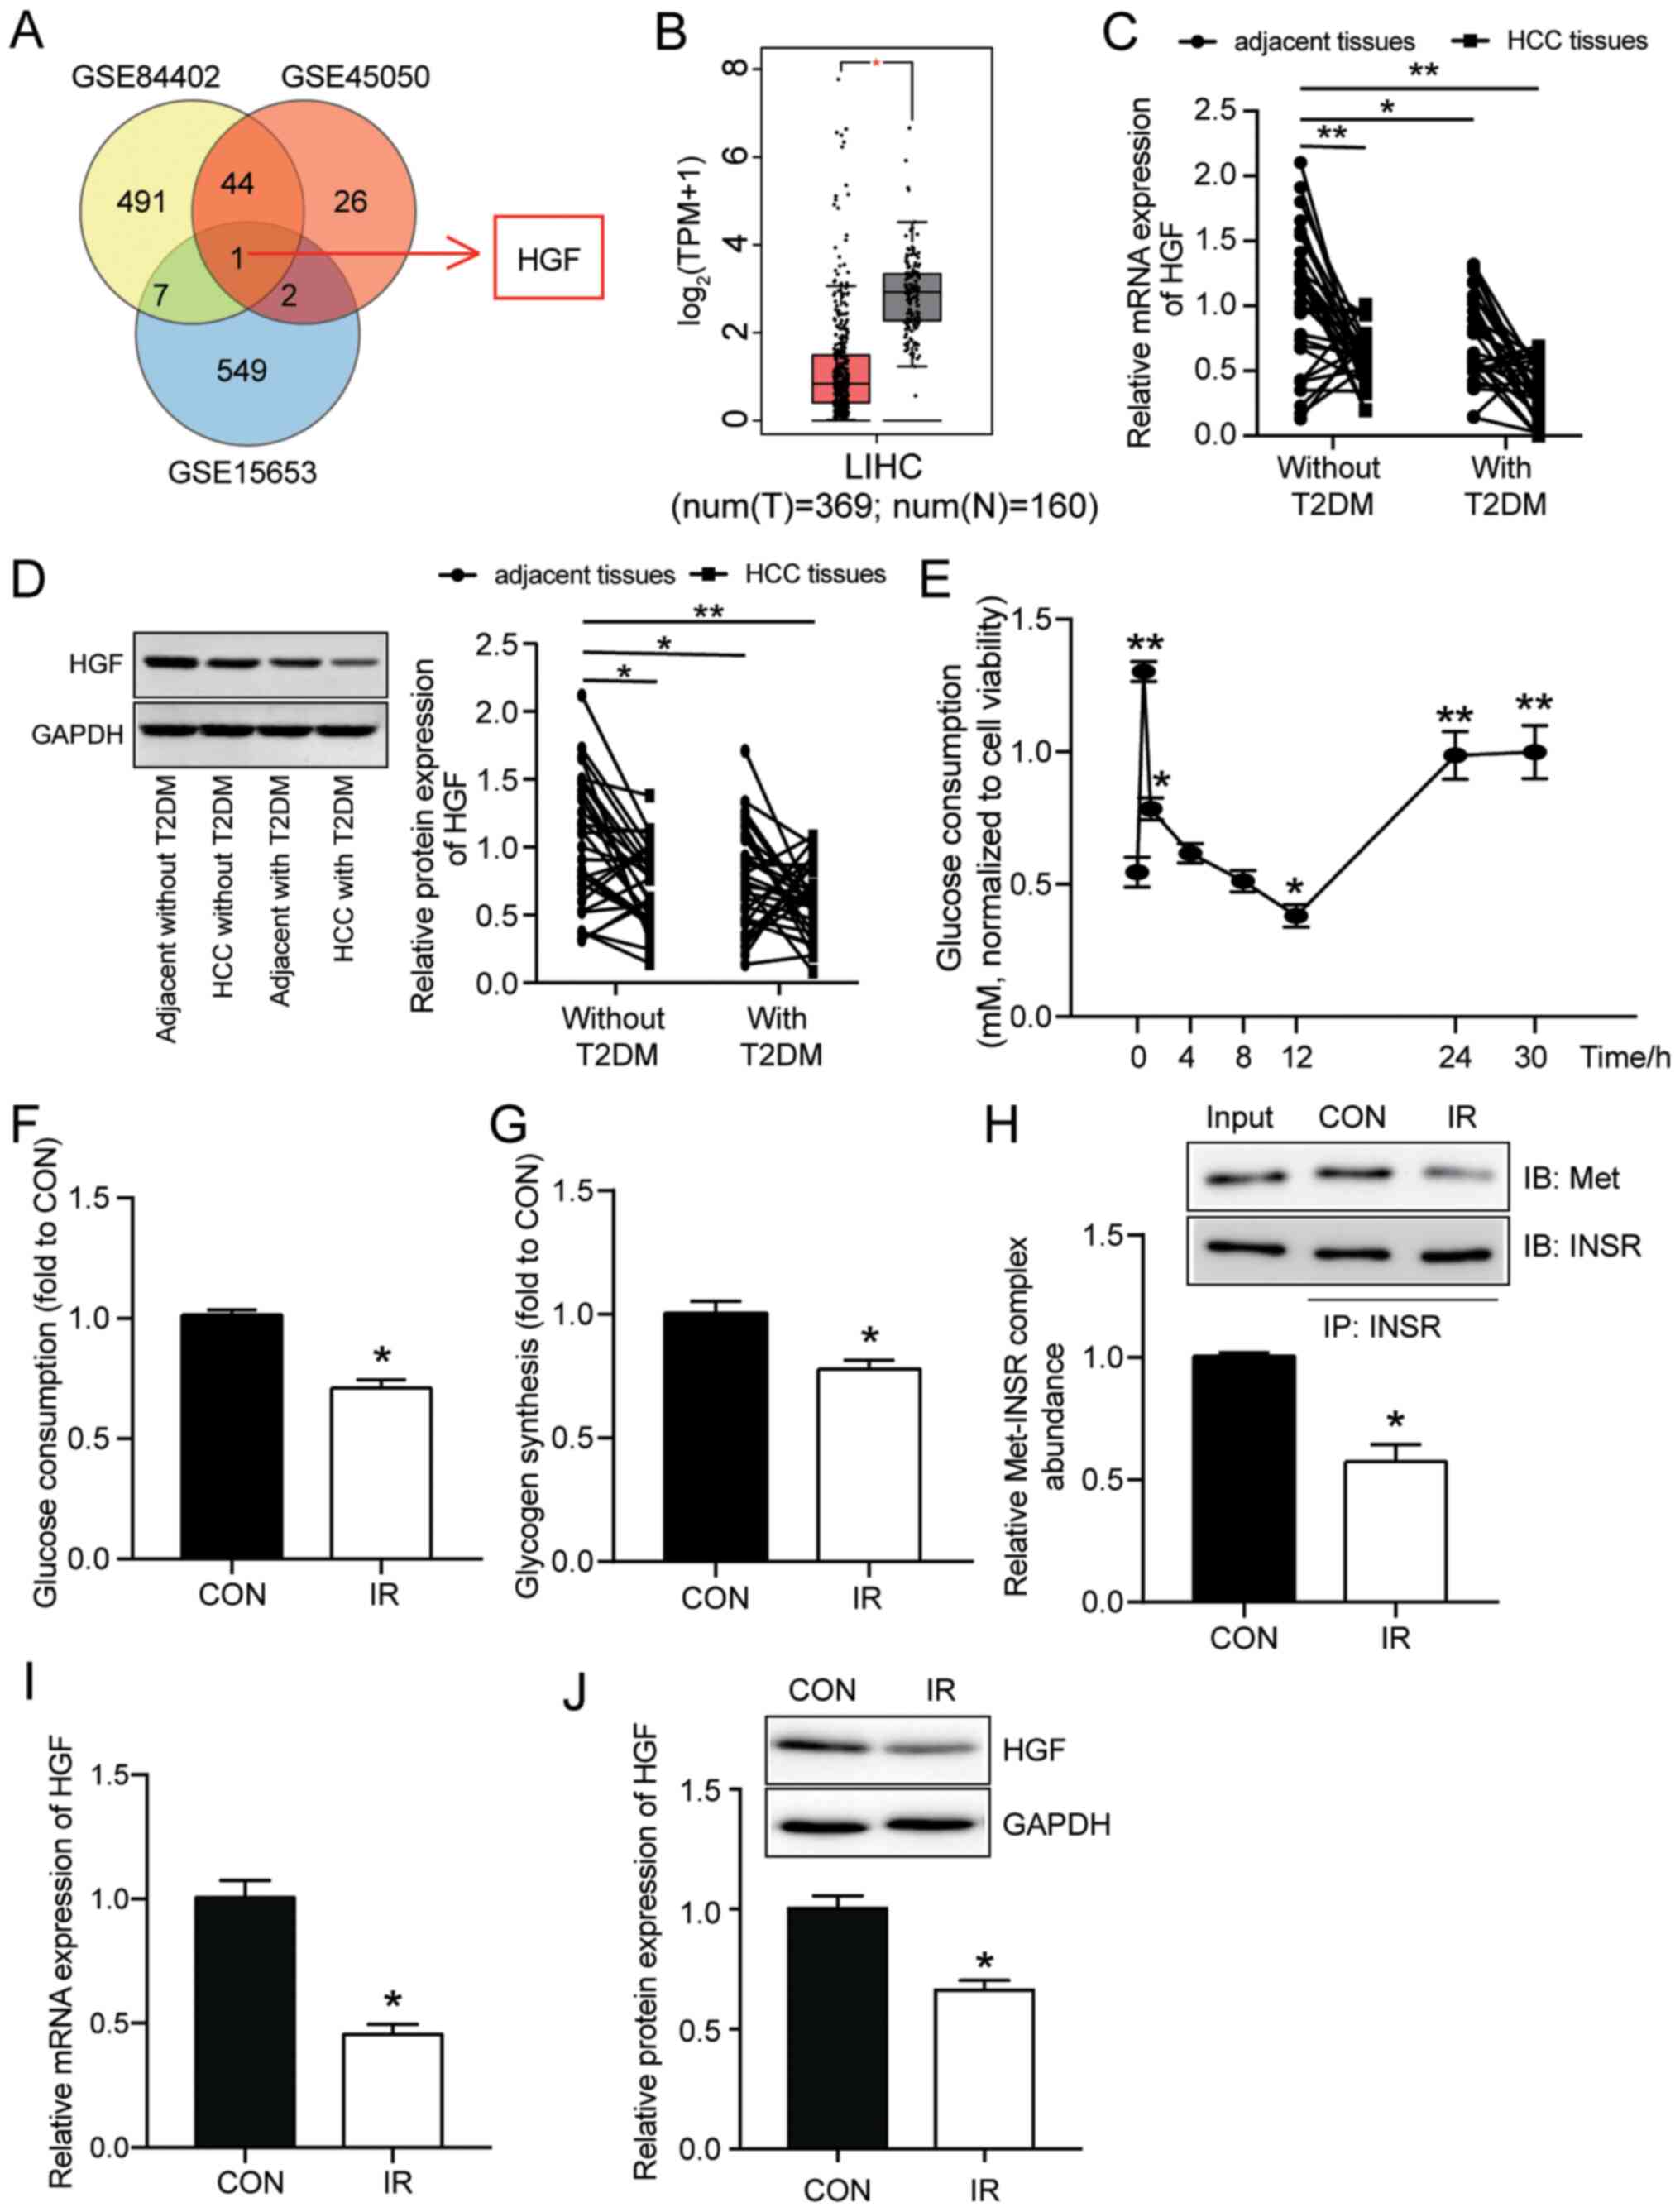 | Figure 1.HGF is a biomarker of insulin
resistance. (A) HGF was the only overlapping gene among the
GSE84402, GSE45050 and GSE15653 datasets. GSE84402, GSE45050 and
GSE15653 profiles are mRNA microarrays involved in liver cancer and
T2DM. (B) By performing Gene Expression Profiling Interactive
Analysis, the results indicated that HGF expression was reduced in
LIHC samples. HGF (C) mRNA and (D) protein expression levels in HCC
tissues and adjacent healthy tissues isolated from patients with or
without T2DM were measured via RT-qPCR and western blotting,
respectively. (E) Period of glucose consumption in HepG2 cells. (F)
Glucose consumption in HepG2 cells with or without insulin
resistance was examined by performing glucose consumption assays.
(G) Glycogen synthesis in HepG2 cells with or without insulin
resistance was examined by performing glycogen synthesis assays.
(H) Met-INSR complex abundance in insulin-resistant HepG2 cells was
detected via immunoprecipitation assays. HGF (I) mRNA and (J)
protein expression levels in HepG2 cells with or without insulin
resistance were detected via RT-qPCR and western blotting,
respectively. Data are presented as the mean ± SD. *P<0.05 and
**P<0.001 vs. CON. HGF, hepatocyte growth factor; LIHC, liver
hepatocellular carcinoma; T2DM, type 2 diabetes mellitus; RT-qPCR,
reverse transcription-quantitative PCR; Met-INSR, Met-insulin
receptor; CON, normal culture; IR, insulin resistance; HCC,
hepatocellular carcinoma; IB, immunoblotting; IP,
immunoprecipitation; T, tumor; N, non-tumor. |
Furthermore, western blotting was performed to
measure HGF protein expression levels in HCC tissues and adjacent
healthy tissues isolated from patients with or without T2DM. The
results demonstrated that HGF protein expression levels were
significantly lower in HCC tissues isolated from patients with or
without T2DM and in adjacent healthy tissues isolated from patients
with T2DM compared with adjacent healthy tissues isolated from
patients without T2DM (Fig. 1D).
Subsequently, HepG2 cells were treated with glucose (30 mM) to
establish an insulin-resistant model in vitro. Glucose
consumption was measured to assess the insulin-resistant model. The
results demonstrated that compared with the 0 h time point group,
glucose consumption significantly peaked within 1 h after adding
insulin. Compared with the 0 h time point, glucose consumption
significantly decreased to a minimum level after 12 h and then
significantly increased after 24 h (Fig. 1E); therefore, 24 h was selected as
the insulin intervention period for the HepG2 insulin-resistant
model.
To further verify insulin resistance in HepG2 cells
treated with high glucose concentration, insulin-stimulated glucose
consumption and glycogen synthesis in HepG2 cells treated with high
glucose (IR group) or normal (CON group) culture medium for 24 h
were compared. The results demonstrated that both glucose
consumption and glycogen synthesis were significantly decreased in
the IR group compared with the CON group, which indicated the
occurrence of insulin resistance in HepG2 cells treated in medium
with high glucose concentration (Fig.
1F and G). It has been reported that HGF regulates hepatic
glucose metabolism via the HGF/Met axis. As the receptor of HGF,
Met can transmit the HGF signal to directly engage INSR and form a
Met-INSR hybrid complex, which in turn activates a series of
insulin responses to promote glucose catabolism (11). In this context, the abundance of the
Met-INSR complex can serve as a marker influencing an insulin
response (30). By performing
immunoprecipitation assays, the results demonstrated that there was
an abundance of the Met-INSR complex in the IR group. The abundance
of the Met-INSR complex was significantly lower by ~50% in the IR
group compared with the CON group, suggesting that insulin
sensitivity was reduced in the IR group (Fig. 1H). Subsequently, RT-qPCR and western
blotting were performed to detect the expression levels of HGF in
the CON and IR groups in HepG2 cells. HGF mRNA and protein
expression levels were significantly decreased in the IR group
compared with the CON group (Fig. 1I
and J). Overall, the results suggested that HGF was associated
with insulin resistance and that it might serve as a biomarker of
insulin resistance in HepG2 cells.
HGF inhibits insulin resistance and
cell proliferation, but promotes cell apoptosis in HepG2 cells
Based on the hypothesis that the HGF gene might
serve as a biomarker of insulin resistance in HepG2 cells, the role
of HGF in insulin-resistant HepG2 cells was investigated. HepG2
cells transfected with si-HGF or OE-HGF were cultured with 30 mM
glucose (IR + si-HGF or IR + OE-HGF, respectively). For the control
group, HepG2 cells were cultured in normal culture medium. Western
blotting and RT-qPCR were performed to detect transfection
efficiency. si-HGF significantly reduced HGF mRNA and protein
expression levels by ~70% in insulin-resistant HepG2 cells compared
with the IR group (Fig. 2A and B).
Moreover, OE-HGF significantly increased HGF mRNA expression in
insulin-resistant HepG2 cells by >200% compared with the IR
group (Fig. 2A). The western
blotting results demonstrated that OE-HGF also significantly
increased the protein expression levels of HGF in insulin-resistant
HepG2 cells to a level almost twice as high compared with the IR
group (Fig. 2B). Consistent with
aforementioned results in insulin-resistant cells, control HepG2
cells (non-IR) transfected with si-HGF displayed significantly
reduced HGF mRNA and protein expression levels, whereas
transfection with OE-HGF significantly elevated HGF mRNA and
protein expression levels compared with the CON and combined NC
groups (Fig. S1). The
aforementioned results suggested high transfection efficiency of
si-HGF and OE-HGF in control and insulin-resistant HepG2 cells.
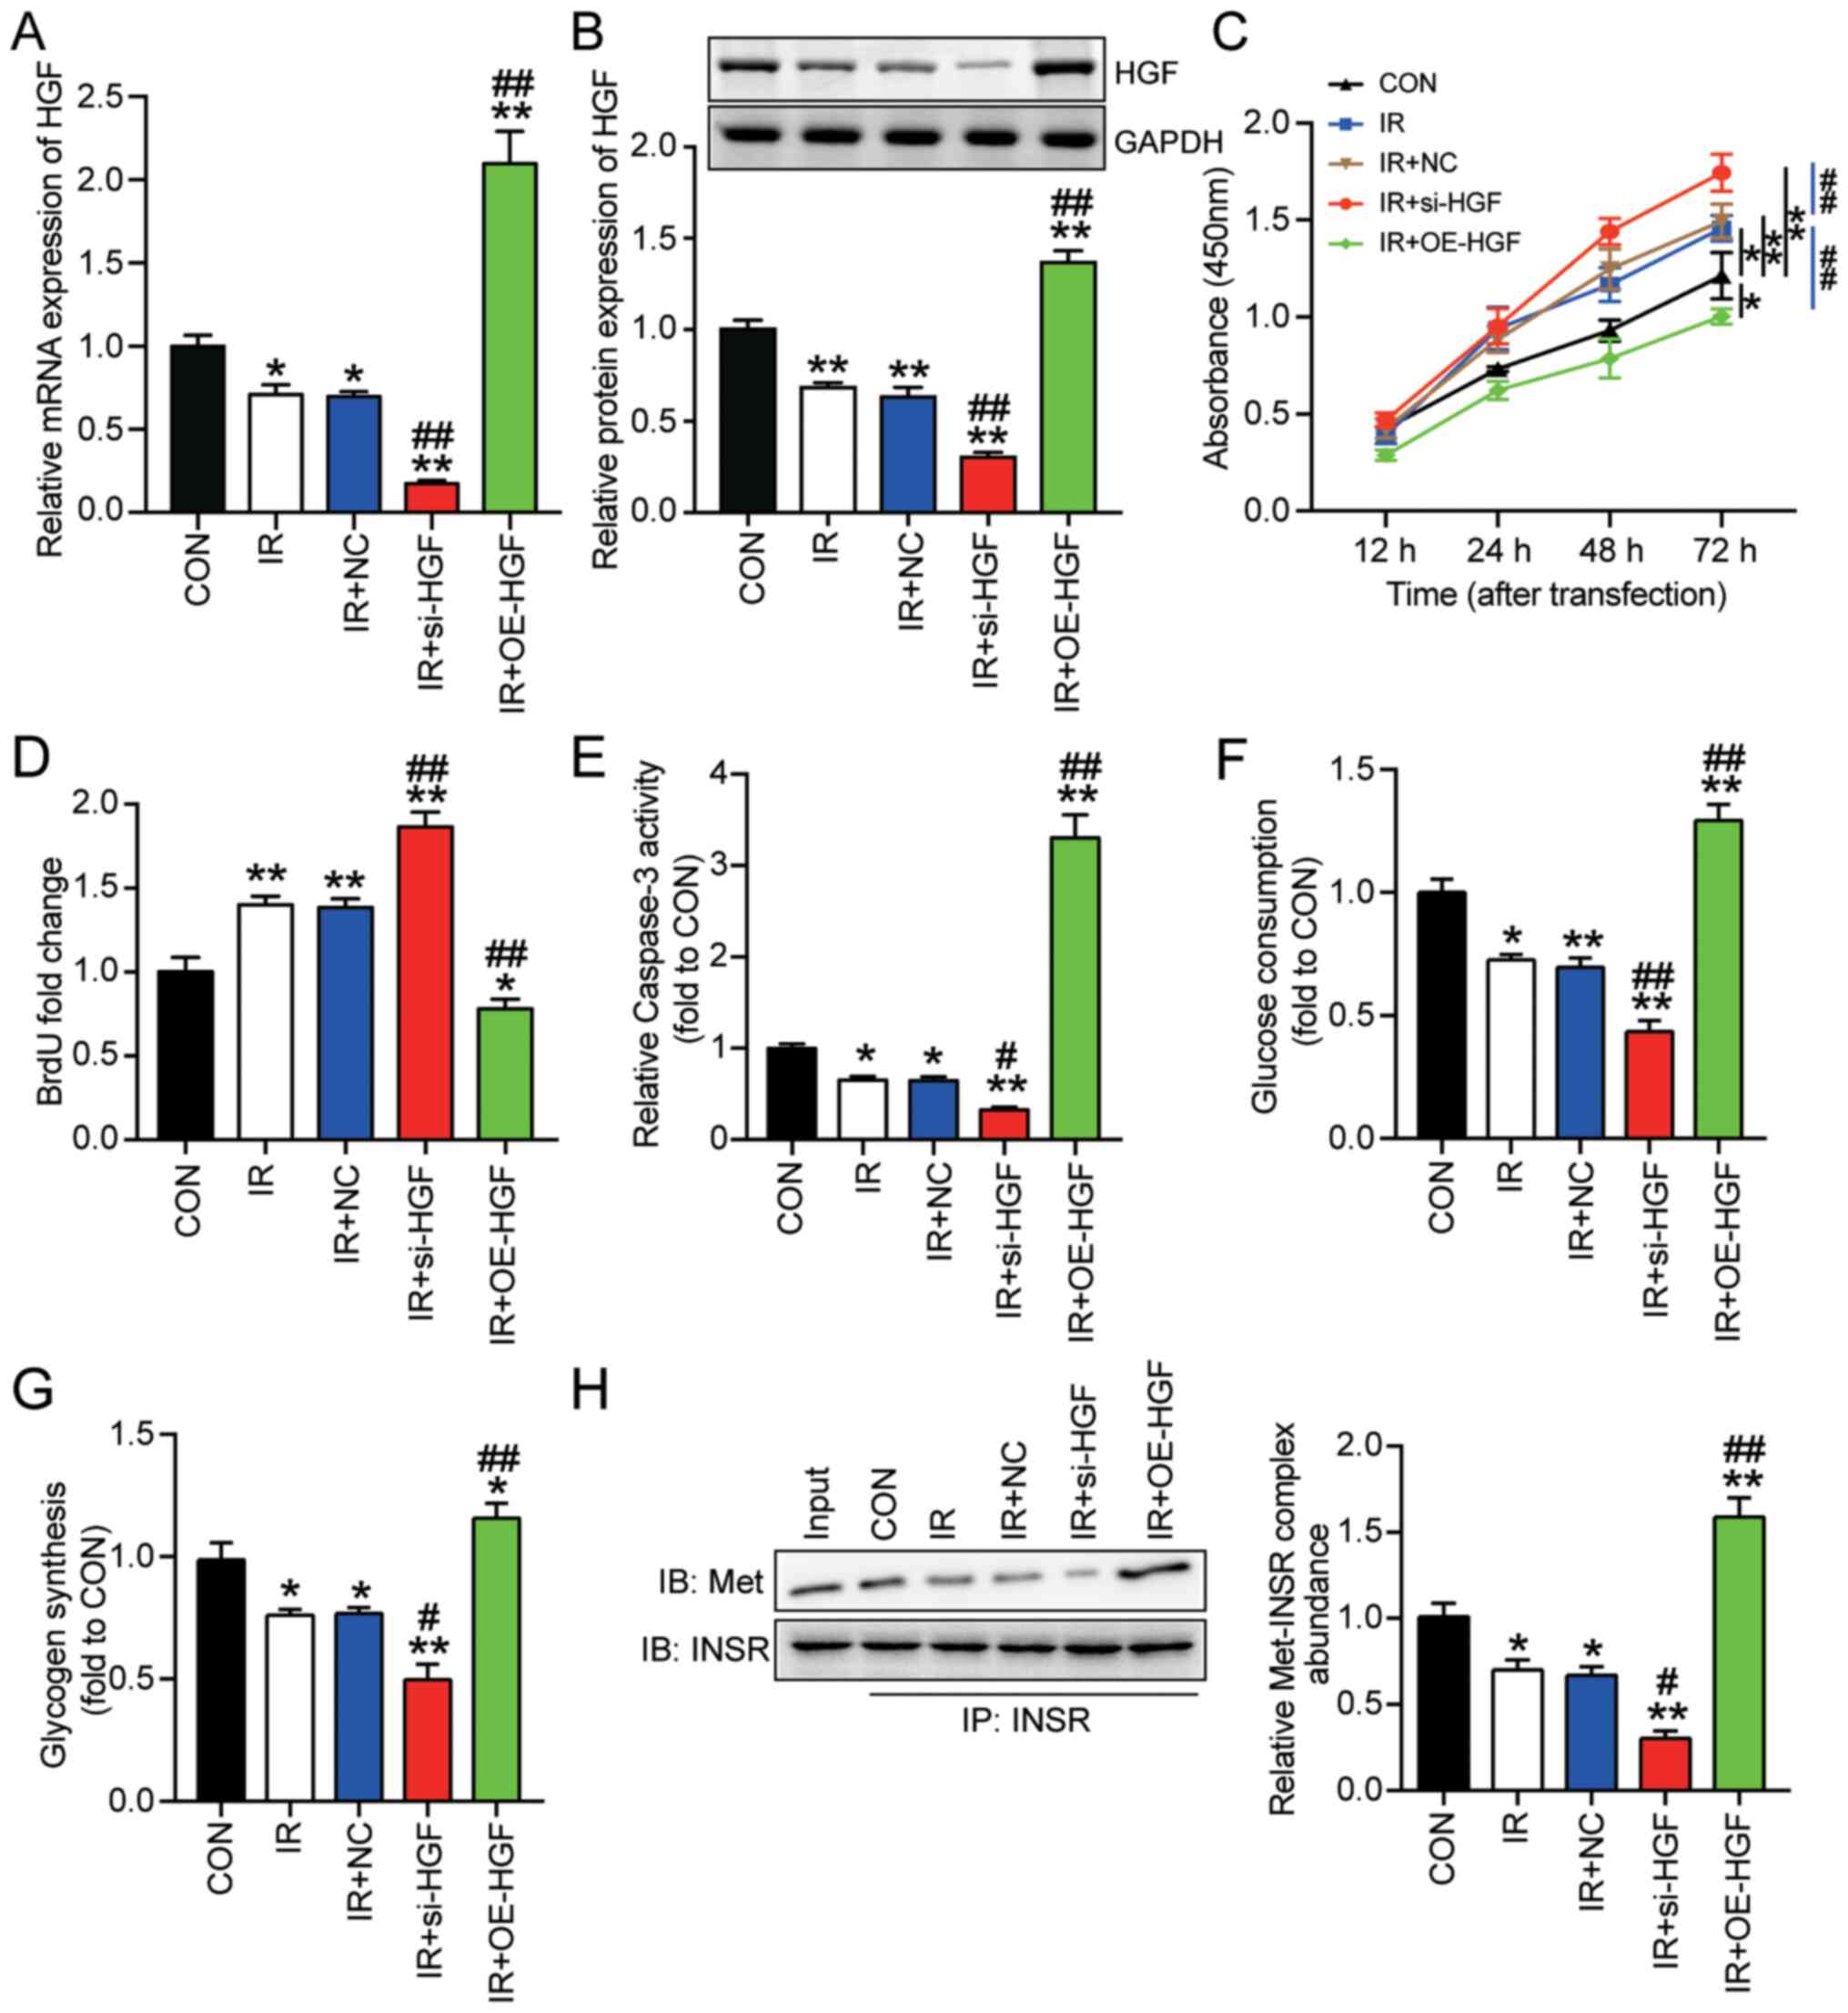 | Figure 2.Effect of HGF on insulin resistance
and tumorigenesis in HepG2 cells. Insulin-resistant HepG2 cells
were transfected with si-HGF or OE-HGF. HGF (A) mRNA and (B)
protein expression levels were measured via reverse
transcription-quantitative PCR and western blotting, respectively.
Cell (C) viability, (D) proliferation, (E) apoptosis, (F) glucose
consumption and (G) glycogen synthesis were assessed by performing
Cell Counting Kit-8, BrdU, caspase-3 activity, glucose consumption
and glycogen synthesis assays, respectively. (H) Met-INSR complex
abundance was assessed by performing immunoprecipitation assays.
Data are presented as the mean ± SD. *P<0.05 and **P<0.001
vs. CON; #P<0.05 and ##P<0.001 vs. IR.
HGF, hepatocyte growth factor; si, small interfering RNA; OE,
overexpression; Met-INSR, Met-insulin receptor; CON, blank control;
IR, insulin resistance; NC, negative control (mimic-NC +
inhibitor-NC); IB, immunoblotting; IP, immunoprecipitation. |
In terms of insulin resistance, OE-HGF significantly
suppressed HepG2 cell viability compared with the IR and CON groups
(Fig. 2C). By contrast, si-HGF
significantly enhanced HepG2 cell viability compared with the IR
and CON groups. A BrdU assay was performed to assess HepG2 cell
proliferation. Furthermore, OE-HGF significantly suppressed cell
proliferation by 40%, whereas si-HGF significantly enhanced cell
proliferation by ~30% compared with the IR group (Fig. 2D). The caspase-3 activity assay
results demonstrated that si-HGF significantly decreased cell
apoptosis by 50%, whereas OE-HGF significantly enhanced cell
apoptosis by 5-fold compared with the IR group (Fig. 2E). Similarly, compared with the IR
group, glucose consumption and glycogen synthesis were
significantly decreased by 30% in the IR + si-HGF group, but
significantly increased by 40% in the IR + OE-HGF group (Fig. 2F and G).
To further determine the effect of HGF on insulin
resistance, Met-INSR complex abundance in HepG2 cells under
different treatment conditions was determined. HGF knockdown
significantly decreased Met-INSR complex abundance by 50%, but HGF
overexpression significantly increased Met-INSR complex abundance
by 2-fold increase in insulin-resistant HepG2 cells compared with
the IR group (Fig. 2H). Overall,
the results indicated the inhibitory effect of HGF on insulin
resistance and tumorigenesis in HepG2 cells.
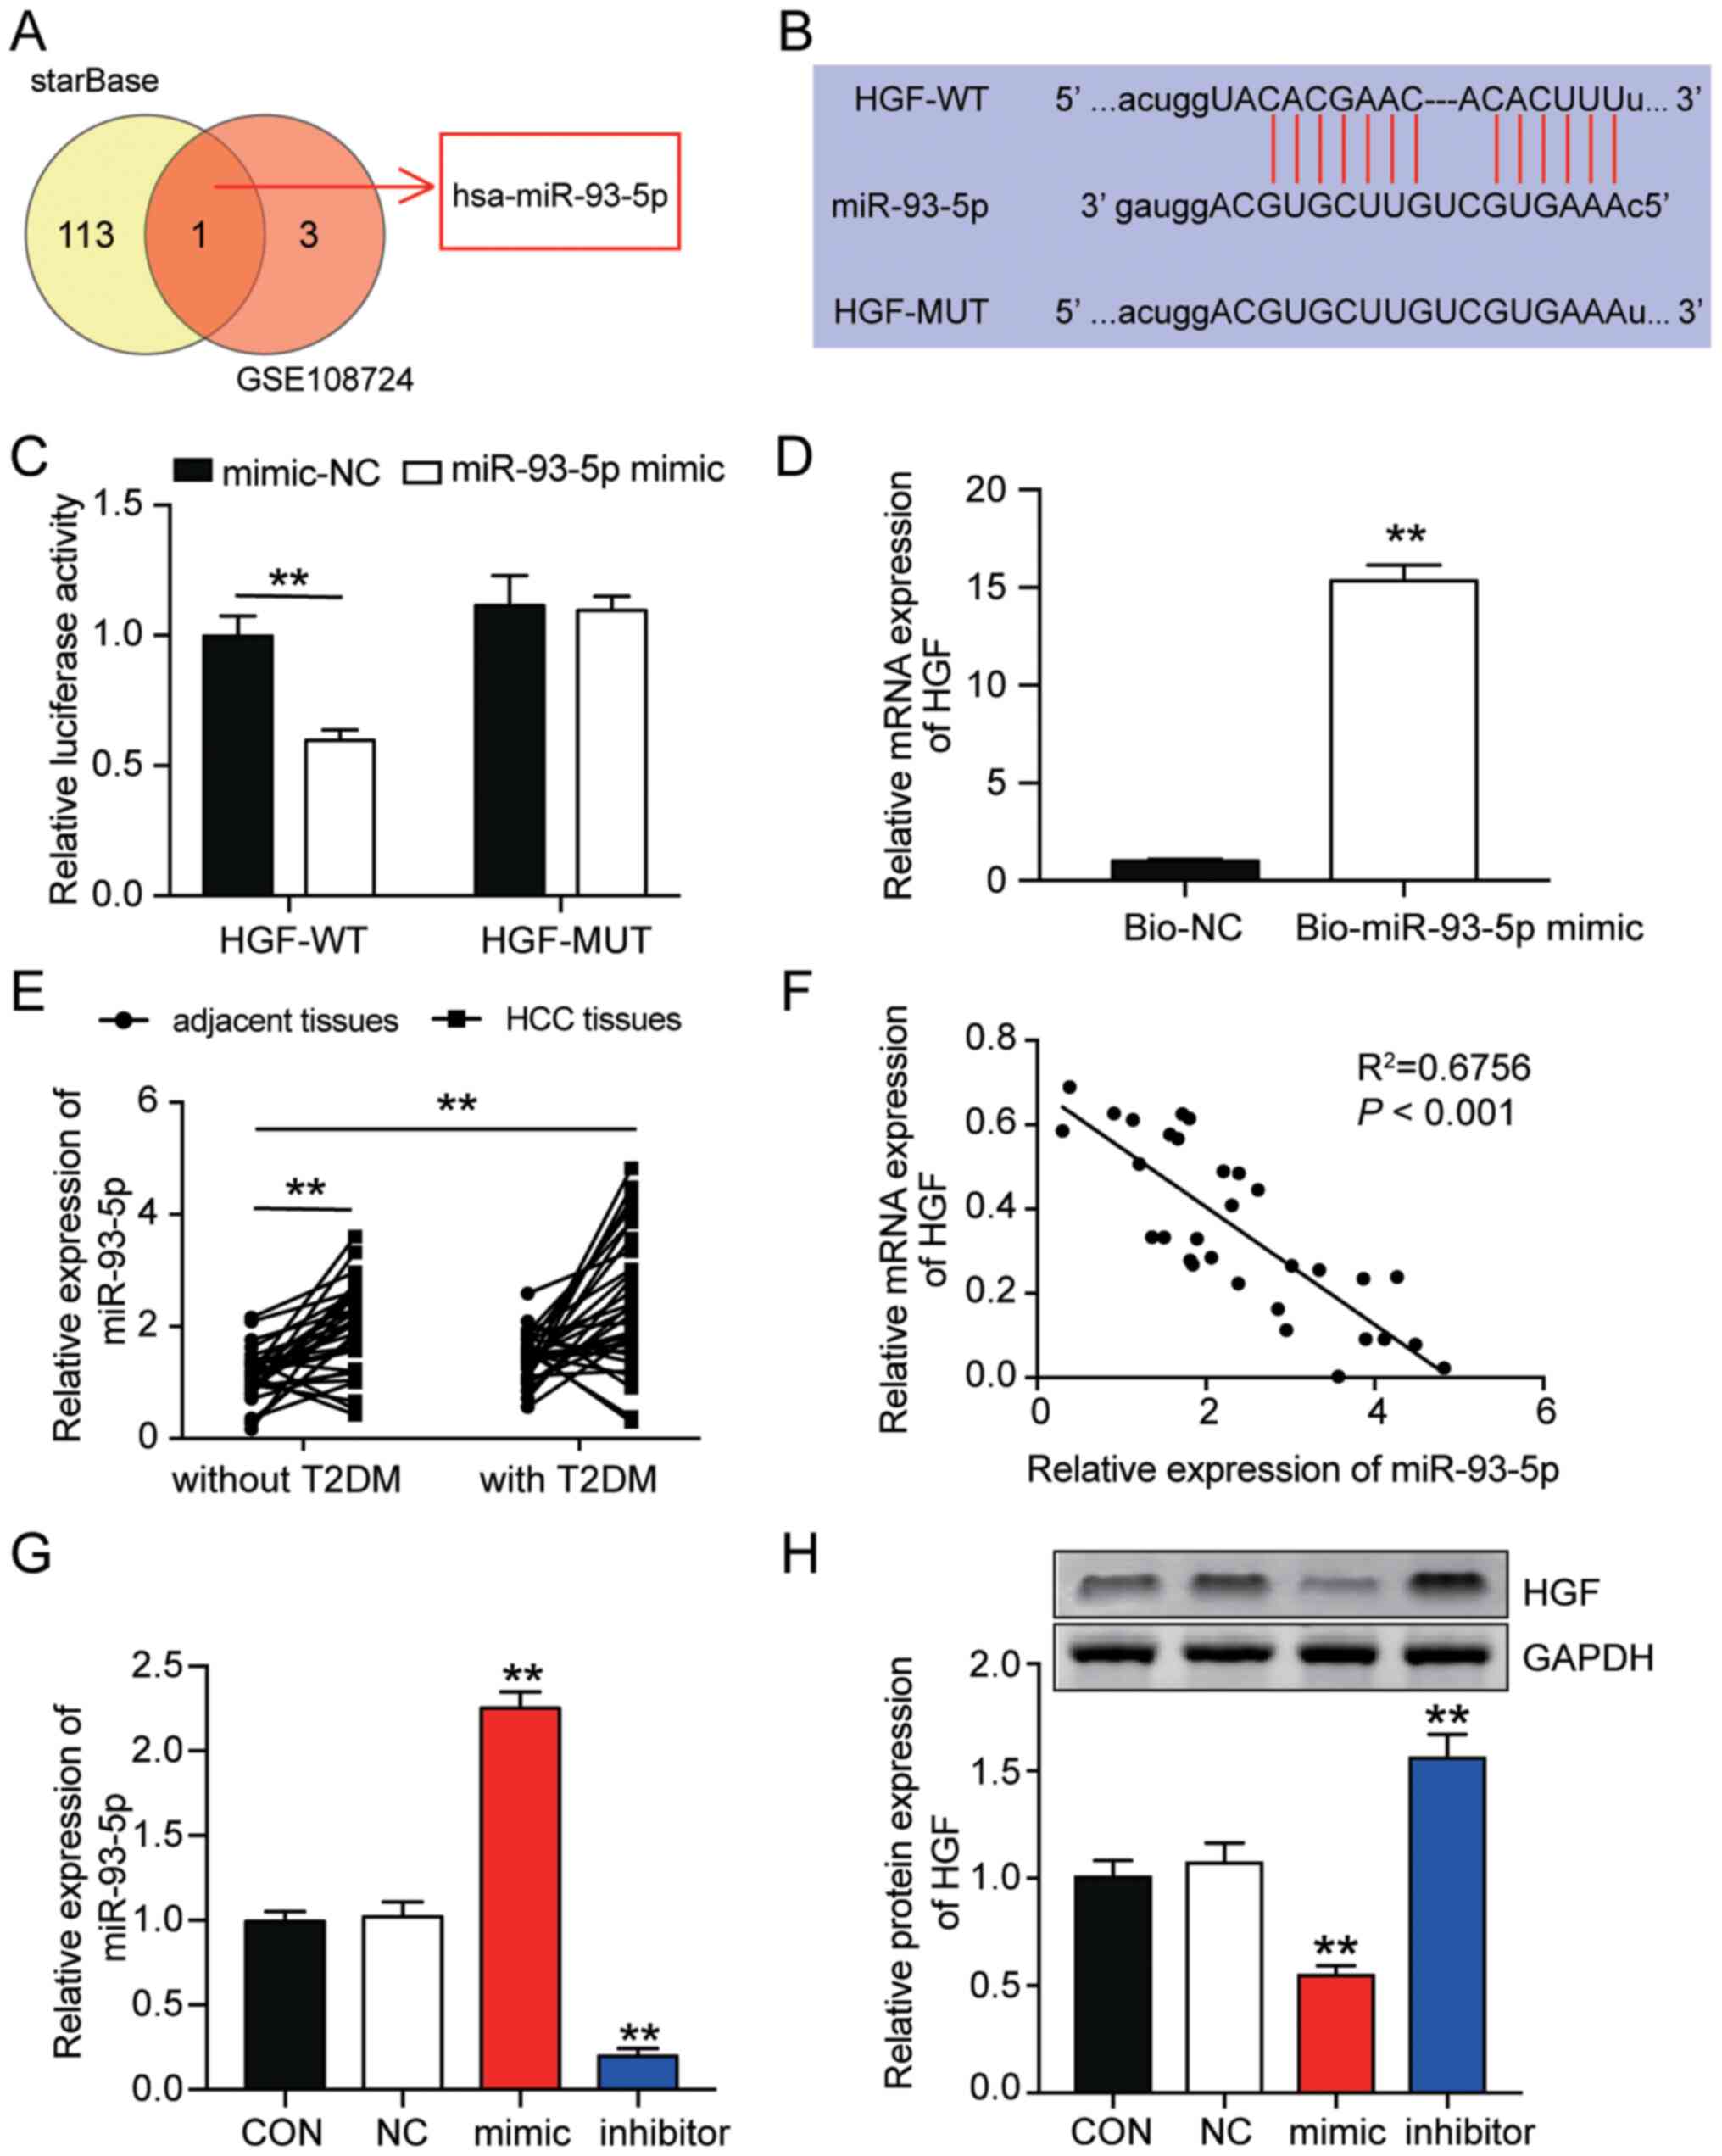
HGF is a downstream target gene of
miR-93-5p in HepG2 cells
To identify the key miRNA that participated in
insulin sensitivity by targeting HGF, the GSE108724 miRNA
expression microarray was used to identify upregulated miRNAs in
liver cancer. starBase was also used to identify miRNAs that bound
to HGF 3′UTR. miR-93-5p was the only miRNA that overlapped between
the analysis of the GSE108724 dataset and the starBase analysis
(Fig. 3A). Based on the starBase
results, it was hypothesized that miR-93-5p might target HGF;
therefore, WT and MUT sequences of HGF 3′UTR were constructed
(Fig. 3B). The dual-luciferase
reporter assay results demonstrated that miR-93-5p mimic
significantly suppressed the luciferase activity of HGF-WT by ~50%
compared with the mimic NC group, which further indicated that
miR-93-5p targeted HGF in insulin-resistant HepG2 cells (Fig. 3C). In addition, the RNA pull-down
assay results demonstrated that that miR-93-5p mimic effectively
pulled down HGF (Fig. 3D).
Although miR-93-5p expression was significantly
higher in HCC tissues compared with adjacent healthy tissues
without T2DM, it was not significantly different between adjacent
healthy tissues isolated from patients with T2DM and adjacent
healthy tissues isolated from patients without T2DM (Fig. 3E). Subsequently, a correlation
analysis between miR-93-5p expression and HGF expression was
conducted. The results demonstrated that miR-93-5p expression was
negatively correlated with HGF expression (Fig. 3F). Furthermore, in insulin-resistant
HepG2 cells, miR-93-5p inhibitor significantly downregulated
miR-93-5p expression by ~70%, whereas miR-93-5p mimic significantly
increased miR-93-5p expression by 2.5-fold compared with the CON
group or combined NC group (Figs.
3G and S2). Moreover,
miR-93-5p inhibitor significantly increased HGF protein expression
levels in insulin-resistant HepG2 cells by >50%, whereas
miR-93-5p mimic significantly suppressed HGF expression by ~50%
compared with the CON group (Fig.
3H).
miR-93-5p promotes insulin resistance
and the progression of HepG2 cells by restraining HGF
To investigate whether miR-93-5p promoted insulin
resistance in HepG2 cells, several experiments were conducted.
HepG2 cells co-transfected with miR-93-5p mimic or OE-HGF +
miR-93-5p mimic were cultured with in high concentration glucose
(IR + mimic or IR + OE-HGF + mimic, respectively). RT-qPCR and
western blotting were performed to detect HGF mRNA and protein
expression levels following miR-93-5p or HGF overexpression.
miR-93-5p mimic significantly downregulated HGF mRNA and protein
expression levels in insulin-resistant HepG2 cells compared with
the IR group. However, co-transfection of miR-93-5p mimic and
OE-HGF resulted in HGF expression levels in insulin-resistant HepG2
cells that were comparable with the IR group (Fig. 4A and B). Based on the CCK-8 assay
results, HepG2 cell viability was significantly increased by
miR-93-5p mimic compared with the IR group (Fig. 4C). However, co-transfection of
OE-HGF and miR-93-5p mimic restored HepG2 cell viability to a
similar level compared with the IR group. Similarly, the BrdU assay
results demonstrated that HepG2 cell proliferation was
significantly increased by 22% by miR-93-5p mimic compared with the
IR group, which was reversed by co-transfection with OE-HGF
(Fig. 4D).
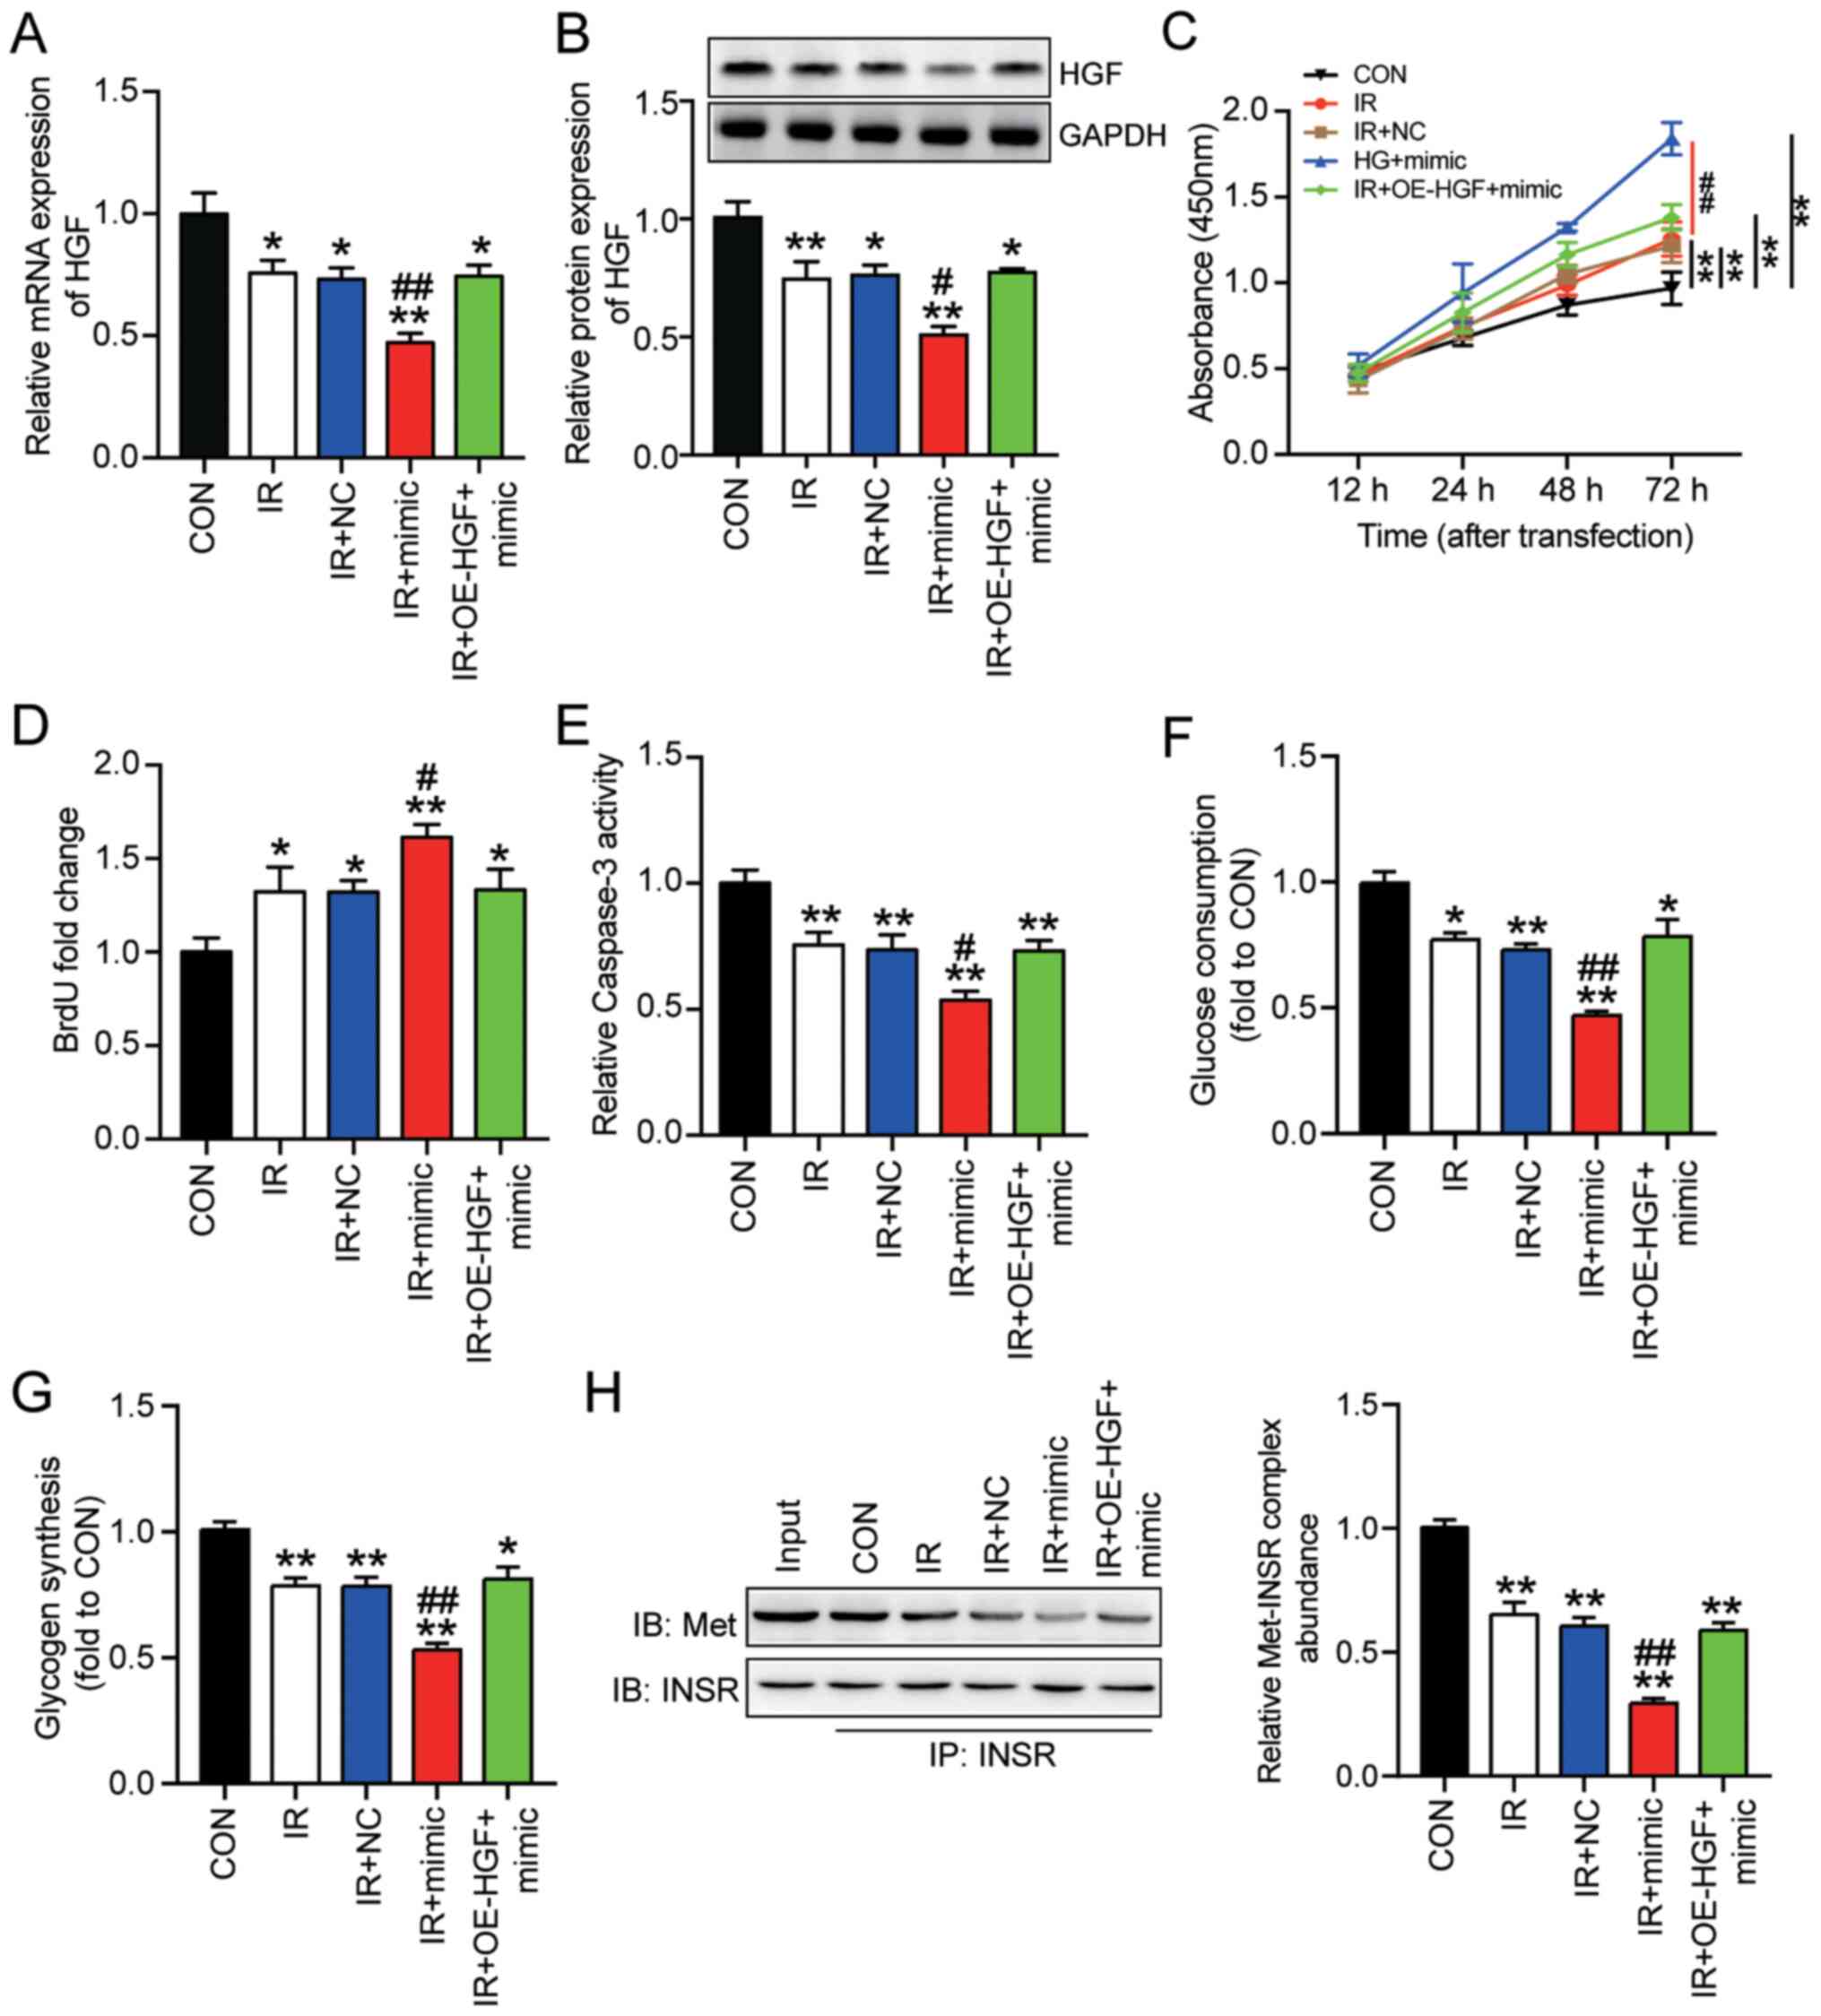 | Figure 4.miR-93-5p promotes insulin resistance
to regulate the progression of HepG2 cells by targeting HGF.
Insulin-resistant HepG2 cells were transfected with miR-93-5p mimic
or miR-93-5p mimic + OE-HGF. HGF (A) mRNA and (B) protein
expression levels were measured via reverse
transcription-quantitative PCR and western blotting, respectively.
Cell (C) viability, (D) proliferation (E) apoptosis, (F) glucose
consumption and (G) glycogen synthesis were assessed by performing
Cell Counting Kit-8, BrdU, caspase-3 activity, glucose consumption
and glycogen synthesis assays, respectively. (H) Met-INSR complex
abundance was assessed by performing immunoprecipitation assays.
Data are presented as the mean ± SD. *P<0.05 and **P<0.001
vs. CON; #P<0.05 and ##P<0.001 vs. IR.
miR, microRNA; HGF, hepatocyte growth factor; OE, overexpression;
Met-INSR, Met-insulin receptor; CON, blank control; IR, insulin
resistance; NC, negative control (mimic-NC + pcDNA3.1). |
Furthermore, the caspase-3 activity assay results
demonstrated that miR-93-5p mimic significantly decreased HepG2
cell apoptosis under insulin resistance conditions by ~30% compared
with the IR group (Fig. 4E).
Co-transfection of miR-93-5p mimic and OE-HGF induced similar
levels of cell apoptosis in insulin-resistant HepG2 cells compared
with the IR group. miR-93-5p mimic also significantly reduced
glucose consumption and glycogen synthesis in insulin-resistant
HepG2 cells compared with the IR group, but co-transfection with
OE-HGF reversed miR-93-5p mimic-mediated effects (Fig. 4F and G). Moreover, miR-93-5p mimic
significantly downregulated the abundance of the Met-INSR complex
by 50% in insulin-resistant HepG2 cells compared with the IR group,
and co-transfection with OE-HGF reversed miR-93-5p mimic-mediated
effects (Fig. 4H). Overall, the
results demonstrated the inhibitory effect of HGF on insulin
resistance and tumorigenesis in HepG2 cells. Furthermore, the
results indicated that miR-93-5p enhanced insulin resistance and
the progression of HepG2 cells by inhibiting HGF.
Discussion
T2DM is a serious health condition characterized by
high blood sugar and can trigger the development of other diseases,
including HCC (8). Therefore,
identifying molecular targets that can neutralize the negative
effects of T2DM is important. Despite displaying different
pathogeneses, T2DM has a mutually reinforcing effect with HCC
(8). By identifying the molecular
mechanism underlying insulin resistance in cells with HCC
important, patients with HCC can be effectively protected against
T2DM. In the present study, miR-93-5p expression was significantly
increased and HGF expression was significantly decreased in HCC
tissues isolated from patients with or without T2DM compared with
adjacent healthy tissues isolated from patients without T2DM. The
present study indicated that miR-93-5p could accelerate the tumor
phenotype of HepG2 cells and promote insulin resistance in HepG2
cells by directly targeting HGF.
In the case of human HCC, the homeostasis of the
liver is not well regulated, resulting in impaired metabolic
function, including dysregulated glucose metabolism, which further
leads to insulin resistance and T2DM (31). HGF, the dominant molecule activating
Met signaling, has been widely reported to display cancer
suppressive effects (32–34). However, the role of HGF in HCC is
not completely understood. Following injury, HGF is a key factor in
the maintenance of hepatic homeostasis (35), suggesting that HGF could serve as a
putative factor in the prevention of insulin resistance and T2DM.
Similarly, previous studies reported that HGF could stimulate
glucose uptake, and protect against obesity and insulin resistance
(36,37). Therefore, it was hypothesized that
HGF might participate in the regulation of insulin resistance and
T2DM in HepG2 cells.
In the present study, the results demonstrated that
HGF suppressed the tumor phenotype progression of HepG2 cells,
which was consistent with previous studies on other types of
cancer, such as bladder, head and neck, and cervical cancer
(32–34). Moreover, the results indicated that
HGF decreased insulin resistance in HepG2 cells, which was also
consistent with previous studies (36,37).
Therefore, the present study identified HGF as a potential molecule
that protected against HCC and T2DM.
miRNAs are a class of regulatory molecules that
affect glucose metabolism and cancer development (19,38).
The bioinformatics analysis conducted in the present study
indicated that miR-93-5p might target HGF and participate in the
development of liver cancer. Based on the literature, miR-93-5p has
been reported to serve considerable roles in tumorigenesis in
multiple types of cancer, including gastric cancer (39), small cell lung cancer (40), and squamous cell carcinoma of the
head and neck (41). The
aforementioned studies demonstrated that miR-93-5p promoted
tumorigenesis. Apart from its tumorigenesis role, miR-93-5p also
enhanced human HCC cell proliferation (22,42).
Given the mutually promoting action between human HCC and insulin
resistance triggered T2DM, it was hypothesized that miR-93-5p might
mediate the occurrence of insulin resistance in HCC cell lines.
Similar to previous studies, the results of the present study
demonstrated that compared with the IR group, miR-93-5p mimic
significantly promoted cell proliferation, but significantly
inhibited cell apoptosis in insulin-resistant HepG2 cells, which
indicated a tumor promoting effect of miR-93-5p in HCC.
Furthermore, in the present study, several assays, including
glucose consumption and glycogen synthesis assays, were performed
to determine the role of miR-93-5p in insulin resistance. miR-93-5p
expression was significantly increased in HCC tissues isolated from
patients with T2DM compared with adjacent tissues isolated from
patients without T2DM. Moreover, the results indicated that
miR-93-5p promoted insulin resistance in HepG2 cells. Furthermore,
the results of the present study indicated that miR-93-5p mediated
its effects on insulin-resistant HepG2 cells by inhibiting HGF.
The present study had a number of limitations.
First, the effect of the miR-93-5p/HGF axis on insulin resistance
in vivo was not assessed. In future studies, an appropriate
animal model should be constructed to assess the effect of the
miR-93-5p/HGF axis on insulin resistance in vivo. Moreover,
the present study only used HCC cell lines and tissues isolated
from patients with HCC, which made it difficult to assess whether
the proposed mechanism was only suitable for patients with
diabetes. According to the results of the present study, HGF
expression was downregulated and miR-93-5p expression was
upregulated in HCC tissues with or without T2DM compared with
adjacent healthy hepatic tissues of patients with HCC without T2DM.
Although the results did not entirely represent the expression
patterns of HGF and miR-93-5p in patients with T2DM and healthy
controls, the results suggested that there might be a similar
regulatory mechanism in patients with T2DM alone.
In summary, the present study suggested that
miR-93-5p enhanced insulin resistance to regulate T2DM progression
in HepG2 cells by targeting HGF. The results of the present study
further suggested that miR-93-5p or HGF might serve as novel
therapeutic targets for T2DM.
Supplementary Material
Supporting Data
Acknowledgements
Not applicable.
Funding
No funding was received.
Availability of data and materials
The datasets used and/or analyzed during the current
study are available from the corresponding author on reasonable
request.
Authors' contributions
DG designed the study. MZ, YH, JW and GL performed
the experiments. PC, WC and LH performed the experiments and
drafted the manuscript. JW and GL confirm the authenticity of all
the raw data. All authors read and approved the final
manuscript.
Ethics approval and consent to
participate
The present study was approved by the Ethics
Committee of Wuhan Third Hospital (approval no. KY2020-015). All
patients provided written informed consent.
Patient consent for publication
Not applicable.
Competing interests
The authors declare that they have no competing
interests.
References
|
1
|
Triplitt CL: Examining the mechanisms of
glucose regulation. Am J Manag Care. 18 (Suppl 1):S4–S10.
2012.PubMed/NCBI
|
|
2
|
Chatterjee S, Khunti K and Davies MJ: Type
2 diabetes. Lancet. 389:2239–2251. 2017. View Article : Google Scholar : PubMed/NCBI
|
|
3
|
Petersen MC and Shulman GI: Mechanisms of
insulin action and insulin resistance. Physiol Rev. 98:2133–2223.
2018. View Article : Google Scholar : PubMed/NCBI
|
|
4
|
Chan JC, Malik V, Jia W, Kadowaki T,
Yajnik CS, Yoon KH and Hu FB: Diabetes in Asia: Epidemiology, risk
factors, and pathophysiology. JAMA. 301:2129–2140. 2009. View Article : Google Scholar : PubMed/NCBI
|
|
5
|
Riddy DM, Delerive P, Summers RJ, Sexton
PM and Langmead CJ: G Protein-coupled receptors targeting insulin
resistance, obesity, and type 2 diabetes mellitus. Pharmacol Rev.
70:39–67. 2018. View Article : Google Scholar : PubMed/NCBI
|
|
6
|
Li G, Zhou F, Chen Y, Zhang W and Wang N:
Kukoamine A attenuates insulin resistance and fatty liver through
downregulation of Srebp-1c. Biomed Pharmacother. 89:536–543. 2017.
View Article : Google Scholar : PubMed/NCBI
|
|
7
|
von Horn C and Minor T: Modern concepts
for the dynamic preservation of the liver and kidneys in the
context of transplantation. Pathologe. 40:292–298. 2019.(In
German). View Article : Google Scholar : PubMed/NCBI
|
|
8
|
El-Serag HB, Hampel H and Javadi F: The
association between diabetes and hepatocellular carcinoma: a
systematic review of epidemiologic evidence. Clin Gastroenterol
Hepatol. 4:369–380. 2006. View Article : Google Scholar : PubMed/NCBI
|
|
9
|
Polesel J, Zucchetto A, Montella M, Dal
Maso L, Crispo A, La Vecchia C, Serraino D, Franceschi S and
Talamini R: The impact of obesity and diabetes mellitus on the risk
of hepatocellular carcinoma. Ann Oncol. 20:353–357. 2009.
View Article : Google Scholar : PubMed/NCBI
|
|
10
|
Ueki T, Kaneda Y, Tsutsui H, Nakanishi K,
Sawa Y, Morishita R, Matsumoto K, Nakamura T, Takahashi H, Okamoto
E, et al: Hepatocyte growth factor gene therapy of liver cirrhosis
in rats. Nat Med. 5:226–230. 1999. View
Article : Google Scholar : PubMed/NCBI
|
|
11
|
Fafalios A, Ma J, Tan X, Stoops J, Luo J,
Defrances MC and Zarnegar R: A hepatocyte growth factor receptor
(Met)-insulin receptor hybrid governs hepatic glucose metabolism.
Nat Med. 17:1577–1584. 2011. View
Article : Google Scholar : PubMed/NCBI
|
|
12
|
Zhang YY, Li C, Yao GF, Du LJ, Liu Y,
Zheng XJ, Yan S, Sun JY, Liu Y, Liu MZ, et al: Deletion of
Macrophage Mineralocorticoid Receptor Protects Hepatic Steatosis
and Insulin Resistance Through ERα/HGF/Met Pathway. Diabetes.
66:1535–1547. 2017. View Article : Google Scholar : PubMed/NCBI
|
|
13
|
Oliveira AG, Araújo TG, Carvalho BM, Rocha
GZ, Santos A and Saad MJ: The role of hepatocyte growth factor
(HGF) in insulin resistance and diabetes. Front Endocrinol
(Lausanne). 9:5032018. View Article : Google Scholar : PubMed/NCBI
|
|
14
|
Li Z, Xu R and Li N: MicroRNAs from plants
to animals, do they define a new messenger for communication? Nutr
Metab (Lond). 15:682018. View Article : Google Scholar : PubMed/NCBI
|
|
15
|
Reinhart BJ, Weinstein EG, Rhoades MW,
Bartel B and Bartel DP: MicroRNAs in plants. Genes Dev.
16:1616–1626. 2002. View Article : Google Scholar : PubMed/NCBI
|
|
16
|
Nicolai S, Pieraccioli M, Smirnov A,
Pitolli C, Anemona L, Mauriello A, Candi E,
Annicchiarico-Petruzzelli M, Shi Y, Wang Y, et al: ZNF281/Zfp281 is
a target of miR-1 and counteracts muscle differentiation. Mol
Oncol. 14:294–308. 2020. View Article : Google Scholar : PubMed/NCBI
|
|
17
|
Bartel DP: MicroRNAs: Genomics,
biogenesis, mechanism, and function. Cell. 116:281–297. 2004.
View Article : Google Scholar : PubMed/NCBI
|
|
18
|
Fischer C, Seki T, Lim S, Nakamura M,
Andersson P, Yang Y, Honek J, Wang Y, Gao Y, Chen F, et al: A
miR-327-FGF10-FGFR2-mediated autocrine signaling mechanism controls
white fat browning. Nat Commun. 8:20792017. View Article : Google Scholar : PubMed/NCBI
|
|
19
|
Trajkovski M, Hausser J, Soutschek J, Bhat
B, Akin A, Zavolan M, Heim MH and Stoffel M: MicroRNAs 103 and 107
regulate insulin sensitivity. Nature. 474:649–653. 2011. View Article : Google Scholar : PubMed/NCBI
|
|
20
|
Pardo F, Villalobos-Labra R, Sobrevia B,
Toledo F and Sobrevia L: Extracellular vesicles in obesity and
diabetes mellitus. Mol Aspects Med. 60:81–91. 2018. View Article : Google Scholar : PubMed/NCBI
|
|
21
|
Thurnherr T, Mah WC, Lei Z, Jin Y, Rozen
SG and Lee CG: Differentially expressed miRNAs in hepatocellular
carcinoma target genes in the genetic information processing and
metabolism pathways. Sci Rep. 6:200652016. View Article : Google Scholar : PubMed/NCBI
|
|
22
|
Wang X, Liao Z, Bai Z, He Y, Duan J and
Wei L: MiR-93-5p Promotes cell proliferation through
down-regulating PPARGC1A in hepatocellular carcinoma cells by
bioinformatics analysis and experimental verification. Genes
(Basel). 9:92018. View Article : Google Scholar
|
|
23
|
Aravinthan A, Challis B, Shannon N, Hoare
M, Heaney J and Alexander GJ: Selective insulin resistance in
hepatocyte senescence. Exp Cell Res. 331:38–45. 2015. View Article : Google Scholar : PubMed/NCBI
|
|
24
|
Williams JF and Olefsky JM: Defective
insulin receptor function in down-regulated HepG2 cells.
Endocrinology. 127:1706–1717. 1990. View Article : Google Scholar : PubMed/NCBI
|
|
25
|
Wang H, Huo X, Yang XR, He J, Cheng L,
Wang N, Deng X, Jin H, Wang N, Wang C, et al: STAT3-mediated
upregulation of lncRNA HOXD-AS1 as a ceRNA facilitates liver cancer
metastasis by regulating SOX4. Mol Cancer. 16:1362017. View Article : Google Scholar : PubMed/NCBI
|
|
26
|
Darpolor MM, Basu SS, Worth A, Nelson DS,
Clarke-Katzenberg RH, Glickson JD, Kaplan DE and Blair IA: The
aspartate metabolism pathway is differentiable in human
hepatocellular carcinoma: Transcriptomics and (13) C-isotope based
metabolomics. NMR Biomed. 27:381–389. 2014. View Article : Google Scholar : PubMed/NCBI
|
|
27
|
Schmidt JA, Avarbock MR, Tobias JW and
Brinster RL: Identification of glial cell line-derived neurotrophic
factor-regulated genes important for spermatogonial stem cell
self-renewal in the rat. Biol Reprod. 81:56–66. 2009. View Article : Google Scholar : PubMed/NCBI
|
|
28
|
Zhu HR, Yu XN, Zhang GC, Shi X,
Bilegsaikhan E, Guo HY, Liu LL, Cai Y, Song GQ, Liu TT, et al:
Comprehensive analysis of long non coding RNA messenger RNA
microRNA co expression network identifies cell cycle related lncRNA
in hepatocellular carcinoma. Int J Mol Med. 44:1844–1854.
2019.PubMed/NCBI
|
|
29
|
Livak KJ and Schmittgen TD: Analysis of
relative gene expression data using real-time quantitative PCR and
the 2(-Delta Delta C(T)) method. Methods. 25:402–408. 2001.
View Article : Google Scholar : PubMed/NCBI
|
|
30
|
Tsai S, Clemente-Casares X, Zhou AC, Lei
H, Ahn JJ, Chan YT, Choi O, Luck H, Woo M, Dunn SE, et al: Insulin
Receptor-Mediated Stimulation Boosts T Cell Immunity during
Inflammation and Infection. Cell Metab. 28:922–934.e4. 2018.
View Article : Google Scholar : PubMed/NCBI
|
|
31
|
Mantovani A and Targher G: Type 2 diabetes
mellitus and risk of hepatocellular carcinoma: Spotlight on
nonalcoholic fatty liver disease. Ann Transl Med. 5:2702017.
View Article : Google Scholar : PubMed/NCBI
|
|
32
|
Sim WJ, Iyengar PV, Lama D, Lui SKL, Ng
HC, Haviv-Shapira L, Domany E, Kappei D, Tan TZ, Saei A, et al:
c-Met activation leads to the establishment of a TGFβ-receptor
regulatory network in bladder cancer progression. Nat Commun.
10:43492019. View Article : Google Scholar : PubMed/NCBI
|
|
33
|
Hartmann S, Bhola NE and Grandis JR:
HGF/Met Signaling in head and neck cancer: Impact on the tumor
microenvironment. Clin Cancer Res. 22:4005–4013. 2016. View Article : Google Scholar : PubMed/NCBI
|
|
34
|
Boromand N, Hasanzadeh M, ShahidSales S,
Farazestanian M, Gharib M, Fiuji H, Behboodi N, Ghobadi N,
Hassanian SM, Ferns GA, et al: Clinical and prognostic value of the
C-Met/HGF signaling pathway in cervical cancer. J Cell Physiol.
233:4490–4496. 2018. View Article : Google Scholar : PubMed/NCBI
|
|
35
|
Coudriet GM, Stoops J, Orr AV, Bhushan B,
Koral K, Lee S, Previte DM, Dong HH, Michalopoulos GK, Mars WM, et
al: A noncanonical role for plasminogen activator inhibitor type 1
in obesity-induced diabetes. Am J Pathol. 189:1413–1422. 2019.
View Article : Google Scholar : PubMed/NCBI
|
|
36
|
Muratsu J, Iwabayashi M, Sanada F,
Taniyama Y, Otsu R, Rakugi H and Morishita R: Hepatocyte growth
factor prevented high-fat diet-induced obesity and improved insulin
resistance in mice. Sci Rep. 7:1302017. View Article : Google Scholar : PubMed/NCBI
|
|
37
|
Bertola A, Bonnafous S, Cormont M, Anty R,
Tanti JF, Tran A, Le Marchand -Brustel Y and Gual P: Hepatocyte
growth factor induces glucose uptake in 3T3-L1 adipocytes through A
Gab1/phosphatidylinositol 3-kinase/Glut4 pathway. J Biol Chem.
282:10325–10332. 2007. View Article : Google Scholar : PubMed/NCBI
|
|
38
|
Calin GA and Croce CM: MicroRNA signatures
in human cancers. Nat Rev Cancer. 6:857–866. 2006. View Article : Google Scholar : PubMed/NCBI
|
|
39
|
Ma DH, Li BS, Liu JJ, Xiao YF, Yong X,
Wang SM, Wu YY, Zhu HB, Wang DX and Yang SM: miR-93-5p/IFNAR1 axis
promotes gastric cancer metastasis through activating the STAT3
signaling pathway. Cancer Lett. 408:23–32. 2017. View Article : Google Scholar : PubMed/NCBI
|
|
40
|
Huang W, Yang Y, Wu J, Niu Y, Yao Y, Zhang
J, Huang X, Liang S, Chen R, Chen S, et al: Circular RNA cESRP1
sensitises small cell lung cancer cells to chemotherapy by sponging
miR-93-5p to inhibit TGF-β signalling. Cell Death Differ.
27:1709–1727. 2020. View Article : Google Scholar : PubMed/NCBI
|
|
41
|
Zhang S, He Y, Liu C, Li G, Lu S, Jing Q,
Chen X, Ma H, Zhang D, Wang Y, et al: miR-93-5p enhances migration
and invasion by targeting RGMB in squamous cell carcinoma of the
head and neck. J Cancer. 11:3871–3881. 2020. View Article : Google Scholar : PubMed/NCBI
|
|
42
|
Chen C, Zheng Q, Kang W and Yu C: Long
non-coding RNA LINC00472 suppresses hepatocellular carcinoma cell
proliferation, migration and invasion through miR-93-5p/PDCD4
pathway. Clin Res Hepatol Gastroenterol. 43:436–445. 2019.
View Article : Google Scholar : PubMed/NCBI
|
|
43
|
Vauthey JN, Lauwers GY, Esnaola NF, Do KA,
Belghiti J, Mirza N, Curley SA, Ellis LM, Regimbeau JM, Rashid A,
et al: Simplified staging for hepatocellular carcinoma. J Clin
Oncol. 20:1527–1536. 2002. View Article : Google Scholar : PubMed/NCBI
|