Introduction
Embryonic stem cells (ESCs) can be derived from the
inner cell mass from mouse (1) or
human (2) embryos. ESCs have
unlimited potential for self-renewal and pluripotency, allowing for
their differentiation into all types of cell (3). ESC self-renewal can be maintained by
leukemia inhibitory factor (LIF) in mouse (m)ESCs and by basic
fibroblast growth factor in human ESCs (1,2).
Induced pluripotent stem cells (iPSCs) can be derived from somatic
cells by transducing them with a set of reprogramming factors, such
as Oct3/4, Sox2, c-Myc, Kruppel like factor 4, lin-28 homolog A and
Nanog (4,5), and can be used in patient-specific
regenerative medicine. However, under commonly used culture
conditions, involving leukemia inhibitory factor plus fetal bovine
serum, for in vitro expansion, iPSCs tend to spontaneously
differentiate (6). It is necessary
to understand the molecular mechanisms of ESC self-renewal to
establish efficient in vitro expansion systems for stem cell
therapy.
LIF, an interleukin-6 family cytokine, binds to a
heterodimeric receptor consisting of the low-affinity LIF receptor
and gp130 (7). LIF receptor-gp130
dimerization leads to Janus kinase (JAK) activation and signal STAT
phosphorylation (8). JAKs also
stimulate phosphatidylinositol 3-kinase by phosphorylating its
regulatory subunit p85, thereby activating AKT serine/threonine
kinase 1 (9), to inhibit its major
target protein glycogen synthetase kinase 3β, resulting in
increased levels of Nanog homeobox and Myc proto-oncogene, a basic
helix-loop-helix transcription factor, which are important
regulators of mESC self-renewal (10). JAKs also phosphorylate protein
tyrosine phosphatase non-receptor type 11, which then interacts
with the growth factor receptor-bound protein 2-SOS Ras/Rac guanine
nucleotide exchange factor 1 complex to activate the MAPK pathway
(11). This indicates that LIF
induces the phosphorylation of numerous proteins by regulating a
number of protein kinases and phosphatases. Thus, LIF-mediated
phosphorylation/dephosphorylation profiling in mESCs may be helpful
for understanding the molecular mechanisms underlying their
self-renewal.
In order to identify proteins that are
phosphorylated/dephosphorylated following LIF treatment of mESCs,
two-dimensional (2-D) differential in-gel electrophoresis (DIGE),
phosphostaining, and protein identification by mass spectrometry
(MS) were performed in the present study. The present study aimed
to compare phosphorylation in LIF-deprived and LIF-treated mESCs,
and to identify LIF-mediated phosphorylated or dephosphorylated
proteins.
Materials and methods
Cell culture and treatment
The mESC cell line ES-R1 (Sigma-Aldrich; Merck KGaA)
was maintained on 0.2% gelatin-coated plates in DMEM supplemented
with 15% fetal bovine serum and 1% GlutaMAX, 1% non-essential amino
acids, antibiotics, 100 µM 2-mercaptoethanol and 1,000 U/ml
recombinant LIF (all purchased from Gibco; Thermo Fisher
Scientific, Inc.).
Western blotting
Following 24-h culture in the absence of LIF, mESCs
were washed with PBS three times and treated with PBS or 1,000 U/ml
LIF (in DMEM supplemented with 1% GlutaMAX and 1% non-essential
amino acids) for different durations at 37°C. Total protein was
extracted from cells using M-PER mammalian protein extraction
reagent (Pierce; Thermo Fisher Scientific, Inc.) supplemented with
a protease inhibitor cocktail (cOmplete™; Roche Diagnostics) and a
phosphatase inhibitor cocktail (PhosSTOP™; Roche Diagnostics) on
ice for 1 h. Total protein was quantified by the Bradford's method
using Protein Assay Dye Reagent Concentrate (Bio-Rad Laboratories,
Inc.). Following centrifugation at 10,000 × g for 10 min at 37°C,
proteins (20 µg/lane) were separated via 9% SDS-PAGE and
transferred to PVDF membranes. The blots were incubated overnight
at 4°C with the following primary antibodies: Anti-phosphoserine
(cat. no. AB1603; 1:5,000; Chemicon International; Thermo Fisher
Scientific, Inc.), anti-phosphothreonine (cat. no. sc-5267; 1:200;
Santa Cruz Biotechnology, Inc.), anti-phosphotyrosine (cat. no.
05-321; 1:5,000; EMD Millipore), anti-HSP90α (cat. no. PA5-16341;
1:2,000; Invitrogen; Thermo Fisher Scientific, Inc.),
anti-phospho-HSP90α (cat. no. 3488; 1:2,000; Cell Signaling
Technology, Inc.) and anti-β-actin (cat, no. A5441; 1:5,000;
Sigma-Aldrich; Merck KGaA). Following primary incubation, the
membranes were incubated for 40 min at room temperature with goat
anti-mouse (cat. no. sc-2005; 1:1,000; Santa Cruz Biotechnology,
Inc.) or anti-rabbit (cat. no. A16035; 1:4,000; Thermo Fisher
Scientific, Inc.) alkaline phosphatase-conjugated secondary
antibodies. Protein bands were visualized using an ECL system
(Intron Biotechnology, Inc.) and a Fusion Fx7 Spectra (Vilber
Lourmat). Protein expression was quantified using Fusion-Capt
software (version 16.08; Vilber Lourmat).
Preparation of samples for 2-D
DIGE
Nagy R1 mESC pellets (10 mg) were suspended in 200
µl 2-D cell lysis buffer [30 mM Tris-HCl (pH 8.8), 7 M urea, 2 M
thiourea and 4%
3-[(3-cholamidopropyl)dimethylammonio]-1-propanesulfonate (CHAPS)],
sonicated at 4°C for 3×30 sec between a 2 min interval and agitated
for 30 min at room temperature. The samples were then centrifuged
at 4°C for 30 min at 14,000 × g and the supernatants were
collected. Protein concentrations were measured using a protein
assay kit (cat. no. 5000001, Bio-Rad Laboratories, Inc.).
Protein staining with CyDye
For protein staining, 30 µg mESC lysate was labeled
with CyDye on ice in the dark for 30 min. The reaction was stopped
by adding 1 µl 10 mM lysine and incubating the lysates on ice in
the dark for an additional 15 min. Next, 2-D sample buffer [8 M
urea, 4% CHAPS, 20 mg/ml dithiothreitol (DTT), 2% Pharmalytes
(Sigma-Aldrich; Merck KGaA) and trace amount of bromophenol blue],
100 µl destreak solution and rehydration buffer (7 M urea, 2 M
thiourea, 4% CHAPS, 20 mg/ml DTT, 1% pharmalytes and trace amount
of bromophenol blue) were added to the labeling mixture to a total
volume of 250 µl.
Isoelectric focusing and SDS-PAGE
Isoelectric focusing (linear; pH 3–10) was performed
according to the protocol provided by Amersham (Cytiva).
Immobilized pH gradient strips were incubated at 15°C in
equilibration buffer 1 [50 mM Tris-HCl (pH 8.8), 6 M urea, 30%
glycerol, 2% SDS, trace amount of bromophenol blue and 10 mg/ml
DTT] for 15 min with gentle shaking. The strips were rinsed in
equilibration buffer 2 [50 mM Tris-HCl (pH 8.8), 6 M urea, 30%
glycerol, 2% SDS, trace amount of bromophenol blue and 45 mg/ml
DTT] for 10 min with gentle shaking. The immobilized pH gradient
strips were loaded onto 12% SDS-PAGE gels, which were run at 15°C
until the dye front ran out from the gels.
Phosphostaining, imaging and data
analysis
The gels were scanned immediately following SDS-PAGE
on a Typhoon TRIO variable-mode imager (Amersham; Cytiva). The gels
were then stained with Pro-Q Diamond Phosphoprotein Gel Stain
(Invitrogen; Thermo Fisher Scientific, Inc.) following the
manufacturer's protocol, followed by scanning on the Typhoon TRIO
and analysis using DeCyder version 6.0 (Cytiva). All circled spots
in DeCyder were located manually and the pixel count (maximum
volume) of each spot was exported. Then, phosphorylation ratios
between LIF-starved and -treated samples were calculated.
Statistical significance was calculated using DeCyder software
(Cytiva). Only proteins with ≥2-fold difference in protein
phosphorylation, 100% presence in all gel images and P<0.05
(determined via ANOVA) were selected for further analysis.
Spot picking and trypsin
digestion
Spots of interest were picked by an Ettan Spot
Picker (Amersham; Cytiva) based on the 2-D DIGE and spot picking
design generated via DeCyder. Proteins were digested in-gel with
modified porcine trypsin protease (Trypsin Gold; Promega
Corporation) and desalted on C18 ZipTips (EMD Millipore). Peptides
were eluted from ZipTips with 0.5 µl matrix solution
[α-cyano-4-hydroxycinnamic acid (5 mg/ml)] in 50% acetonitrile,
0.1% trifluoroacetic acid and 25 mM ammonium bicarbonate, then
spotted onto a matrix-assisted laser desorption/ionization (MALDI)
plate (ABI 01-192-6-AB; Applied Biosystems; Thermo Fisher
Scientific, Inc.).
MS
MALDI-time-of-flight (TOF) MS and TOF/TOF tandem
MS/MS were performed on an AB SCIEX TOF/TOF 5800 System (AB Sciex
LLC). MALDI-TOF mass spectra were acquired in reflectron-positive
ion mode, averaging 4,000 laser shots per spectrum. TOF/TOF tandem
MS fragmentation spectra were acquired for each sample, averaging
4,000 laser shots per fragmentation spectrum on the ten most
abundant ions present in each sample (excluding tryptic peptides
and other known background ions).
Database searches
Both the resulting peptide masses and associated
fragmentation spectra were submitted to a GPS Explorer workstation
equipped with the Mascot search engine (Matrix Science, Inc.) to
search the non-redundant database of the National Center for
Biotechnology Information (www.ncbi.nlm.nih.gov/refseq). Searches were performed
without constraining protein molecular weights or isoelectric
points, with variable carbamidomethylation of cysteine and
oxidation of methionine residues, and permitting one missed
cleavage. Candidates with either a protein score or ion confidence
interval >95 were considered to be significant. The list of
significantly regulated phosphoproteins was subjected to Gene
Ontology (GO) analysis in the Database for Annotation,
Visualization and Integrated Discovery (DAVID) using DAVID Web
Service 1.22.0, a R package for retrieving data from DAVID
(12). The retrieved data were
visualized using GOplot 1.0.2 (13)
in rstudio 1.2.1335-1 and the NaviGO (14) webpage
(kiharalab.org/web/navigo).
Results
LIF induces tyrosine, serine, and
threonine phosphorylation in mESCs
Previous studies have demonstrated that the optimal
concentration of LIF to be added to culture media is 1,000 U/ml,
regardless of the presence or absence of feeder cells (3,15,16).
Typically, 1,000 U/ml LIF is used in culture to maintain the
undifferentiated state of mESCs. In order to deprive mESCs of LIF,
addition of an LIF-specific inhibitor would be ideal. However,
specific inhibitors for LIF are not currently available. In the
present study, mESCs cultured in the presence of 1,000 U/ml LIF for
24 h were washed with PBS three times and then retreated with 1,000
U/ml LIF for different durations to assess the effects of LIF on
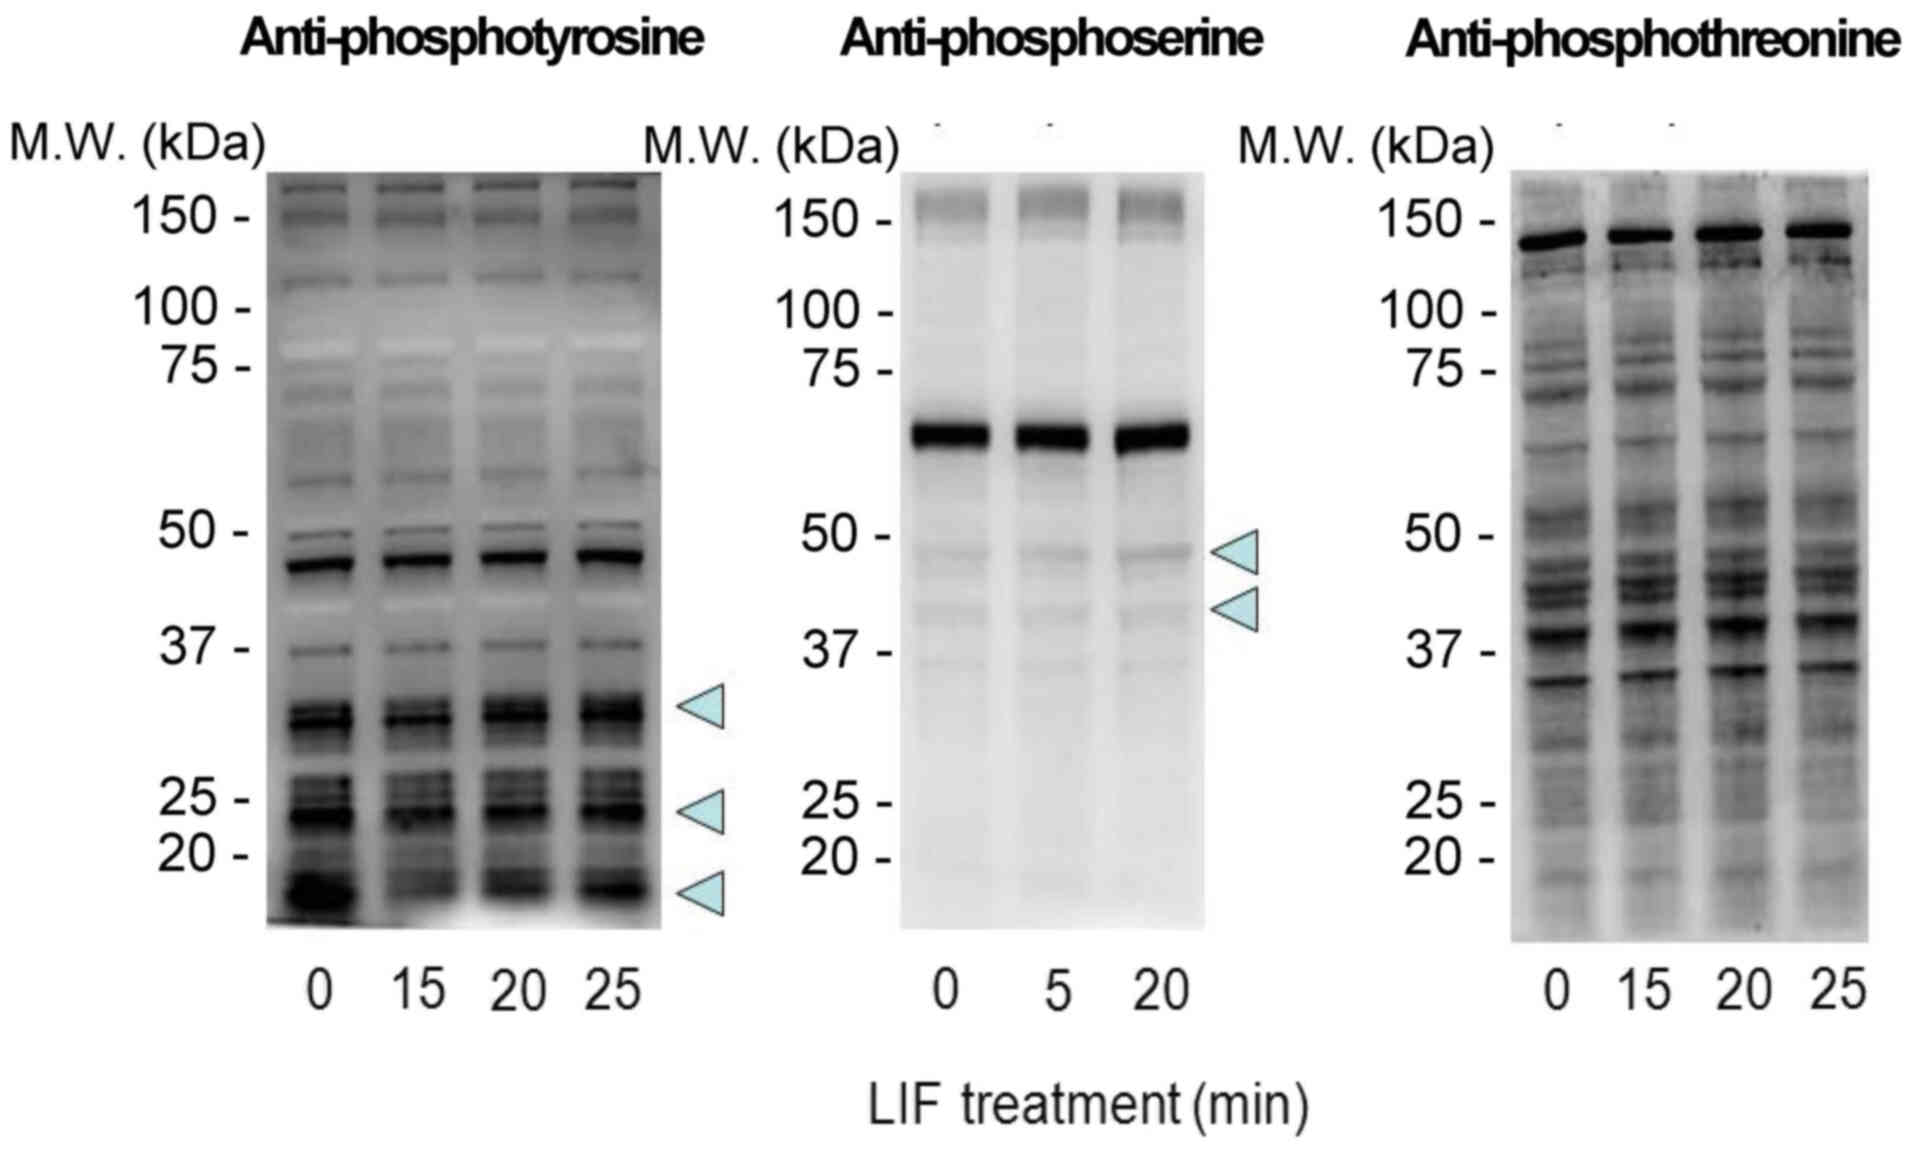
mESC phosphorylation patterns. Protein phosphorylation was analyzed
by western blotting using antibodies against phosphoserine,
phosphothreonine and phosphotyrosine. Rapid changes in serine and
tyrosine phosphorylation were observed compared with threonine
phosphorylation (Fig. 1).
Analysis of differentially
phosphorylated proteins in LIF-treated mESCs via 2-D DIGE
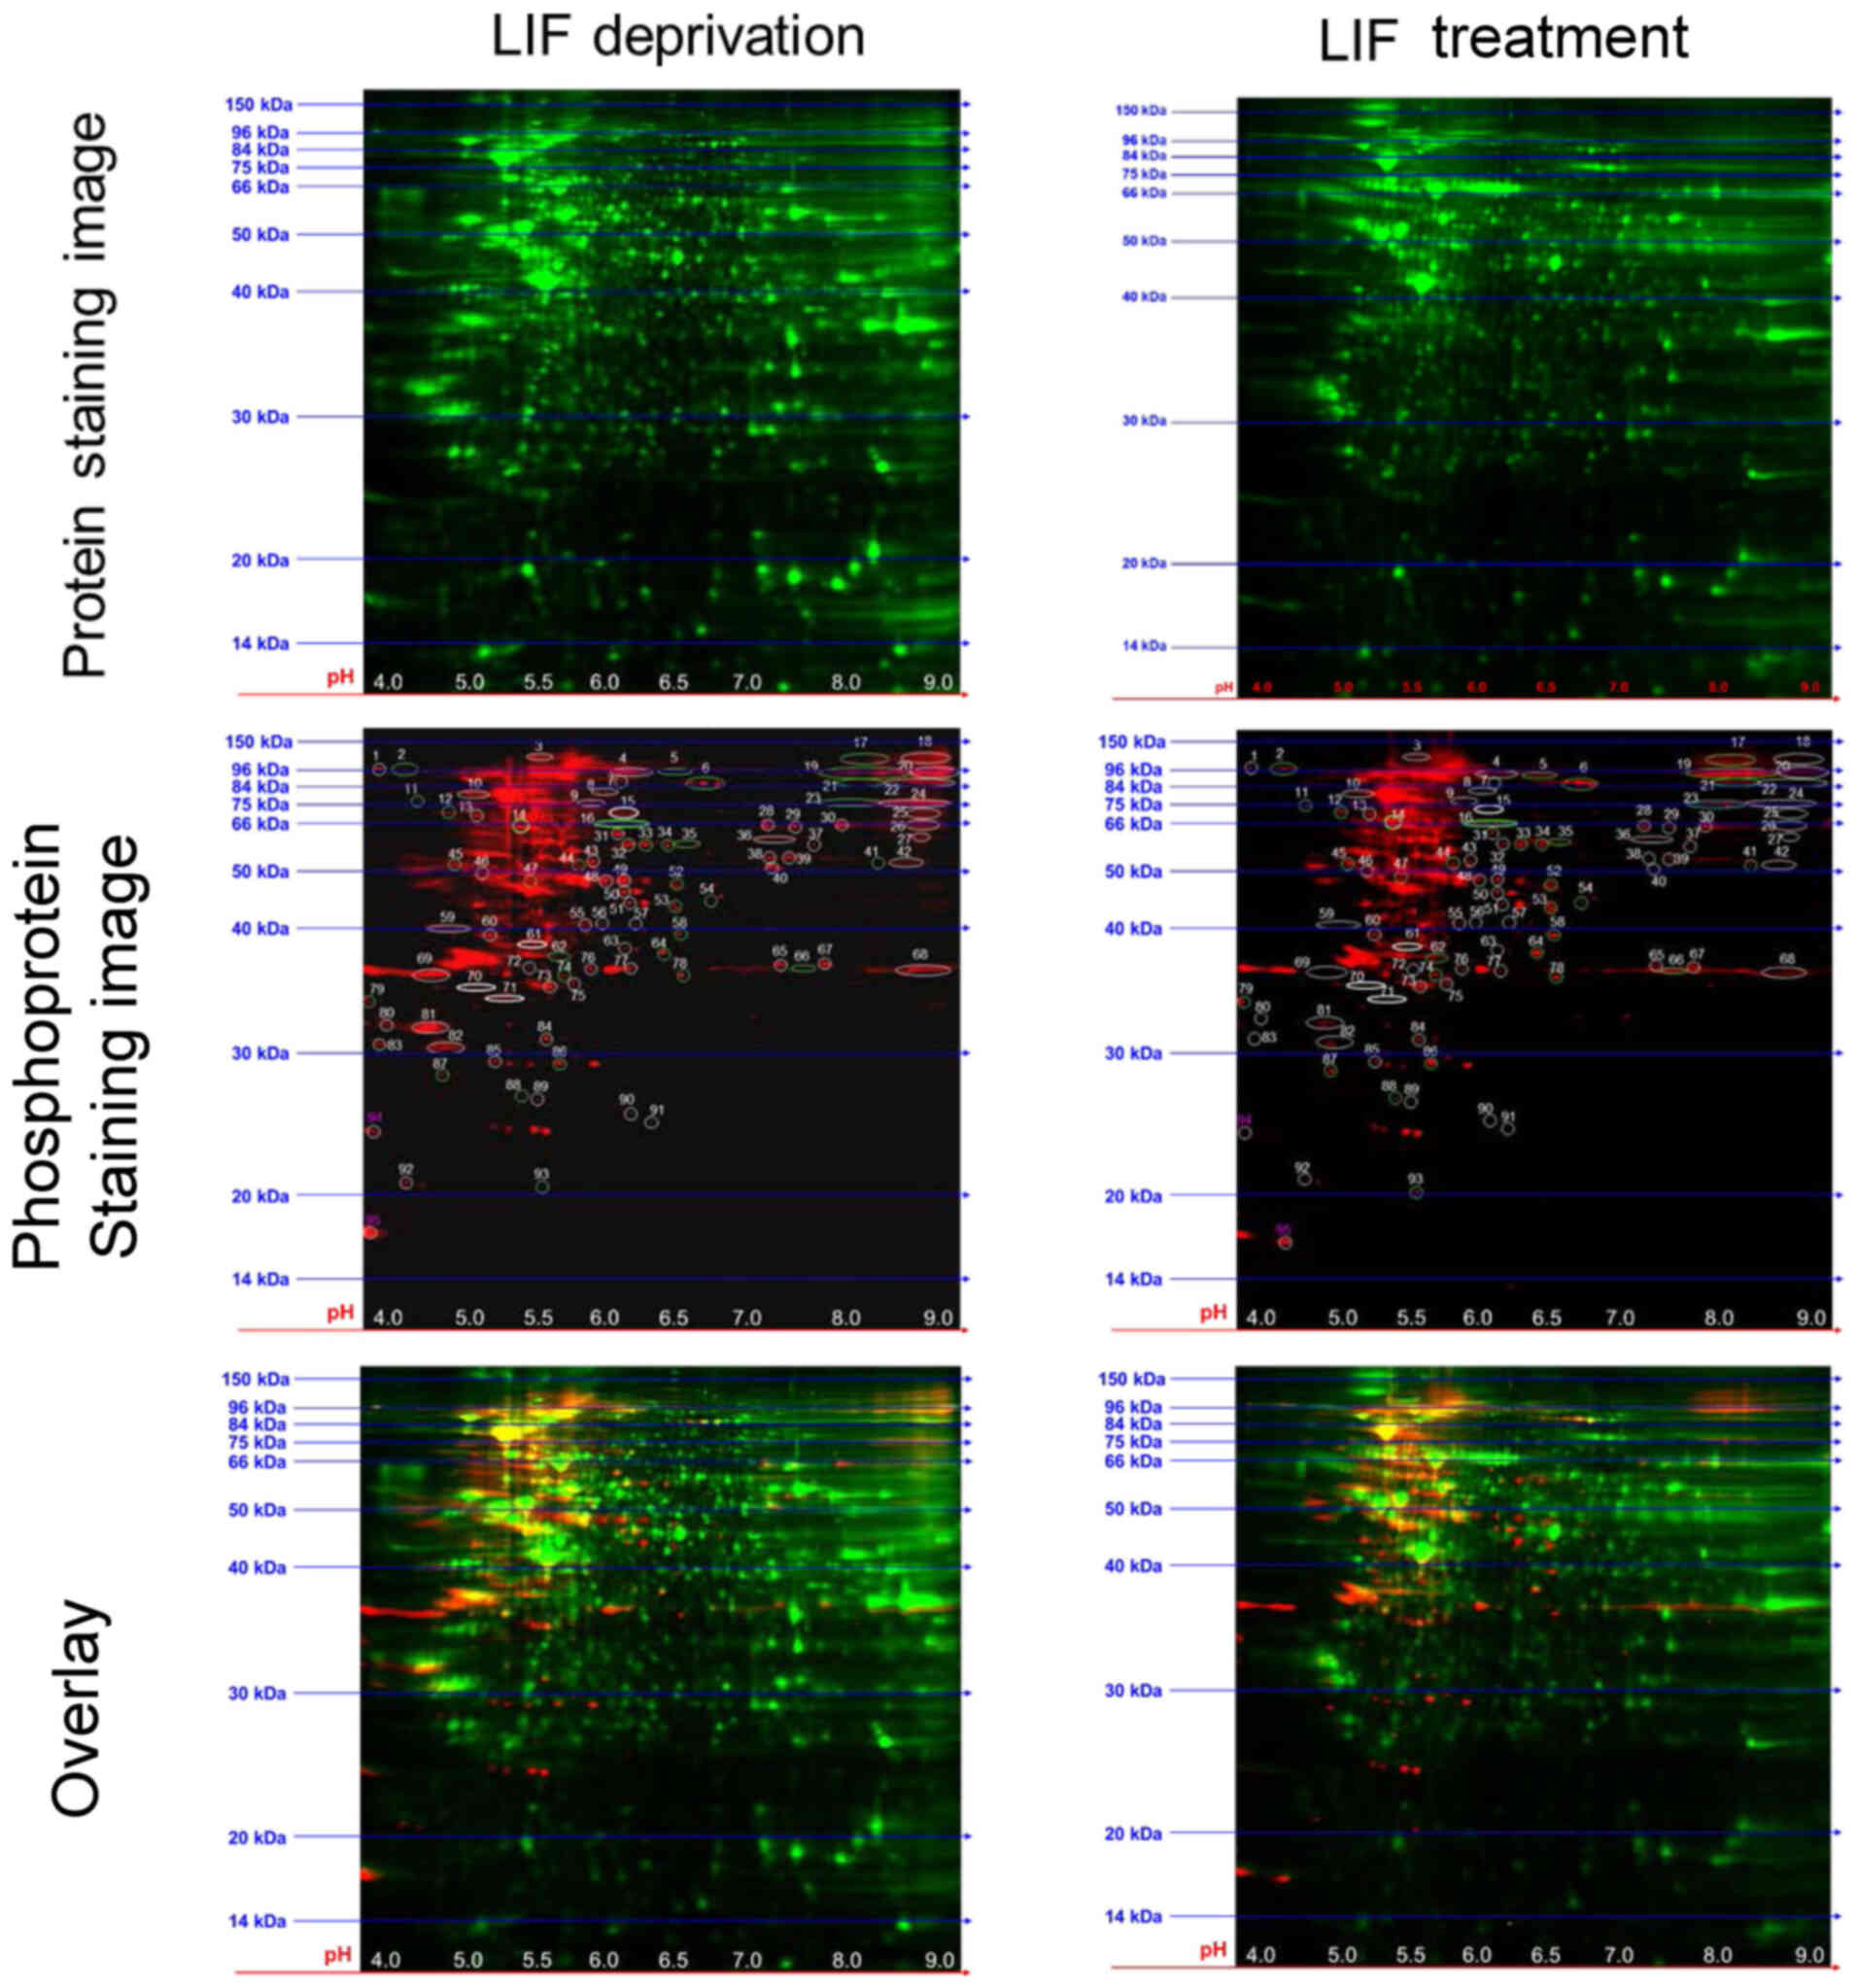
In the present study, 2-D DIGE was performed,
followed by total protein and phosphoprotein staining to analyze
LIF-induced protein phosphorylation changes in mESCs (Fig. 2). Gels containing resolved
CyDye-labeled protein extracts from LIF-starved and -treated mESCs
were scanned and then stained with phosphospecific Pro-Q Diamond
stain. Phosphoproteins were detected as spots with increased
fluorescence intensity (CyDye + Pro-Q) compared with CyDye alone.
Spot quantification identified 95 spots with altered intensity
between LIF-starved and -treated mESCs. Normalized Pro-Q Diamond
intensity ratios for each spot between LIF-starved and -treated
samples are listed in Table I.
 | Table I.Normalized phosphorylation ratio of
protein spots between LIF-deprived and -treated mouse embryonic
stem cells. |
Table I.
Normalized phosphorylation ratio of
protein spots between LIF-deprived and -treated mouse embryonic
stem cells.
| Spot no. | LIF deprivation Max
volume | LIF treatment Max
volume | LIF
treatment/deprivation ratio |
|---|
| 1 |
4.98×10⁵ |
1.42×10⁵ | 0.3 |
| 2 |
7.13×10⁴ |
6.28×10⁵ | 8.8 |
| 3 |
5.18×10⁵ |
2.59×10⁵ | 0.5 |
| 4 |
1.55×10⁶ |
1.02×10⁶ | 0.7 |
| 5 |
1.52×10⁵ |
2.31×10⁵ | 1.5 |
| 6 |
1.51×10⁶ |
2.74×10⁶ | 1.8 |
| 7 |
1.90×10⁵ |
2.65×10⁴ | 0.1 |
| 8 |
2.17×10⁵ |
5.27×10⁴ | 0.2 |
| 9 |
2.53×10⁵ |
1.43×10⁵ | 0.6 |
| 10 |
9.69×10⁵ |
4.64×10⁵ | 0.5 |
| 11 |
1.80×10⁵ |
4.37×10⁵ | 2.4 |
| 12 |
1.96×10⁵ |
6.56×10⁵ | 3.3 |
| 13 |
4.55×10⁵ |
2.77×10⁵ | 0.6 |
| 14 |
6.43×10⁵ |
1.43×10⁶ | 2.2 |
| 15 |
6.59×10⁵ |
3.26×10⁵ | 0.5 |
| 16 |
2.78×10⁵ |
1.13×10⁶ | 4.1 |
| 17 |
3.12×10⁵ |
6.90×10⁵ | 2.2 |
| 18 |
9.06×10⁵ |
2.71×10⁵ | 0.3 |
| 19 |
2.07×10⁶ |
6.04×10⁶ | 2.9 |
| 20 |
5.48×10⁶ |
1.08×10⁶ | 0.2 |
| 21 |
4.13×10⁵ |
8.07×10⁵ | 2.0 |
| 22 |
2.15×10⁶ |
2.79×10⁵ | 0.1 |
| 23 |
4.44×10⁵ |
1.58×10⁶ | 3.6 |
| 24 |
3.16×10⁶ |
6.68×10⁵ | 0.2 |
| 25 |
2.20×10⁵ |
5.81×10⁴ | 0.3 |
| 26 |
9.99×10⁵ |
4.63×10⁵ | 0.5 |
| 27 |
2.95×10⁵ |
7.09×10⁴ | 0.2 |
| 28 |
7.06×10⁵ |
3.90×10⁵ | 0.6 |
| 29 |
5.49×10⁵ |
2.82×10⁵ | 0.5 |
| 30 |
1.70×10⁶ |
7.66×10⁵ | 0.5 |
| 31 |
7.28×10⁵ |
3.05×10⁵ | 0.4 |
| 32 |
6.80×10⁵ |
3.70×10⁵ | 0.5 |
| 33 |
5.45×10⁵ |
6.39×10⁵ | 1.2 |
| 34 |
3.31×10⁵ |
3.93×10⁵ | 1.2 |
| 35 |
9.89×10⁴ |
6.95×10⁵ | 7.0 |
| 36 |
6.57×10⁵ |
6.04×10⁵ | 0.9 |
| 37 |
1.54×10⁵ |
8.28×10⁴ | 0.5 |
| 38 |
4.97×10⁵ |
1.14×10⁵ | 0.2 |
| 39 |
4.97×10⁵ |
4.41×10⁵ | 0.9 |
| 40 |
5.11×10⁵ |
8.08×10⁴ | 0.2 |
| 41 |
7.17×10⁴ |
1.04×10⁵ | 1.5 |
| 42 |
3.71×10⁵ |
1.43×10⁵ | 0.4 |
| 43 |
3.13×10⁵ |
1.91×10⁵ | 0.6 |
| 44 |
3.98×10⁴ |
1.69×10⁵ | 4.2 |
| 45 |
2.90×10⁵ |
5.15×10⁵ | 1.8 |
| 46 |
1.72×10⁵ |
1.13×10⁵ | 0.7 |
| 47 |
2.26×10⁵ |
2.68×10⁵ | 1.2 |
| 48 |
6.03×10⁵ |
4.01×10⁵ | 0.7 |
| 49 |
1.25×10⁶ |
5.68×10⁵ | 0.5 |
| 50 |
4.88×10⁵ |
3.29×10⁵ | 0.7 |
| 51 |
3.41×10⁵ |
2.30×10⁵ | 0.7 |
| 52 |
5.30×10⁵ |
7.71×10⁵ | 1.5 |
| 53 |
4.69×10⁵ |
7.39×10⁵ | 1.6 |
| 54 |
8.30×10⁴ |
1.57×10⁵ | 1.9 |
| 55 |
2.34×10⁵ |
1.67×10⁵ | 0.7 |
| 56 |
1.17×10⁵ |
4.23×10⁴ | 0.4 |
| 57 |
6.96×10⁴ |
4.48×10⁴ | 0.6 |
| 58 |
2.95×10⁵ |
6.30×10⁵ | 2.1 |
| 59 |
1.22×10⁶ |
4.21×10⁵ | 0.3 |
| 60 |
3.99×10⁵ |
1.99×10⁵ | 0.5 |
| 61 |
3.31×10⁵ |
2.33×10⁵ | 0.7 |
| 62 |
2.36×10⁵ |
4.53×10⁵ | 1.9 |
| 63 |
1.08×10⁵ |
8.63×10⁴ | 0.8 |
| 64 |
7.20×10⁵ |
1.45×10⁶ | 2.0 |
| 65 |
6.50×10⁵ |
1.50×10⁵ | 0.2 |
| 66 |
1.87×10⁵ |
6.53×10⁵ | 3.5 |
| 67 |
9.35×10⁵ |
5.74×10⁵ | 0.6 |
| 68 |
2.98×10⁶ |
2.19×10⁶ | 0.7 |
| 69 |
3.76×10⁶ |
4.02×10⁵ | 0.1 |
| 70 |
6.17×10⁵ |
3.63×10⁵ | 0.6 |
| 71 |
6.89×10⁵ |
3.89×10⁵ | 0.6 |
| 72 |
2.20×10⁵ |
1.41×10⁵ | 0.6 |
| 73 |
9.00×10⁵ |
6.58×10⁵ | 0.7 |
| 74 |
2.01×10⁵ |
2.90×10⁵ | 1.4 |
| 75 |
4.30×10⁵ |
3.80×10⁵ | 0.9 |
| 76 |
3.42×10⁵ |
2.30×10⁵ | 0.7 |
| 77 |
8.22×10⁵ |
2.37×10⁵ | 0.3 |
| 78 |
4.27×10⁵ |
5.56×10⁵ | 1.3 |
| 79 |
1.12×10⁵ |
4.59×10⁵ | 4.1 |
| 80 |
6.92×10⁵ |
5.34×10⁴ | 0.1 |
| 81 |
2.58×10⁶ |
9.17×10⁵ | 0.4 |
| 82 |
1.77×10⁶ |
6.60×10⁵ | 0.4 |
| 83 |
6.56×10⁵ |
4.39×10⁴ | 0.1 |
| 84 |
5.67×10⁵ |
4.07×10⁵ | 0.7 |
| 85 |
3.69×10⁵ |
3.21×10⁵ | 0.9 |
| 86 |
6.58×10⁵ |
1.00×10⁶ | 1.5 |
| 87 |
4.25×10⁵ |
5.24×10⁵ | 1.2 |
| 88 |
2.53×10⁵ |
3.75×10⁵ | 1.5 |
| 89 |
3.76×10⁵ |
1.99×10⁵ | 0.5 |
| 90 |
3.05×10⁵ |
7.14×10⁴ | 0.2 |
| 91 |
2.89×10⁵ |
1.94×10⁵ | 0.7 |
| 92 |
4.86×10⁵ |
1.97×10⁵ | 0.4 |
| 93 |
1.92×10⁵ |
4.97×10⁵ | 2.6 |
| 94 |
1.41×10⁵ |
1.77×10⁵ | 1.3 |
| 95 |
7.80×10⁵ |
1.50×10⁶ | 1.9 |
Identification of differentially
phosphorylated proteins in LIF-treated mESCs
A total of 51 spots whose
phosphorylation/dephosphorylation levels were significantly changed
(>2-fold; Table II) were
selected for identification via MALDI-TOF MS analysis. Proteins
whose phosphorylation levels were significantly increased and
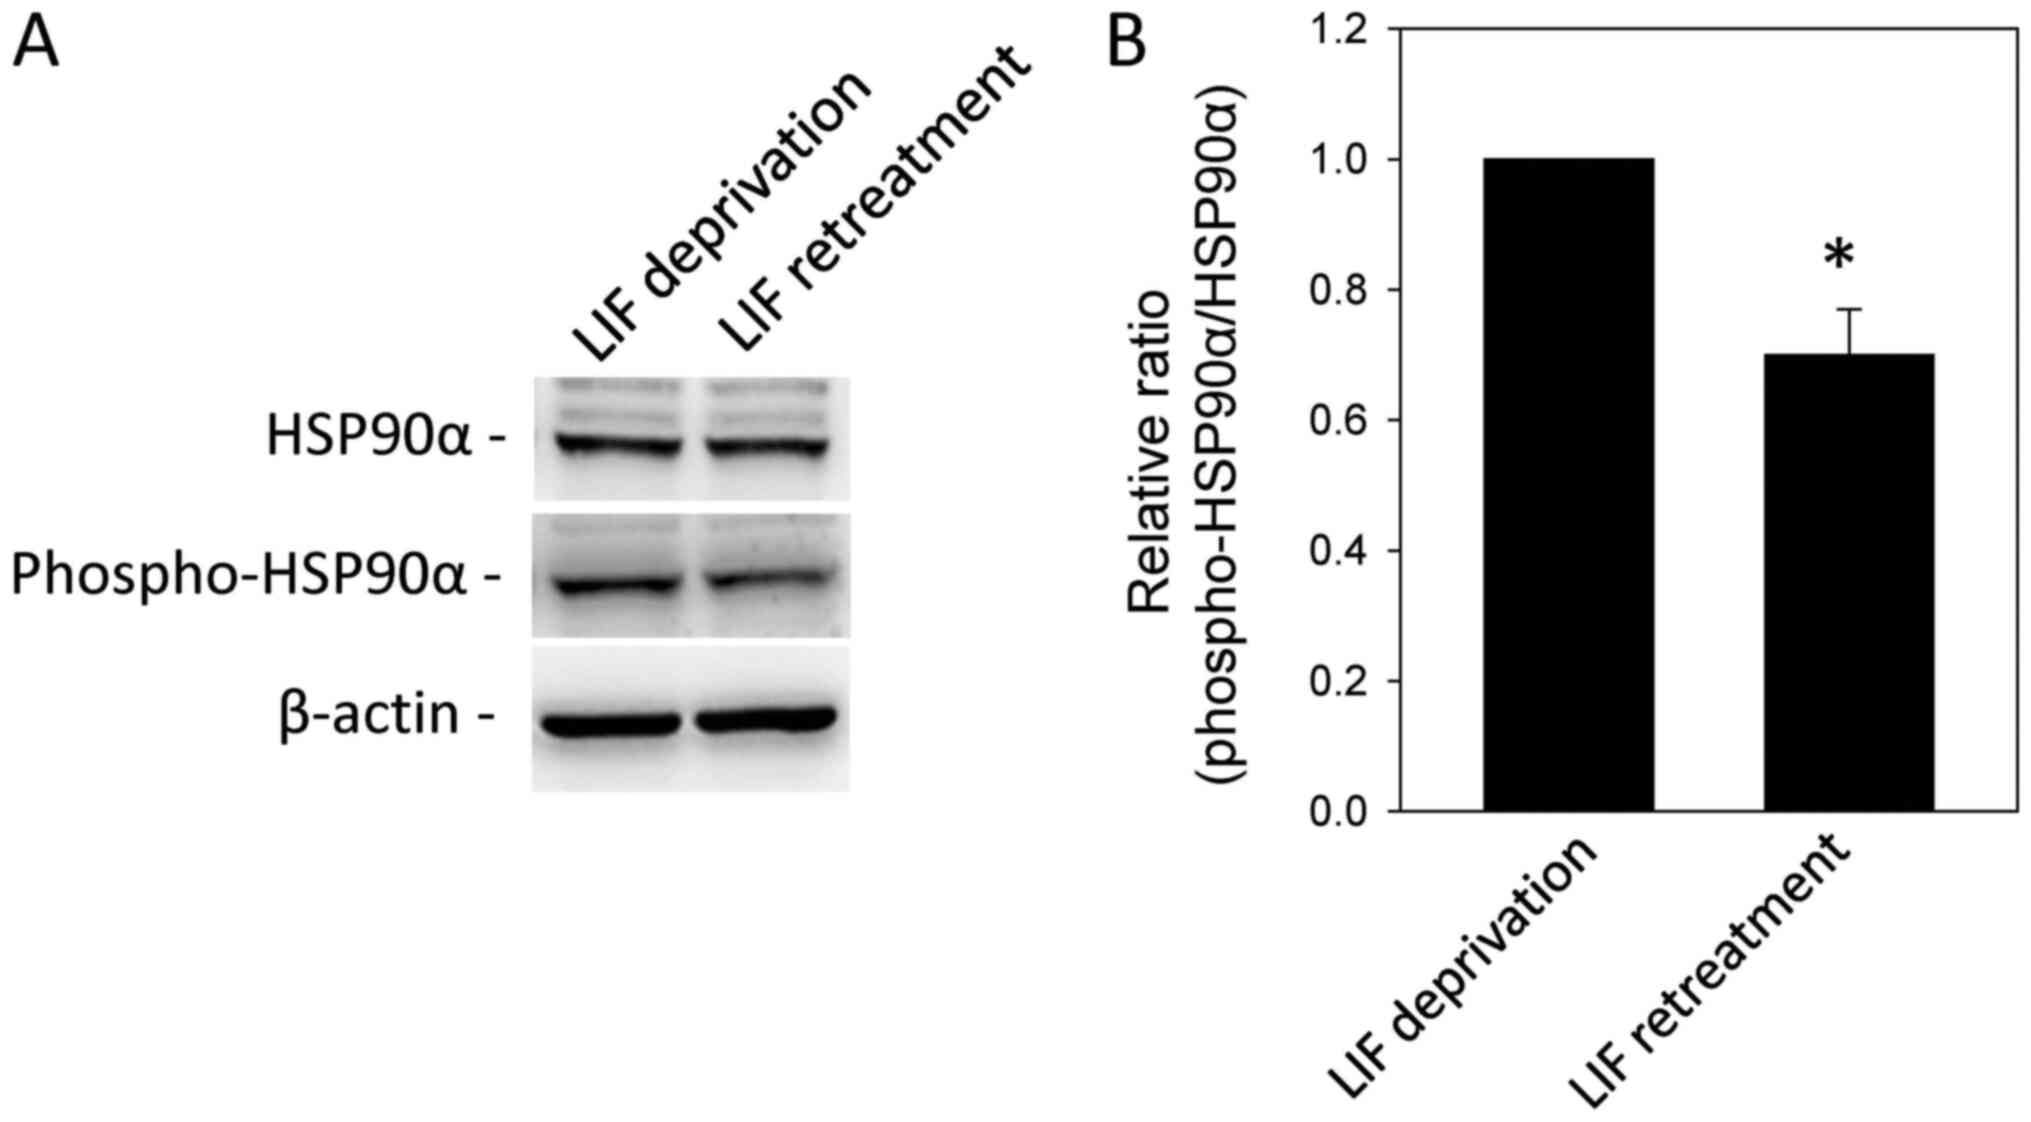
decreased following LIF treatment are listed in Tables II and III, respectively. Among the proteins
with altered phosphorylation levels following LIF treatment, some
were functionally associated mESC stemness and differentiation,
such as HSP7C, HS90A, NPM and SRSF1 (3,17–19).
In order to validate LIF-dependent phosphorylation, western blot
analysis was performed using an anti-phospho-HSP90α (Thr5/7)
antibody. HSP90α phosphorylation was significantly decreased by LIF
treatment (Fig. 3).
| Table II.Identification of phosphorylated
proteins following leukemia inhibitory factor treatment via
matrix-assisted laser desorption/ionization-time of flight mass
spectrophotometry analysis. |
Table II.
Identification of phosphorylated
proteins following leukemia inhibitory factor treatment via
matrix-assisted laser desorption/ionization-time of flight mass
spectrophotometry analysis.
| Spot no. | Top ranked protein
name (species) | Accession no. | Molecular weight
(Da) | Isoelectric
point | Ratio (LIF
treatment/LIF deprivation) |
|---|
| 2 | Nuclear
autoantigenic sperm protein | NASP_MOUSE | 83902.7 | 4.4 | 8.8 |
| 35 | Asparagine
synthetase | ASNS_MOUSE | 64241.5 | 6.1 | 7.0 |
| 44 | V-type proton
ATPase subunit B, brain isoform | VATB2_MOUSE | 56514.9 | 5.6 | 4.2 |
| 79 | Clathrin light
chain A | CLCA_MOUSE | 25541.4 | 4.5 | 4.1 |
| 16 | Serum albumin | ALBU_MOUSE | 68647.7 | 5.8 | 4.1 |
| 23 | Nucleolin | NUCL_MOUSE | 76676.8 | 4.7 | 3.6 |
| 66 | L-lactate
dehydrogenase A chain | LDHA_MOUSE | 36475.2 | 7.6 | 3.5 |
| 12 | Periodic tryptophan
protein 1 homolog | PWP1_MOUSE | 55552.1 | 4.7 | 3.3 |
| 19 | Nucleolin | NUCL_MOUSE | 76676.8 | 4.7 | 2.9 |
| 93 | Thioredoxin
domain-containing protein 12 | TXD12_MOUSE | 19036.5 | 5.1 | 2.6 |
| 11 | Neurogenic locus
notch homolog protein 1 | NOTC1_MOUSE | 271133.5 | 5.0 | 2.4 |
| 14 | Heat shock cognate
71 kDa protein | HSP7C_MOUSE | 70827.2 | 5.4 | 2.2 |
| 17 | Sulfatase-modifying
factor 1 | SUMF1_MOUSE | 40633.6 | 6.6 | 2.2 |
| 58 | Eukaryotic
translation initiation factor 3 subunit H | EIF3H_MOUSE | 39807.0 | 6.2 | 2.1 |
| 64 | Transaldolase | TALDO_MOUSE | 37363.4 | 6.6 | 2.0 |
| 21 | Elongation factor
2 | EF2_MOUSE | 95252.9 | 6.4 | 2.0 |
| Table III.Identification of dephosphorylated
proteins following leukemia inhibitory factor treatment via
matrix-assisted laser desorption/ionization-time of flight mass
spectrophotometry analysis. |
Table III.
Identification of dephosphorylated
proteins following leukemia inhibitory factor treatment via
matrix-assisted laser desorption/ionization-time of flight mass
spectrophotometry analysis.
| Spot no. | Top ranked protein
name (species) | Accession no. | Molecular weight
(Da) | Isoelectric
point | Ratio (LIF
treatment/LIF deprivation) |
|---|
| 83 | Nucleophosmin | NPM_MOUSE | 32539.8 | 4.60 | 0.1 |
| 80 | Complement
component 1 Q subcomponent-binding protein, mitochondrial | C1QBP_MOUSE | 30993.5 | 4.80 | 0.1 |
| 69 | Nascent
polypeptide-associated complex subunit α | NACA_MOUSE | 23369.7 | 4.50 | 0.1 |
| 22 | Elongation factor
2 | EF2_MOUSE | 95252.9 | 6.40 | 0.1 |
| 7 | DNA mismatch repair
protein Msh2 | MSH2_MOUSE | 104085.4 | 5.70 | 0.1 |
| 40 | Adenylyl
cyclase-associated protein 1 | CAP1_MOUSE | 51542.5 | 7.20 | 0.2 |
| 20 | Nucleolin | NUCL_MOUSE | 76676.8 | 4.70 | 0.2 |
| 24 | Nucleolin | NUCL_MOUSE | 76676.8 | 4.70 | 0.2 |
| 38 | Protein RCC2 | RCC2_MOUSE | 55948.1 | 8.97 | 0.2 |
| 65 |
Glyceraldehyde-3-phosphate
dehydrogenase | G3P_MOUSE | 35787.2 | 8.40 | 0.2 |
| 90 |
Serine/arginine-rich splicing factor
3 | SRSF3_MOUSE | 19317.9 | 11.60 | 0.2 |
| 27 | Probable
ATP-dependent RNA helicase DDX5 | DDX5_MOUSE | 69276.8 | 9.10 | 0.2 |
| 8 | Gelsolin | GELS_MOUSE | 85888.1 | 5.80 | 0.2 |
| 25 | Insulin-like growth
factor 2 mRNA-binding protein 1 | IF2B1_MOUSE | 63411.2 | 9.30 | 0.3 |
| 1 | Nuclear
autoantigenic sperm protein | NASP_MOUSE | 83902.7 | 4.40 | 0.3 |
| 77 | 60S acidic
ribosomal protein P0 | RLA0_MOUSE | 34194.8 | 5.90 | 0.3 |
| 18 | Embryonic
polyadenylate-binding protein 2 | EPAB2_MOUSE | 30244.1 | 6.40 | 0.3 |
| 59 | Protein diaphanous
homolog 2 | DIAP2_MOUSE | 124791.8 | 6.50 | 0.3 |
| 81 | 14-3-3 protein
ε | 1433E_MOUSE | 29155.4 | 4.60 | 0.4 |
| 56 | Replication factor
C subunit 5 | RFC5_MOUSE | 38071.9 | 7.70 | 0.4 |
| 82 | 14-3-3 protein
ζ/Δ | 1433Z_MOUSE | 27753.7 | 4.70 | 0.4 |
| 42 | ATP synthase
subunit α, mitochondrial | ATPA_MOUSE | 59715.6 | 9.20 | 0.4 |
| 92 | Nucleophosmin | NPM_MOUSE | 32539.8 | 4.60 | 0.4 |
| 31 | Eukaryotic
translation initiation factor 3 subunit D | EIF3D_MOUSE | 63948.4 | 5.80 | 0.4 |
| 30 | U1 small nuclear
ribonucleoprotein 70 kDa | RU17_MOUSE | 51960.9 | 9.90 | 0.5 |
| 49 | Undifferentiated
embryonic cell transcription factor 1 | UTF1_MOUSE | 36385.8 | 10.10 | 0.5 |
| 26 | Heterogeneous
nuclear ribonucleoprotein M | HNRPM_MOUSE | 77597.4 | 8.80 | 0.5 |
| 10 | Heat shock protein
HSP 90-α | HS90A_MOUSE | 84734.8 | 4.90 | 0.5 |
| 15 | Glycyl-tRNA
synthetase | SYG_MOUSE | 81825.7 | 6.20 | 0.5 |
| 60 | ATPase Asna1 | ASNA_MOUSE | 38797.4 | 4.80 | 0.5 |
| 3 | Spectrin α chain,
brain | SPTA2_MOUSE | 284422.3 | 5.20 | 0.5 |
| 29 | Transketolase | TKT_MOUSE | 67587.6 | 7.20 | 0.5 |
| 89 |
Phosphatidylethanolamine-binding protein
1 | PEBP1_MOUSE | 20817.3 | 5.20 | 0.5 |
| 37 | Pyruvate kinase
isozymes M1/M2 | KPYM_MOUSE | 57808.0 | 7.20 | 0.5 |
| 32 | T-complex protein 1
subunit α | TCPA_MOUSE | 60410.7 | 5.80 | 0.5 |
There were four spots for NUCL in the 2-D
electrophoresis gel with two molecular weights (77 and 88 kDa) and
two different PI values (8.7 and 8.9). The phosphorylation of two
spots (spot nos. 23 and 19) was increased and that of the other two
(spot nos. 20 and 24) was decreased by LIF stimulation.
GO analysis of differentially
phosphorylated genes in LIF-treated mESCs
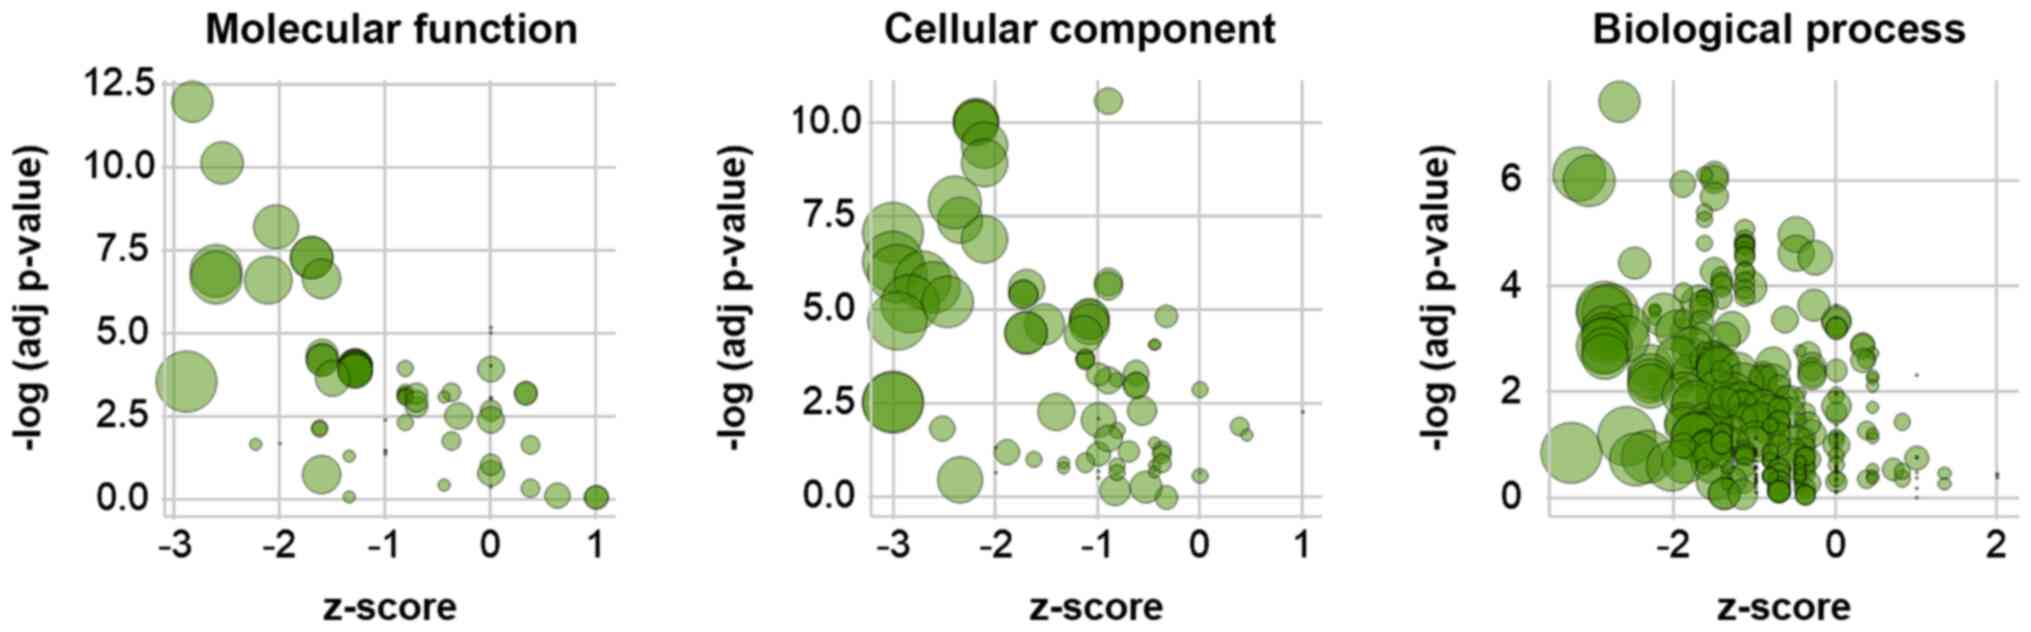
GO enrichment analysis was performed to functionally
annotate differentially phosphorylated proteins following LIF
treatment. Functional annotation clustering identified
significantly enriched GO terms and protein members. The z-scores
of GO terms were calculated based on the fold-change of
phosphorylation values of their members (Fig. 4). The majority of highly significant
GO terms had negative z-scores, indicating that LIF treatment
induced dephosphorylation of member proteins (Fig. 4); consistently, the z-scores of the
top ten GO terms by significance in each category were <0
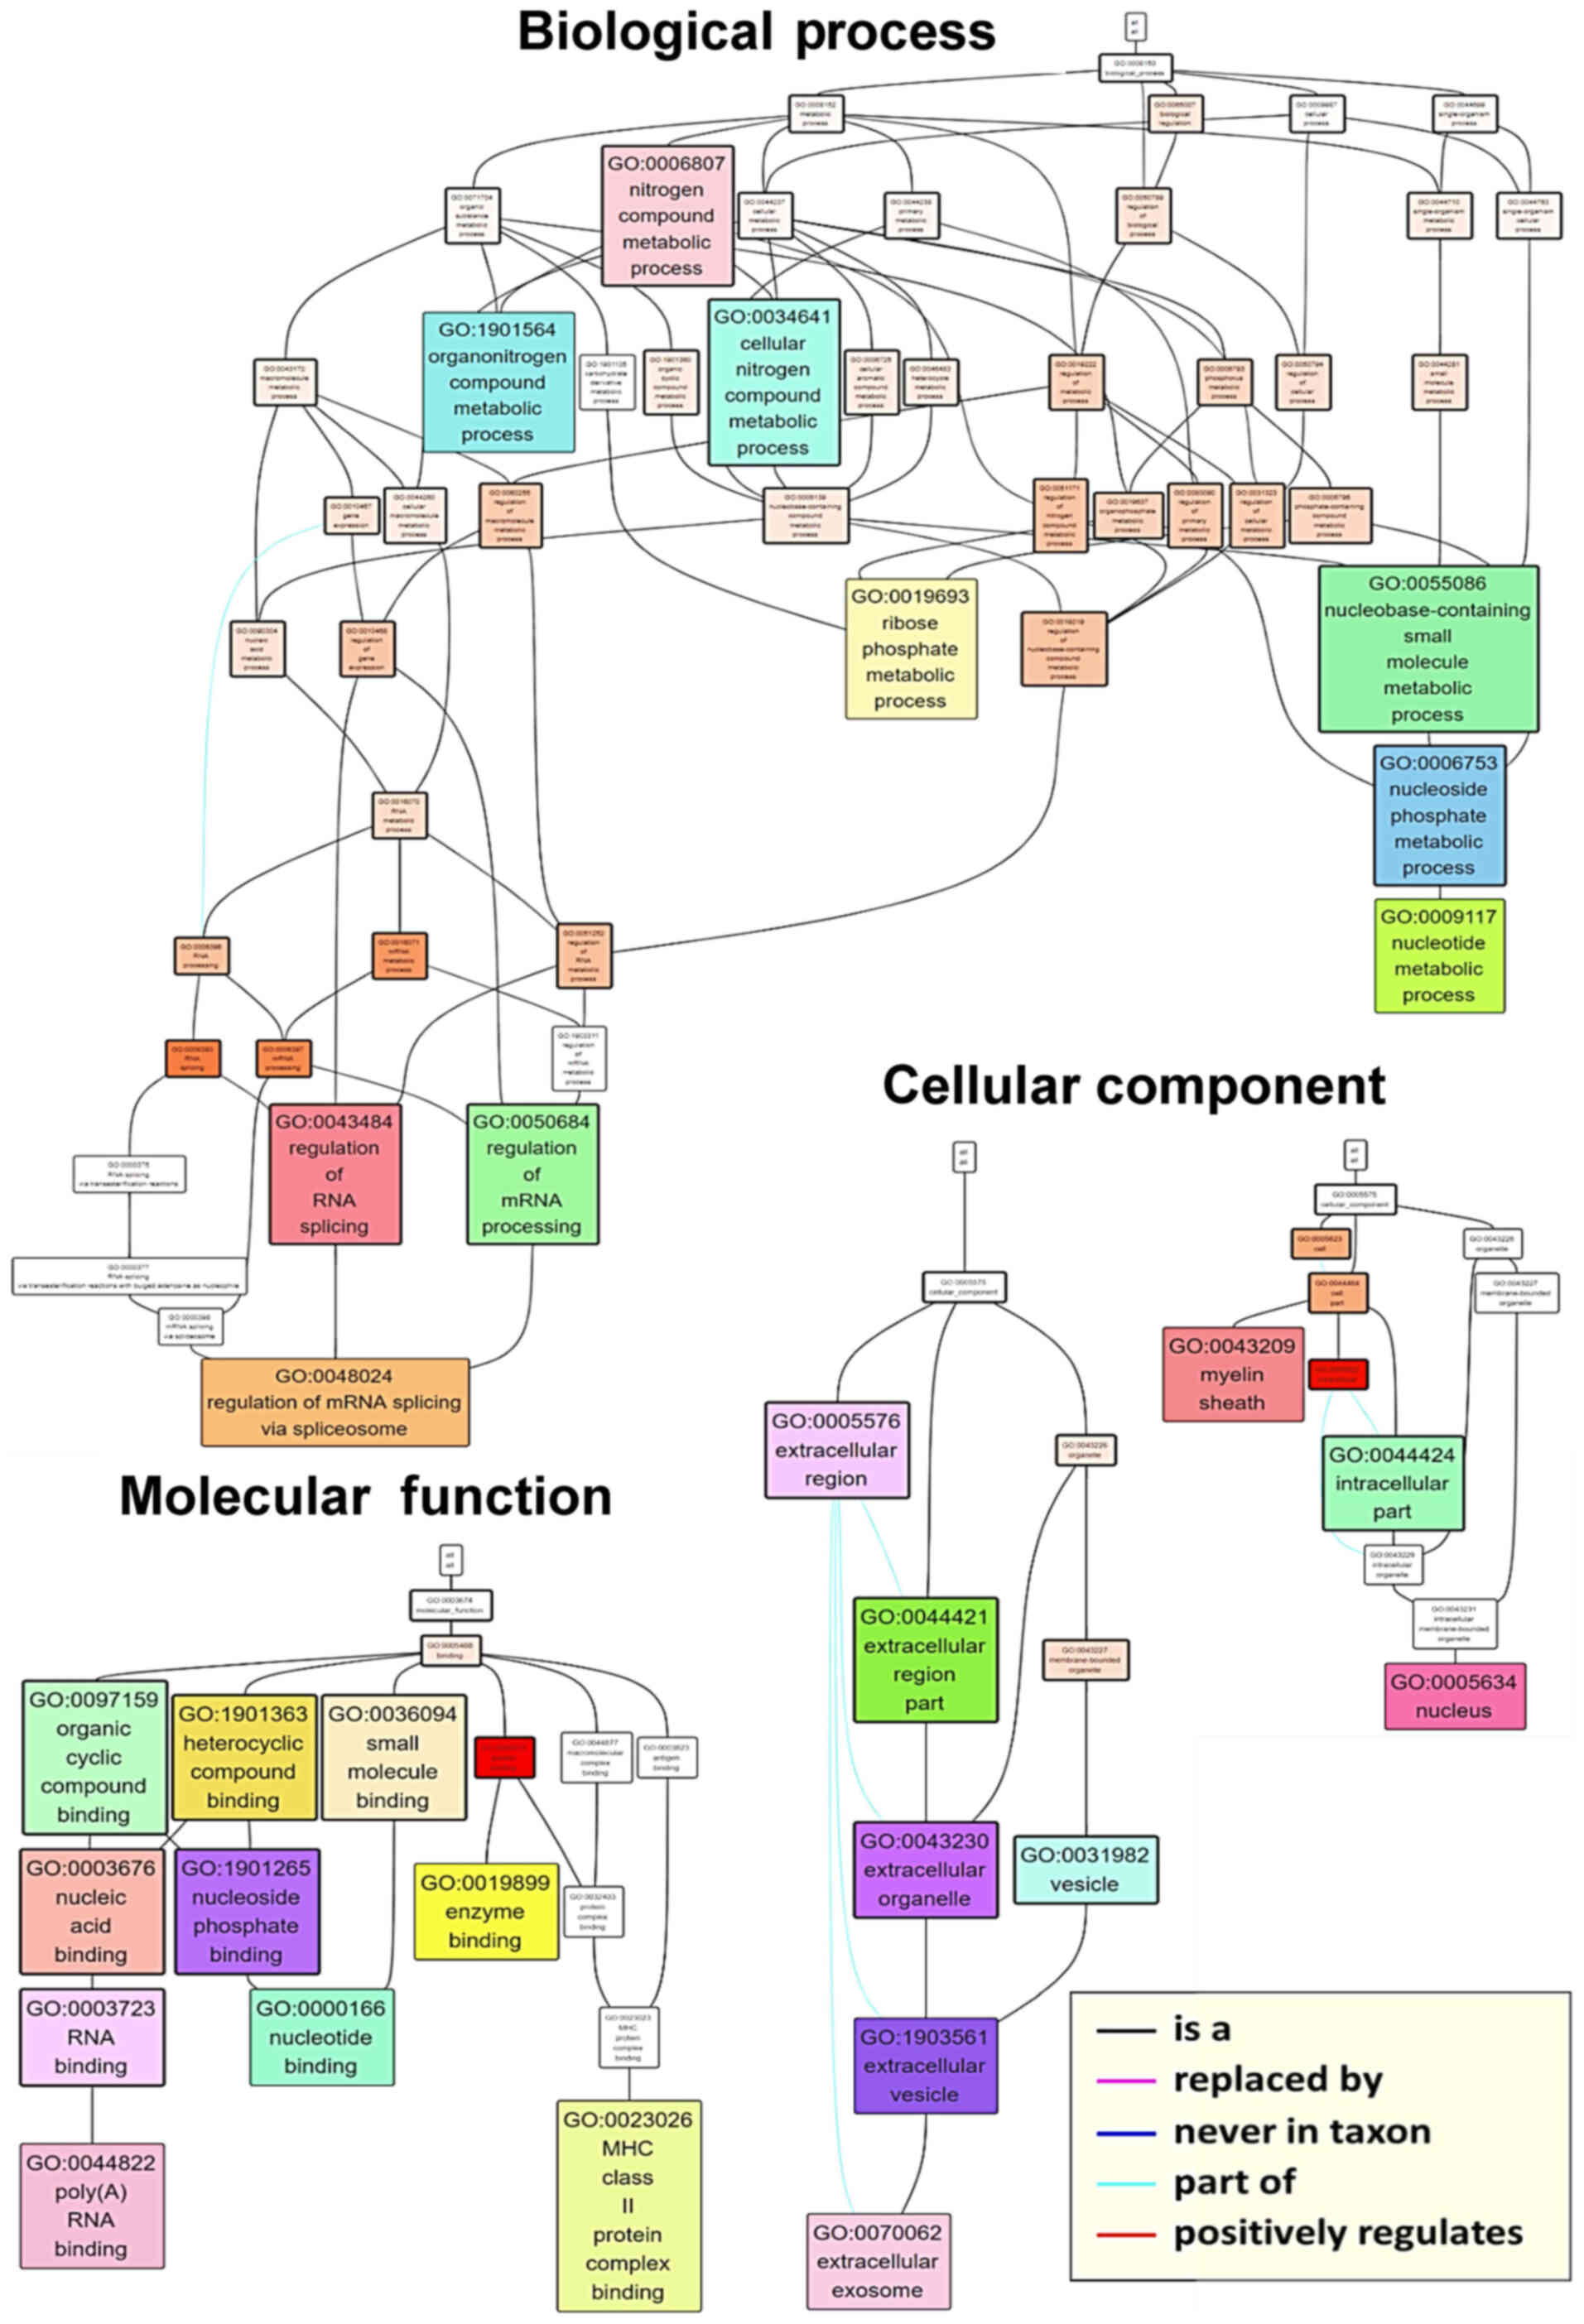
(Table IV). In order to visualize
the hierarchy of associations between the top ten terms in each
category, a GO term network was generated (Fig. 5). Terms such as ‘poly(A) RNA
binding’ (GO:0044822) and ‘nucleotide binding’ (GO:0000166),
‘nucleus’ (GO:0005634) and ‘extracellular exosome’ (GO:0070062),
and ‘regulation of mRNA splicing via the spliceosome’ (GO:0048024)
were found at the base of the molecular function, cellular
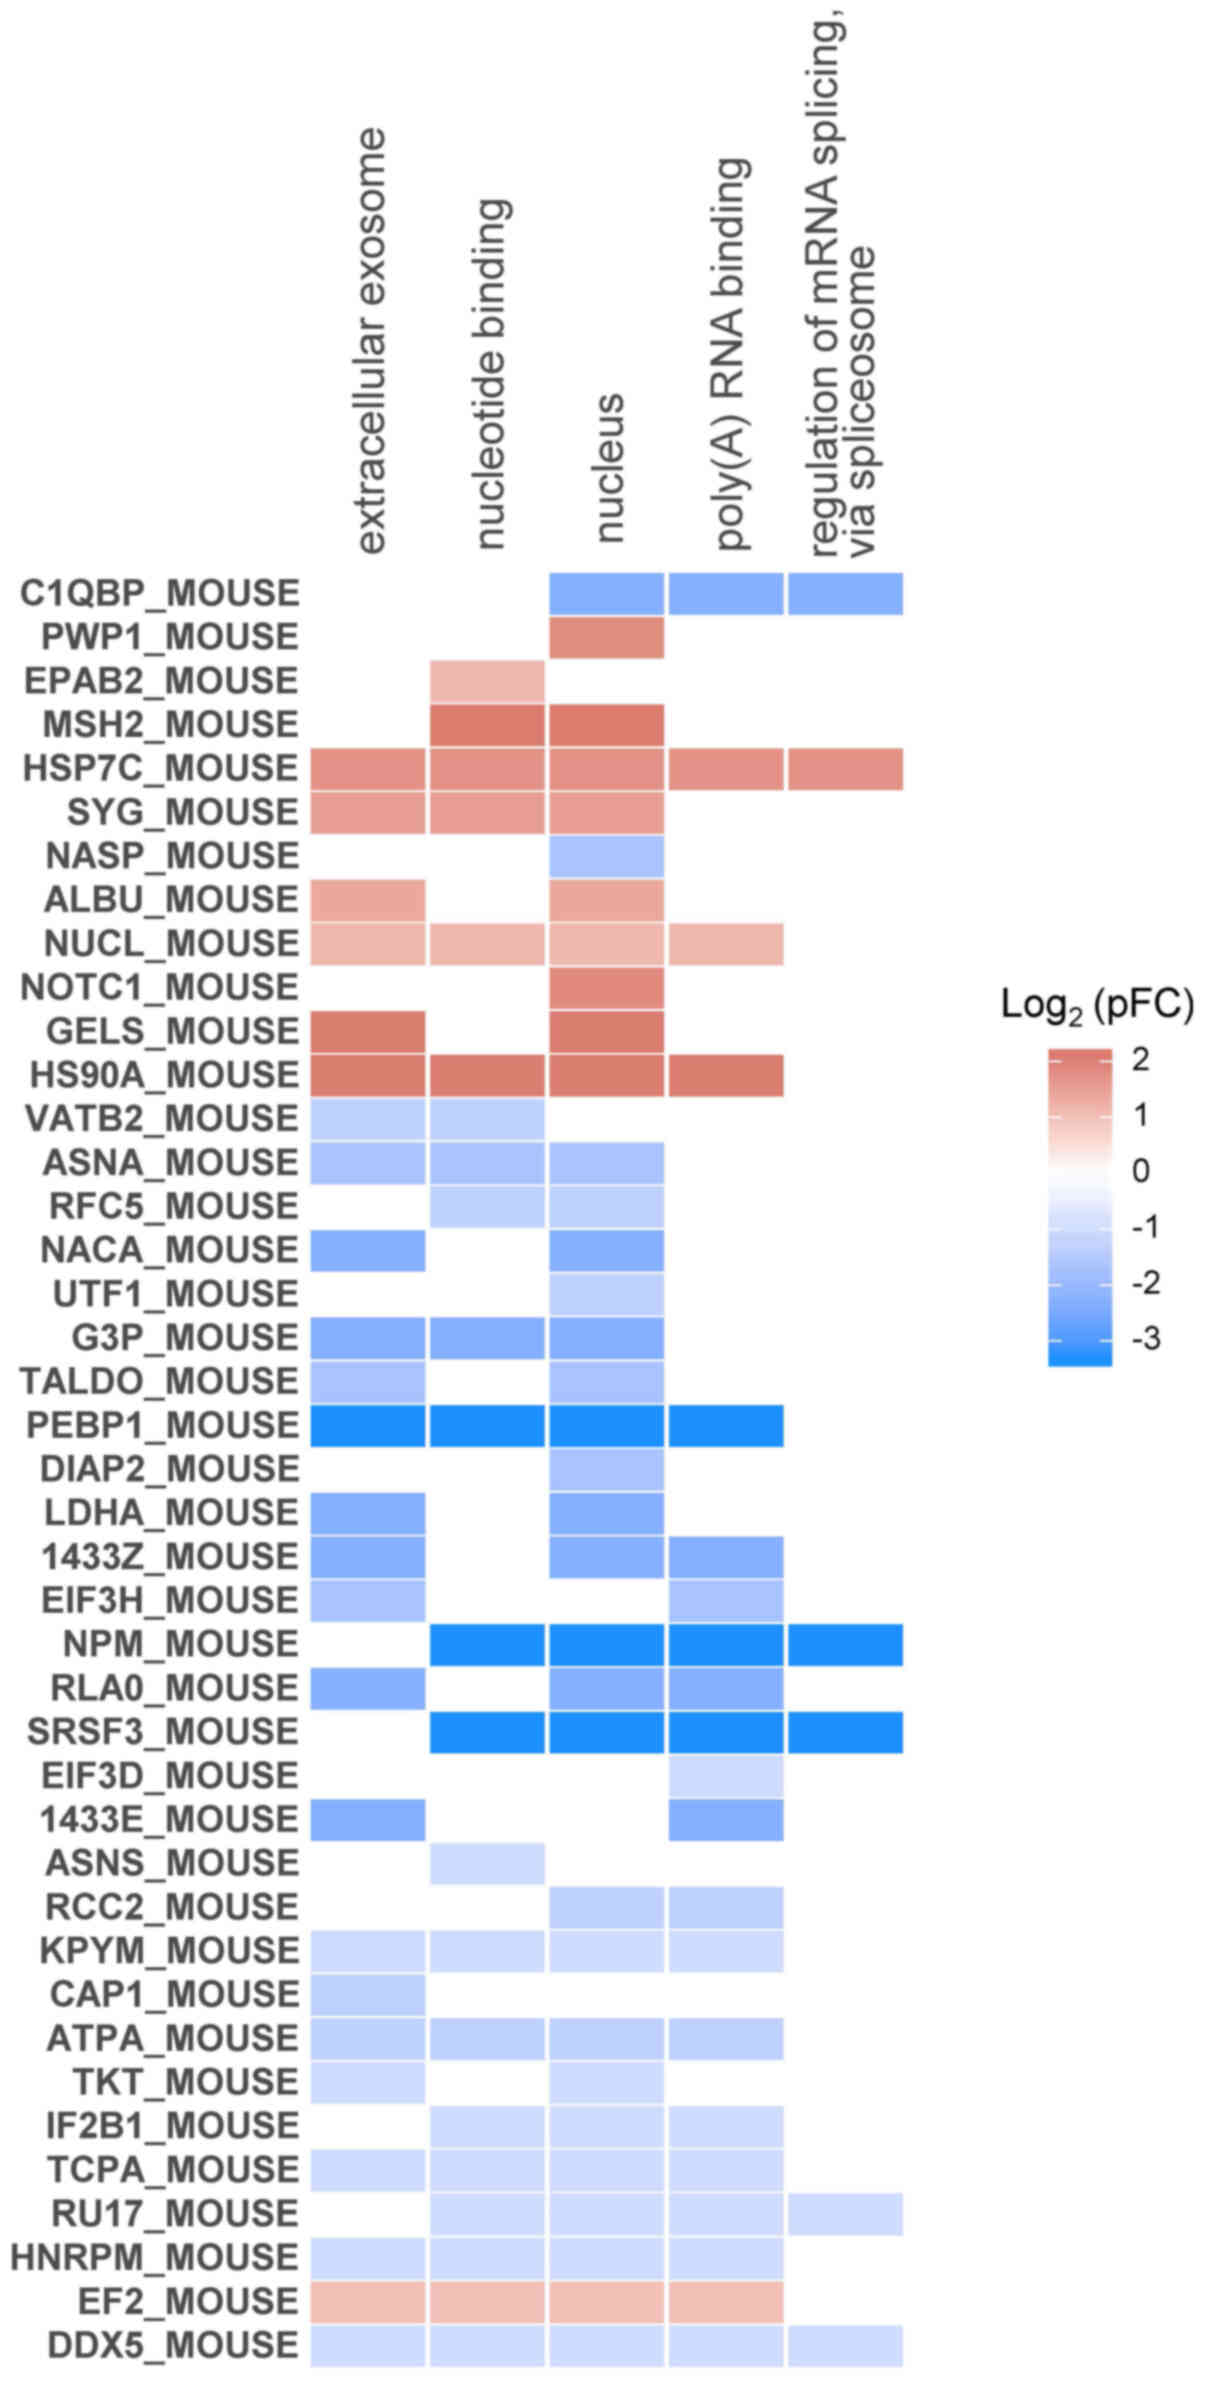
component and biological process networks, respectively. In order
to investigate individual proteins, associations between GO terms
and the phosphorylation ratios of individual member proteins were
visualized as a heatmap (Fig. 6).
The heat shock proteins HSP7C and HS90A, which are found in a
transcription factor complex binding Oct4 promoter in iPSCs
(20), were phosphorylated by LIF
treatment and were associated with the largest number of enriched
terms. nucleophosmin (NPM), phosphatidylethanolamine-binding
protein 1 (PEBP1), and serine-arginine-rich splicing factor 3
(SRSF3) were highly dephosphorylated by LIF treatment and were
associated with the majority of the enriched terms, as well as with
stem cell and progenitor cell regulation (21–23).
| Table IV.Top ten representative GO terms in
each category. |
Table IV.
Top ten representative GO terms in
each category.
| A, Molecular
function |
|---|
|
|---|
| ID | GO term | Adjusted
P-value | Z-score |
|---|
| GO:0044822 | Poly(A) RNA
binding |
9.606698×10⁻¹³ | −2.836833 |
| GO:0003723 | RNA binding |
7.091495×10⁻¹¹ | −2.558409 |
| GO:0036094 | Small molecule
binding |
5.858415×10⁻⁹ | −2.041241 |
| GO:1901265 | Nucleoside
phosphate binding |
4.889536×10⁻⁸ | −1.705606 |
| GO:0000166 | Nucleotide
binding |
4.889536×10⁻⁸ | −1.705606 |
| GO:1901363 | Heterocyclic
compound binding |
1.305847×10⁻⁷ | −2.611165 |
| GO:0097159 | Organic cyclic
compound binding |
1.902716×10⁻⁷ | −2.611165 |
| GO:0019899 | Enzyme binding |
2.147613×10⁻⁷ | −1.605910 |
| GO:0003676 | Nucleic acid
binding |
2.339591×10⁻⁷ | −2.116951 |
| GO:0023026 | MHC class II
protein complex binding |
6.216308×10⁻⁶ | 0.000000 |
|
| B, Cellular
component |
|
| ID | GO term | Adjusted
P-value | Z-score |
|
| GO:0043209 | Myelin sheath |
2.648695×10⁻¹¹ | −0.904534 |
| GO:0070062 | Extracellular
exosome |
8.447870×10⁻¹¹ | −2.200000 |
| GO:1903561 | Extracellular
vesicle |
9.514470×10⁻¹¹ | −2.200000 |
| GO:0043230 | Extracellular
organelle |
1.005467×10⁻¹⁰ | −2.200000 |
| GO:0031988 | Membrane-bounded
vesicle |
3.977979×10⁻¹⁰ | −2.116951 |
| GO:0031982 | Vesicle |
1.167650×10⁻⁹ | −2.116951 |
| GO:0005634 | Nucleus |
1.322581×10⁻⁸ | −2.400980 |
| GO:0044421 | Extracellular
region part |
3.980441×10⁻⁸ | −2.353394 |
| GO:0044424 | Intracellular
part |
8.712117×10⁻⁸ | −3.015113 |
| GO:0005576 | Extracellular
region |
1.295624×10⁻⁷ | −2.116951 |
|
| C, Biological
process |
|
| ID | Term | Adjusted
P-value | Z-score |
|
| GO:1901564 | Organonitrogen
compound metabolic process |
3.093931×10⁻⁸ | −2.683282 |
| GO:0006807 | Nitrogen compound
metabolic process |
7.391746×10⁻⁷ | −3.181981 |
| GO:0048024 | Regulation of mRNA
splicing, via spliceosome |
7.565866×10⁻⁷ | −1.632993 |
| GO:0009117 | Nucleotide
metabolic process |
7.969470×10⁻⁷ | −1.507557 |
| GO:0006753 | Nucleoside
phosphate metabolic process |
9.270259×10⁻⁷ | −1.507557 |
| GO:0034641 | Cellular nitrogen
compound metabolic process |
9.746239×10⁻⁷ | −3.053290 |
| GO:0019693 | Ribose phosphate
metabolic process |
1.119463×10⁻⁶ | −1.897367 |
| GO:0055086 |
Nucleobase-containing small molecule
metabolic process |
1.923331×10⁻⁶ | −1.507557 |
| GO:0050684 | Regulation of mRNA
processing |
3.913029×10⁻⁶ | −1.632993 |
| GO:0043484 | Regulation of RNA
splicing |
5.405842×10⁻⁶ | −1.632993 |
Discussion
The present study demonstrated that LIF increased
tyrosine and serine phosphorylation of numerous mESC proteins.
Total phosphorylation levels of a number of proteins following LIF
treatment were analyzed; 15 proteins were phosphorylated and 33
were dephosphorylated. The most significantly phosphorylated
protein following LIF treatment was nuclear autoantigenic sperm
protein (NASP; Table II). This
histone H1 binding protein transports histones into the nuclei of
dividing cells (24). NASP is
phosphorylated following DNA damage (25), and its increased phosphorylation
following LIF treatment may be associated with DNA repair during
mESC proliferation. There were two spots for NASP protein on the
2-D electrophoresis gel with the same molecular weight (138 kDa)
and slightly different PI values (4.5 and 4.4), which differed from
those reported in the NCBI database (84 kDa and 4.4). The
phosphorylation of one spot was increased and the other was
decreased by LIF stimulation. This suggested that different forms
of NASP are differentially phosphorylated in response to LIF
stimulation.
The second most significantly phosphorylated protein
following LIF treatment was asparagine synthetase (AS). AS is a
housekeeping enzyme that produces asparagine from aspartate and
glutamine. In the majority of cells, AS regulates its activity in
response to environmental asparagine levels (26). However, certain tumor cells have
little or no AS activity and are reliant on exogenous asparagine
(27). Therefore, tumor cells can
be selectively killed by asparaginases. This approach has been
exploited in the treatment of certain types of cancer, such as
childhood acute lymphoblastic leukemia (28). To the best of our knowledge, whether
AS is regulated by phosphorylation has not been reported.
Nucleolin (NUCL) is a multifunctional RNA binding
protein involved in numerous cellular processes such as chromatin
remodeling, ribosomal RNA synthesis, mRNA processing, ribosome
assembly and nucleo-cytoplasmic transport (29). It has been demonstrated that NUCL
serves an essential role in maintaining the self-renewal ability of
ESCs due to its role in regulating cell cycle progression,
proliferation and apoptosis prevention (30). The RNA-binding activity of NUCL is
affected by phosphorylation (30).
We found that different forms of NUCL are differentially
phosphorylated in response to LIF stimulation.
The most significantly dephosphorylated protein
following LIF treatment was the DNA mismatch repair protein MutS
homolog 2 (MSH2). MSH2 is commonly associated with hereditary
non-polyposis colorectal cancer (31). MSH2 phosphorylation results in
increased mismatch binding by the MutS α complex (32). The present study suggested that MSH2
dephosphorylation by LIF might be involved in the response of mESCs
to genotoxic stress.
In addition, significantly differentially
phosphorylated proteins following LIF treatment were analyzed for
enrichment in GO biological processes, molecular functions and
cellular components. Differentially phosphorylated proteins were
enriched in ‘poly(A) RNA’ and ‘nucleotide binding’, ‘localization
to the nucleus’ and ‘extracellular exosomes’ and ‘regulation of
mRNA splicing via the spliceosome’. A number of RNA binding
proteins are dynamically regulated during reprogramming, suggesting
an important role in mESC self-renewal (33). Previous studies have demonstrated
that specific alternative splicing events can modulate
transcriptional networks involved in pluripotency maintenance vs.
differentiation (34,35). These results suggest that the
differentially phosphorylated proteins identified in the present
study reflect mESC cellular functions.
Acknowledgements
Not applicable.
Funding
The present study was supported by a grant from the
National Research Foundation (grant no. 2017M3A9B4065302) funded by
the Ministry of Science and ICT in the Republic of Korea.
Availability of data and materials
The datasets used and/or analyzed during the current
study are available from the corresponding author on reasonable
request.
Authors' contributions
HRS, HKK, SGK, HJL and HYK performed the
experiments, collected and analyzed data and interpreted the
results. MKH designed the experiments and wrote the manuscript. All
authors read and approved the final manuscript.
Ethics approval and consent to
participate
Not applicable.
Patient consent for publication
Not applicable.
Competing interests
The authors declare that they have no competing
interests.
References
|
1
|
Martin GR: Isolation of a pluripotent cell
line from early mouse embryos cultured in medium conditioned by
teratocarcinoma stem cells. Proc Natl Acad Sci USA. 78:7634–7638.
1981. View Article : Google Scholar : PubMed/NCBI
|
|
2
|
Thomson JA, Itskovitz-Eldor J, Shapiro SS,
Waknitz MA, Swiergiel JJ, Marshall VS and Jones JM: Embryonic stem
cell lines derived from human blastocysts. Science. 282:1145–1147.
1998. View Article : Google Scholar : PubMed/NCBI
|
|
3
|
Aladjem MI, Spike BT, Rodewald LW, Hope
TJ, Klemm M, Jaenisch R and Wahl GM: ES cells do not activate
p53-dependent stress responses and undergo p53-independent
apoptosis in response to DNA damage. Curr Biol. 8:145–155. 1998.
View Article : Google Scholar : PubMed/NCBI
|
|
4
|
Takahashi K, Tanabe K, Ohnuki M, Narita M,
Ichisaka T, Tomoda K and Yamanaka S: Induction of pluripotent stem
cells from adult human fibroblasts by defined factors. Cell.
131:861–872. 2007. View Article : Google Scholar : PubMed/NCBI
|
|
5
|
Yu J, Vodyanik MA, Smuga-Otto K,
Antosiewicz-Bourget J, Frane JL, Tian S, Nie J, Jonsdottir GA,
Ruotti V, Stewart R, et al: Induced pluripotent stem cell lines
derived from human somatic cells. Science. 318:1917–1920. 2007.
View Article : Google Scholar : PubMed/NCBI
|
|
6
|
Rajarajan K, Engels MC and Wu SM:
Reprogramming of mouse, rat, pig, and human fibroblasts into iPS
cells. Curr Protoc Mol Biol. Jan 1–2012.(Epub ahead of print). doi:
10.1002/0471142727.mb2315s97. View Article : Google Scholar : PubMed/NCBI
|
|
7
|
Niwa H, Burdon T, Chambers I and Smith A:
Self-renewal of pluripotent embryonic stem cells is mediated via
activation of STAT3. Genes Dev. 12:2048–2060. 1998. View Article : Google Scholar : PubMed/NCBI
|
|
8
|
Ernst M, Oates A and Dunn AR:
Gp130-mediated signal transduction in embryonic stem cells involves
activation of Jak and Ras/mitogen-activated protein kinase
pathways. J Biol Chem. 271:30136–30143. 1996. View Article : Google Scholar : PubMed/NCBI
|
|
9
|
Migone TS, Rodig S, Cacalano NA, Berg M,
Schreiber RD and Leonard WJ: Functional cooperation of the
interleukin-2 receptor beta chain and Jak1 in phosphatidylinositol
3-kinase recruitment and phosphorylation. Mol Cell Biol.
18:6416–6422. 1998. View Article : Google Scholar : PubMed/NCBI
|
|
10
|
Bechard M and Dalton S: Subcellular
localization of glycogen synthase kinase 3beta controls embryonic
stem cell self-renewal. Mol Cell Biol. 29:2092–2104. 2009.
View Article : Google Scholar : PubMed/NCBI
|
|
11
|
Hermanns HM, Radtke S, Schaper F, Heinrich
PC and Behrmann I: Non-redundant signal transduction of
interleukin-6-type cytokines. The adapter protein Shc is
specifically recruited to rhe oncostatin M receptor. J Biol Chem.
275:40742–40748. 2000. View Article : Google Scholar : PubMed/NCBI
|
|
12
|
Huang W, Sherman BT and Lempicki RA:
Systematic and integrative analysis of large gene lists using DAVID
bioinformatics resources. Nat Protoc. 4:44–57. 2009. View Article : Google Scholar : PubMed/NCBI
|
|
13
|
Walter W, Sánchez-Cabo F and Ricote M:
GOplot: An R package for visually combining expression data with
functional analysis. Bioinformatics. 31:2912–2914. 2015. View Article : Google Scholar : PubMed/NCBI
|
|
14
|
Wei Q, Khan IK, Ding Z, Yerneni S and
Kihara D: NaviGO: Interactive tool for visualization and functional
similarity and coherence analysis with gene ontology. BMC
Bioinformatics. 18:1772017. View Article : Google Scholar : PubMed/NCBI
|
|
15
|
Toumadje A, Kusumoto K, Parton A, Mericko
P, Dowell L, Ma G, Chen L, Barnes DW and Sato JD: Pluripotent
differentiation in vitro of murine ES-D3 embryonic stem cells. In
Vitro Cell Dev Biol Anim. 39:449–453. 2003. View Article : Google Scholar : PubMed/NCBI
|
|
16
|
Meng GL, Zur Nieden NI, Liu SY, Cormier
JT, Kallos MS and Rancourt DE: Properties of murine embryonic stem
cells maintained on human foreskin fibroblasts without LIF. Mol
Reprod Dev. 75:614–622. 2008. View Article : Google Scholar : PubMed/NCBI
|
|
17
|
Johansson H and Simonsson S: Core
transcription factors, Oct4, Sox2 and Nanog, individually form
complexes with nucleophosmin (Npm1) to control embryonic stem (ES)
cell fate determination. Aging (Albany NY). 2:815–822. 2010.
View Article : Google Scholar : PubMed/NCBI
|
|
18
|
Wu Y, Chen K, Xing G, Li L, Ma B, Hu Z,
Duan L and Liu X: Phospholipid remodeling is critical for stem cell
pluripotency by facilitating mesenchymal-to-epithelial transition.
Sci Adv. 5:eaax75252019. View Article : Google Scholar : PubMed/NCBI
|
|
19
|
Xu Y, Zhao W, Olson SD, Prabhakara KS and
Zhou X: Alternative splicing links histone modifications to stem
cell fate decision. Genome Biol. 19:1332018. View Article : Google Scholar : PubMed/NCBI
|
|
20
|
Kwon YW, Ahn HS, Park JY, Yang HM, Cho HJ
and Kim HS: Imprinted gene Zinc finger protein 127 is a novel
regulator of master pluripotency transcription factor, Oct4. BMB
Rep. 51:242–248. 2018. View Article : Google Scholar : PubMed/NCBI
|
|
21
|
Pyo JH, Jeon HJ, Park JS, Lee JS, Chung HY
and Yoo MA: Drosophila PEBP1 inhibits intestinal stem cell aging
via suppression of ERK pathway. Oncotarget. 9:17980–17993. 2018.
View Article : Google Scholar : PubMed/NCBI
|
|
22
|
Ratnadiwakara M, Archer SK, Dent CI, Mozos
IR, Beilharz TH, Knaupp AS, Nefzger CM, Polo JM and Anko ML: SRSF3
promotes pluripotency through Nanog mRNA export and coordination of
the pluripotency gene expression program. Elife. 7:e374192018.
View Article : Google Scholar : PubMed/NCBI
|
|
23
|
Li J, Sejas DP, Rani R, Koretsky T, Bagby
GC and Pang Q: Nucleophosmin regulates cell cycle progression and
stress response in hematopoietic stem/progenitor cells. J Biol
Chem. 281:16536–16545. 2006. View Article : Google Scholar : PubMed/NCBI
|
|
24
|
Alekseev OM, Widgren EE, Richardson RT and
O'Rand MG: Association of NASP with HSP90 in mouse spermatogenic
cells: Stimulation of ATPase activity and transport of linker
histones into nuclei. J Biol Chem. 280:2904–2911. 2005. View Article : Google Scholar : PubMed/NCBI
|
|
25
|
Alekseev OM, Bencic DC, Richardson RT,
Widgren EE and O'Rand MG: Overexpression of the linker
histone-binding protein tNASP affects progression through the cell
cycle. J Biol Chem. 278:8846–8852. 2003. View Article : Google Scholar : PubMed/NCBI
|
|
26
|
Lomelino CL, Andring JT, McKenna R and
Kilberg MS: Asparagine synthetase: Function, structure, and role in
disease. J Biol Chem. 292:19952–19958. 2017. View Article : Google Scholar : PubMed/NCBI
|
|
27
|
Gantt JS, Chiang CS, Hatfield GW and Arfin
SM: Chinese hamster ovary cells resistant to
beta-aspartylhydroxamate contain increased levels of asparagine
synthetase. J Biol Chem. 255:4808–4813. 1980. View Article : Google Scholar : PubMed/NCBI
|
|
28
|
Ortega JA, Nesbit ME Jr, Donaldson MH,
Hittle RE, Weiner J, Karon M and Hammond D: L-Asparaginase,
vincristine, and prednisone for induction of first remission in
acute lymphocytic leukemia. Cancer Res. 37:535–540. 1977.PubMed/NCBI
|
|
29
|
Zhang X, Xiao S, Rameau RD, Devany E,
Nadeem Z, Caglar E, Ng K, Kleiman FE and Saxena A: Nucleolin
phosphorylation regulates PARN deadenylase activity during cellular
stress response. RNA Biol. 15:251–260. 2018. View Article : Google Scholar : PubMed/NCBI
|
|
30
|
Yang A, Shi G, Zhou C, Lu R, Li H, Sun L
and Jin Y: Nucleolin maintains embryonic stem cell self-renewal by
suppression of p53 protein-dependent pathway. J Biol Chem.
286:43370–43382. 2011. View Article : Google Scholar : PubMed/NCBI
|
|
31
|
Leach FS, Nicolaides NC, Papadopoulos N,
Liu B, Jen J, Parsons R, Peltomäki P, Sistonen P, Aaltonen LA,
Nyström-Lahti M, et al: Mutations of a mutS homolog in hereditary
nonpolyposis colorectal cancer. Cell. 75:1215–1225. 1993.
View Article : Google Scholar : PubMed/NCBI
|
|
32
|
Christmann M, Tomicic MT and Kaina B:
Phosphorylation of mismatch repair proteins MSH2 and MSH6 affecting
MutSalpha mismatch-binding activity. Nucleic Acids Res.
30:1959–1966. 2002. View Article : Google Scholar : PubMed/NCBI
|
|
33
|
Kwon SC, Yi H, Eichelbaum K, Föhr S,
Fischer B, You KT, Castello A, Krijgsveld J, Hentze MW and Kim VN:
The RNA-binding protein repertoire of embryonic stem cells. Nat
Struct Mol Biol. 20:1122–1130. 2013. View Article : Google Scholar : PubMed/NCBI
|
|
34
|
Chen K, Dai X and Wu J: Alternative
splicing: An important mechanism in stem cell biology. World J Stem
Cells. 7:1–10. 2015. View Article : Google Scholar : PubMed/NCBI
|
|
35
|
Das S, Jena S and Levasseur DN:
Alternative splicing produces Nanog protein variants with different
capacities for self-renewal and pluripotency in embryonic stem
cells. J Biol Chem. 286:42690–42703. 2011. View Article : Google Scholar : PubMed/NCBI
|