Introduction
Breast cancer is a common malignancy in women
(1), with increasing incidence
and mortality rates worldwide (2). In 2017, 252,710 new breast cancer
cases were recorded in the United States (1). Although breast cancer therapies have
improved, more breast cancer cases have been reported in recent
years compared with 2008, possibly due to specific key risk
factors, such as alcohol consumption, obesity and ageing (3). Therefore, novel treatment approaches
and diagnostic tools for the early diagnosis of breast cancer are
urgently required.
With the recent discovery of drugs targeting
specific molecules in breast cancer, such as human epidermal growth
factor receptor 2, epidermal growth factor receptor and the
mammalian target of rapamycin signalling pathway, targeted therapy
has been attracting increasing interest (4–6).
It has been reported that inhibitor of apoptosis protein-like
protein-2 (ILP-2) is upregulated in breast cancer cells and
tissues, and promotes breast cancer growth (7). Protein expression levels of ILP-2 in
breast cancer cell lines, such as MX-1 and MCF-7, have been found
to be significantly increased when compared with those in the
breast epithelial cell line MCF-10A, and small interfering
(si)RNA-5 has demonstrated higher knockdown (KD) efficiency on
ILP-2 than siRNA-3. A previous study from our laboratory suggested
that ILP-2 could be considered a serological biomarker and a novel
growth factor in breast cancer (8). However, the mechanism underlying the
effect of ILP-2 on promoting breast cancer growth remains
unknown.
Isobaric tag for relative and absolute quantitation
(iTRAQ) is an accurate and reliable proteomic method used for
quantitative analysis (9). This
method is applied in proteomic analysis via combining liquid
chromatography and tandem mass spectrometry (LC-MS/MS). These tags
can be covalently linked to amino acids, including N-terminal amino
acids and lysine side chain amino acids, through stable
isotopically labelled molecules (10–12).
The present study aimed to investigate the
expression profile of ILP-2-related proteins in MCF-7 cells to
reveal the mechanism underlying the effect of ILP-2 on accelerating
breast cancer cell proliferation and to ascertain whether ILP-2
could act as a novel target for the targeted therapy of breast
cancer.
Materials and methods
Cell culture and collection
MCF-7 and MX-1 cells lines were obtained from the
American Type Culture Collection. Cell lines were cultured in
RPMI-1640 medium (Gibco; Thermo Fisher Scientific, Inc.)
supplemented with 10% foetal bovine serum (FBS; Gibco; Thermo
Fisher Scientific, Inc.) and 1% Penicillin-Streptomycin mixture
(Beijing Solarbio Science & Technology Co., Ltd.) in 5%
CO2 at 37°C.
RNA interference
MCF-7 and MX-1 cell lines were divided into the
siRNA-5 group (KD group), which targeted ILP-2, and the negative
control (NC) group. According to the manufacturer's instructions,
Lipofectamine® 2000 (Invitrogen; Thermo Fisher
Scientific, Inc.) and siRNA [siRNA-5 (sense,
5′-CUAUACGAAUGGGAUUUGATT −3′ and antisense,
5′-UCAAAUCCCAUUCGUAUAGTT −3′) and NC siRNA (sense,
5′-UUCUCCGAACGUGUCACGUTT −3′ and antisense,
5′-ACGUGACACGUUCGGAGAATT −3′) (both from Shanghai GenePharma Co.,
Ltd.)] were individually mixed at 1:1 (volume ratio) and stored for
20 min at room temperature. Two groups of mixed siRNA (siRNA-5 and
NC) and Lipofectamine 2000 were added to MCF-7 and MX-1 cells at a
cell density of 50%, and cultivated in 5% CO2 for 24 h
at 37°C. The siRNA had a final concentration of 100 nM (13,14). Total proteins and RNA were
separately extracted, and then proteins and RNA were analysed via
western blotting and reverse transcription-quantitative (RT-q)PCR
analysis, respectively.
Overexpression plasmid vector
construction
Plasmid vector GV219, restriction endonuclease
XhoI/KpnI, primers and Escherichia coli
strains were obtained from Shanghai GeneChem Co., Ltd. The primers
were designed based on the sequence of the coding region of the
BIRC-8 (ILP-2) gene in the National Center for
Biotechnology Information. ID no. BIRC8(69070–1)-p1,
5′ACGGGCCCTCTAGACTCGAGACTCCACCGCGTGGTTTC-3′ and BIRC8
(69070–1)-p2, 5′-TTAAACTTAAGCTTGGTACCTTGAGTCACATCACACATTTAATC-3′.
The target gene fragments were prepared and the digestion sites
were constructed according to the vector requirements. The
linearised vector and the target gene amplification products were
used to formulate the reaction system, and the recombination
reaction was carried out to achieve in vitro cyclisation of
the linearised vector and the target gene fragment. The recombinant
product was directly transformed and single clones from the plates
were chosen for PCR identification, sequencing of positive clones
and analysis of the results. The correct clone broth was expanded
and extracted to obtain a high purity plasmid for subsequent
experiments.
Plasmid extraction
The correctly sequenced bacteriophage was
transferred to 10 ml lysogeny broth liquid medium (both from
Shanghai GeneChem Co., Ltd.) containing the corresponding
antibiotics (50 mg/l ampicillin), incubated overnight at 37°C, and
the plasmid was extracted using the Plasmid Small Extraction Medium
Kit (Shanghai GeneChem Co., Ltd.). The overnight culture was
collected in a labelled 5-ml centrifuge tube at 12,000 × g and
centrifuged for 2 min at 4°C to collect the bacterium. The
supernatant was discarded, 250 µl cell resuspension solution was
added and then shaken to keep the bacterium in suspension.
Subsequently, 250 µl RIPA lysis buffer and 10 µl proteinase K was
added, mixed gently by inverting up and down 5–6 times, and then
left for 1–2 min to clarify the lysis. Neutralising Solution (350
µl) was added, mixed upside down to completely remove the protein
and left for 5 min in an ice bath. Centrifugation was performed at
10,000 × g for 10 min at 4°C, the protein was then discarded and
the supernatant was collected in a clean, sterile 1.5 ml Eppendorf
(EP) Tube®. Centrifugation was performed at 12,000 × g
for 5 min at 4°C and a labelled recovery column was prepared. The
lower waste layer was discarded. Subsequently, 600 µl
pre-programmed rinse solution was added, centrifuged at 12,000 × g
for 1 min at 4°C and the lower waste layer was discarded, this was
repeated at 12,000 × g for 2 min at 4°C to further remove the
residual rinse solution. The column was transferred to a new 1.5-ml
EP tube on the ultra-clean table and left to stand for 10–20 min to
dry. Nuclease-Free Water (95 µl) was added to the recovery column,
left for 2 min, centrifuged at 12,000 × g for 2 min at 4°C, and the
samples were collected for numbering, electrophoresis,
determination of concentration and quality control.
According to the manufacturer's instructions,
Lipofectamine 2000 and plasmid vector GV219 [GV219-ILP-2 and GV219
empty vector (NC)] were individually mixed at 1:1 (volume ratio)
and stored for 20 min at room temperature. Mixed Lipofectamine 2000
and plasmid vector GV219 were added to MCF-7 and MX-1 cells (cell
density of ~50%) and cultivated in 5% CO2 for 24 h at
37°C, wherein the plasmid vector GV219 (GV219-ILP-2 and NC) had a
final concentration of 100 nM. Overexpression effects on ILP-2
expression were analysed by western blotting.
Mixed Lipofectamine 2000 and plasmid vector GV219
(GV219-ILP-2 and NC) were added to the MCF-7 and MX-1 cells in the
logarithmic growth phase and cultivated in 5% CO2 for 24
h at 37°C. Total proteins were separately extracted from MCF-7 and
MX-1 cells with RIPA buffer (Beyotime Institute of Biotechnology).
MCF-7 and MX-1 cells were washed with 0.01 M PBS to remove the
medium. Afterwards, a lysis buffer (7 M urea and 4% SDS) containing
1 mM phenyl-methane-sulfonyl fluoride was added to each group of
cells (1×10⁷ cells). The cells were lysed on ice for 30
min and then 12,000 × g for 5 min at 4°C to extract the supernatant
of the mixed solution for analysis, following which proteins were
analysed via western blotting.
ITRAQ assays
SDS-PAGE and protein digestion
Total proteins of the aforementioned mixed solution
from the two groups of cells (siRNA-5 and NC) were extracted from
MCF-7 cells with RIPA buffer (Applygen Technologies, Inc.). Protein
concentrations of isolated proteins in the aforementioned two
groups were determined by a BCA protein assay kit (Applygen
Technologies, Inc.). Protein concentrations of samples were
adjusted to a constant level using the dilution. Total protein (20
µg/lane) was separated via SDS-PAGE on 10% gels. Proteins in the
gels were cut into gel slices, and the gel bands were digested by
an in-gel trypsin.
Reductive alkylation and protease
digestion
Dithiothreitol (20 mM final concentration) was added
to extracted protein samples by SDS-PAGE (100 µg/µl), and the
samples were incubated at 37°C for 60 min. Iodoacetamide (40 mM
final concentration) was added and the samples incubated in the
dark at room temperature for 40 min. Pre-cooled acetone (volume
ratio of 5:1) was added to the samples, and the mixture was placed
at −20°C for 2 h. The sediment was collected by centrifugation at
10,000 × g for 20 min at 4°C and re-dissolved in 100 mM tetraethyl
ammonium bromide buffer. Trypsin (1 mg trypsin/50 mg protein) was
added to the protein samples, and settled at 37°C overnight.
Isotope labelling
Protease-digested proteins were labelled with 113,
117, 114 and 118 isotopes. The NC group was labelled with 113 and
117 isotopes, whereas the siRNA-5 group was labelled with 114 and
118 isotopes. There were two biological replicates and three
technical replicates. Peptides (100 µg) were labelled with an iTRAQ
reagent tube (Applygen Technologies, Inc.) (15,16).
First dimensional separation of
peptides
Separation of peptides was performed by ultra-high
pressure liquid chromatography (UPLC) (Waters Corporation) with a
2.1×150 mm X Bridge BEH300 column (Waters Corporation). The moving
phase was a mixture of water (pH adjusted to 10.0 with ammonia and
formic acid) and acetonitrile, which was isocratically transmitted
using a pump at a flow rate of 0.4 ml/min. The wavelength of the
ultraviolet absorbance detector was 214/280 nm. The percentages
used for gradient elution are listed in Table I. A total of 10 fractions were
collected according to different retention times. Rotation vacuum
concentrators (Christ RVC 2–25; Martin Christ
Gefriertrocknungsanlagen GmbH) were used for concentration, and
dissolved in buffer solution (pH adjusted to 10.0 with ammonia and
formic acid) for further analysis.
 | Table I.Liquid chromatography gradient of
first dimensional separation of peptides. |
Table I.
Liquid chromatography gradient of
first dimensional separation of peptides.
| Time, min | B, % |
|---|
| 0 | 2 |
| 5 | 5 |
| 40 | 25 |
| 45 | 80 |
| 50 | 80 |
| 51 | 2 |
| 60 | stop |
LC-MS/MS
Labelled peptides were analysed using a NanoAcquity
UPLC system (Waters Corporation) combined with a
quadrupole-Orbitrap mass spectrometer (Q-Exactive; Thermo Fisher
Scientific, Inc.), incorporating a C18 column (75 µm × 25 cm;
Thermo Fisher Scientific, Inc.). The mobile phase was a mixture of
water, with 2% acetonitrile and 0.1% formic acid isocratically
delivered using a pump at a flow rate of 300 nl/min. The schemes
used for gradient elution are shown in Table II. Full-scan mass spectrometry
(350-1,300 m/z) was acquired with a first mass resolution of 70 K,
and second resolution of 17.5 K (Chromeleon 7.3 CDS software; cat.
no. CHROMELEON7; Thermo Fisher Scientific, Inc.). Fragmentation was
used for high-energy collision dissociation. The micro scan was
recorded using dynamic exclusion of 18 sec.
| Table II.Gradient elution of liquid
chromatography and tandem mass spectrometry. |
Table II.
Gradient elution of liquid
chromatography and tandem mass spectrometry.
| Time, min | B, % |
|---|
| 0 | 2 |
| 70 | 40 |
| 70 | 90 |
| 75 | 90 |
| 75 | 2 |
| 90 | 2 |
iTRAQ data analysis
The MS/MS data of iTRAQ were analysed using Proteome
Discoverer Software version 2.1 (Thermo Fisher Scientific, Inc.)
and searched in Uniprot-proteomes-homo-sapiens-70611.fasta. The
database had 70,611 entries and the date of download was July 15,
2016 [project ID. IPX0001520000; https://www.iprox.cn/page/PSV023.html;?url=1640500832317IEB0
(password, deZn)]. Result-filtered parameters were used to control
peptide level false discovery rates ≤1%. Protein quantification was
performed by only using unique peptides, and normalisation of
protein medians was applied to rectify experimental deviation,
which was accomplished by using retrieval software. The ratios of
the samples were weighted, and normalised by contrasting the NC
group (sample tagged as 113 and 117) to the denominator for protein
quantitation. Regarding the quantitative changes, a ≥1.2 or ≤0.83
fold-change (FC) takeout and P<0.05 (t-test) were set for
differentially expressed proteins (DEPs).
Gene Ontology (GO; http://www.geneontology.org/) and Kyoto Encyclopedia
of Genes and Genomes (KEGG; http://www.genome.jp/kegg/) pathway analyses were
applied to annotate and classify all authenticated proteins. The
Database for Annotation, Visualization and Integrated Discovery
(DAVID) version 6.8 Functional Annotation Tool (https://david.ncifcrf.gov/) was applied to process the
DEPs for the enrichment analysis. Fisher's exact test was used to
filter results. ClueGO of Cytoscape software (http://www.cytoscape.org/) was performed to assess GO
biological networks. Search Tool for the Retrieval of Interacting
Genes (STRING) version 10.0 (http://www.string-db.org/) was applied to analyse
protein-protein interactions, and a high coefficient value of 0.7
was used as a cut-off. The expression patterns of DEPs (FC ≥1.2 or
≤0.83 and P<0.05) were identified by Cluster analysis using
hcluster (https://pypi.python.org/pypi/hcluster/0.2.0) (9,17).
Western blot analysis
Cells in the siRNA-5 and NC groups (5×10⁶
cells/group) were separately collected and western blot analysis
was carried out. Total proteins were extracted from MCF-7 and MX-1
cells with RIPA buffer [150 mM NaCl, 20 mM Tris, 0.1% SDS (pH 7.5),
1% deoxycholate and 1% Triton X-100] supplemented with protease
inhibitors. The protein concentration was determined using a BCA
Protein Assay kit. Subsequently, total proteins (30 µg/per lane)
were separated by SDS-PAGE on 10% gels at 70 V for 20 min and then
at 100 V for 100 min. The proteins were then transferred onto PVDF
membranes (Merck KGaA) at 350 mA for 105 min. After blocking with
5% skimmed milk powder in TBS with 0.05% Tween-20 (TBST) for 2 h at
37°C, the membranes were incubated with primary antibodies against
metallothionein 1E (MT1E; mouse IgG; 1:500; cat. no. MAD794Hu21;
Cloud-Clone Corp.), ILP-2 (rabbit IgG; 1:1,000; cat. no. ab9664),
tryptophan 2,3-dioxygenase (TDO2; rabbit IgG; 1:500; cat. no.
ab84926), N(4)-(β-N-acetylglucosaminyl)-L-asparaginase
(AGA; rabbit IgG; 1:500; cat. no. ab231021; all from Abcam),
Tubulin (rabbit IgG; 1:1,000; cat. no. ab6046; Abcam) and GAPDH
(mouse IgG; 1:2,500; cat. no. 60004-1-Ig; both from ProteinTech
Group, Inc.) overnight at 4°C. The next day, the membranes were
washed with TBST and incubated with HRP-conjugated goat anti-rabbit
IgG (1:5,000; cat. no. ab6728; Abcam) and HRP-conjugated AffiniPure
goat anti-rabbit IgG (H+L) (1:5,000; cat. no. ZB-2301; OriGene
Technologies, Inc.) for 1 h at room temperature. An ECL detection
system (SuperECL-Plus; Applygen Technologies, Inc.) was utilized to
visualise the immunoreactive proteins. The bands were
semi-quantified with ImageJ v1.8.0.112 software (National
Institutes of Health). Tubulin and GAPDH served as internal
controls. Experiments were repeated at least three times.
RT-qPCR analysis
To separately extract the total RNA of the siRNA-5
and NC groups cells, the cell samples were washed twice with 1 ml
PBS in a cell culture dish, 1 ml TRIzol® reagent
(Invitrogen; Thermo Fisher Scientific, Inc.) was added and evenly
pipetted for transfer into a 1.5 ml RNase-free EP tube to fully
lyse the cells. This was left to stand at room temperature for 10
min, after which 200 µl chloroform was added, shaken vigorously for
15 sec and left to stand at room temperature for 10 min.
Subsequently, this mixture was centrifuged at 4°C at 12,000 × g for
15 min, the upper colourless liquid phase was collected in a new
1.5 ml RNase-free EP tube, 500 µl isopropanol was added, and then
shaken and mixed well. After 10 min at room temperature, the
mixture was centrifuged at 4°C at 12,000 × g for 10 min and the
supernatant was discarded; 1 ml 75% alcohol was added, gently
shaken to wash the precipitate, centrifuged at 4°C for 5 min at
12,000 × g and the supernatant was discarded, which was repeated
twice. Subsequently, this was dried at room temperature for 15 min
and 50 µl diethyl pyrocarbonate water was added to dissolve the
RNA. The OD 260/280 of RNA was measured on the nucleic acid protein
detector to detect the purity of total RNA, and the RNA sample was
run via 1% agarose gel electrophoresis to detect RNA integrity. RT
of RNA was performed according to the manufacturer's instructions
of the qPCR RT Kit (Thermo Fisher Scientific, Inc.). The
concentration of total RNA of the aforementioned two groups of
cells was adjusted to 100 ng/µl. The components were added to a
0.2-ml RNase-free EP tube in the following order to prepare the RT
reaction solution: 2 µl 5X RT Buffer, 0.5 µl RT Enzyme Mix, 0.5 µl
Primer Mix, 1 µg RNA and the reaction solution was made to 10 µl by
adding RNA-free water. For RT, the aforementioned mixture was
loaded onto a PCR machine, and RT was performed at 37°C for 15 min
and at 98°C for 5 min, and the cDNA was stored at 4°C for immediate
use or at −20°C for long-term use. For qPCR, the manufacturer's
instructions of Bestar SYBR Green qPCR Master mix kit (DBI
Bioscience) were followed. The 20-µl reaction solution was prepared
with the following components: 10 µl Bestar SYBR Green qPCR Master
mix, 0.5 µl PCR forward primer (10 µM), 0.5 µl PCR reverse primer
(10 µM), 1 µl DNA template and 8 µl ddH2O. qPCR was performed using
the following thermocycling conditions: Pre-denaturation at 95°C
for 2 min; 40 cycles at 95°C for 10 sec, 60°C for 30 sec and 72°C
for 30 sec; and the melting curve was held at 95°C for 1 min and
55°C for 1 min. RT-qPCR was repeated three times and the
differences in expression levels were calculated using the
2−∆∆Cq method (18).
Primers used were as follows: AGA forward,
5′-CACTGCTTCTCAAGCTCTTCAT-3′ and reverse,
5′-GTTTGTAGGGTCCGCAGTATTT-3′; MT1E forward,
5′-CTTTCTTTGCCCTCATTGCCC −3′ and reverse, 5′-TACAGTTGGGGTTTGTGTCCC
−3′; TDO2 forward, 5′-GACACTGGATACCGAAGATGAA-3′ and reverse,
5′-CACTGCTGAAGTAGGAGCTATC-3′); and GAPDH forward,
5′-CATGAGAAGTATGACAACAGCCT-3′ and reverse,
5′-AGTCCTTCCACGATACCAAAGT-3′.
Statistical analysis
Date are presented as the mean ± SEM. Histograms
were constructed using GraphPad Prism 8 (GraphPad Software, Inc.).
Comparisons between two groups were analysed using an unpaired
Student's t-test. Comparisons among multiple groups were analysed
using one-way ANOVA followed by Bonferroni's post hoc test.
Statistical analysis was performed using SPSS software 17.0 (SPSS,
Inc.). Experiments were performed in triplicate. P<0.05 was
considered to indicate a statistically significant difference.
Results
Proteomic expression profiling of
ILP-2-related proteins in MCF-7 cells
iTRAQ-based proteomic analysis was used to evaluate
the expression profiles of ILP-2-related proteins during MCF-7 cell
proliferation. LC-MS/MS analysis generated 55,180 matched spectra,
20,857 peptides and 19,551 unique peptides (Fig. 1A-C). A total of 4,065 proteins
were identified by at least one unique peptide with a confidence
coefficient >95%. All proteins were subjected to GO analysis and
grouped according to biological process, cellular component and
molecular function terms (Fig.
1A). These proteins were mainly involved in the biological
processes of ‘single-organism process’, ‘cellular process’ and
‘metabolic process’, while ‘cell’, ‘organelle’ and ‘cell part’
accounted for a large portion of proteins in the cellular component
term. Additionally, ‘catalytic activity’ and ‘binding’ were the two
most dominant categories in the molecular function term (Fig. 1A). KEGG analysis revealed that
these proteins were mainly involved in the pathways of ‘global and
overview maps’, ‘signal transduction’ and ‘translation’ (Fig. 1B). In the top 20 signalling
pathways analysed by KEGG, a large number of proteins were
associated with ‘pathways in cancer’, ‘endocytosis’, ‘spliceosome’
and ‘RNA transport’ (Fig.
1C).
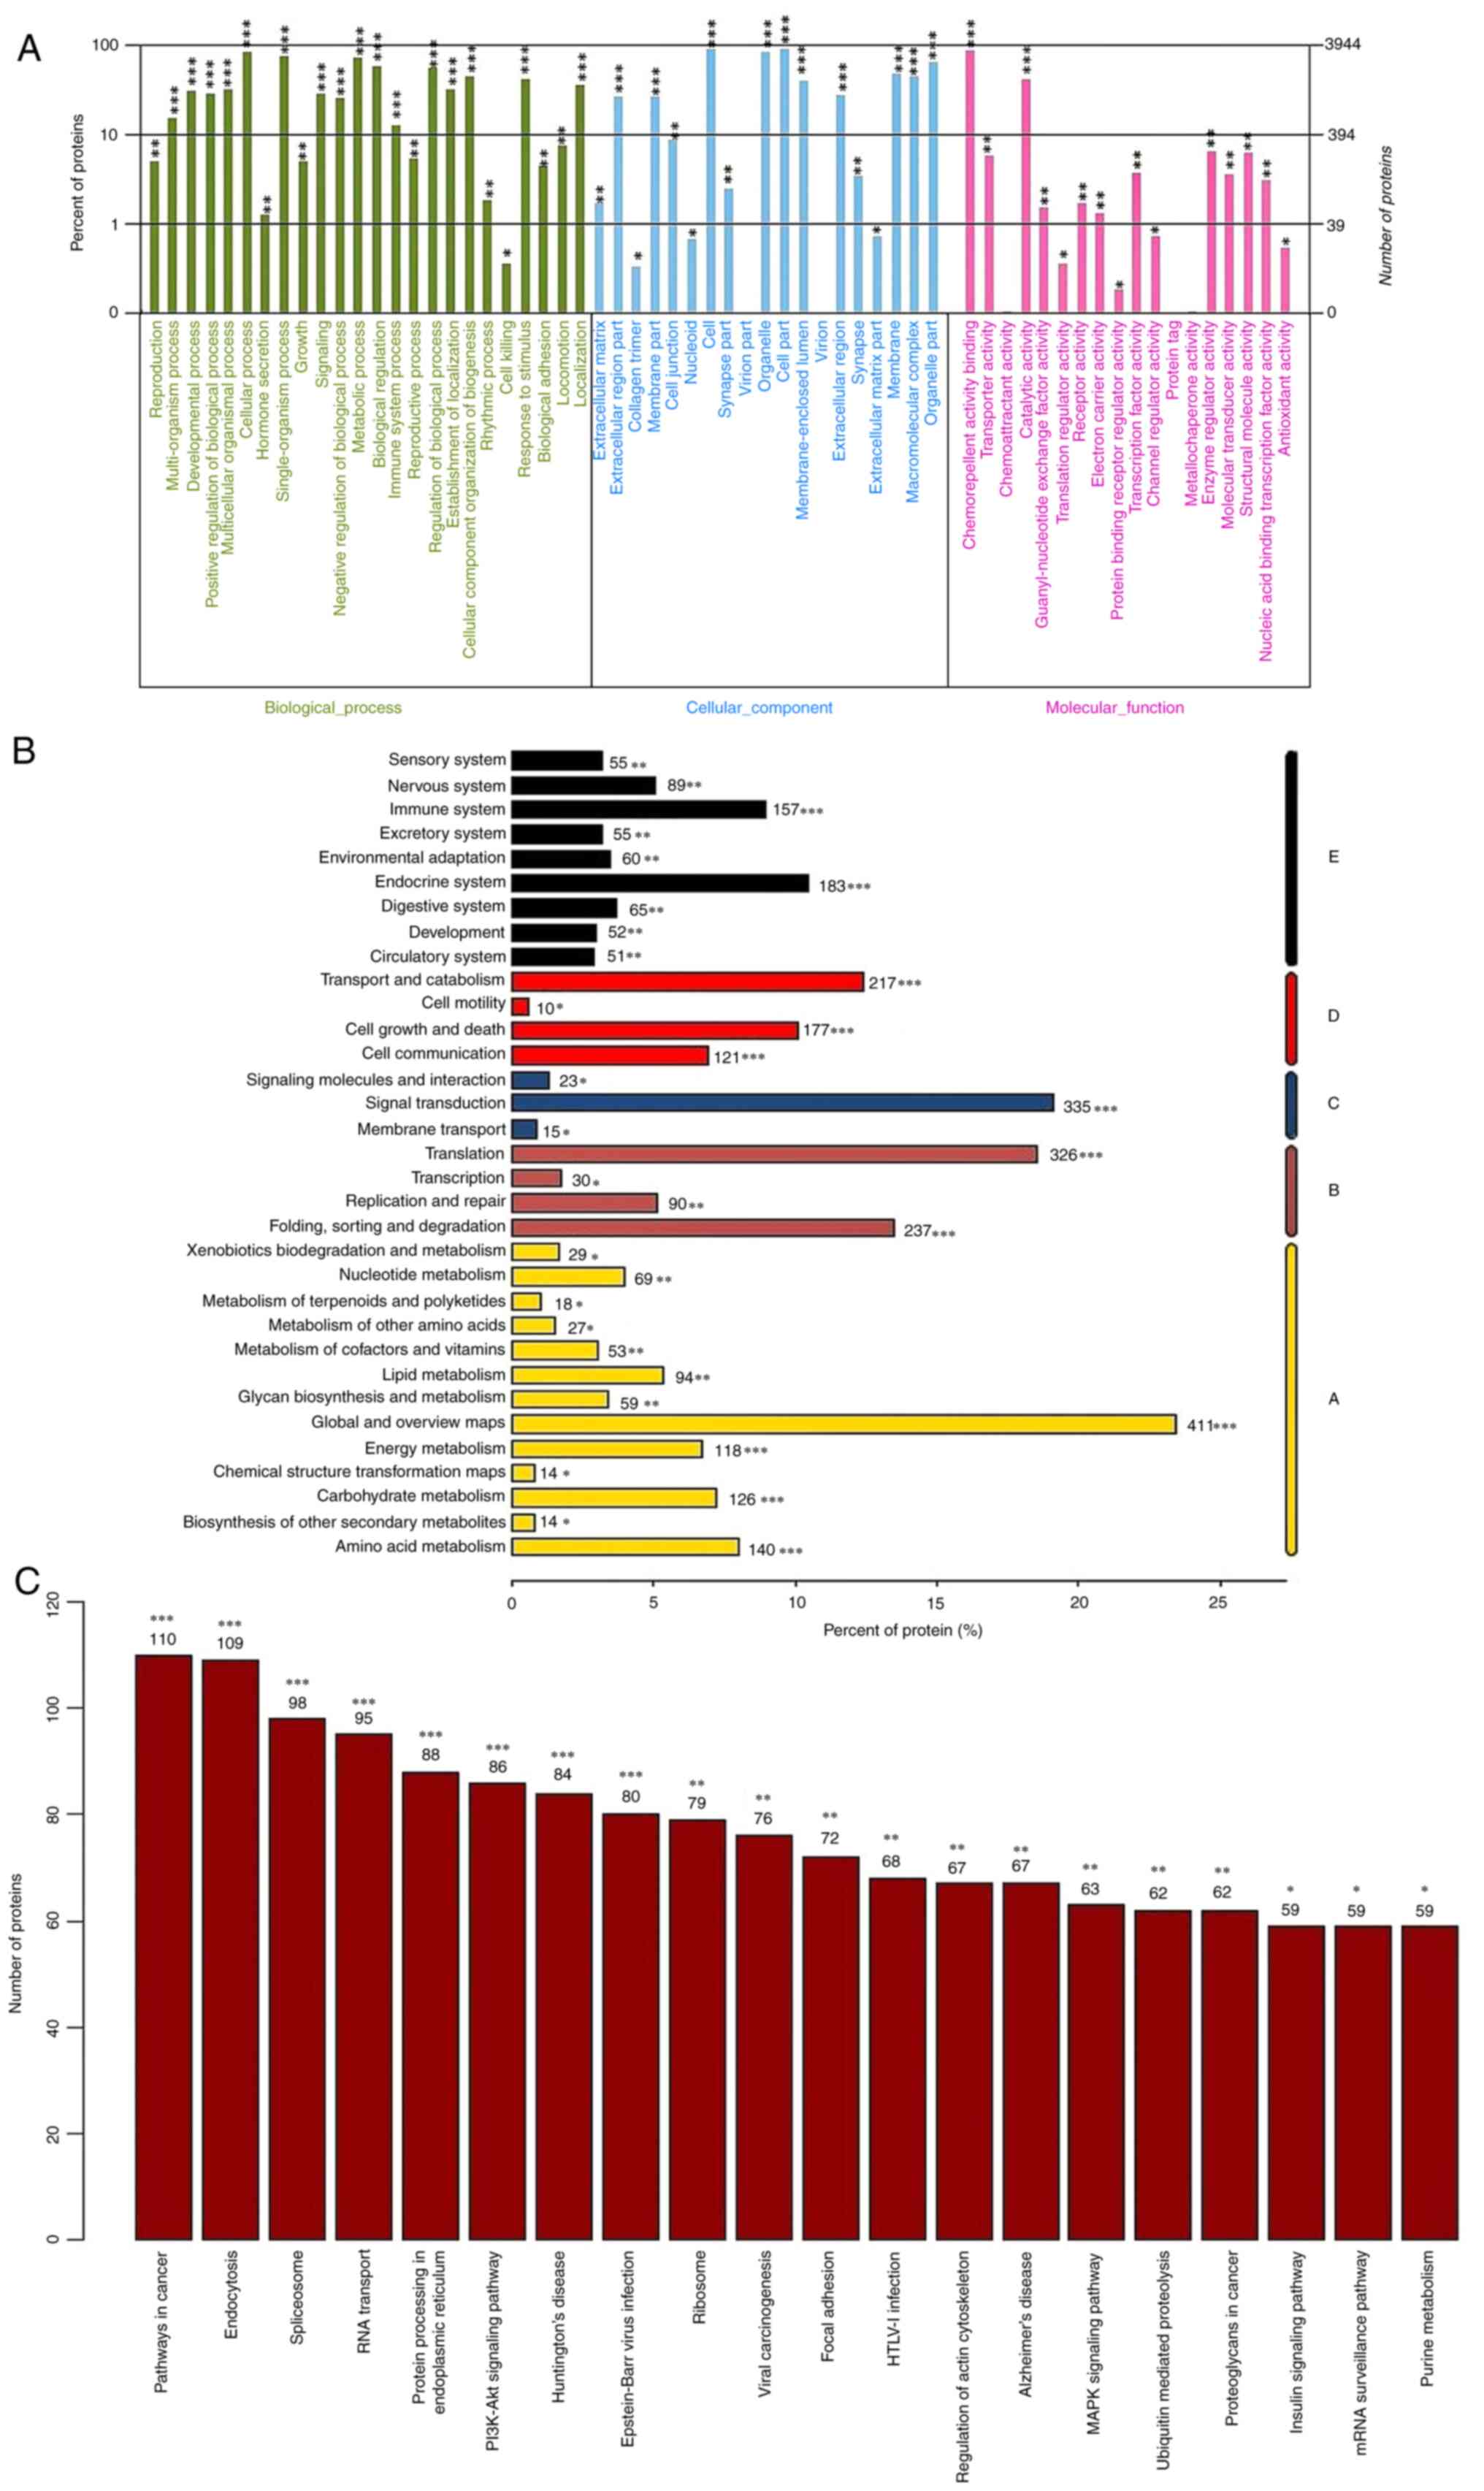 | Figure 1.Functional classification of all
annotated proteins associated with inhibitor of apoptosis
protein-like protein-2 in MCF-7 cells. (A) Proteins classified into
three main categories by Gene Ontology analysis, including
biological process, cellular component and molecular function. The
left y-axis indicates the percentage of a specific category of
proteins in that category. The right y-axis indicates the number of
proteins in the category. (B) Proteins were classified into five
main categories by KEGG analysis, including ‘metabolism’, ‘genetic
information processing’, ‘environmental information processing’,
‘cellular processes’ and ‘organismal systems’, indicated by A, B,
C, D and E on the y-axis, respectively. The x-axis indicates the
percentage of proteins within that specific category. (C) The
number of proteins in the top 20 pathways determined by KEGG
analysis. The y-axis indicates the number of proteins in the
category. *P<0.05, **P<0.01, ***P<0.001 vs. the NC group.
KEGG, Kyoto Encyclopedia of Genes and Genomes; NC, negative
control. |
Identification of DEPs in ILP-2 KD
MCF-7 cells
DEPs were identified between cells transfected with
siRNA-5 or NC siRNA clones. ILP-2-related proteins with dynamic
changes were analysed during MCF-7 cell proliferation. Therefore, a
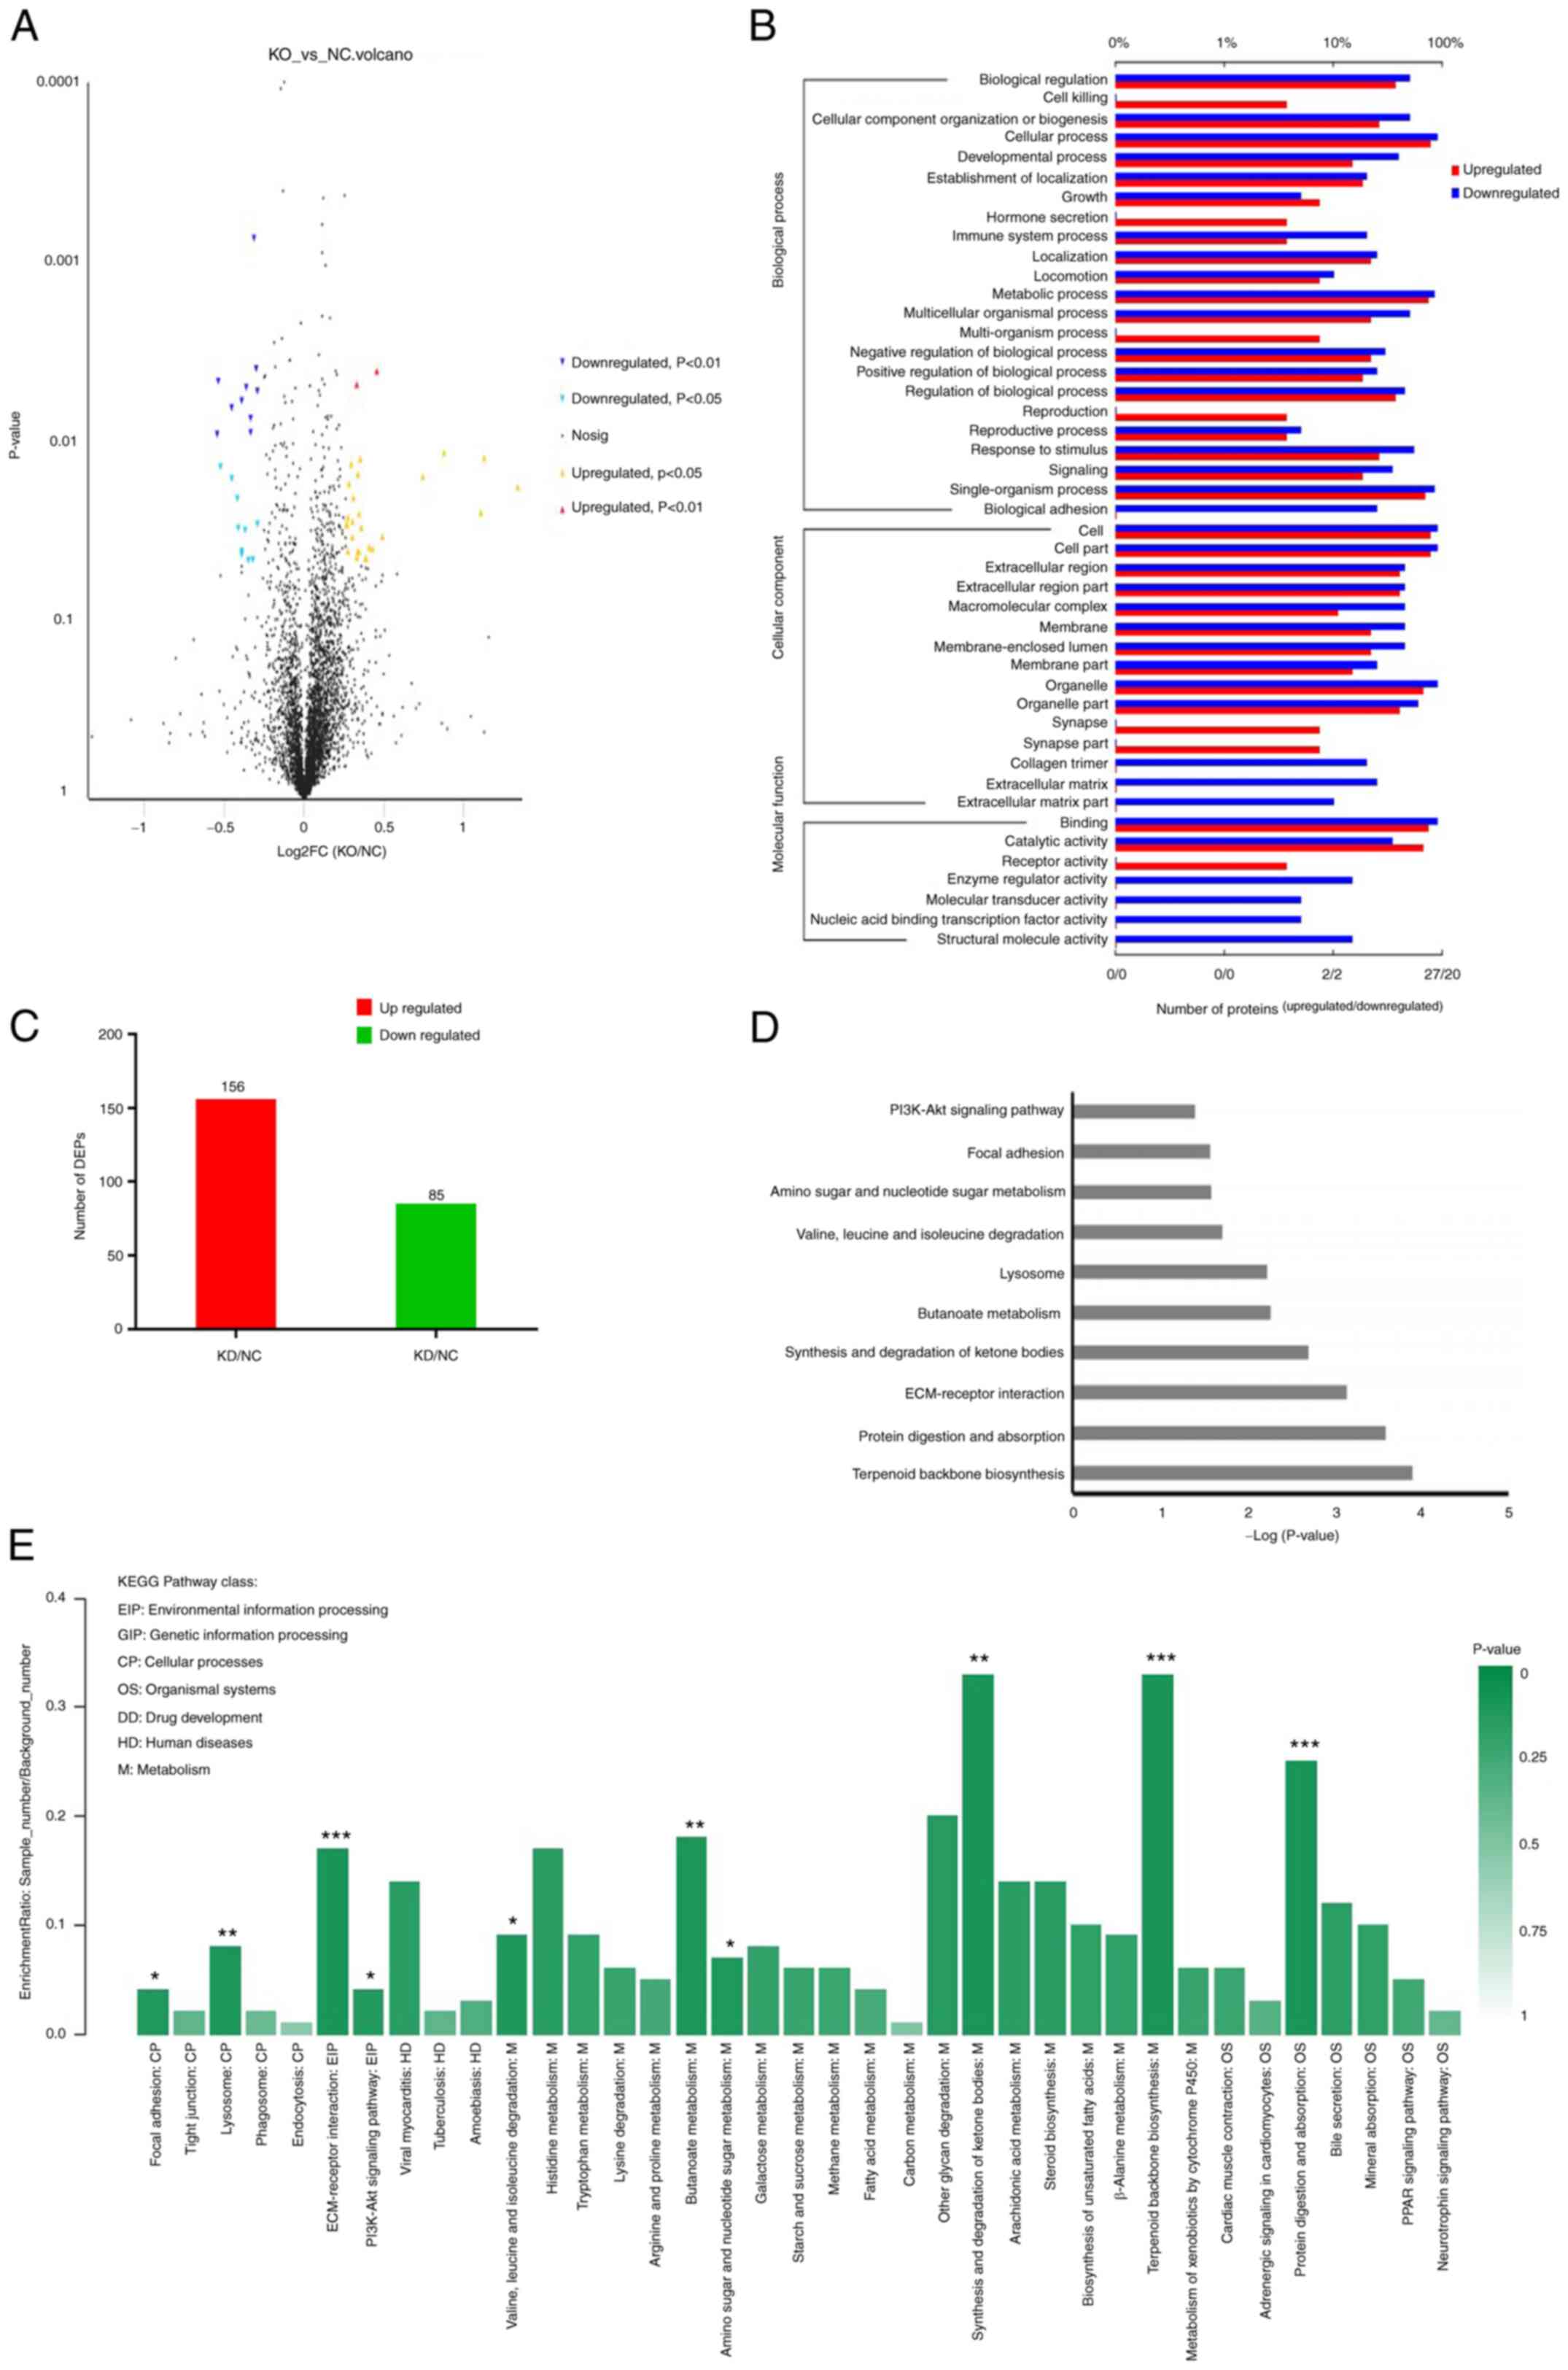
total of 241 DEPs (FC >1.20 or <0.83; P<0.05) were
identified between the siRNA-5 and NC groups (Fig. 2A-C). Among them, 156 proteins were
upregulated and 85 were downregulated (Fig. 2B and C). The top 5 DEPs are
selectively listed in Table III
based on the FC (KD vs. NC) and P-values (FC ≥1.66; P<0.05).
| Table III.Differentially expressed proteins in
the KD vs. NC group (fold-change ≥1.66, P<0.05, n=3). |
Table III.
Differentially expressed proteins in
the KD vs. NC group (fold-change ≥1.66, P<0.05, n=3).
|
|
| Protein expression
(ng/ml) |
|---|
|
|
|
|
|---|
| Accession
number | Gene symbol | NC | KD |
|---|
| Q9BYX7 | POTEKP | 1.01 | 2.53 |
| P04732 | MT1E | 1.07 | 2.33 |
| P20933 | AGA | 1.13 | 2.42 |
| P48775 | TDO2 | 1.01 | 1.85 |
| A0A0A0MTQ8 | CCDC175 | 1.08 | 1.80 |
Functional analysis of ILP-2-related
proteins in ILP-2 KD MCF-7 cells
To reveal any differences between biological
pathways, GO functional enrichment analysis was performed using the
DAVID online tool. Based on GO enrichment analysis, the 241 DEPs
were mainly enriched in the terms ‘terpenoid backbone
biosynthesis’, ‘protein digestion and absorption’, ‘ECM-receptor
interaction’, ‘synthesis and degradation of ketone bodies’ and
‘lysosomes’ (Fig. 2D). KEGG
pathway analysis revealed that the DEPs were significantly enriched
in ‘lysosome’, ‘ECM-receptor interaction’, ‘butanoate metabolism’,
‘synthesis and degradation of ketone bodies’, ‘terpenoid backbone
biosynthesis’ and ‘protein digestion and absorption’ (Fig. 2E).
Heatmap of DEPs in ILP-2 KD MCF-7
cells
hcluster was used to perform cluster analysis and
illustrate the expression patterns of the aforementioned DEPs (FC
≥1.20 or ≤0.83; P<0.05). Heatmap of DEPs revealed similar
expression patterns to KD and NC groups (Fig. 3A). Based on their expression
patterns, DEPs were grouped into 10 clusters (Fig. 3B). Some clusters exhibited an
overall upregulation pattern between the NC and KD groups,
including the sub-clusters 2, 3, 6, 7, 8, 9 and 10 (proteins, 1,
17, 2, 2, 4, 1 and 1, respectively). However, proteins in the
remaining clusters exhibited a downregulation expression pattern
between the NC and KD groups (sub-clusters, 1, 4 and 5; proteins,
10, 7 and 3, respectively). The analysed gene numbers were entered
into NCBI for matching to find the protein corresponding to the
gene (Table III). The final
screen identified proteins associated with tumour physiological
activity, including AGA, MT1E and TDO2 (Fig. 3A).
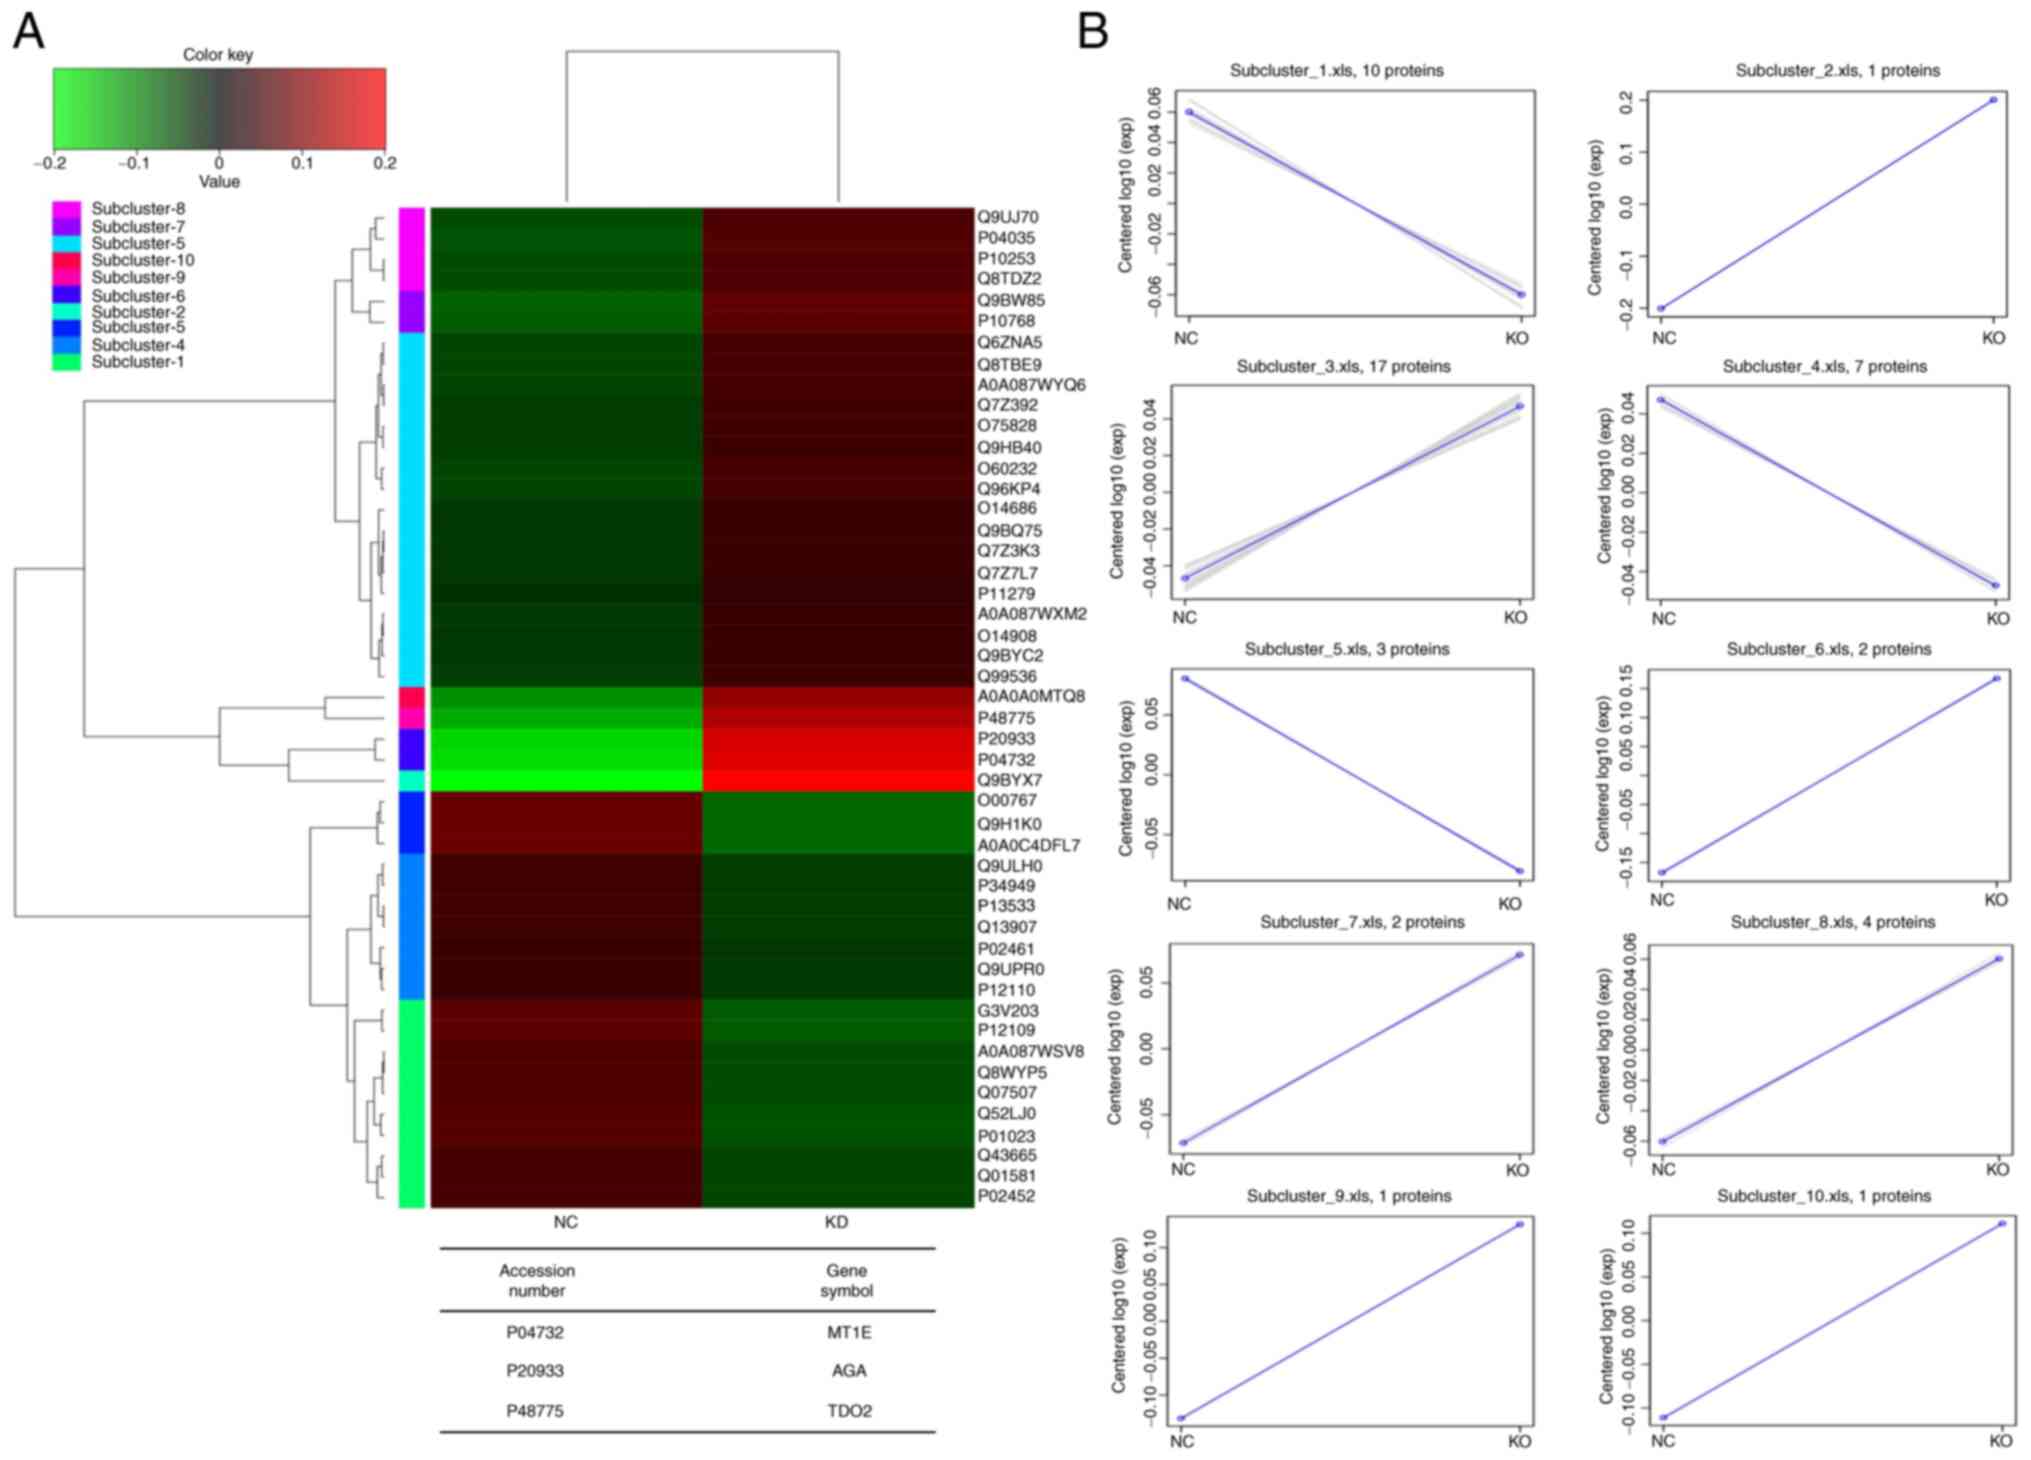 | Figure 3.Heatmap and clustering analysis of
the expression patterns of DEPs in the KD and NC groups. (A) The
heatmap of the DEPs. The table shows the differentially expressed
genes in the KD vs. NC group. (B) Sub-clusters 2, 3, 6, 7, 8, 9 and
10 (including 1, 17, 2, 2, 4, 1 and 1 proteins) were upregulated
from the NC group to the KD group; sub-clusters 1, 4 and 5
(including 10, 7 and 3 proteins) were downregulated from the NC
group to the KD group. DEP, differentially expressed protein; NC,
negative control; KD, knockdown; MT1E, metallothionein 1E; AGA,
N(4)-(β-N-acetylglucosaminyl)-L-asparaginase;
TDO2, tryptophan 2,3-dioxygenase. |
Western blotting and RT-qPCR analyses
of DEPs
Western blotting and RT-qPCR were performed to
validate the iTRAQ results on the mRNA and protein expression
levels of AGA, MT1E and TDO2 in ILP-2 KD MX-1 and MCF-7 cells.
ILP-2 KD was confirmed in both cell lines (Fig. 4A and H). The results showed that
the protein (Fig. 4A-D and H-K)
and mRNA (Fig. 4E-G and L-N)
expression levels of AGA, MT1E and TDO2 were significantly
increased in MX-1 and MCF-7 cells transfected with siRNA targeting
ILP-2 compared with in the NC group. ILP-2 overexpression was
confirmed in both cell lines (Fig. 5A
and E). By contrast, western blotting of ILP-2 overexpression
showed that the protein expression levels of AGA, MT1E and TDO2 in
MX-1 and MCF-7 cells were significantly reduced compared with in
the NC group (Fig. 5B-D and F-H).
These results were consistent with those obtained using the iTRAQ
technology, both suggesting that the expression levels of AGA, MT1E
and TDO2 were associated with the promotive effect of ILP-2 on
MCF-7 and MX-1 cell proliferation.
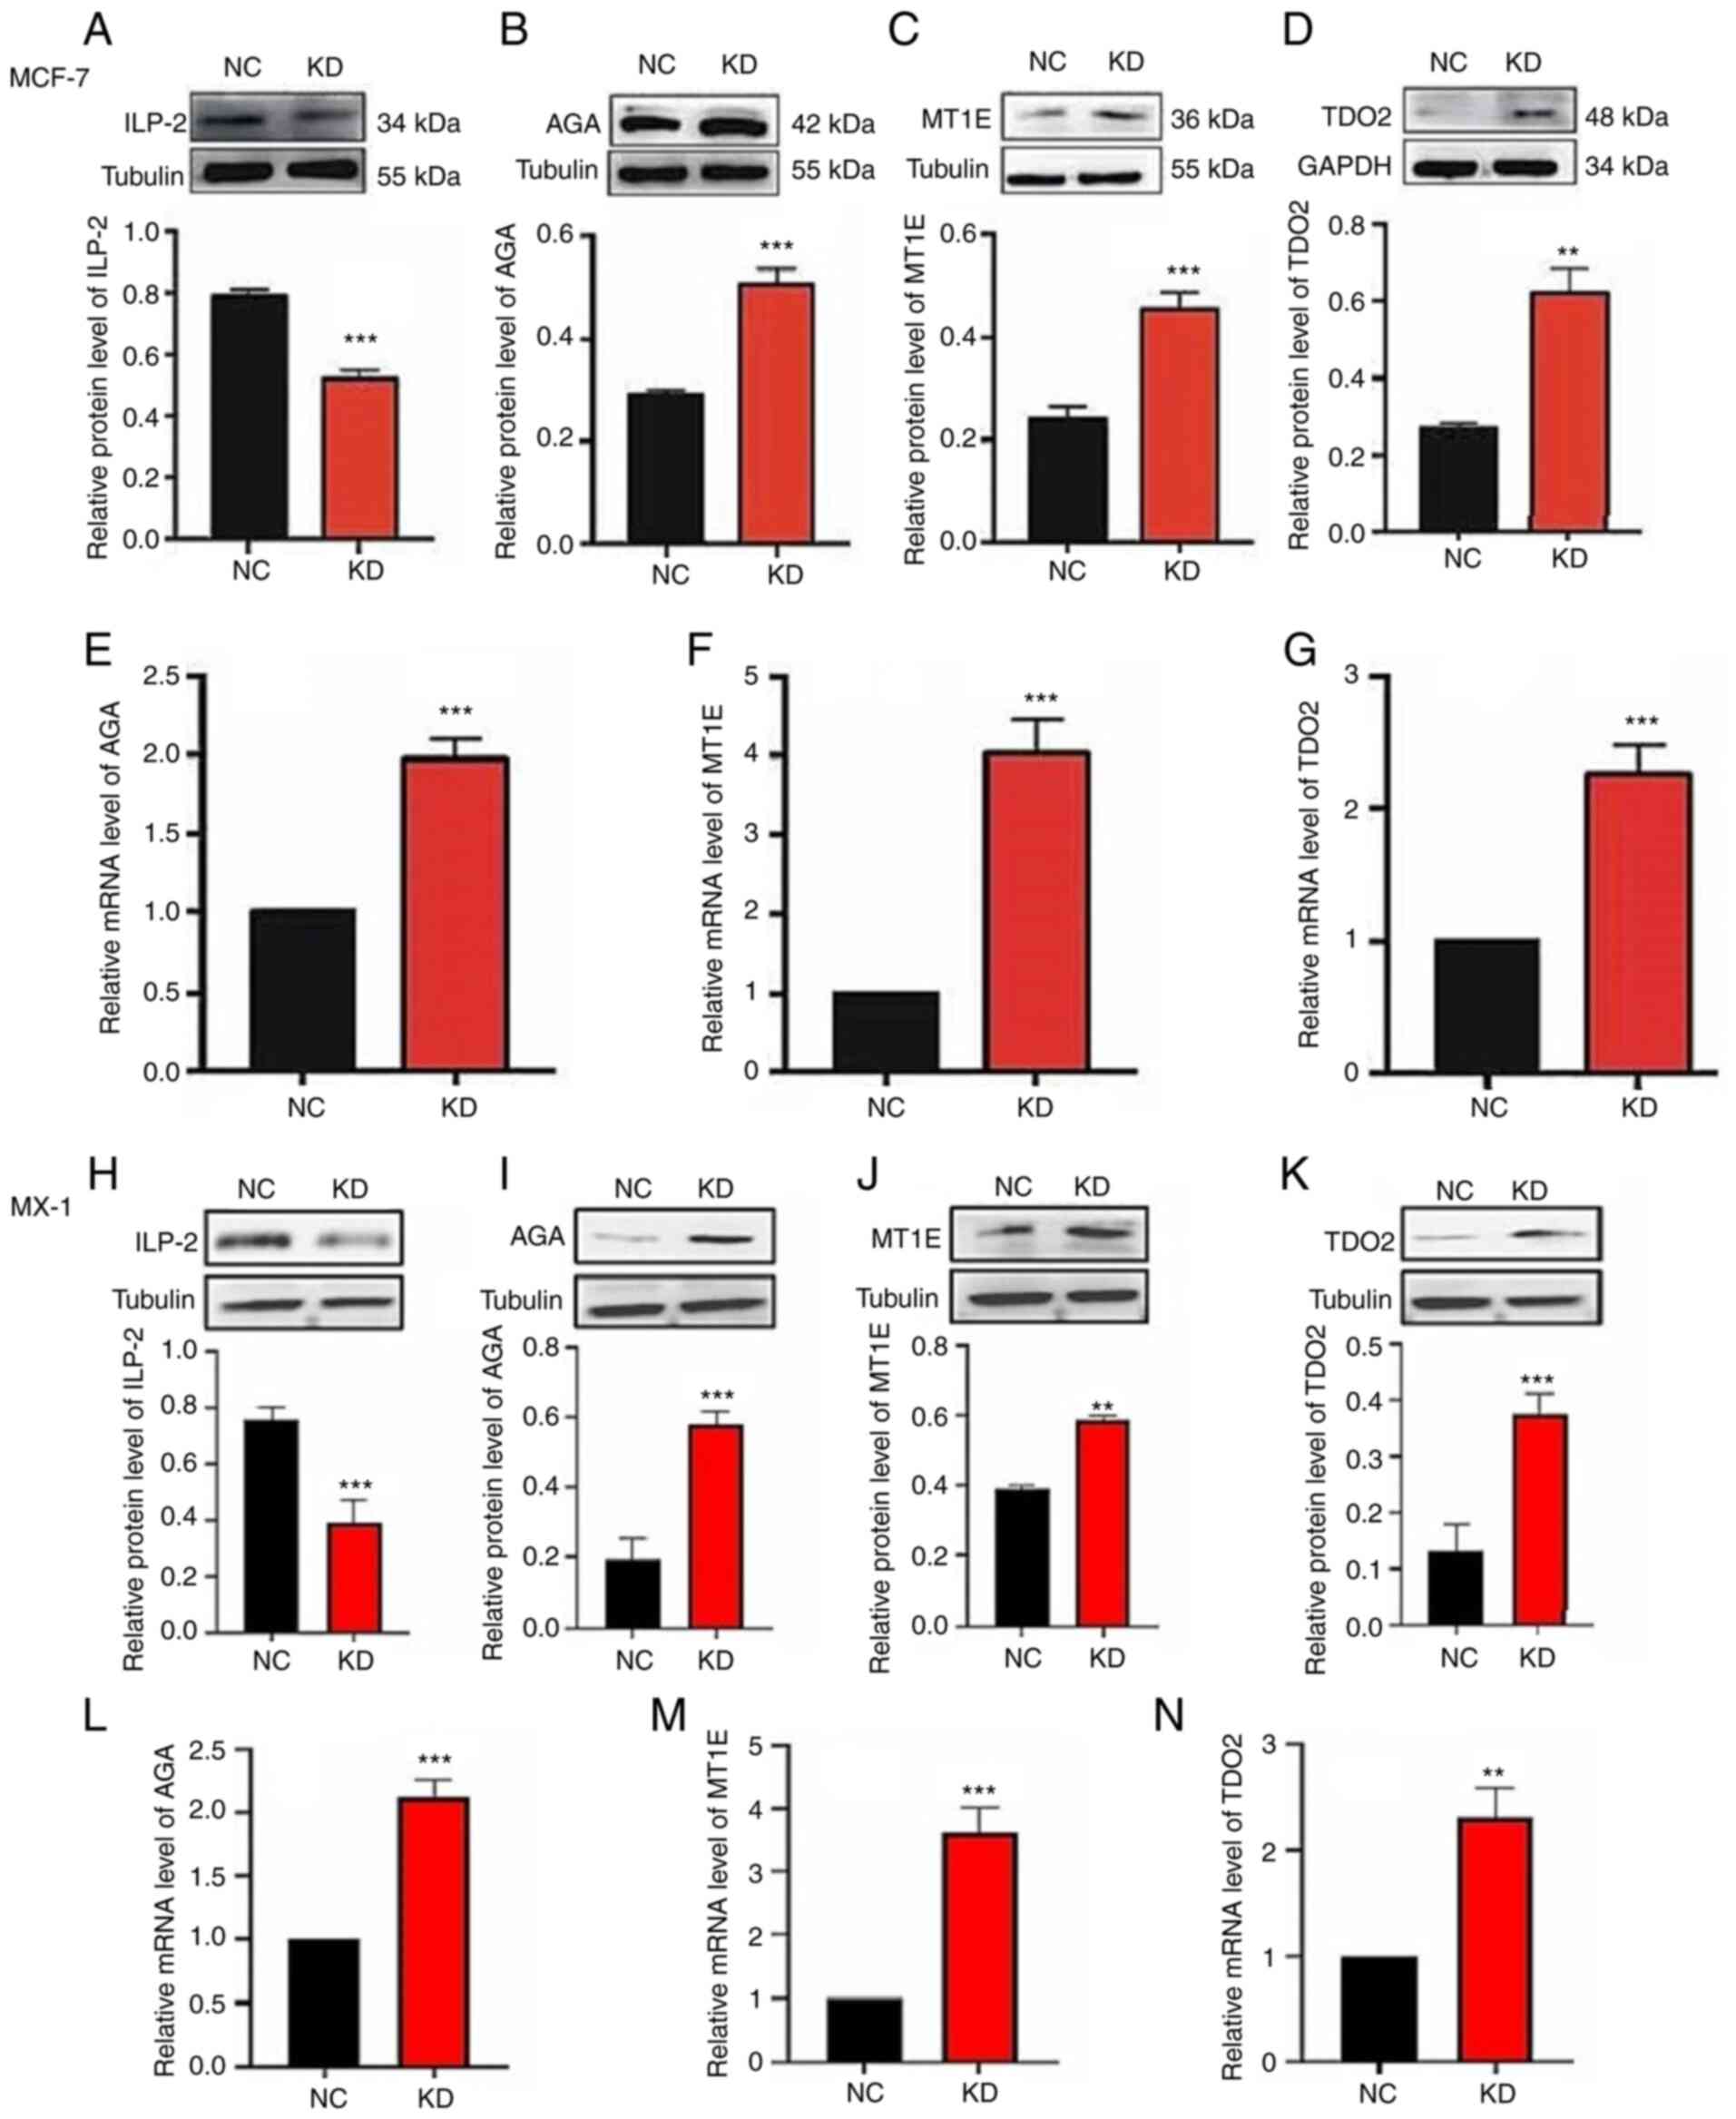 | Figure 4.Western blotting and RT-qPCR analyses
of the differentially expressed proteins in MCF-7 and MX-1 cells.
Knockdown efficiency of KD (siRNA-5) was confirmed via western
blotting in (A) MCF-7 and (H) MX-1 cells. Western blotting showed
that the relative protein expression levels of (B and I) AGA, (C
and J) MT1E and (D and K) TDO2 were increased when ILP-2 expression
was knocked down. Tubulin and GAPDH were used as reference
proteins. RT-qPCR analysis indicated that the relative mRNA
expression levels of (E and L) AGA, (F and M) MT1E
and (G and N) TDO2 were increased when ILP-2 expression was
knocked down. GAPDH was used as the reference gene. Data are
presented as the mean ± SEM and groups were compared with an
unpaired Student's t-test (n=3). **P<0.01, ***P<0.001 vs. the
NC group. RT-qPCR, reverse transcription-quantitative PCR; siRNA,
small interfering RNA; ILP-2, inhibitor of apoptosis protein-like
protein-2; MT1E, metallothionein 1E; AGA, N(4)-(β-N-acetylglucosaminyl)-L-asparaginase;
TDO2, tryptophan 2,3-dioxygenase; NC, negative control. |
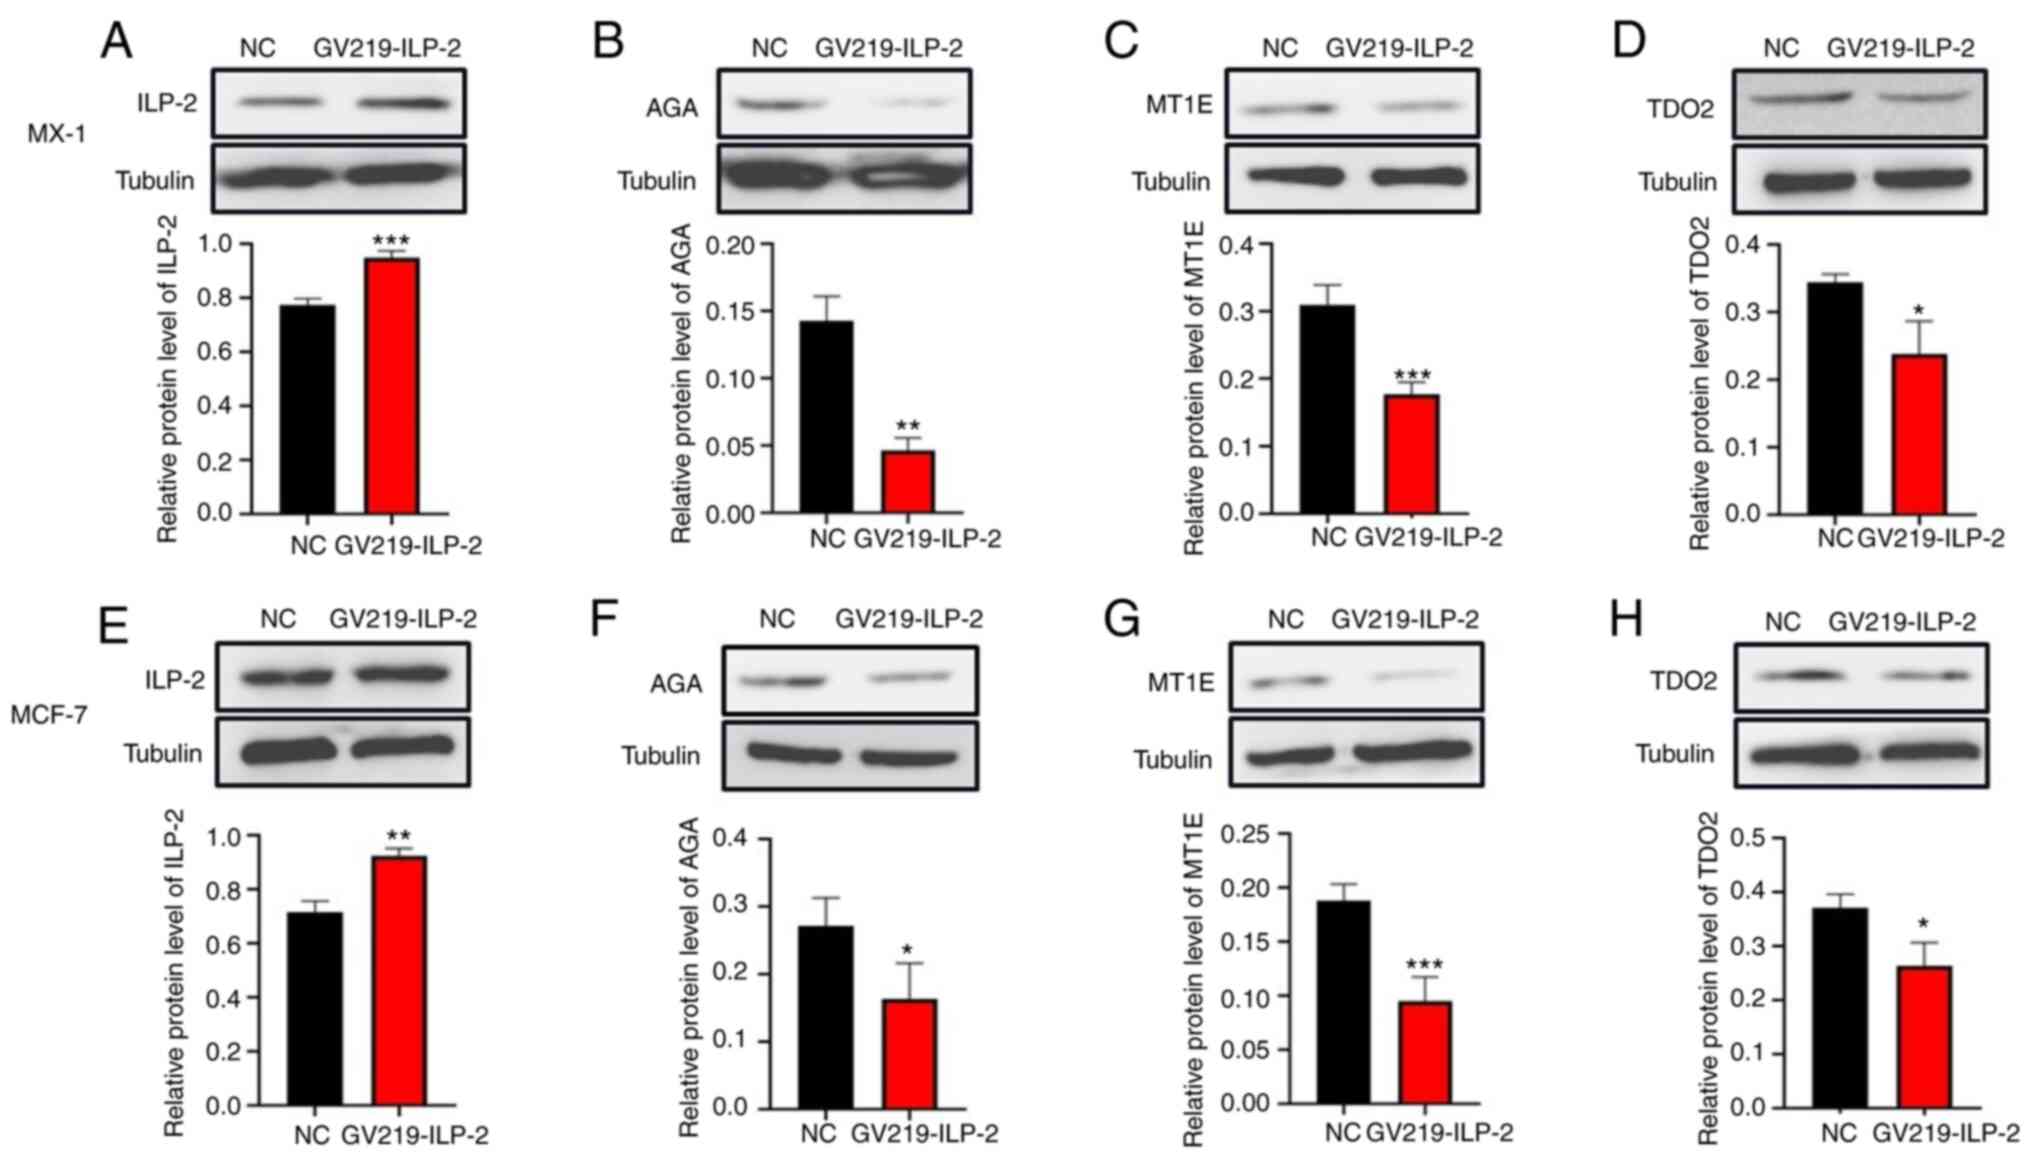 | Figure 5.Western blot analysis showed that the
relative protein expression levels of AGA, MT1E and TDO2 were
decreased when the protein expression of ILP-2 was overexpressed.
Tubulin was used as the reference protein. Western blot analysis of
(A and E) ILP-2, (B and F) AGA, (C and G) MT1E and (D and H) TDO2
in (A-D) MX-1 and (E-H) MCF-7 cells were decreased when ILP-2 was
overexpressed. Tubulin was used as a reference protein. Data are
presented as the mean ± SEM and groups were compared with an
unpaired Student's t-test (n=3). *P<0.05, **P<0.01,
***P<0.001 vs. the NC group. ILP-2, inhibitor of apoptosis
protein-like protein-2; MT1E, metallothionein 1E; AGA, N(4)-(β-N-acetylglucosaminyl)-L-asparaginase;
TDO2, tryptophan 2,3-dioxygenase; NC, negative control. |
Discussion
Breast cancer is a multifactorial, multistep and
heterogeneous disease caused by the uncontrolled proliferation of
breast epithelial cells in response to multiple oncogenic factors,
such as alcohol consumption, obesity and ageing (19). Although several high-risk factors
associated with the development of breast cancer have been
reported, the aetiology of the disease has not yet been fully
elucidated. The risk of developing breast cancer increases with the
accumulation of high-grade risk factors. Several biological
processes actively contribute to the development and growth of
breast cancer, including protein signalling and other complex
cellular biological processes (20–23).
In the present study, a total of 4,065 proteins were
identified in MCF-7 breast cancer cells using iTRAQ-based proteomic
analysis. The identified proteins were involved in several
biological processes, such as cellular process and metabolic
process, as well as immune system process. The iTRAQ-based
proteomic analysis also revealed that the ILP-2-mediated breast
cancer growth. A previous study demonstrated that the expression of
ILP-2 is increased in the serum of patients with breast cancer
(24). Additionally,
immunohistochemical and western blotting assays have shown that
ILP-2 is upregulated in breast cancer tissues, and in the breast
cancer cell lines MX-1, MCF-7 and HCC-1937 (25,26). These findings indicated that the
upregulated expression of ILP-2 in breast cells could be a
significant high-risk factor for the development of breast cancer.
Nevertheless, the occurrence of breast cancer is not induced by a
single risk factor, but is often the result of the synergistic
effect of multiple high-risk factors.
To further investigate the effect of ILP-2-related
proteins on breast cancer development and progression in the
current study, ILP-2 was silenced in MCF-7 cells via cell
transfection with corresponding siRNA sequences. Subsequently, the
changes in the expression levels of ILP-2-related proteins were
determined. The results showed that 241 proteins were
differentially expressed between the ILP-2 KD and control groups.
DEPs were significantly enriched in pathways associated with
‘lysosome’, ‘ECM-receptor interaction’ and ‘butanoate metabolism’.
Furthermore, the results revealed that AGA, MT1E and TDO2 were
markedly associated with ILP-2. It has been reported that breast
cancer progression is associated with cell proliferation, signal
transduction and regulation of the immune system (27,28).
In our previous study, silencing assays showed that
ILP-2 KD attenuated the proliferation and promoted the apoptosis of
MCF-7 and MX-1 breast cancer cells, thus highlighting the effect of
ILP-2 on regulating the survival of breast cancer cells.
Furthermore, this previous study found the siRNA-5 had a higher KD
efficiency on ILP-2 than siRNA-3; therefore, siRNA-5 was applied to
knock down ILP-2 in the present study. In addition, ILP-2 silencing
inhibited breast cancer cell migration, thus indicating that ILP-2
was not only involved in maintaining breast cancer cell survival,
but could also enhance the migratory ability of breast cancer cells
(7). The aforementioned findings
suggested that the increased expression of ILP-2 in breast cancer
cells could enhance the ability of cells to escape apoptosis, and
promote cell proliferation and invasion through different
biological processes.
To further identify the high-risk factors that
promote breast cancer progression synergistically with ILP-2, ILP-2
was knocked down in MCF-7 and MX-1 cells via cell transfection with
the corresponding siRNA sequences. Both western blotting and
RT-qPCR analysis supported that MT1E, TDO2 and AGA could serve a
significant role in breast cancer progression. Previous studies
have demonstrated that MT1E upregulation predicted poor prognosis
in patients with breast cancer (29,30). Furthermore, TDO2 has been found to
promote breast cancer cell migration (31,32), while mutations in the AGA
gene have been reported to induce the occurrence of lysosomal
storage diseases, such as aspartylglucosaminuria (33,34). In the present study, the results
of the proteomic analysis revealed that ILP-2 knockdown in breast
cancer cells. Additionally, AGA, MT1E and TDO2 were notably
upregulated in ILP-2-KD breast cancer cells. Therefore, it was
hypothesized that ILP-2 upregulation-mediated breast carcinogenesis
could result from the synergistic effect of various high-risk
factors, including AGA, MT1E and TDO2. Overall, elevated ILP-2 may
cooperate with other proteins, such as AGA, MT1E and TDO2, to
inhibit apoptosis and promote the proliferation and invasion of
breast cancer cells. However, the current results only indicated
that the ILP-2 protein is closely associated with the AGA, MT1E and
TDO2 proteins; however, direct evidence of a definite
protein-protein interaction between them was not identified, which
is something to investigate further in the future.
The aforementioned findings were verified in MCF-7
and MX-1 breast cancer cells following ILP-2 overexpression. The
results showed that the expression levels of AGA, MT1E and TDO2
were significantly decreased in ILP-2-overexpressing breast cancer
cells. Therefore, the co-expression pattern of AGA, MT1E and TDO2
with ILP-2 could provide novel insights into the association
between ILP-2 expression and breast cancer cell proliferation.
Additionally, the results suggested that the aforementioned ILP-2
could be involved in the proliferation and growth of breast cancer
cells, signal transduction and immune system regulation. It was
therefore indicated that ILP-2 may exert a significant effect on
regulating the development of breast cancer, while its dysregulated
expression in cells could be a key event, eventually leading to
breast cancer.
In summary, the current study suggested that ILP-2
could play a significant role in breast cancer cell proliferation
and its function could be closely associated with the expression of
AGA, MT1E and TDO2, three potential key factors in various
regulatory pathways. However, more studies are needed to further
explore the mechanism underlying the effect of ILP-2 on breast
cancer with emphasis on the prominent proteins implicated. We are
also currently intervening in ILP-2 expression by designing
ILP-2-targeting drugs and also testing the associated prognosis;
these will also be one of the focuses of our future work.
Acknowledgements
The authors would like to thank Dr Benson O.A.
Botchway and Akhileshwar Namani, (both from Zhejiang University
School of Medicine), Dr Hanmeng (Ningbo University), Dr Mridul Roy
(Jishou University School of Medicine) and Dr Wei Zhou (Hunan
Agricultural University) for critically revising the manuscript.
Furthermore, the authors would like to thank Dr Dan Dan He
(Shanghai Majorbio Bio-Pharm Technology Co., Ltd.) for their
instruction regarding the experimental study.
Funding
This study was supported by the National Natural Science
Foundation of China (grant no. 81360397), Hunan Provincial Natural
Science Foundation of China (grant no. 2020JJ4513) and Scientific
Research Foundation of Hunan Provincial Education Department of
China (grant no. 19A400).
Availability of data and materials
The datasets generated and/or analyzed during the
current study are available in the iProX repository, https://www.iprox.cn/page/PSV023.html;?url=1637641893490Nyef
and https://www.iprox.cn/page/PSV023.html;?url=1640500832317IEB0
(password, deZn).
Authors' contributions
SX and ZZ confirm the authenticity of all the raw
data. SX cultured cell lines, performed proteomic sample
preparation, interpreted data and drafted the manuscript. LZ
contributed to drafting the revised manuscript and interpreted
data. ZZ performed the bioinformatics analysis and drafted the
manuscript. SW performed western blotting. RC participated in
experimental design and critically revised the manuscript. MX
designed the study, and drafted and critically revised the
manuscript. All authors have read and approved the final
manuscript.
Ethics approval and consent to
participate
Not applicable.
Patient consent for publication
Not applicable.
Competing interests
The authors declare that they have no competing
interests.
References
|
1
|
Kimball CC, Nichols CI and Vose JG: The
payer and patient cost burden of open breast conserving procedures
following percutaneous breast biopsy. Breast Cancer (Auckl).
12:11782234187777662018.PubMed/NCBI
|
|
2
|
Sung H, Ferlay J, Siegel RL, Laversanne M,
Soerjomataram I, Jemal A and Bray F: Global cancer statistics 2020:
GLOBOCAN estimates of incidence and mortality worldwide for 36
cancers in 185 countries. CA Cancer J Clin. 71:209–249. 2021.
View Article : Google Scholar : PubMed/NCBI
|
|
3
|
Al-Darwish AA, Al-Naim AF, Al-Mulhim KS,
Al-Otaibi NK, Morsi MS and Aleem AM: Knowledge about cervical
cancer early warning signs and symptoms, risk factors and
vaccination among students at a medical school in Al-Ahsa, Kingdom
of Saudi Arabia. Asian Pac J Cancer Prev. 15:2529–2532. 2014.
View Article : Google Scholar : PubMed/NCBI
|
|
4
|
Thomas KH and Ramirez RA: Leptomeningeal
disease and the evolving role of molecular targeted therapy and
immunotherapy. Ochsner J. 17:362–378. 2017.PubMed/NCBI
|
|
5
|
Costa RLB, Han HS and Gradishar WJ:
Targeting the PI3K/AKT/mTOR pathway in triple-negative breast
cancer: A review. Breast Cancer Res Treat. 169:397–406. 2018.
View Article : Google Scholar : PubMed/NCBI
|
|
6
|
Qing L and Qing W: Development of
epidermal growth factor receptor targeted therapy in pancreatic
cancer. Minerva Chir. 73:488–496. 2018. View Article : Google Scholar : PubMed/NCBI
|
|
7
|
Zhu L, Zhou W, Zhu X, Xiang S, Wang S,
Peng Y, Lu B, Tang P, Chen Q, Wu M, et al: Inhibitor of apoptosis
protein-like protein-2: A novel growth accelerator for breast
cancer cells. Oncol Rep. 40:2047–2055. 2018.PubMed/NCBI
|
|
8
|
Xiang M, Zhou W, Gao D, Fang X and Liu Q:
Inhibitor of apoptosis protein-like protein-2 as a novel
serological biomarker for breast cancer. Int J Mol Sci.
13:16737–16750. 2012. View Article : Google Scholar : PubMed/NCBI
|
|
9
|
Ouyang H, Wang Z, Chen X, Yu J, Li Z and
Nie Q: Proteomic analysis of chicken skeletal muscle during
embryonic development. Front Physiol. 8:2812017. View Article : Google Scholar : PubMed/NCBI
|
|
10
|
Campos JM, Neves LX, de Paiva NC, de
Oliveira E Castro RA, Casé AH, Carneiro CM, Andrade MH and
Castro-Borges W: Understanding global changes of the liver proteome
during murine schistosomiasis using a label-free shotgun approach.
J Proteomics. 151:193–203. 2017. View Article : Google Scholar : PubMed/NCBI
|
|
11
|
Liu J, Liu Z, Chen L and Zhang H:
iTRAQ-based proteomic analysis reveals alterations in the liver
induced by restricted meal frequency in a pig model. Nutrition.
32:871–876. 2016. View Article : Google Scholar : PubMed/NCBI
|
|
12
|
Minjarez B, Calderón-González KG,
Rustarazo ML, Herrera-Aguirre ME, Labra-Barrios ML, Rincon-Limas
DE, Del Pino MM, Mena R and Luna-Arias JP: Identification of
proteins that are differentially expressed in brains with
Alzheimer's disease using iTRAQ labeling and tandem mass
spectrometry. J Proteomics. 139:103–121. 2016. View Article : Google Scholar : PubMed/NCBI
|
|
13
|
Liu YC, Ma WH, Ge YL, Xue ML, Zhang Z,
Zhang JY, Hou L and Mu RH: RNAi-mediated gene silencing of vascular
endothelial growth factor C suppresses growth and induces apoptosis
in mouse breast cancer in vitro and in vivo. Oncol Lett.
12:3896–3904. 2016. View Article : Google Scholar : PubMed/NCBI
|
|
14
|
Yan F, Wang X, Zhu M and Hu X:
RNAi-mediated downregulation of cyclin Y to attenuate human breast
cancer cell growth. Oncol Rep. 36:2793–2799. 2016. View Article : Google Scholar : PubMed/NCBI
|
|
15
|
Wang X, Li Y, Xu G, Liu M, Xue L, Liu L,
Hu S, Zhang Y, Nie Y, Liang S, et al: Mechanism study of peptide
GMBP1 and its receptor GRP78 in modulating gastric cancer MDR by
iTRAQ-based proteomic analysis. BMC Cancer. 15:3582015. View Article : Google Scholar : PubMed/NCBI
|
|
16
|
Lu ZM, Zhu Q, Li HX, Geng Y, Shi JS and Xu
ZH: Vanillin promotes the germination of antrodia camphorata
arthroconidia through PKA and MAPK signaling pathways. Front
Microbiol. 8:20482017. View Article : Google Scholar : PubMed/NCBI
|
|
17
|
Szklarczyk D, Franceschini A, Wyder S,
Forslund K, Heller D, Huerta-Cepas J, Simonovic M, Roth A, Santos
A, Tsafou KP, et al: STRING v10: Protein-protein interaction
networks, integrated over the tree of life. Nucleic Acids Res.
43:(Database Issue). D447–D452. 2015. View Article : Google Scholar : PubMed/NCBI
|
|
18
|
Livak KJ and Schmittgen TD: Analysis of
relative gene expression data using real-time quantitative PCR and
the 2(−Delta Delta C(T)) method. Methods. 25:402–408. 2001.
View Article : Google Scholar : PubMed/NCBI
|
|
19
|
Ju J, Zhu AJ and Yuan P: Progress in
targeted therapy for breast cancer. Chronic Dis Transl Med.
4:164–175. 2018.PubMed/NCBI
|
|
20
|
Jitariu AA, Raica M, Cîmpean AM and Suciu
SC: The role of PDGF-B/PDGFR-BETA axis in the normal development
and carcinogenesis of the breast. Crit Rev Oncol Hematol.
131:46–52. 2018. View Article : Google Scholar : PubMed/NCBI
|
|
21
|
Zoi I, Karamouzis MV, Adamopoulos C and
Papavassiliou AG: RANKL signaling and ErbB receptors in breast
carcinogenesis. Trends Mol Med. 22:839–850. 2016. View Article : Google Scholar : PubMed/NCBI
|
|
22
|
Jana S, Sengupta S, Biswas S, Chatterjee
A, Roy H and Bhattacharyya A: miR-216b suppresses breast cancer
growth and metastasis by targeting SDCBP. Biochem Biophys Res
Commun. 482:126–133. 2017. View Article : Google Scholar : PubMed/NCBI
|
|
23
|
Wang Y, Zhou J, Wang Z, Wang P and Li S:
Upregulation of SOX2 activated LncRNA PVT1 expression promotes
breast cancer cell growth and invasion. Biochem Biophys Res Commun.
493:429–436. 2017. View Article : Google Scholar : PubMed/NCBI
|
|
24
|
Stricker TP, Brown CD, Bandlamudi C,
McNerney M, Kittler R, Montoya V, Peterson A, Grossman R and White
KP: Robust stratification of breast cancer subtypes using
differential patterns of transcript isoform expression. PLoS Genet.
13:e10065892017. View Article : Google Scholar : PubMed/NCBI
|
|
25
|
Shi Y, Yang F, Sun Z, Zhang W, Gu J and
Guan X: Differential microRNA expression is associated with
androgen receptor expression in breast cancer. Mol Med Rep.
15:29–36. 2017. View Article : Google Scholar : PubMed/NCBI
|
|
26
|
Finn RS, Dering J, Conklin D, Kalous O,
Cohen DJ, Desai AJ, Ginther C, Atefi M, Chen I, Fowst C, et al: PD
0332991, a selective cyclin D kinase 4/6 inhibitor, preferentially
inhibits proliferation of luminal estrogen receptor-positive human
breast cancer cell lines in vitro. Breast Cancer Res. 11:R772009.
View Article : Google Scholar : PubMed/NCBI
|
|
27
|
Stavik B, Skretting G, Olstad OK, Sletten
M, Dehli Vigeland M, Sandset PM and Iversen N: TFPI alpha and beta
regulate mRNAs and microRNAs involved in cancer biology and in the
immune system in breast cancer cells. PLoS One. 7:e47184. 2012.
View Article : Google Scholar : PubMed/NCBI
|
|
28
|
Vences-Catalán F, Duault C, Kuo CC,
Rajapaksa R, Levy R and Levy S: CD81 as a tumor target. Biochem Soc
Trans. 45:531–535. 2017. View Article : Google Scholar : PubMed/NCBI
|
|
29
|
Gurel V, Sens DA, Somji S, Garrett SH,
Weiland T and Sens MA: Post-transcriptional regulation of
metallothionein isoform 1 and 2 expression in the human breast and
the MCF-10A cell line. Toxicol Sci. 85:906–915. 2005. View Article : Google Scholar : PubMed/NCBI
|
|
30
|
Tai SK, Tan OJ, Chow VT, Jin R, Jones JL,
Tan PH, Jayasurya A and Bay BH: Differential expression of
metallothionein 1 and 2 isoforms in breast cancer lines with
different invasive potential: Identification of a novel nonsilent
metallothionein-1H mutant variant. Am J Pathol. 163:2009–2019.
2003. View Article : Google Scholar : PubMed/NCBI
|
|
31
|
Novikov O, Wang Z, Stanford EA, Parks AJ,
Ramirez-Cardenas A, Landesman E, Laklouk I, Sarita-Reyes C,
Gusenleitner D, Li A, et al: An Aryl hydrocarbon receptor-mediated
amplification loop that enforces cell migration in
ER-/PR-/Her2-human breast cancer cells. Mol Pharmacol. 90:674–688.
2016. View Article : Google Scholar : PubMed/NCBI
|
|
32
|
D'Amato NC, Rogers TJ, Gordon MA, Greene
LI, Cochrane DR, Spoelstra NS, Nemkov TG, D'Alessandro A, Hansen KC
and Richer JK: A TDO2-AhR signaling axis facilitates anoikis
resistance and metastasis in triple-negative breast cancer. Cancer
Res. 75:4651–4664. 2015. View Article : Google Scholar : PubMed/NCBI
|
|
33
|
Saarela J, von Schantz C, Peltonen L and
Jalanko A: A novel aspartylglucosaminuria mutation affects
translocation of aspartylglucosaminidase. Hum Mutat. 24:350–351.
2004. View Article : Google Scholar : PubMed/NCBI
|
|
34
|
Saarela J, Oinonen C, Jalanko A, Rouvinen
J and Peltonen L: Autoproteolytic activation of human
aspartylglucosaminidase. Biochem J. 378:363–371. 2004. View Article : Google Scholar : PubMed/NCBI
|