Introduction
With the improvement of living standards, the
occurrence of metabolic diseases, such as diabetes, is increasing.
Diabetes is a multifactorial and chronic disease that occurs when
the body cannot produce enough insulin or use insulin effectively,
resulting in elevated blood glucose levels (1). Type-2 diabetes mellitus (T2DM) is a
common type of diabetes. Hyperglycemia is the result of insulin
resistance and pancreatic β-cell dysfunction (2). Pancreatic β-cells respond to
increased blood glucose levels by secreting insulin; however, in
T2DM, there is a loss of β-cells (3). DeFronzo et al (4) showed that β-cell function was
reduced by >80% in patients with impaired glucose tolerance and
was decreased further in patients with T2DM. Regulation of β-cell
mass occurs by balancing the formation of new β-cells and the loss
of β-cells (5). Butler et
al (6) reported that β-cell
apoptosis was increased in T2DM, which may cause β-cell
dysfunction.
Hyperbaric oxygen therapy (HBOT) is the process by
which a patient or animal receives 100% oxygen at pressures >1
atmosphere. HBOT has been used to successfully treat numerous
conditions, including carbon monoxide poisoning, ischemia,
infections and wounds (7). As for
wound care, HBOT can accelerate diabetic foot ulcer healing in
patients with diabetes mellitus by increasing oxygen dispersion to
damaged tissues, alleviating inflammation and suppressing the
growth of anaerobic bacteria (8,9).
In patients with diabetic foot, HBOT has also been shown to have
beneficial effects on glycemic control (8). Moreover, HBOT reduces fasting blood
glucose levels and increased insulin sensitivity (10,11). In T2DM, the mechanism involves
increased skeletal muscle oxidative capacity (12). Our previous study demonstrated
that HBOT improved insulin sensitivity by activating Akt protein
phosphorylation to promote glucose transporter type 4 (GLUT4)
expression in T2DM, resulting in reduced blood glucose levels
(13).
However, the effects of HBOT on β-cell function have
not been fully studied. Although islet cells account for a small
amount of the total weight of the pancreas, they consume ~10% of
the total pancreatic blood flow (14). As HBOT increases oxygen content in
the blood flow, the present study aimed to investigate whether HBOT
could ameliorate insulin resistance by acting on β-cells.
Materials and methods
Animals and food
Adult male C57BL/6J mice (age, 6 weeks; weight,
15–18 g) were obtained from Qingdao Institute Food and Drug Control
and housed in standard rodent cages. Animals were housed in a
temperature-controlled (23±2°C) and humidity-controlled (55±20%)
animal room (illumination from 7:00 to 19:00) with free access to
standard food and tap water for at least 1 week to adapt to their
surroundings. The experimental protocols were approved by the
Qingdao University Animal Care and Use Committee and Animal Welfare
Committee (approval no. QYFY WzLL26594).
After 1 week of acclimatization, the 7-week-old mice
were fed a high-fat-diet (HFD) consisting of 59% basic mice feed,
20% sugar, 18% lard and 3% egg yolk.
Experimental groups and HBOT
The 24 adult male C57BL/6J mice were randomly
divided into the following four groups: i) HFD (n=4); ii) HFD+HBOT
(n=4); iii) T2DM (n=8); and iv) T2DM+HBOT (n=8). Following the
contrast principle and the single variable principle, the T2DM and
T2DM+HBOT groups were used as the experimental groups, whereas the
HFD and HFD+HBOT groups were used as the control groups. As the
expected success rate of T2DM modeling was unknown at first, the
sample size of the T2DM group was doubled in order to reduce
sampling error and improve statistical efficiency. As the results
showed that the rate of successful T2DM model establishment was
100%, the sample sizes of the HFD and T2DM groups were 4 and 8,
respectively.
From the 7th week, all mice were fed a HFD until
sacrifice. HFD feeding was combined with a subsequent injection of
low-dose streptozotocin (STZ, 60 mg/kg; i.p.; cat. no. S0130;
Sigma-Aldrich; Merck KGaA) to model T2DM. Young adult mice are fed
a HFD to elicit insulin resistance, multiple injections with
low-dose STZ then elicit partial loss of β-cells, which results in
hypoinsulinemia and hyperglycemia (15). T2DM mice were intraperitoneally
injected with low-dose STZ once daily for 3 days after 1-week HFD
feeding. The age-matched HFD mice were injected with the same
frequency citrate buffer as STZ alone (15,16). Mice with fasting blood glucose
levels >12 mmol/l were defined as successful T2DM models
(13).
At the 14th week, HFD+HBOT and T2DM+HBOT groups
received 1-h HBOT daily from 5:00 to 6:00 p.m. for 7 days, whereas
the other two groups received normobaric oxygen in the same
chamber. HBOT was administered in an animal HBO chamber (Moon
Environmental Technology Co., Ltd.), operating at high pressure (2
ATA) with 100% oxygen, including a 5-min pressure rise adaptation
stage, 50-min stabilization stage and 5-min re-pressurization stage
(17). After the final HBOT, an
intraperitoneal glucose tolerance test (IPGTT) was performed.
Subsequently, the mice were sacrificed by exsanguination following
an intraperitoneal injection of 50 mg/kg sodium pentobarbital.
Blood samples were obtained from the orbital sinus and stored at
−20°C or −80°C until further use (18,19).
Food intake and body weight
As mice are primarily nocturnal and their feeding
activity typically occurs during the night, nocturnal food intake
was assessed (20). During HBOT,
the 12-h nocturnal food intake was measured daily to investigate
the effects of HBOT on nocturnal food intake (20). An electronic precision scale
(TE412-L; Sartorius AG) was used to weigh the food at 8:00 a.m and
8:00 p.m. The 12-h nocturnal food intake was defined as the weight
of the food at 8:00 p.m. minus the weight of the food at 8:00 a.m.
the following morning. An electric balance (PL1501-S; Mettler
Toledo) was used to weigh the mice at 8:00 a.m. after weighing the
food.
Blood glucose, intraperitoneal glucose
tolerance test (IPGTT) and insulin level
To determine the success of T2DM model
establishment, non-fasting blood glucose (non-FBG) was measured
after 42 days of STZ injection by a tail vein prick and a
glucometer.
Before HBOT, fasting blood glucose (FBG) levels were
measured in the four groups and then FBG levels were assessed again
after 7-day HBOT to observe the effects of HBOT on FBG.
FBG was measured at 9:00 a.m. after a 12-h fast and
non-FBG was measured at 2:00 p.m. without fasting.
The IPGTT was performed in the T2DM and T2DM+HBOT
groups after 7-day HBOT. The mice were allowed to fast for 14 h
before the IPGTT and then intraperitoneally administered glucose (2
g/kg body weight). Using a glucometer, blood glucose concentrations
were measured at 0, 15, 30, 60, 90 and 120 min after IPGTT using
tail vein blood.
Fasting insulin (FI) levels of the blood samples
obtained from sacrificed mice were measured using an ultrasensitive
ELISA Kit (cat. no. CEA448Ra, Wuhan USCN Business Co., Ltd.). The
homeostasis model assessment for insulin resistance and β-cell
function (HOMA-IR and HOMA-β, respectively) indices were also
measured (21). The HOMA-IR was
calculated as follows: FI (mU/ml) × FBG (mmol/l)/22.5. The HOMA-β
was calculated as follows: 20 × FI/(FBG-3.5) (22).
Fat mass and pancreas weight
Electronic precision scales were used to measure fat
mass, including inguinal adipose tissue, epididymal adipose tissue
and pancreas weight. The sum of the inguinal white adipose tissue
(iWAT) weight and epididymal white adipose tissue (eWAT) weight was
calculated to assess the total weight of the fat pad, reflecting
the balance of fat accumulation and metabolism. The current study
calculated the pancreas weight coefficient as follows: Pancreas
weight/body weight on the 8th day.
Hematoxylin and eosin (H&E)
staining
Pancreatic and liver tissues were fixed in 4%
formaldehyde at 4°C for 24 h. After dehydration with various
ethanol concentrations (75, 80, 85, 95 I, 95 II, 100 I and 100% II,
5 min each at room temperature) and clarifying with xylene (xylene
I and xylene II, 10 min each at room temperature), the tissues were
embedded in soft paraffin, hard paraffin and mixed paraffin (1 h
for each) before sectioning, the temperature was 2–3°C above the
melting point, at last the tissues were solidified in the mixed
paraffin at room temperature. After sectioning into 4-6-µm sections
using a paraffin slicing machine (RM2016; Leica Microsystems,
Inc.), the tissue sections were stained using a hematoxylin-eosin
staining kit (cat. no. C0105; Beyotime Institute of Biotechnology).
The light microscope (CX31; Olympus Corporation) was used to
observe staining results. Cell numbers were counted using ImageJ
software (version 1.8.0; National Institutes of Health).
Immunohistochemistry
Paraffin-embedded sections (thickness, 4-6-µm) were
used to determine the effects of HBOT on insulin resistance.
Pancreatic tissues were fixed in 4% formaldehyde at 4°C for 24 h.
After dehydration with various ethanol concentrations (5 min each
at room temperature) and clarifying with xylene (xylene I and
xylene II, 10 min each at room temperature), the tissues were
embedded in soft paraffin, hard paraffin and mixed paraffin (1 h
for each) before sectioning, the temperature was 2–3°C above the
melting point, lastly the tissues were solidified in the mixed
paraffin at room temperature. After sectioning, the tissues were
dewaxed by xylene for (xylene I and xylene II) 10 min each at room
temperature and placed in different ethanol concentrations (100 I,
100 II, 95 I, 95 II, 85, 80 and 75%) for 5 min each at room
temperature. Following antigen retrieval by heating at 95°C in
citrate buffer for 1 h, the sections were quenched with 0.3%
hydrogen peroxide at room temperature for 30 min. After three
washes in 0.01 M PBS, the sections were blocked with 1% BSA (cat.
no. 1213G057; Beijing Solarbio Science & Technology Co., Ltd.)
in 0.01 M PBS for 1 h at 37°C. Subsequently, the sections were
incubated with a rabbit anti-insulin primary antibody (1:200; cat.
no. 4590; Cell Signaling Technology, Inc.) overnight at 4°C. The
sections were then incubated with a HRP-conjugated secondary
antibody (cat. no. ZB2301; Zsbio; http://www.zsbio.com/product/ZB-2301) for 3 h at 37°C.
Finally, 3,3′diaminobenzidine (DAB) staining was performed using a
kit (cat. no. ZLI-9018; Zsbio) according to the manufacturer's
protocol. The nuclei were stained for 30 sec to 1 min, then the
sections were rinsed with running water for 10 min.
Differentiation: 70, 90, 100 I, 100% II ethanol, xylene I and
xylene II, 2 min each at room temperature. The slides were removed
from xylene and neutral gum was used to seal the slides. The
morphology was assessed using a CX31 light microscope (Olympus
Corporation). The β-cell area ratio was assessed using Image-Pro
Plus software (Version 6.0, Media Cybernetics, Inc.). The β-cell
mass was calculated by the β-cell area ratio and pancreas weight
(23,24): β-cell mass=β-cell area ratio ×
pancreas weight.
TUNEL assay
Paraffin-embedded sections (thickness, 4-6-µm) were
used to determine the effects of HBOT on β-cell apoptosis.
Pancreatic tissues were fixed in 4% formaldehyde at 4°C for 24 h.
After dehydration with various ethanol concentrations (5 min each
at room temperature) and clarifying with xylene (xylene I and
xylene II, 10 min each at room temperature), the tissues were
embedded in soft paraffin, hard paraffin and mixed paraffin (1 h
for each) before sectioning, the temperature was 2–3°C above the
melting point, lastly the tissues were solidified in the mixed
paraffin at room temperature. After sectioning, the tissues were
dewaxed by xylene (xylene I and xylene II) for 20 min each and
placed in different ethanol concentrations (100 I, 100 II, 95 I, 95
II, 85, 80 and 75%) for 5 min each at room temperature, then the
tissues were incubated in 0.1% Triton for 10 min. After four washes
with PBS (2 min per wash), the sections were incubated with
protease K (20 µg/ml in 10 mM Tris-HCl, pH 8.0) and digested for 15
min. Subsequently, the sections were incubated in labeling buffer
for 2 h at 37°C. After rinsing three times with PBS, the sections
were stained using a TUNEL Cell Apoptosis Detection kit III (FITC,
cat. no. MK1023; Boster Biological Technology) according to the
manufacturer's protocol. Sections were also immunostained with
anti-insulin antibody to identify β-cells, they were incubated with
a rabbit anti-insulin primary antibody (1:200; cat. no. 4590; Cell
Signaling Technology, Inc.) overnight at 4°C and incubated with a
HRP-conjugated secondary antibody (cat. no. ZB2301; Zsbio) for 3 h
at 37°C. The slides were rinsed in 0.01 M PBS buffer and mounted in
fluorescent mounting medium (Dako; Agilent Technologies, Inc.).
Differentiation: 70, 90, 100 I, 100% II ethanol, xylene I and
xylene II, 2 min each at room temperature. The slides were removed
from xylene and neutral gum was used to seal the slides. The
stained sections were visualized using a fluorescence microscope
and apoptotic cell numbers were counted using ImageJ software
(version 1.8.0; National Institutes of Health). In total, 20 islets
were chosen at random from each group of individual mice.
Western blotting
Total protein was isolated from pancreatic tissues
using RIPA buffer (cat. no. P0013B; Beyotime Institute of
Biotechnology) supplemented with protease inhibitors (1:100; cat.
no. P1005; Beyotime Institute of Biotechnology). After
centrifugation at 14,000 × g for 10 min (4°C), protein
concentrations were determined using a BCA assay (cat. no. P0012;
Beyotime Institute of Biotechnology). Proteins were denatured in
sodium dodecyl sulfate sampling buffer (95°C for 5 min), then
separated using 12% polyacrylamide gel electrophoresis. After
transferring to PVDF membranes (cat. no. IPVH00010, MilliporeSigma)
over 2 h, the membranes were blocked with 5% FBS (cat. no.
9048-46-8, Beijing Solarbio Science & Technology Co., Ltd.) for
2 h at room temperature. The mass of protein was 30 µg/12 µl per
lane. Subsequently, the membranes were incubated at 4°C overnight
with primary antibodies targeted against the following: Bax (rabbit
IgG; cat. no. 2772; 1:2,000; Cell Signaling Technology, Inc.),
Bcl-2 (rabbit IgG; cat. no. ab196495; 1:2,000; Abcam), caspase-3
(Casp-3, rabbit IgG; cat. no. ab184787; 1:2,000; Abcam), cleaved
Casp-3 (rabbit IgG; cat. no. ab214430; 1:2,000; Abcam),
poly(ADP-ribose) polymerase (PARP; rabbit IgG; cat. no. 9532;
1:2,000; Cell Signaling Technology, Inc.), cleaved PARP (rabbit
IgG; cat. no. 5625; 1:2,000; Cell Signaling Technology, Inc.) and
β-actin (rabbit IgG; cat. no. 4967; 1:4,000; Cell Signaling
Technology, Inc.). The membranes were then incubated with a goat
anti-rabbit IgG H&L HRP-conjugated secondary antibody (cat. no.
ab6721; 1:2,000; Abcam) at room temperature for 1 h. Protein bands
were visualized using Immobilon western chemiluminescent substrate
(cat. no. WBKLS0100; 200 µl; MilliporeSigma) and a UVP 810
gel-imager (Analytik Jena AG). Protein expression was
semi-quantified using ImageJ software (version 1.8.0, National
Institutes of Health).
Statistical analysis
The experiments were repeated >2 times. Data are
presented as the mean ± SEM. Comparisons between two groups were
analyzed using the unpaired Student's t-test. Comparisons among
multiple groups were analyzed using one-way ANOVA followed by
Tukey's post hoc test. GraphPad Prism (GraphPad Software, Inc,
version 7.0.) and SPSS (SPSS Inc, version 22.0) software were used
to create graphs and perform statistical analyses. P<0.05 was
considered to indicate a statistically significant difference.
Results
Establishment of the T2DM mouse
model
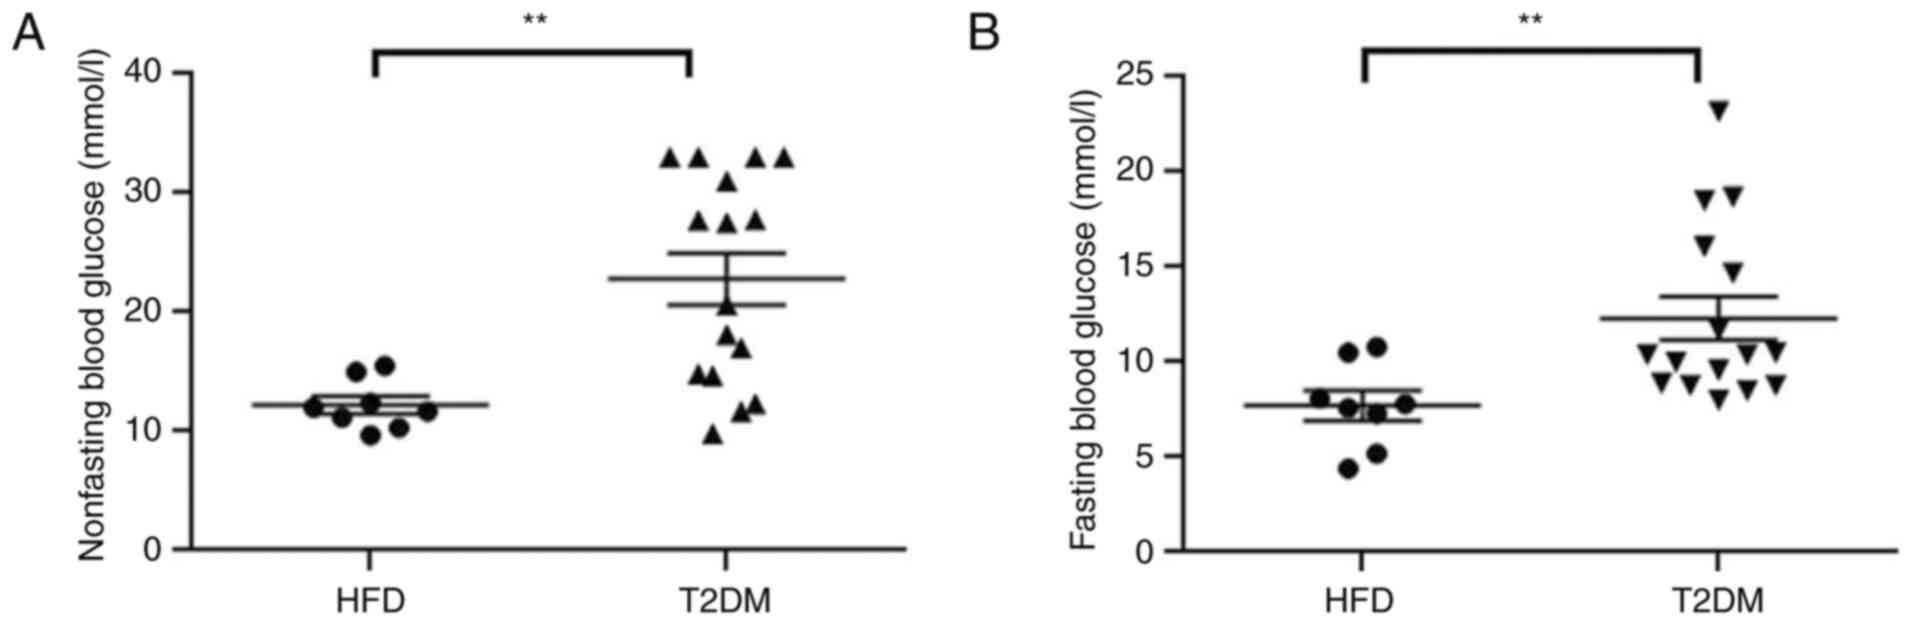
Non-FBG was measured for 2 consecutive days after 42
days injecting low-dose STZ (Fig.
1A). FBG was measured before the HBO intervention (Fig. 1B). Both the non-FBG (22.81±1.88
vs. 12.23±0.73 mmol/l; P<0.01) and FBG (12.30±1.14 vs. 7.71±0.79
mmol/l; P<0.01) levels of the T2DM group were significantly
higher compared with those in the HFD group, which indicated
successful establishment of the T2DM model. No mice died during the
model establishment and the successful T2DM model establishment
rate was 100%.
Effects of HBOT on nocturnal feeding
and body weight in T2DM mice
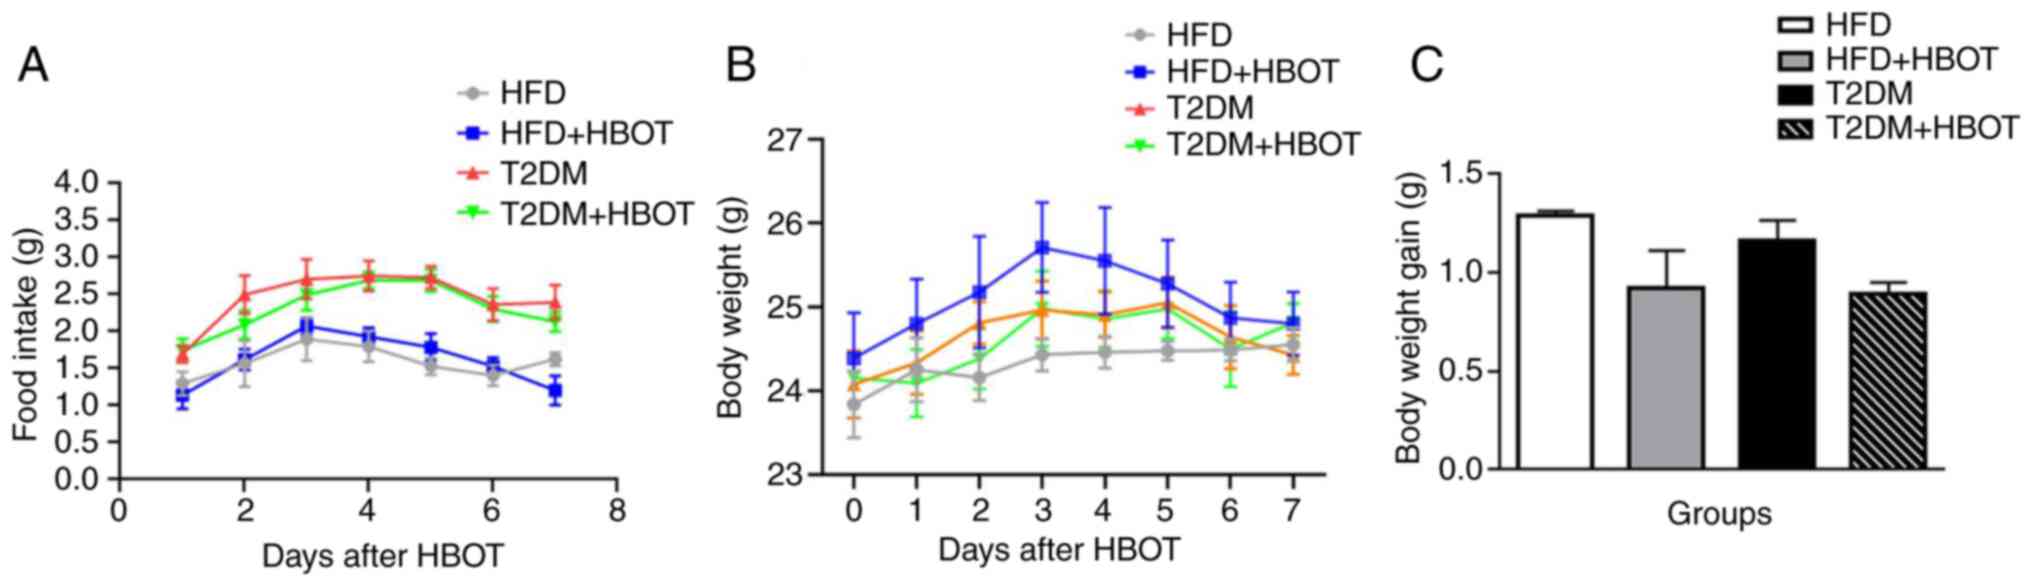
During HBOT, all mice were fed separately for 7 days
and their 12-h nocturnal feeding and body weight were assessed
daily. There were no marked differences among the HBOT groups in
12-h nocturnal food intake (P>0.05; Fig. 2A). The body weight appeared to
increase at first, then decrease; however, there were no
significant differences among the four groups (P>0.05; Fig. 2B). Body weight gain after HBO
intervention was determined on the 8th day, and the results
indicated that HBOT did not reduce body weight gain in both the HFD
(1.292±0.021 vs. 0.922±0.19 g; P>0.05) and T2DM (1.164±0.102 vs.
0.891±0.059 g; P>0.05) groups (Fig. 2C).
Effects of HBOT on blood glucose and
insulin sensitivity in T2DM mice
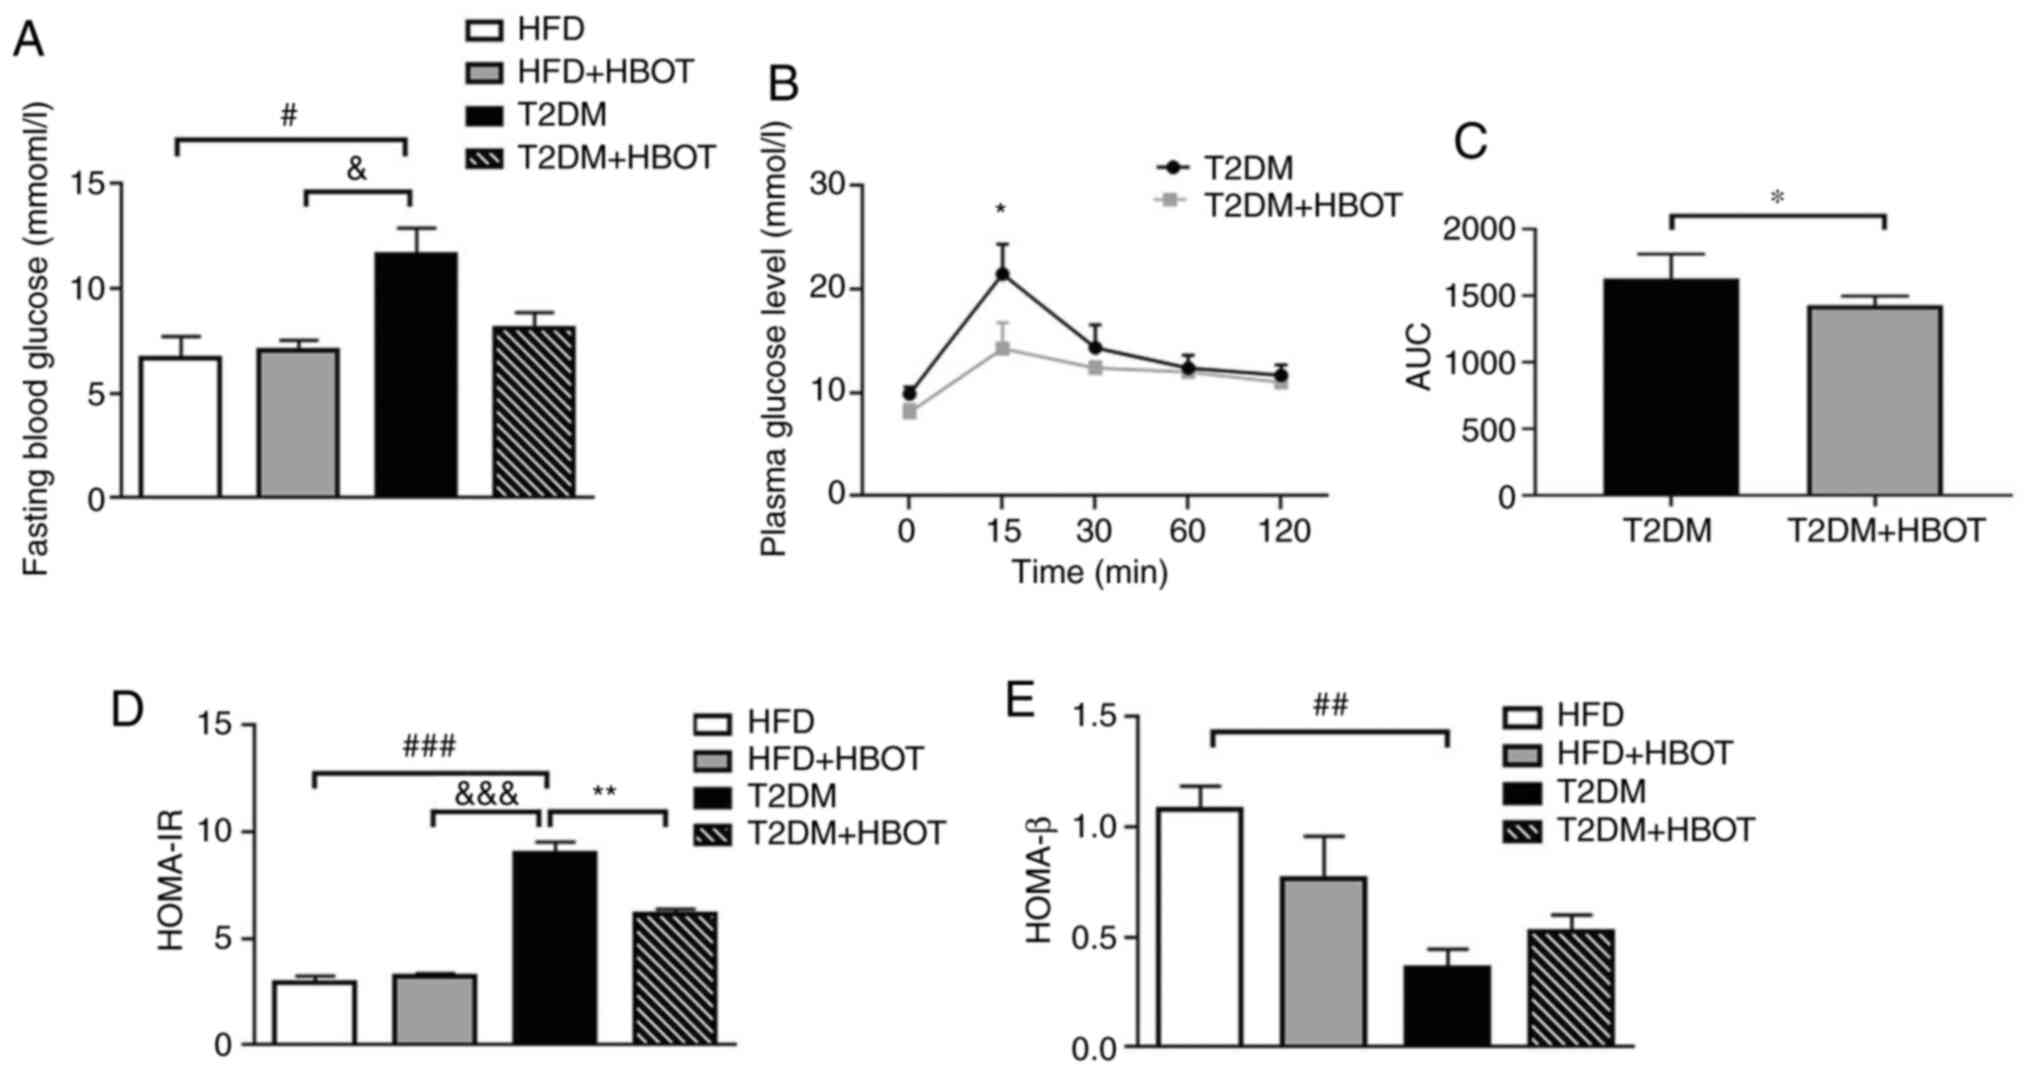
HBOT notably reduced FBG in T2DM mice (11.63±1.26
vs. 8.11±0.74 mmol/l; P>0.05; Fig.
3A). The glucose tolerance tests showed that HBOT significantly
reduced peak blood glucose levels at 15 min (21.48±2.88 vs.
14.26±2.51; P<0.05; Fig. 3B)
and the area under the blood glucose curve within 120 min of IPGTT
(1,628±185 vs. 1,425±72; P<0.05; Fig. 3C) in T2DM mice, suggesting that
HBOT reduced FBG levels and improved glucose tolerance in T2DM.
To assess insulin resistance and β-cell function,
HOMA-IR and HOMA-β were calculated. The HOMA-IR of T2DM mice was
significantly higher compared with that of HFD mice (8.98±0.55 vs.
2.96±0.27; P<0.001). There were no significant differences
between the two HFD groups (2.96±0.272 vs. 3.25±0.12; P>0.05).
Compared with the T2DM group, the HOMA-IR was significantly reduced
in the T2DM+HBOT group (8.98±0.55 vs. 6.17±0.21; P<0.01;
Fig. 3D). The HOMA-β of T2DM mice
was significantly lower compared with that in the HFD group
(0.362±0.84 vs. 1.084±0.102; P<0.01). Moreover, there was no
significant difference between the two HFD groups or between the
two T2DM groups (P>0.05; Fig.
3E).
Effects of HBOT on fat pad and
pancreas weight in T2DM mice
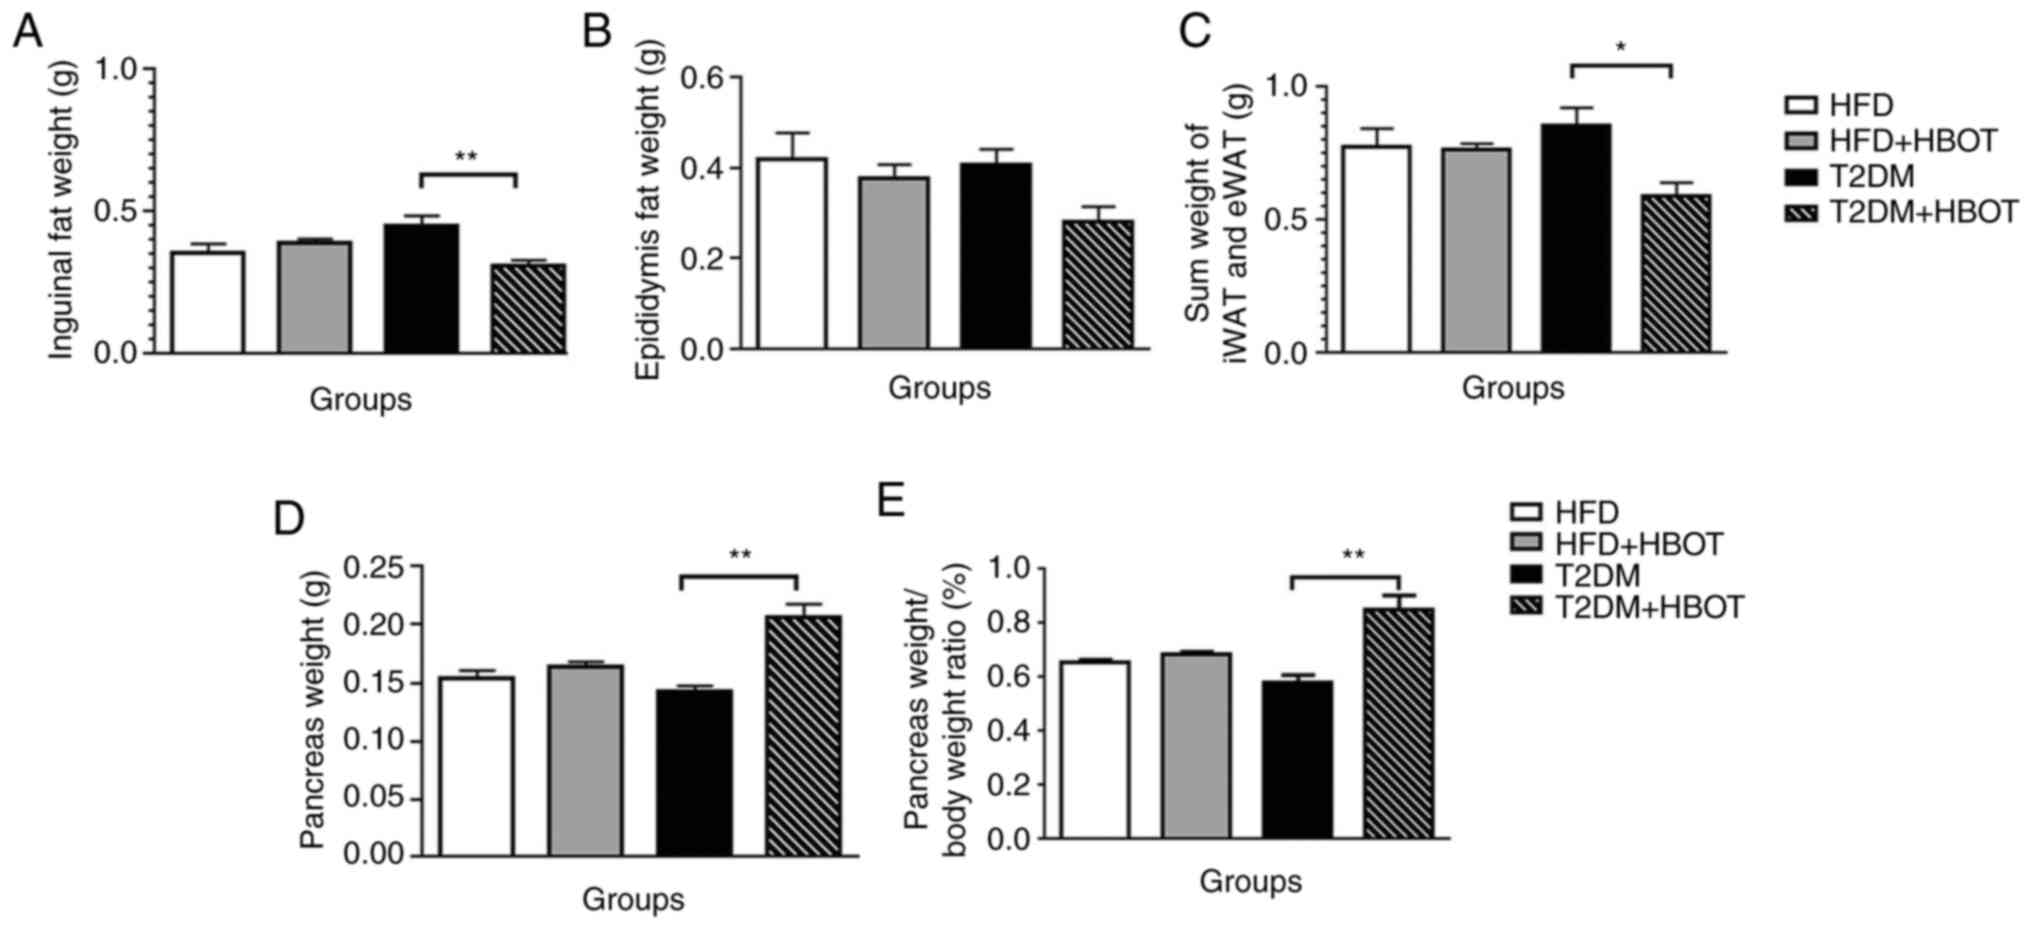
Visceral adipose tissue and subcutaneous adipose
tissue are considered as distinct types of white fat. Typically,
the inguinal fat weight is measured to reflect subcutaneous adipose
tissue and the epididymal fat weight is measured to reflect
visceral adipose tissue (25,26). Therefore, the weights of visceral
epididymal fat and inguinal subcutaneous fat were measured in the
present study.
The weight of the inguinal subcutaneous adipose
tissue was significantly lower in the T2DM+HBOT group compared with
that in the T2DM group (0.311±0.019 vs. 0.451±0.034 g; P<0.01;
(Fig. 4A), although there was no
significant difference in the weight of the visceral epididymal
adipose tissue between these two T2DM groups (P>0.05; Fig. 4B). HBOT significantly decreased
the sum of iWAT and eWAT weight in T2DM mice (0.592±0.049 vs.
0.856±0.067 g; P<0.05; Fig.
4C). Compared with the T2DM group, the pancreas weight
(0.206±0.012 vs. 0.143±0.004 g; P<0.01) and the pancreas weight
coefficient were significantly increased in the T2DM+HBOT group
(0.849±0.053 vs. 0.582±0.026; P<0.01; Fig. 4D and E).
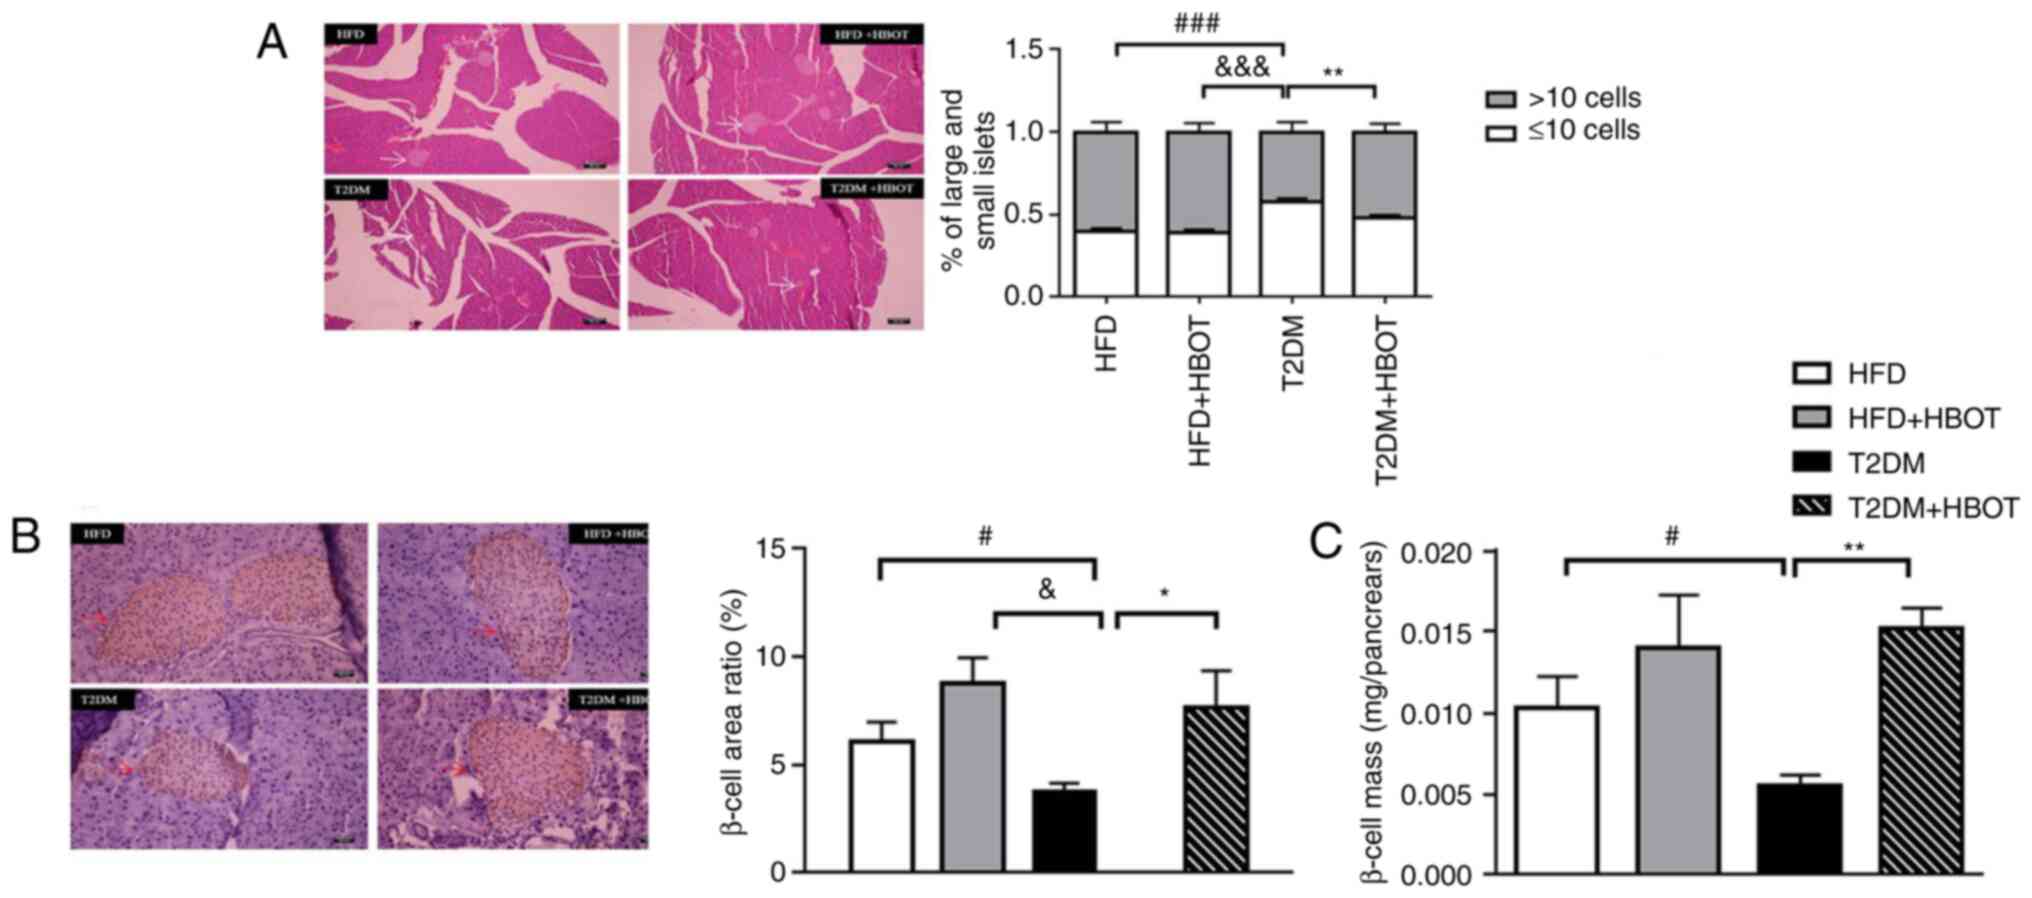
Effects of HBOT on pancreas β-cell
morphology and structure in T2DM mice
The islets were divided into large and small islets;
those with >10 islet cells were defined as large islets and
those with ≤10 cells as small islets.
H&E staining showed that the number of small
islets was higher, whereas the number of large islets was lower in
the T2DM group compared with the HFD group. After HBOT, the number
of large islets increased significantly in T2DM mice (0.52±0.016
vs. 0.42±0.019; P<0.01; Fig.
5A).
The β-cell area in the T2DM group was significantly
smaller compared with that in the HFD (3.77±0.38 vs. 6.097±0.88;
P<0.05) and HFD+HBOT (3.77±0.38 vs. 8.77±1.18; P<0.05)
groups. After HBOT, the β-cell area in T2DM mice was significantly
increased (3.77±0.38 vs. 7.68±1.68; P<0.05), albeit smaller
compared with that in the HFD and HFD+HBOT groups (Fig. 5B). In the T2DM mice, the β-cell
mass was significantly lower in pancreatic tissue compared with the
HFD group (0.0103±0.0019 vs. 0.005463±0.000691; P<0.05).
However, HBOT significantly increased β-cell mass by ~2-fold
without HBOT in T2DM mice (0.005463±0.000691 vs. 0.015201±0.001261;
P<0.01; Fig. 5C).
Effects of HBOT on pancreas β-cell
apoptosis in T2DM mice
The TUNEL results showed that HBOT significantly
reduced the β-cell apoptotic rate in T2DM mice (0.3588±0.01237 vs.
0.1550±0.00898; P<0.001; Fig.
6A).
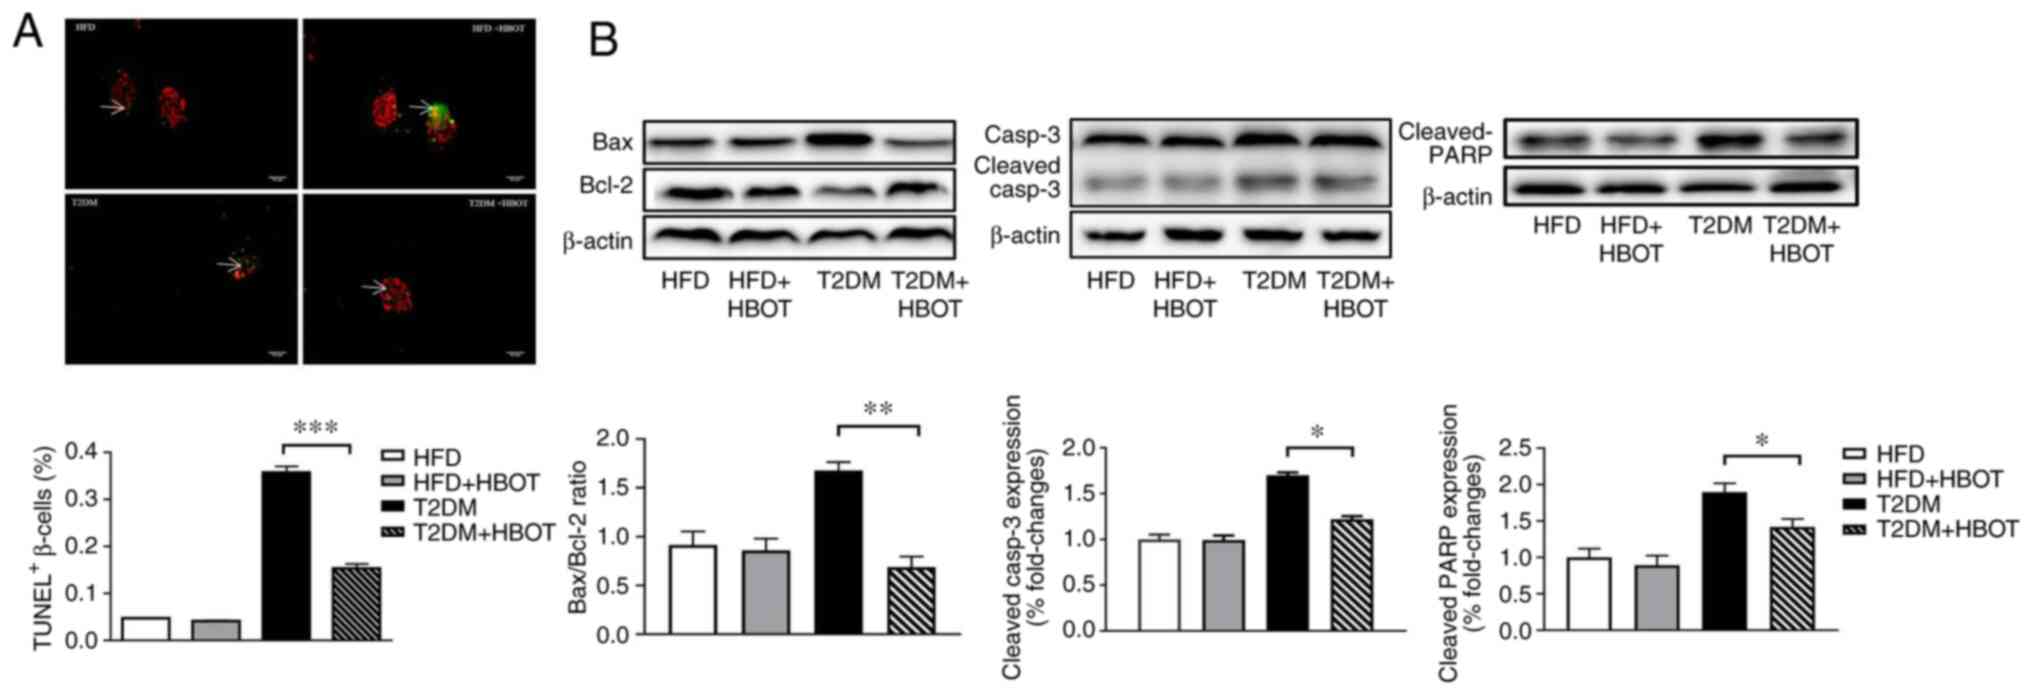 | Figure 6.Effects of HBOT on β-cell apoptosis.
(A) TUNEL staining of β-cell apoptosis. Red fluorescence indicates
pancreatic β-cells and green fluorescence indicates apoptotic cells
(scale bar, 252 µm), white arrows indicate TUNEL+
β-cells (%). (B) Effects of HBOT on the expression levels of
apoptosis-related proteins, including Bax/Bcl-2, Casp-3 and PARP,
in pancreatic tissue. Data are presented as the mean ± SEM.
*P<0.05, **P<0.01 and ***P<0.001. HBO, hyperbaric oxygen;
PARP, poly(ADP-ribose) polymerase; HFD, high-fat diet; HBOT,
hyperbaric oxygen therapy; T2DM, type-2 diabetes mellitus; Casp,
caspase. |
To further investigate the mechanism underlying
HBO-mediated inhibition of β-cell apoptosis, the expression levels
of the apoptosis-related proteins Bax/Bcl-2, caspase-3 and
downstream PARP were measured in pancreatic tissue. After HBOT, the
expression levels of Bax were markedly decreased, whereas Bcl-2
expression levels were notably increased, resulting in a
significantly decreased Bax/Bcl-2 ratio in T2DM mice. The
expression levels of cleaved caspase-3 and cleaved PARP were
significantly lower in the T2DM+HBOT group compared with those in
the T2DM group (Fig. 6B).
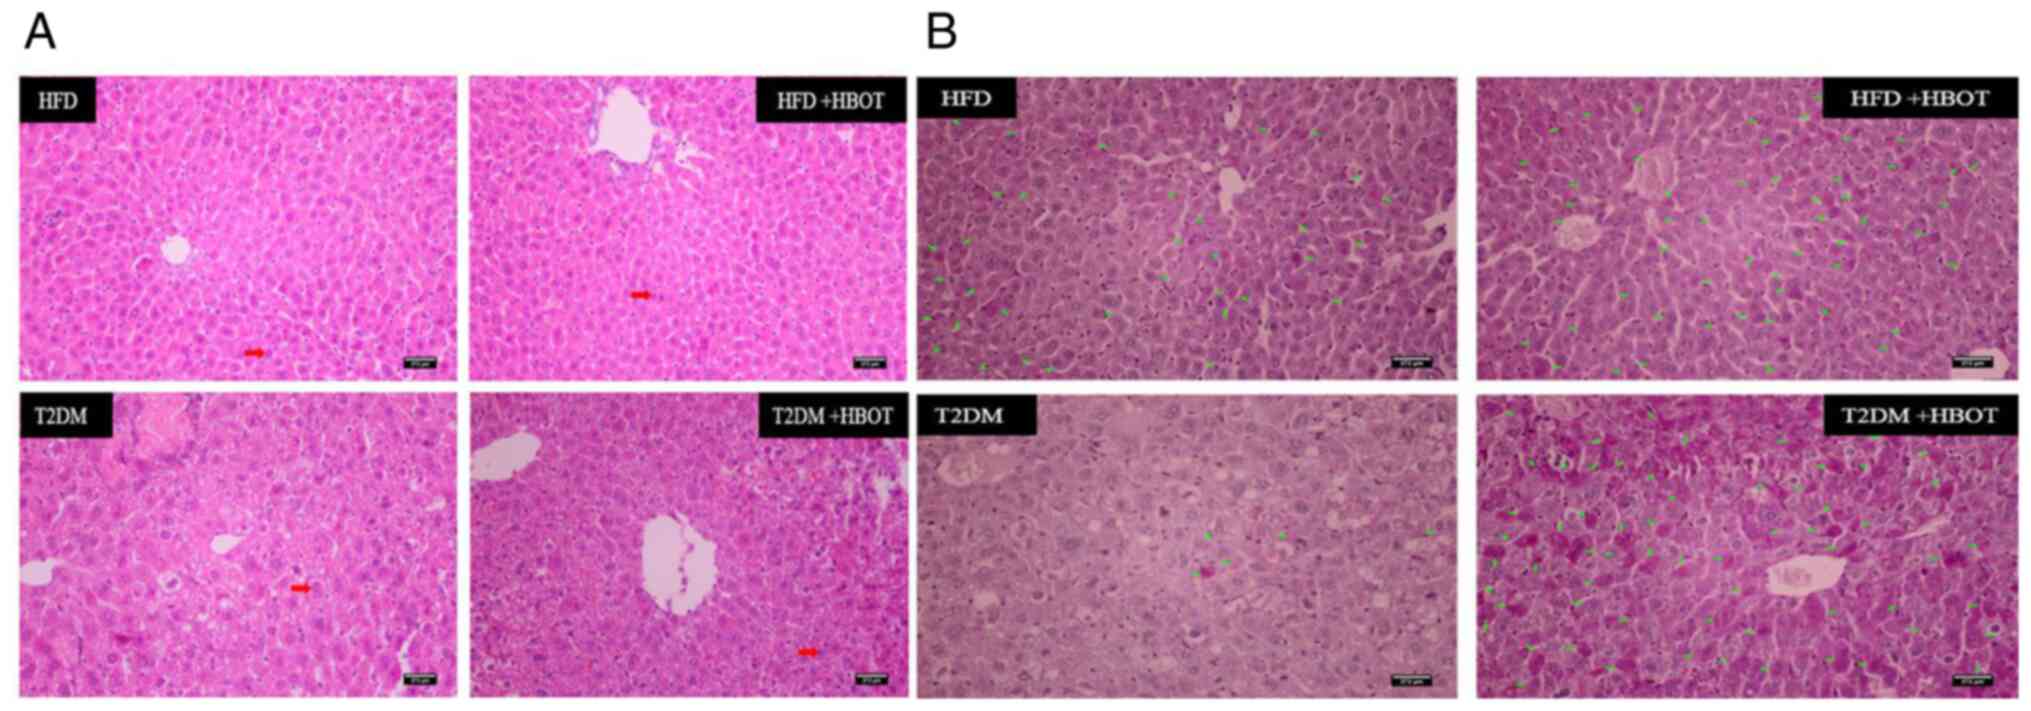
Effects of HBOT on hepatic
gluconeogenesis in T2DM mice
H&E staining showed that the arrangement cords
of hepatocytes appeared more orderly after HBOT, and there were
fewer intracytoplasmic vacuoles and inflammatory cells. The nuclei
were larger and located in the center, and there was less shrinkage
and necrosis than in the T2DM group (Fig. 7A). HBOT increased hepatic glycogen
storage in T2DM mice (Fig.
7B).
Discussion
Diabetes mellitus has emerged as a significant
public health issue worldwide, and T2DM is a common type of
diabetes, accounting for 90–95% cases (27). Environmental and genetic factors
cause β-cell dysfunction and insulin resistance (28), with hyperglycemia and lipid
metabolism disorders as the main symptoms. Hyperglycemia may affect
the function of tissues and organs, including the kidneys, eyes and
the nervous system (29), if not
controlled by medical, nutritional or physical interventions
(30). The complications of T2DM
result in severe health and social problems if untreated or
mishandled, eventually reducing the quality of life and life span
of patients (31).
Insulin resistance and β-cell dysfunction are
responsible for hyperglycemia in T2DM and can result in numerous
metabolic abnormalities (32,33). Insulin resistance is an inadequate
biological response to target tissue insulin stimulation, such as
the liver, muscle and adipose tissue (34). Insulin resistance impairs glucose
metabolism, resulting in compensatory increases in β-cell insulin
production and hyperinsulinemia (35). The causes of insulin resistance
include obesity, diabetes and physical inactivity, although there
may also be genetic factors (36). Therefore, the mechanisms involved
in the development of insulin resistance are multifactorial.
HBO therapy is a relatively safe and non-invasive
treatment that has been applied in various diseases, including
diabetic patients with non-healing foot ulcers (8). HBOT has also been reported to reduce
FBG and increased insulin sensitivity (10,11). Our previous study also
demonstrated consistent results. In T2DM mice, HBOT improved
insulin sensitivity by activating muscle Akt protein
phosphorylation to promote GLUT4 expression (13). Skeletal muscle serves an essential
role in regulating blood glucose, accounting for ~75% of total
glucose clearance (37). In
type-1 diabetes mellitus (T1DM) model mice, HBOT improved glucose
metabolism by protecting islet β-cells and enhancing hepatic
glycogen storage (19).
The liver is another vital organ for glucose
metabolism and energy balance. In a fasting state, hepatic
gluconeogenesis fills the need for glucose by the brain. By
contrast, the liver stores glucose as glycogen or fat while in the
fed state (38). Faleo et
al (39) reported that HBOT
preserved islet β-cell mass by stimulating proliferation,
inhibiting apoptosis and suppressing insulitis in non-obese
diabetic mice. Therefore, the present study focused on the effects
of HBOT on blood glucose, pancreas β-cell state and hepatic
glycogen storage in T2DM mice. Due to the limited application of
HBOT in diabetes, previous studies are limited, and the effect of
HBOT on diabetes requires further study.
In the present study, the T2DM and T2DM+HBOT were
established as the experimental groups, and the HFD and HFD+HBOT
groups were established as the control groups. A key limitation of
the present study was lack of a normal diet group, which would have
been more rigorous.
The successful T2DM model establishment rate was
100%, and no mice died during model establishment. Both non-FBG and
FBG levels of the T2DM group were higher compared with those in the
HFD group, suggesting the success of T2DM model establishment. As
the success rate of T2DM modeling is unknown at first, the sample
size of the T2DM group was doubled in order to reduce sampling
error and improve statistical efficiency. The current results
showed that the rate of successful T2DM model-building was 100%, so
the sample size of the T2DM group and the HFD group were different,
which is another limitation of the present study.
After establishing the T2DM model, HBOT (2.0 ATA,
100% O2, 1 h per day) was administered for 7 consecutive
days. During HBOT, 12-h nocturnal food intake was measured every
day to investigate the effects of HBOT on nocturnal food intake,
but no remarkable differences among the HBOT groups were
identified. The feeding results were inconsistent with our previous
work, which indicated that HBOT increased the cumulative food
intake in the last 12 h in T2DM mice (13). This difference may be due to the
method of monitoring. As for the 7-day body weight, there were no
significant differences among the four groups, and HBOT did not
markedly reduce the body weight gain on the 8th day in both the HFD
and T2DM groups. After sacrifice, fat mass, including inguinal
subcutaneous adipose tissue and visceral epididymal adipose tissue,
was measured. HBOT decreased inguinal fat, and the sum of inguinal
fat and epididymal fat in T2DM mice, potentially via increasing fat
utilization, accelerating fat metabolism and reducing fat
accumulation in diabetic mice.
HBOT significantly reduced peak blood glucose levels
at 15 min and the area under the blood glucose curve within 120 min
of IPGTT in T2DM mice. These findings suggested that HBOT improved
glucose tolerance in T2DM mice. Subsequently, HOMA-IR and HOMA-β
were calculated to assess insulin resistance and β-cell function,
respectively. The HOMA-IR of T2DM mice was significantly higher
compared with that of HFD mice, indicating that T2DM mice displayed
severe insulin resistance. The HOMA-IR was significant reduced in
the T2DM+HBOT group compared with that in the T2DM group,
indicating that HBOT significantly improved insulin sensitivity.
The HOMA-β results suggested that β-cell function in the T2DM group
was significantly lower compared with that in the HFD group.
However, HBOT did not have a significant therapeutic effect on
β-cell function in T2DM mice.
The H&E staining results showed that HBOT
significantly increased large islets (>10 cells). Both β-cell
area and β-cell mass were increased in the pancreatic tissue after
HBOT in the T2DM mice. Although there was no significant
therapeutic effect between the HFD groups, a therapeutic trend
consistent with those in the T2DM groups was observed following
HBOT. Moreover, β-cell area in the T2DM group was significantly
smaller compared with that in the HFD group, and the β-cell mass in
the T2DM group was significantly lower compared with that in the
HFD group. These results indicated that the β-cell morphology and
structure were more severely damaged in T2DM mice compared with
those in HFD mice, which provided a potential explanation for the
lack of significant therapeutic effect in the HFD+HBOT group.
To investigate the underlying mechanism, the TUNEL
assay was used to measure the effects of HBOT on pancreatic β-cell
apoptosis. HBOT significantly reduced the apoptotic rate in T2DM
mice, confirming the findings of Faleo et al (39). Subsequently, apoptotic protein
expression levels were measured. The results indicated that HBO
reduced the β-cell apoptotic rate via the pancreatic
Bcl-2/caspase-3/PARP apoptosis pathway in T2DM mice. By contrast,
Matsunami et al (40)
demonstrated that HBO exposure induced pancreas apoptosis in
STZ-induced diabetic rats. However, the present study investigated
the effects of HBOT on T2DM mice, whereas Matsunami et al
used T1DM model rats. Therefore, further research is required to
confirm these results.
The liver is an essential organ in glucose
metabolism (38). Our previous
study demonstrated that HBOT enhanced hepatic glycogen storage in
T2DM mice (19). The results of
the present study suggested that HBO improved the structure of
hepatocytes and increased hepatic glycogen storage in T2DM
mice.
In conclusion, examining the underlying mechanism
for pancreatic β-cell apoptosis is crucial for understanding the
pathogenesis of diabetes. To the best of our knowledge, the present
study was the first to report that HBOT increased insulin
sensitivity by reducing β-cell apoptosis via the pancreatic
Bcl-2/caspase-3/PARP apoptosis pathway in T2DM mice, which
suggested that HBOT may represent a potential treatment for
patients with T2DM.
Acknowledgements
The authors would like to thank Miss Yuan Liu and
Miss Li-min Song (Qingdao University, China) for taking care of the
mice during HBOT in the experiments.
Funding
The present study was supported by the National Natural Science
Foundation of China (grant no. 31872791) and the Science Foundation
of Shandong Province of China (grant no. ZR201807070189).
Availability of data and materials
The datasets used and/or analyzed during the current
study are available from the corresponding author on reasonable
request.
Authors' contributions
CZ and DZ confirm the authenticity of all the raw
data. JD, GG, CZ and DZ conceived and designed the study. CZ, DZ,
HW, QL, ML and JY performed the experiments. CZ and DZ analyzed the
data. CZ, DZ and JD drafted the manuscript. JD, CZ, DZ and GG
reviewed and edited the manuscript, and gave final approval of the
version to be published. All authors have read and approved the
final manuscript.
Ethics approval and consent to
participate
The experimental protocols were approved by the
Qingdao University Animal Care and Use Committee and Animal Welfare
Committee (approval no. QYFY WzLL26594) in accordance with the
National Institutes of Health guidelines.
Patient consent for publication
Not applicable.
Competing interests
The authors declare that they have no competing
interests.
References
|
1
|
Cho NH, Shaw JE, Karuranga S, Huang Y, da
Rocha Fernandes JD, Ohlrogge AW and Malanda B: IDF diabetes atlas:
Global estimates of diabetes prevalence for 2017 and projections
for 2045. Diabetes Res Clin Pract. 138:271–281. 2018. View Article : Google Scholar : PubMed/NCBI
|
|
2
|
Lu Y, Li Y, Li G and Lu H: Identification
of potential markers for type 2 diabetes mellitus via
bioinformatics analysis. Mol Med Rep. 22:1868–1882. 2020.
View Article : Google Scholar : PubMed/NCBI
|
|
3
|
Ichise M and Harris PE: Imaging of
beta-cell mass and function. J Nucl Med. 51:1001–1004. 2010.
View Article : Google Scholar : PubMed/NCBI
|
|
4
|
DeFronzo RA, Eldor R and Abdul-Ghani M:
Pathophysiologic approach to therapy in patients with newly
diagnosed type 2 diabetes. Diabetes Care. 36 (Suppl 2):S127–S138.
2013. View Article : Google Scholar : PubMed/NCBI
|
|
5
|
Weir GC and Bonner-Weir S: Islet β cell
mass in diabetes and how it relates to function, birth, and death.
Ann N Y Acad Sci. 1281:92–105. 2013. View Article : Google Scholar : PubMed/NCBI
|
|
6
|
Butler AE, Janson J, Bonner-Weir S, Ritzel
R, Rizza RA and Butler PC: Beta-cell deficit and increased
beta-cell apoptosis in humans with type 2 diabetes. Diabetes.
52:102–110. 2003. View Article : Google Scholar : PubMed/NCBI
|
|
7
|
Germonpre P, Levie P, Dehalleux C and
Caers D: ENT indications for Hyperbaric Oxygen Therapy. B-ENT
Suppl. 26:S87–S106. 2016.PubMed/NCBI
|
|
8
|
Karadurmus N, Sahin M, Tasci C, Naharci I,
Ozturk C, Ilbasmis S, Dulkadir Z, Sen A and Saglam K: Potential
benefits of hyperbaric oxygen therapy on atherosclerosis and
glycaemic control in patients with diabetic foot. Endokrynol Pol.
61:275–279. 2010.PubMed/NCBI
|
|
9
|
Chen CY, Wu RW, Hsu MC, Hsieh CJ and Chou
MC: Adjunctive hyperbaric oxygen therapy for healing of chronic
diabetic foot ulcers: A randomized controlled trial. J Wound Ostomy
Continence Nurs. 44:536–545. 2017. View Article : Google Scholar : PubMed/NCBI
|
|
10
|
Wilkinson D, Nolting M, Mahadi MK, Chapman
I and Heilbronn L: Hyperbaric oxygen therapy increases insulin
sensitivity in overweight men with and without type 2 diabetes.
Diving Hyperb Med. 45:30–36. 2015.PubMed/NCBI
|
|
11
|
Wilkinson D, Chapman IM and Heilbronn LK:
Hyperbaric oxygen therapy improves peripheral insulin sensitivity
in humans. Diabet Med. 29:986–989. 2012. View Article : Google Scholar : PubMed/NCBI
|
|
12
|
Nagatomo F, Takemura A, Roy RR, Fujino H,
Kondo H and Ishihara A: Mild hyperbaric oxygen inhibits the
growth-related decline in skeletal muscle oxidative capacity and
prevents hyperglycemia in rats with type 2 diabetes mellitus. J
Diabetes. 10:753–763. 2018. View Article : Google Scholar : PubMed/NCBI
|
|
13
|
Liu Y, Zhang D, Yuan J, Song L, Zhang C,
Lin Q, Li M, Sheng Z, Ma Z, Lv F, et al: Hyperbaric oxygen
ameliorates insulin sensitivity by increasing GLUT4 expression in
skeletal muscle and stimulating UCP1 in brown adipose tissue in
T2DM mice. Front Endocrinol (Lausanne). 11:322020. View Article : Google Scholar : PubMed/NCBI
|
|
14
|
Jansson L and Hellerström C: Stimulation
by glucose of the blood flow to the pancreatic islets of the rat.
Diabetologia. 25:45–50. 1983. View Article : Google Scholar : PubMed/NCBI
|
|
15
|
Kleinert M, Clemmensen C, Hofmann SM,
Moore MC, Renner S, Woods SC, Huypens P, Beckers J, de Angelis MH,
Schürmann A, et al: Animal models of obesity and diabetes mellitus.
Nat Rev Endocrinol. 14:140–162. 2018. View Article : Google Scholar : PubMed/NCBI
|
|
16
|
Yu T, Sungelo MJ, Goldberg IJ, Wang H and
Eckel RH: Streptozotocin-treated high fat fed mice: A new type 2
diabetes model used to study canagliflozin-induced alterations in
lipids and lipoproteins. Horm Metab Res. 49:400–406. 2017.
View Article : Google Scholar : PubMed/NCBI
|
|
17
|
Yuan J, Jiang Q, Song L, Liu Y, Li M, Lin
Q, Li Y, Su K, Ma Z, Wang Y, et al: L-Carnitine is involved in
hyperbaric oxygen-mediated therapeutic effects in high fat
diet-induced lipid metabolism dysfunction. Molecules. 25:1762020.
View Article : Google Scholar : PubMed/NCBI
|
|
18
|
Zhang D, Yu YJ, Xu FS, Yuan JH, Wang R,
Zhang CS, Wang LX, Liu Y, Song LM, Liu JL and Dong J: Recombinant
betatrophin (Angptl-8/lipasin) ameliorates streptozotocin-induced
hyperglycemia and β-cell destruction in neonatal rats. Mol Med Rep.
20:4523–4532. 2019.PubMed/NCBI
|
|
19
|
Song L, Yuan J, Liu Y, Zhang D, Zhang C,
Lin Q, Li M, Su K, Li Y, Gao G, et al: Ghrelin system is involved
in improvements in glucose metabolism mediated by hyperbaric oxygen
treatment in a streptozotocin-induced type 1 diabetes mouse model.
Mol Med Rep. 22:3767–3776. 2020.PubMed/NCBI
|
|
20
|
Jensen TL, Kiersgaard MK, Sørensen DB and
Mikkelsen LF: Fasting of mice: A review. Lab Anim. 47:225–240.
2013. View Article : Google Scholar : PubMed/NCBI
|
|
21
|
Wei X, Gu N, Feng N, Guo X and Ma X:
Inhibition of p38 mitogen-activated protein kinase exerts a
hypoglycemic effect by improving β cell function via inhibition of
β cell apoptosis in db/db mice. J Enzyme Inhib Med Chem.
33:1494–1500. 2018. View Article : Google Scholar : PubMed/NCBI
|
|
22
|
Cui X, Wang B, Wu Y, Xie L, Xun P, Tang Q,
Cai W and Shen X: Vegetarians have a lower fasting insulin level
and higher insulin sensitivity than matched omnivores: A
cross-sectional study. Nutr Metab Cardiovasc Dis. 29:467–473. 2019.
View Article : Google Scholar : PubMed/NCBI
|
|
23
|
Kou K, Saisho Y, Satoh S, Yamada T and
Itoh H: Change in β-cell mass in Japanese nondiabetic obese
individuals. J Clin Endocrinol Metab. 98:3724–3730. 2013.
View Article : Google Scholar : PubMed/NCBI
|
|
24
|
Lautenbach A, Wernecke M, Riedel N, Veigel
J, Yamamura J, Keller S, Jung R, Busch P, Mann O, Knop FK, et al:
Adaptive changes in pancreas post Roux-en-Y gastric bypass induced
weight loss. Diabetes Metab Res Rev. 34:e30252018. View Article : Google Scholar : PubMed/NCBI
|
|
25
|
Poret JM, Souza-Smith F, Marcell SJ,
Gaudet DA, Tzeng TH, Braymer HD, Harrison-Bernard LM and Primeaux
SD: High fat diet consumption differentially affects adipose tissue
inflammation and adipocyte size in obesity-prone and
obesity-resistant rats. Int J Obes (Lond). 42:535–541. 2018.
View Article : Google Scholar : PubMed/NCBI
|
|
26
|
Siersbæk MS, Ditzel N, Hejbøl EK,
Præstholm SM, Markussen LK, Avolio F, Li L, Lehtonen L, Hansen AK,
Schrøder HD, et al: C57BL/6J substrain differences in response to
high-fat diet intervention. Sci Rep. 10:140522020. View Article : Google Scholar : PubMed/NCBI
|
|
27
|
Faselis C, Katsimardou A, Imprialos K,
Deligkaris P, Kallistratos M and Dimitriadis K: Microvascular
complications of type 2 diabetes mellitus. Curr Vasc Pharmacol.
18:117–124. 2020. View Article : Google Scholar : PubMed/NCBI
|
|
28
|
Stumvoll M and Gerich J: Clinical features
of insulin resistance and beta cell dysfunction and the
relationship to type 2 diabetes. Clin Lab Med. 21:31–51.
2001.PubMed/NCBI
|
|
29
|
Elosta A, Ghous T and Ahmed N: Natural
products as anti-glycation agents: possible therapeutic potential
for diabetic complications. Curr Diabetes Rev. 8:92–108. 2012.
View Article : Google Scholar : PubMed/NCBI
|
|
30
|
Guo S: Insulin signaling, resistance, and
the metabolic syndrome: insights from mouse models into disease
mechanisms. J Endocrinol. 220:T1–T23. 2014. View Article : Google Scholar : PubMed/NCBI
|
|
31
|
Utumatwishima JN, Chung ST, Bentley AR,
Udahogora M and Sumner AE: Reversing the tide-diagnosis and
prevention of T2DM in populations of African descent. Nat Rev
Endocrinol. 14:45–56. 2018. View Article : Google Scholar : PubMed/NCBI
|
|
32
|
DeFronzo RA, Ferrannini E, Groop L, Henry
RR, Herman WH, Holst JJ, Hu FB, Kahn CR, Raz I, Shulman GI, et al:
Type 2 diabetes mellitus. Nat Rev Dis Primers. 1:150192015.
View Article : Google Scholar : PubMed/NCBI
|
|
33
|
Kitamura T: The role of FOXO1 in β-cell
failure and type 2 diabetes mellitus. Nat Rev Endocrinol.
9:615–623. 2013. View Article : Google Scholar : PubMed/NCBI
|
|
34
|
Freeman AM and Pennings N: Insulin
Resistance. StatPearls (Internet); Treasure Island, FL: 2021
https://www.ncbi.nlm.nih.gov/books/NBK507839July
10–2021
|
|
35
|
Hjermann I: The metabolic cardiovascular
syndrome: Syndrome X, Reaven's syndrome, insulin resistance
syndrome, atherothrombogenic syndrome. J Cardiovasc Pharmacol. 20
(Suppl 8):S5–S10. 1992. View Article : Google Scholar : PubMed/NCBI
|
|
36
|
Stumvoll M and Häring H: Insulin
resistance and insulin sensitizers. Horm Res. 55 (Suppl 2):3–13.
2001.PubMed/NCBI
|
|
37
|
Klip A and Pâquet MR: Glucose transport
and glucose transporters in muscle and their metabolic regulation.
Diabetes Care. 13:228–243. 1990. View Article : Google Scholar : PubMed/NCBI
|
|
38
|
Rui L: Energy metabolism in the liver.
Compr Physiol. 4:177–197. 2014. View Article : Google Scholar : PubMed/NCBI
|
|
39
|
Faleo G, Fotino C, Bocca N, Molano RD,
Zahr-Akrawi E, Molina J, Villate S, Umland O, Skyler JS, Bayer AL,
et al: Prevention of autoimmune diabetes and induction of β-cell
proliferation in NOD mice by hyperbaric oxygen therapy. Diabetes.
61:1769–1778. 2012. View Article : Google Scholar : PubMed/NCBI
|
|
40
|
Matsunami T, Sato Y, Hasegawa Y, Ariga S,
Kashimura H, Sato T and Yukawa M: Enhancement of reactive oxygen
species and induction of apoptosis in streptozotocin-induced
diabetic rats under hyperbaric oxygen exposure. Int J Clin Exp
Pathol. 4:255–266. 2011.PubMed/NCBI
|