Introduction
Lung adenocarcinoma (LUAD) is a disease characterized by rapid progression and poor prognosis. Worldwide, LUAD has the highest instance of all types of cancer in men and the second-highest incidence in women, although the incidence of lung cancer has declined in recent years (1). LUAD is the leading cause of cancer-related deaths worldwide (2). Although progress has been reported in the diagnosis and treatment of lung cancer, the disease prognosis is still poor and the 5-year overall survival (OS) rate is only 15% (3,4). At present, an effective means of early detection is lacking, and the current biomarkers for early diagnosis of lung cancer lack specificity and sensitivity. The causes of the high mortality associated with LUAD are attributed to a high rate of metastasis and drug resistance in the middle and late stages of the disease (5). With progress in medical technology, in the past 10 years, the treatment scheme of LUAD has significantly improved (6); however, the LUAD risk stratification strategy and prognosis assessment scheme do not satisfactorily meet the clinical needs of patients.
The wide application of second-generation sequencing technologies, massive sequencing of public tumor databases and clinical information provide a technical basis for gene marker screening. Numerous studies to identify new prognostic biomarkers have been performed by scientists in China and worldwide to improve risk stratification and prognostic assessment in different LUAD subgroups (7). Important signaling pathways related to tumorigenesis and progression, such as the immune microenvironment, ferroptosis, lipid and energy metabolism, DNA repair and damage-related genes, can be used as prognostic tools after bioinformatics model processing (8–10). Furthermore, Bruton tyrosine kinase (BTK) (11), EGFR, ALK and ROS1 (12) genes have been reported to be effective single molecular markers for prognosis. However, the clinical application of these gene markers is limited. It is necessary to evaluate the potential novel gene markers of LUAD and the mutual regulation between genes which can then affect the signaling pathway of tumors (13). The gene deletion of any one of the NADPH oxidase isoform 2 (NOX2) subunits CYBA, CYBB, neutrophil cytosolic factor 1 (NCF1), NCF2 and NCF4 can reduce lung cancer metastasis as reported by a recent study (14). Based on previous reports, NOX2 may be a targeted immune checkpoint in cancer (15,16).
The tumor microenvironment (TME) refers to the cellular environment that includes tumor cells, immune cells and stromal cells. It serves an important role in tumor proliferation, invasion, metastasis and drug resistance (17,18). An important component of the TME is tumor-infiltrating immune cells (TICs). TICs can regulate tumor progression via their participation in the TME ecosystem, which produces changes that have potential prognostic value (19–21). Moreover, TICs can be effectively targeted using drugs (19,22). In the present study, RNA sequencing data from The Cancer Genome Atlas (TCGA) for patients with LUAD were used and the immune-related tumor markers composed of immune-related genes related to LUAD were evaluated. The development of immunotherapy for patients with LUAD is also under way (23). To the best of our knowledge, the expression pattern of NOX2 in LUAD, its prognostic value and whether or how it affects the immune microenvironment of patients with LUAD has not yet been reported. In the present study, bioinformatics tools were used to evaluate the expression pattern, prognostic value and potential biological function of NOX2 in patients with LUAD.
Materials and methods
Data
The analysis process of the present study is presented in Fig. 1. Single-cell transcriptomic RNA sequencing data (n=540; tumor cases, n=486; normal cases, n=54;) and related clinicopathological characteristics, including age, sex, pathological stage and tumor (T)/node (N)/metastasis (M) classification of LUAD samples were downloaded from TCGA database (Table SI) (24). The ESTIMATE (25) algorithm (version 1.0.10), an open-source web tool, was used to calculate the proportions of scores of immune cells, stromal cells in LUAD samples using the ‘estimate’ package.
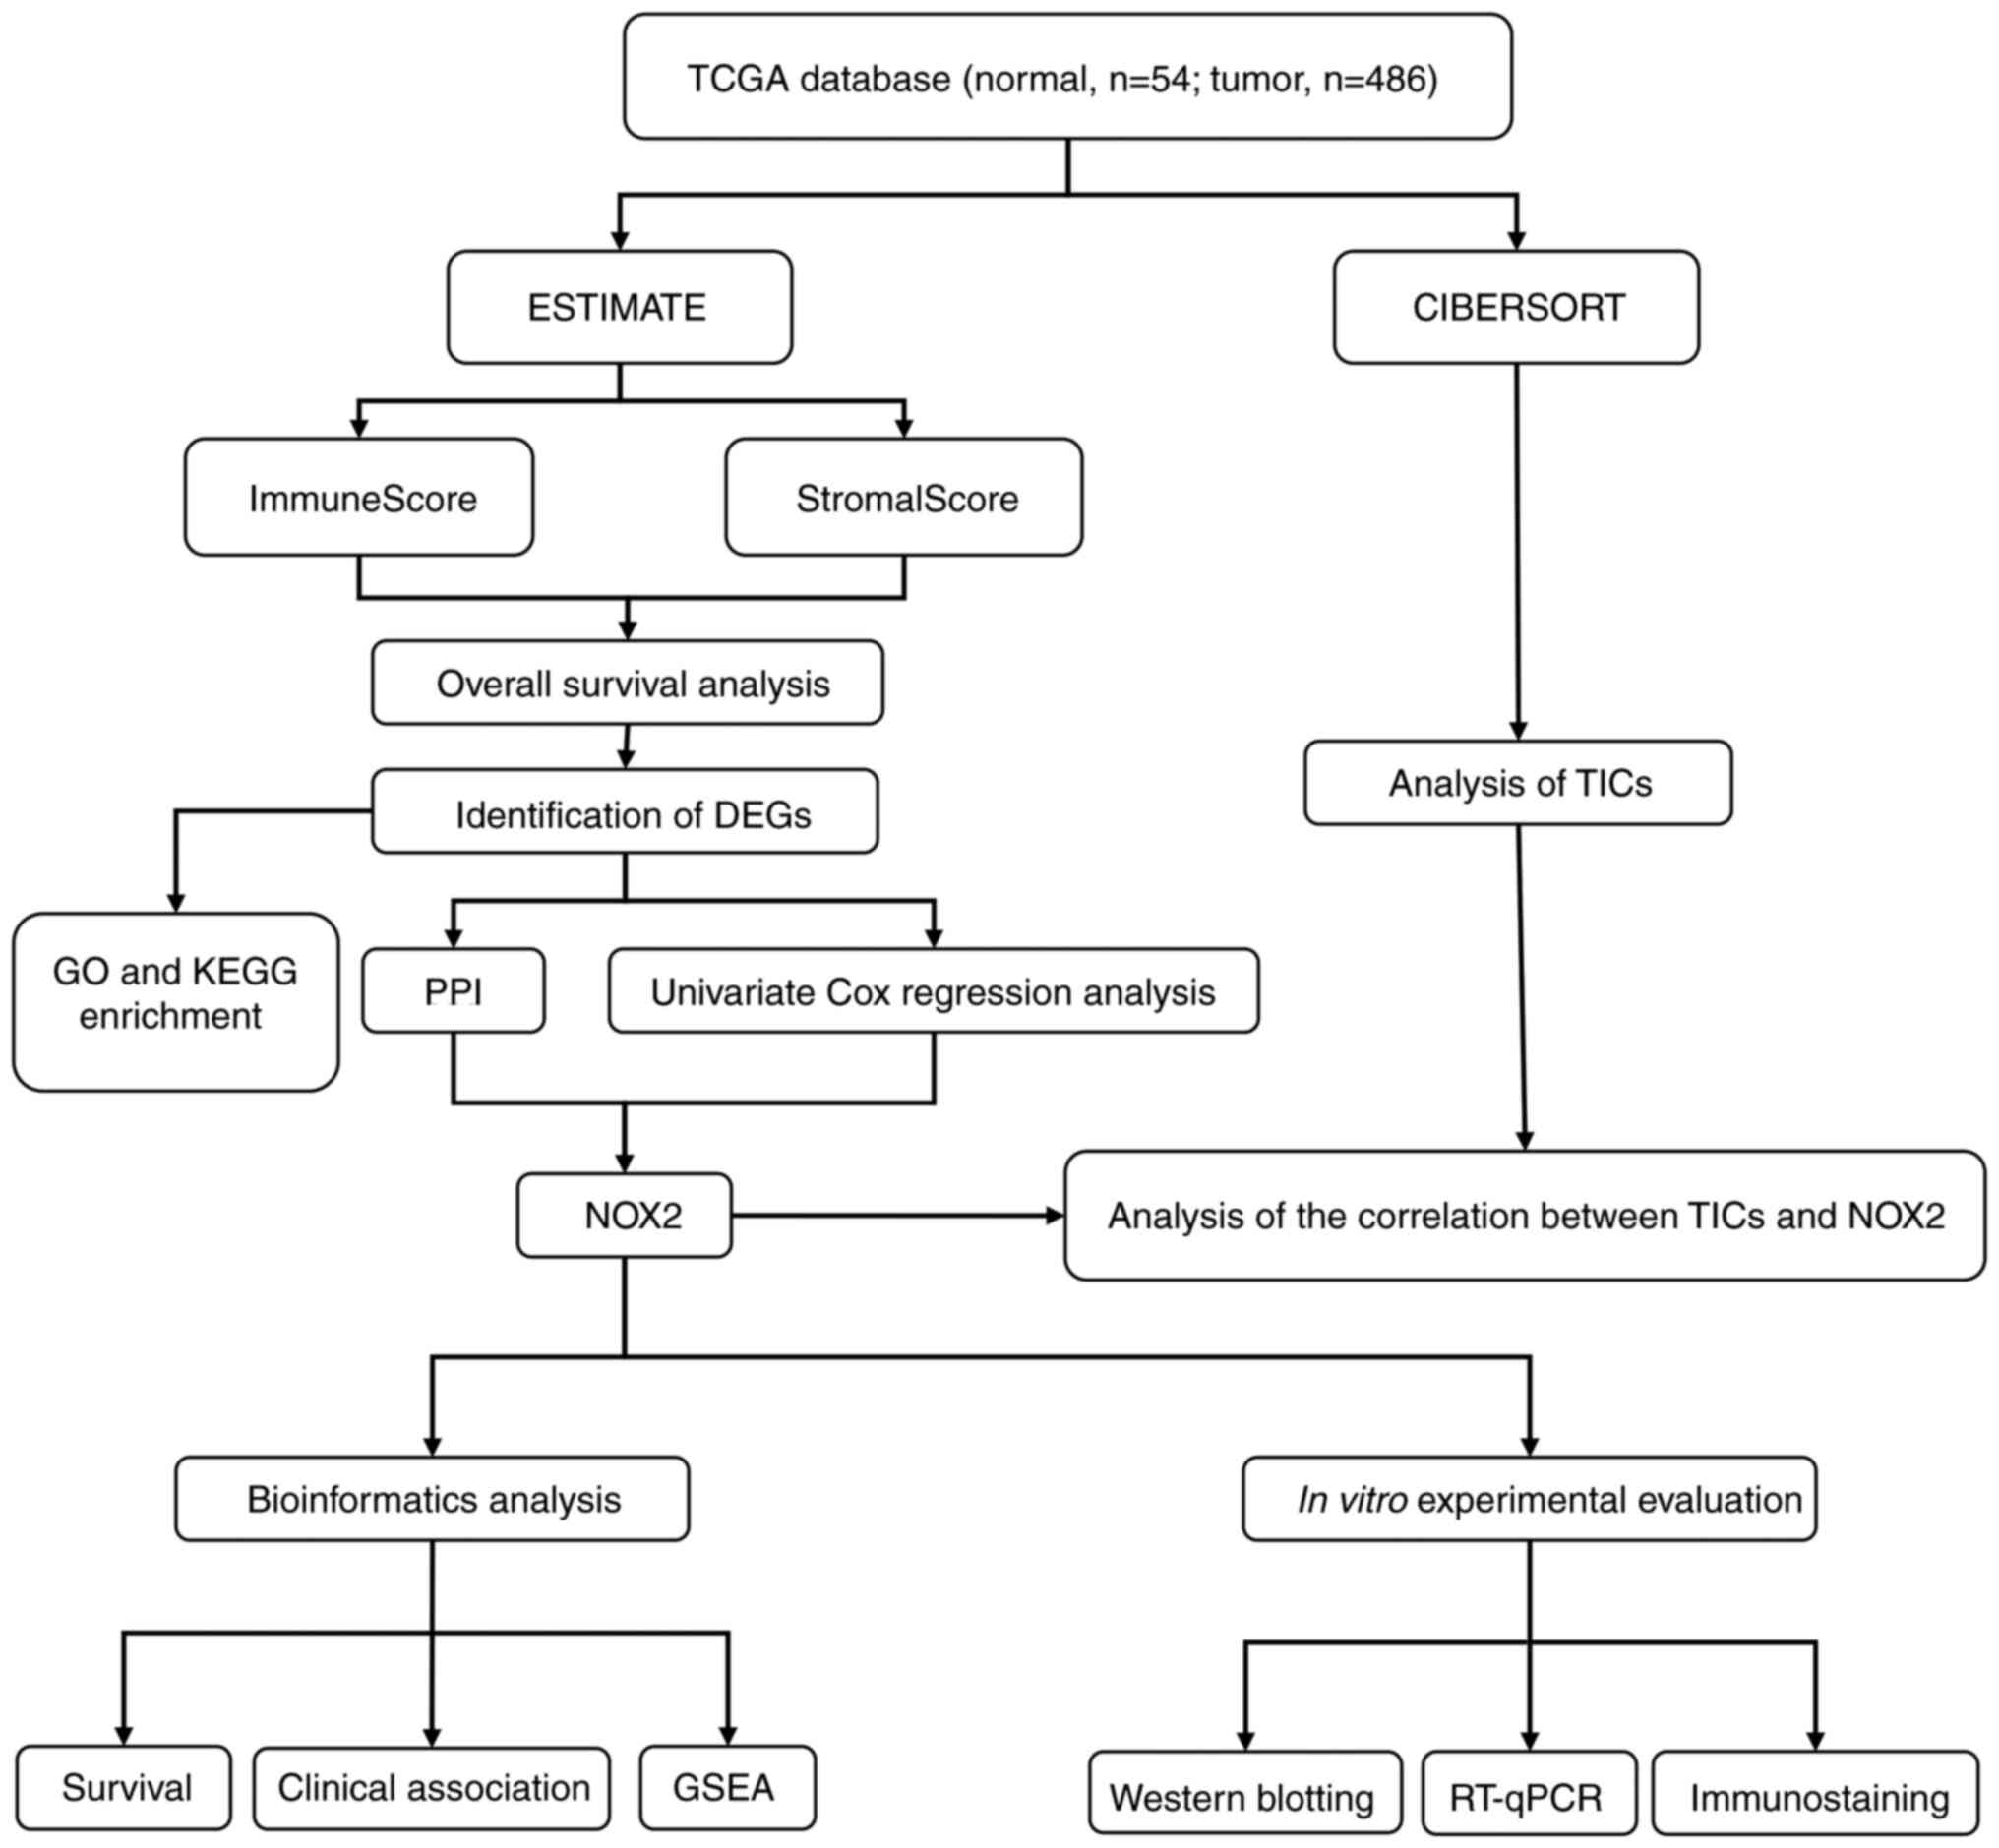 |
Figure 1.
Diagram of the workflow of the present study. TCGA, The Cancer Genome Atlas; DEGs, differentially expressed genes; GO, Gene Ontology; KEGG, Kyoto Encyclopedia of Genes and Genomes; PPI, protein-protein interaction; NOX2, NADPH oxidase isoform 2; GSEA, Gene Set Enrichment Analysis; TICs, tumor-infiltrating immune cells; RT-qPCR, reverse transcription-quantitative PCR.
|
Microenvironment scoring
Immune cells and non-cancer stromal cells comprise the TME. The ESTIMATE algorithm for R (version 4.0.3; http://www.r-project.org/) and R ‘limma’ Bioconductor package (version 3.34.9; http://www.bioconductor.org/packages/release/bioc/html/limma.html) was used to assess the two types of cells in the microenvironment (26), and the ImmuneScore and StromalScore were calculated. The sum of the two types of cells was the ESTIMATEScore. The higher the ESTIMATEScore, the higher the overall content of immune cells and stromal cells, and the smaller the proportion of tumor cells.
Clinical survival analysis
The R ‘survival’ package (version 3.1-8, http://CRAN.R-project.org/package=survival) was used for Kaplan-Meier survival analysis and the log-rank test was performed to analyze significance. Clinical parameters, including age, sex, pathological stage, grade and T/N/M classification, were assessed using R software.
Heatmaps and differentially expressed genes (DEGs) analysis
The stromal cell and immune cell scores were divided into a high score group and a low score group, using the median value of all cells as the cutoff. R (version 4.0.3) and the R ‘limma’ package (26) was used to perform differentiation analysis of the gene expression and to draw the heatmaps. False discovery rate (FDR)<0.05 and |logFC|>1 were considered to indicate significance for screening of the DEGs.
Enrichment analysis
Two approaches were used for the enrichment analysis of DEGs. Differences were evaluated using Gene Ontology (GO) (27) terms, including biological process, molecular function and cellular component terms. DEGs were subjected to molecular function and pathway studies using Gene Ontology (GO) analysis and Kyoto Encyclopedia of Genes and Genomes (KEGG) pathway analysis (28). GO and KEGG analyses were performed using the clusterProfiler (version 3.10.1; http://bioconductor.org/packages/release/bioc/html/clusterProfiler.html) package (29).
Construction of the protein-protein interaction (PPI) network
The related genes obtained by enrichment analysis were input into the STRING (30) database and a PPI network was generated using a confidence level of >0.95. The PPI network was visualized using Cytoscape (31) (version 3.6.1).
Cox regression analysis
Univariate Cox proportional hazards regression was used to further screen for DEGs with prognostic value and forest plots were generated using the R ‘survival’ package with FDR<0.05.
Gene set enrichment analysis (GSEA)
The downloaded c2.cp.KEGG.v7.1.symbols.gmt and c7.all.v7.1.symbols.gmt datasets (https://www.gsea-msigdb.org/gsea/downloads.jsp) were downloaded from the Molecular Signatures Database data bank on the GSEA website and were analyzed using GSEA 4.0.3 software (32). Moreover, to evaluate the functions of both the high and low expression groups, gene set permutations were performed 1,000 times for each analysis. The number of DEGs expressed in each sample were output into expression data files. TCGA samples were divided into two groups according to the median of the number of expressed genes in the sample and organized into phenotypic data files and GSEA was performed based on these two data files.
Cell culture
The human bronchial epithelial BEAS-2B cell line and human lung cancer NCI-H1975 cell line were donated by Qingdao University (Qingdao, China). BEAS-2B and NCI-H1975 cells were both cultured in RPMI 1640 (Thermo Fisher Scientific, Inc.) complete medium containing 10% FBS (Invitrogen; Thermo Fisher Scientific, Inc.) at 37°C in an atmosphere containing 5% CO2.
Western blotting
Protein samples were extracted from cell lines using radioimmunoprecipitation assay lysis buffer (Beijing Solarbio Science & Technology Co., Ltd.) containing 1% phenylmethylsulfonyl fluoride. The concentration of protein was assessed using a BCA Protein Quantification kit (Beyotime Institute of Biotechnology). A total of 20 µg protein was loaded per lane. SDS-PAGE (12.5%) was used to separate the total proteins, which were then transferred to polyvinylidene difluoride membranes. The membranes were blocked using 5% skimmed milk at 4°C for 1 h and incubated with primary antibodies at 4°C overnight as follows: NOX2 (1:1,500; cat. no. A1636; ABclonal Biotech Co., Ltd.) and β-actin (1:50,000; cat. no. ab8227; Abcam). Membranes were then incubated with secondary goat anti-mouse IgG-HRP (1:5,000; cat. no. ab6789; Abcam) antibodies for 1 h at room temperature. Proteins were visualized using enhanced chemiluminescence ECL kit (Shanghai Saiyi Biotechnology Co., Ltd.; Dalian Meilun Biology Technology Co., Ltd.). ImageJ software (version 1.8.0; National Institutes of Health) for quantitative analysis.
Reverse transcription-quantitative PCR (RT-qPCR)
The total RNA was extracted from cell lines (BEAS-2B and NCI-H1975) using an RNA Easy Fast Tissue/Cell kit (DP451; Tiangen Biotech Co., Ltd.) according to the manufacturer's protocol. Reverse transcription was performed using the ABScript II cDNA First-Strand Synthesis Kit (RK20400; ABclonal Biotech Co., Ltd.) according to the manufacturer's protocols. The thermocycling conditions used were as follows: 25°C for 5 min; 42°C for 15 min; 85°C for 5 sec and were held at 4°C. NOX2 and GAPDH primers were purchased from Shanghai Sangon Biotech Co., Ltd. The primers used were as follows: NOX2 forward (F), 5′-GTGATGTTAGTGGGAGCAGGGATTG-3′ and reverse (R), 5′-GCTTCAGATTGGTGGCGTTATTGC-3′; and GAPDH F, 5′-AGTCCTTCCACGATACCA-3′ and R, 5′-TATGACAACAGCCTCAAGAT-3′. GAPDH was used as the internal reference. The thermocycling conditions used were as follows: 1 cycle at 95°C for 3 min; then 40 cycles at 95°C for 5 sec and 60°C for 30 sec. The mRNA expression levels of NOX2 were quantified using the 2−ΔΔCq method (33).
Immunostaining analysis
The cancer tissues and adjacent para-carcinoma tissues were obtained from the Department of Pathology, The Fangzi People's Hospital; tumor and matching para-carcinoma tissues were obtained from the same patients with LUAD. Immunohistochemical staining was performed according to a previously reported experimental procedure (34). Sections were incubated with anti-NOX2 rabbit primary antibodies (1:200; cat. no. A1636; ABclonal Biotech Co., Ltd.) and secondary goat anti-mouse IgG-HRP (1:200; cat. no. AS003; ABclonal Biotech Co., Ltd.) antibodies. The expression of NOX2 in tumor and para-carcinoma tissues were evaluated using the histochemistry score (H-Score). The calculation of the H-Score (range, 0–300) was based on the percentage of NOX2 expression (0–100%) multiplied by staining intensity (0, negative; 1, weak; 2, moderate; and 3, strong) (35). The intensity of the staining was scored by a pathologist.
TIC assessment
The cell type analysis tool CIBERSORT (36) can estimate the proportion of TICs from complex sample expression profiles. In the present study, CIBERSORT (version 1.03) was used to estimate the proportions of 22 TICs in each sample. A bar diagram was used to present the results. Using differential analysis and correlation analysis between immune cells and NOX2, the correlation between TICs and the expression levels of NOX2 were evaluated.
Statistical analysis
GraphPad Prism 5 (GraphPad Software, Inc.) was used for statistical analysis. Scatter plots were drawn using the ggplot2 R package (version 3.3.0; http://rdocumentation.org/packages/ggplot2/versions/3.3.0) in R-studio (version, 4.0.3; http://www.r-project.org/). Normally distributed data were presented as the mean ± standard deviation and the comparison between two groups was performed using paired Student's t-test. Survival difference analysis P-values were generated using log-rank test, and hazard coefficients were generated using univariate Cox hazard regression. Comparisons of gene and protein expression among the groups were performed using Kruskal-Wallis test and Dunn's post hoc test. The relationship between gene expression and clinical characteristics was assessed using Wilcoxon rank sum and the comparison was made according to the number of clinical stages. In addition, the Wilcoxon rank sum test was used in the analysis of the differential expression of immune cells. Paired t-test was used for semi-quantitative comparison of pathological tissue sections. P<0.05 was considered to indicate a statistically significant difference. Pearson's correlation coefficient was used to test the correlation between NOX2 and TIC.
Results
Analytical process of the present study
The original data collected from TCGA database included clinical and molecular phenotypic data for 486 patients with LUAD (Table I). DEGs identified using ImmuneScore and StromalScore were used to construct the PPI network and perform univariate Cox regression analysis. Intersection analysis was then performed using the core nodes in the PPI network and the most significant factors obtained using the analysis of univariate Cox regression. Based on these results, NOX2 was further evaluated in the subsequent series of analyses, including survival and clinicopathological characteristics analyses, Cox regression, GSEA and TIC correlation analysis. The analytical process of the present study is presented in Fig. 1.
 |
Table I.
Clinicopathological characteristics of patients with LUAD from The Cancer Genome Atlas database.
|
Table I.
Clinicopathological characteristics of patients with LUAD from The Cancer Genome Atlas database.
| Clinical characteristics |
Value (n=486) |
% |
| Age at diagnosis, years |
|
|
| ≤65 |
227 |
46.7 |
| >65 |
240 |
49.4 |
| Unknown |
19 |
3.9 |
| Sex |
|
|
| Male |
264 |
54.3 |
| Female |
222 |
45.7 |
| Stage |
|
|
| I |
262 |
53.9 |
| II |
112 |
23 |
| III |
79 |
16.4 |
| IV |
25 |
5.1 |
| Unknown |
8 |
1.6 |
| T classification |
|
|
| T1 |
163 |
35.5 |
| T2 |
260 |
53.3 |
| T3 |
41 |
8.4 |
| T4 |
19 |
4 |
| Unknown |
3 |
0.6 |
| M classification |
|
|
| M0 |
333 |
68.5 |
| M1 |
24 |
4.9 |
| MX |
125 |
125 |
| Unknown |
4 |
0.8 |
| N classification |
|
|
| N0 |
312 |
64.2 |
| N1 |
90 |
18.5 |
| N2 |
70 |
14.4 |
| N3 |
2 |
0.4 |
| NX |
11 |
2.3 |
| Unknown |
1 |
0.2 |
A higher immune component proportion of the TME is associated with improved prognosis of patients with LUAD
To evaluate the proportion of immune and stromal cells in the TME, and to further evaluate their role in tumor development, Kaplan-Meier survival analysis of stromal cells and immune cells was performed. ImmuneScore and ESTIMATEScore were significantly associated with the overall survival rate (Fig. 2A and C). By contrast, there was no significant association between StromalScore and overall survival (Fig. 2B). The scores were positively correlated with the proportion of the immune, stromal and ESTIMATE components in TME. These results suggested that there was a significant association between prognosis and immune component proportion in patients with LUAD.
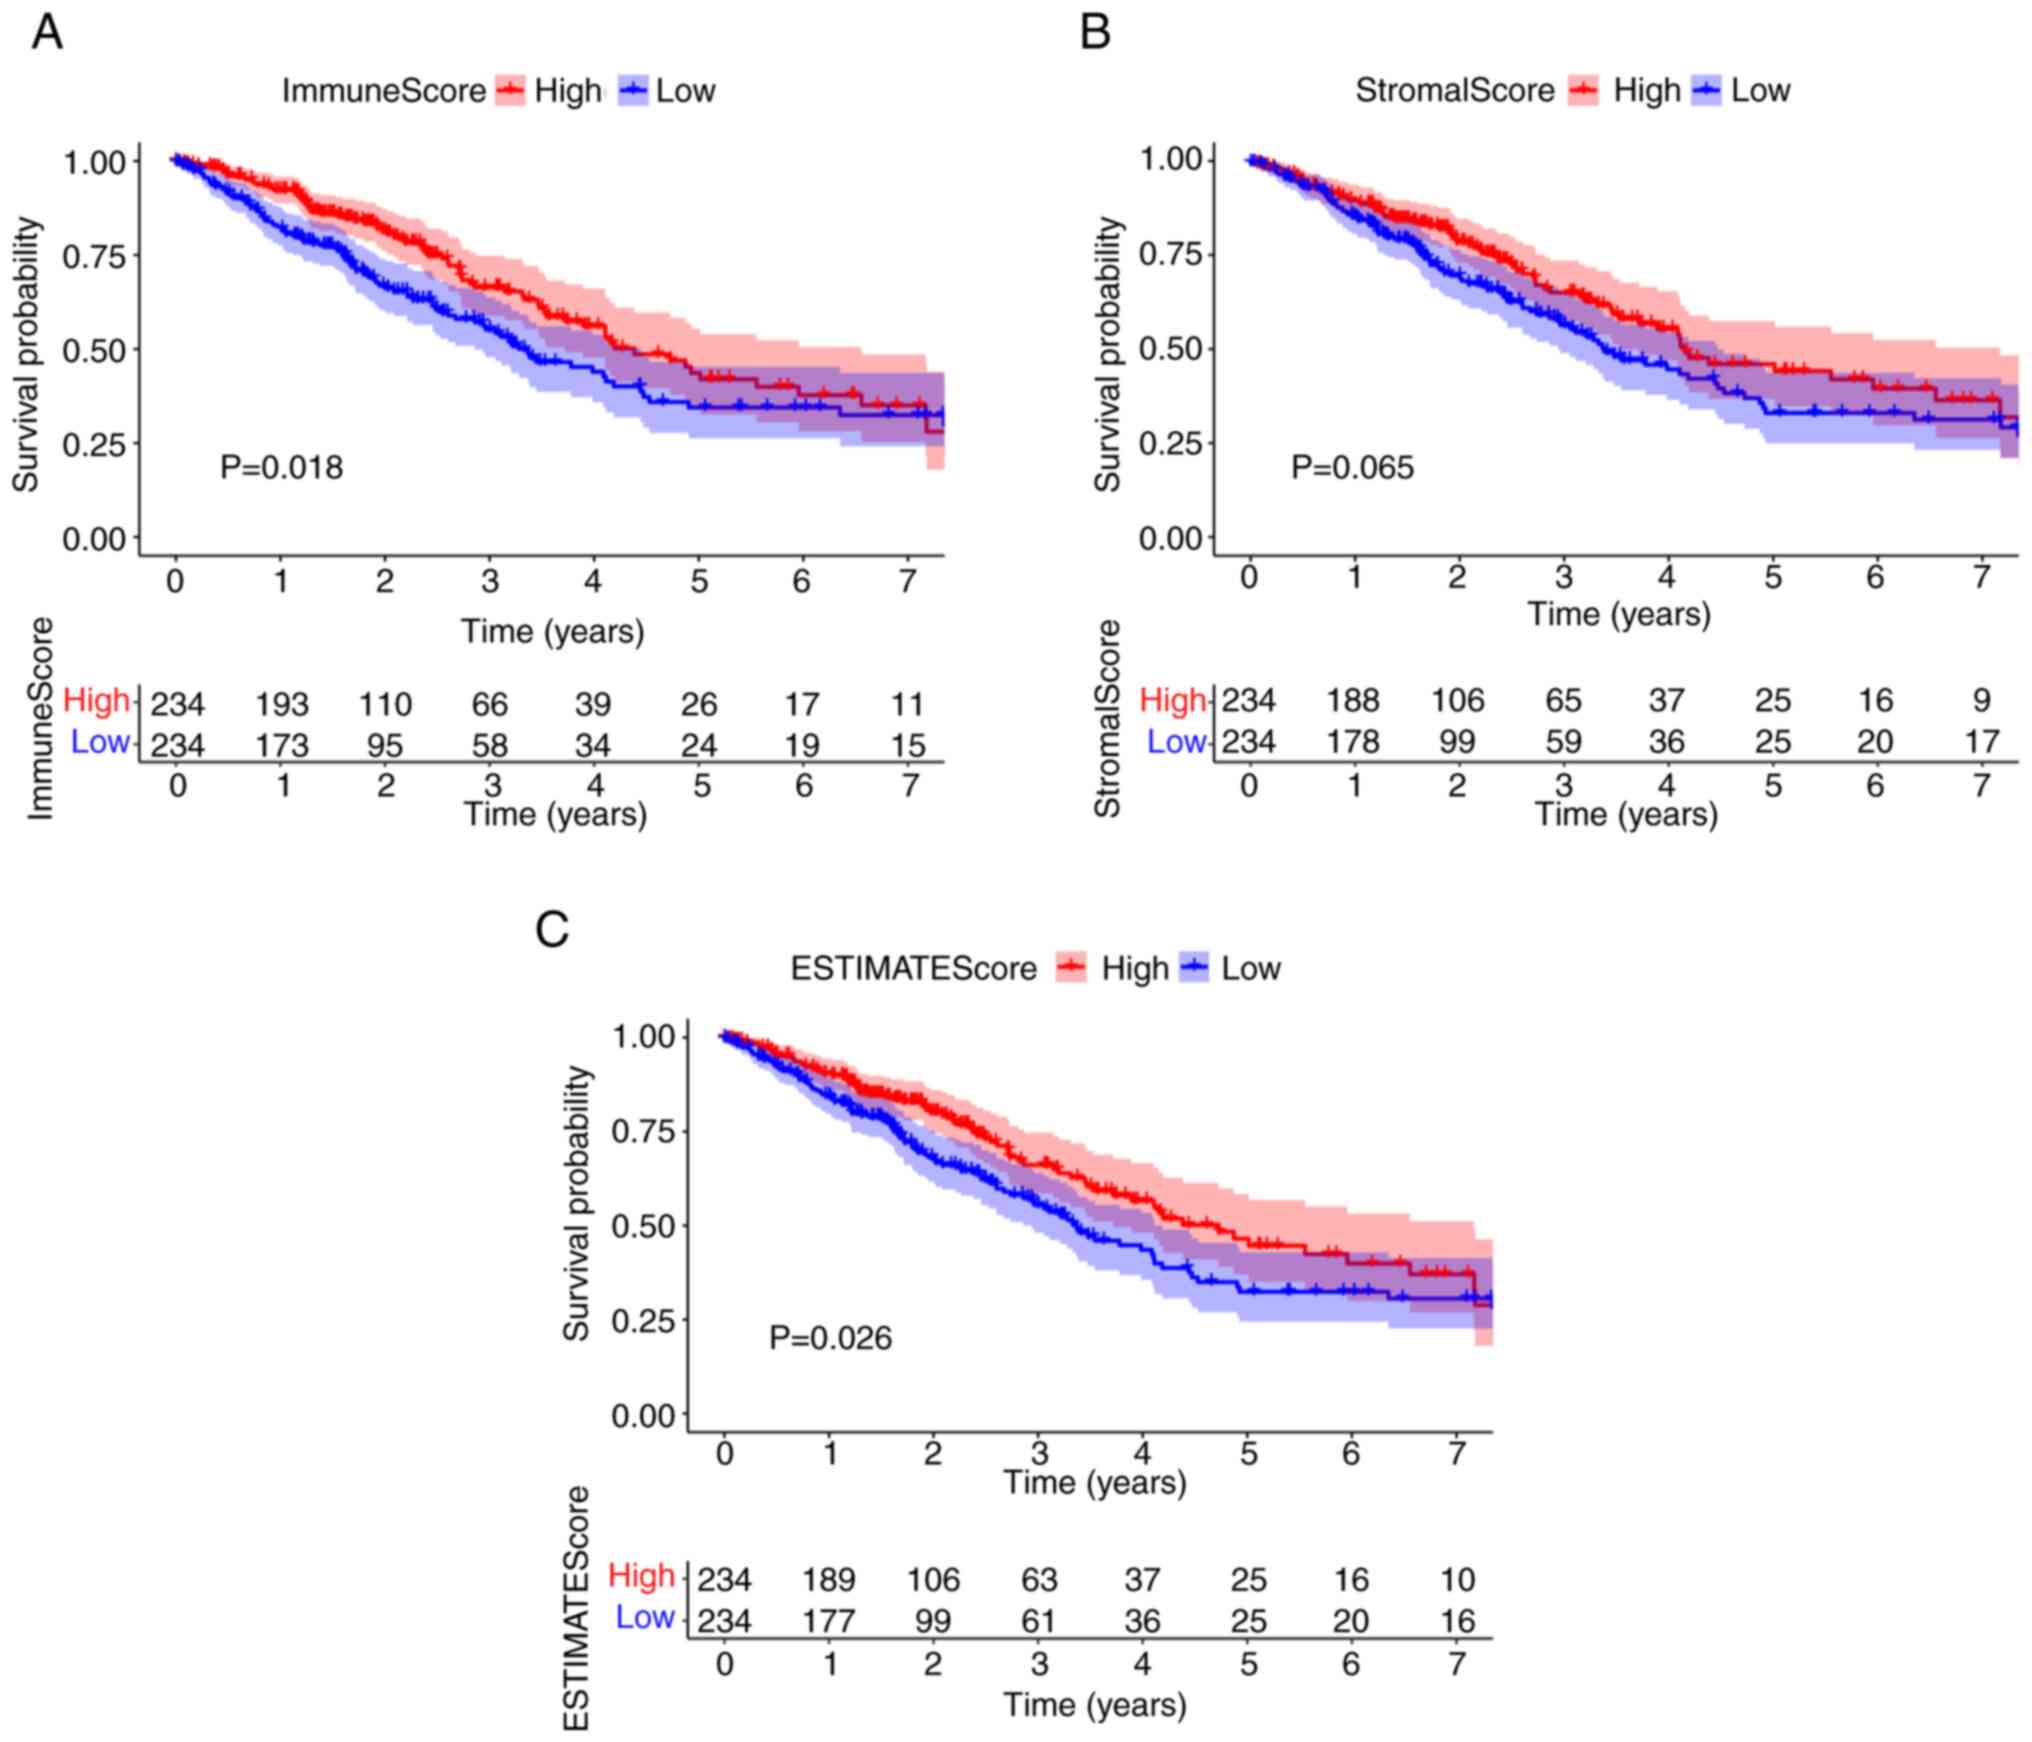 |
Figure 2.
ImmuneScore is associated with the overall survival of patients with LUAD. (A) LUAD cases were grouped into high or low score groups, based on the ImmuneScore median value, and a Kaplan-Meier survival curve was plotted. (B) Kaplan-Meier survival curve for StromalScore. (C) Kaplan-Meier survival curve for ESTIMATEScore. LUAD, lung adenocarcinoma.
|
Immune and matrix component scores are associated with the clinicopathological staging of patients with LUAD
The relationship between the immune and matrix component scores and the clinical characteristics was also assessed. Notably, there was no significant association between the scores and age or sex (Fig. S1). The analysis demonstrated that the ImmuneScore was significantly associated with several clinicopathological characteristics, including pathological stage (stage III vs. I, P=0.021; Fig. 3B) and T classification (T2 vs. T1, P=0.0022; T3 vs. T1, P=0.013; T4 vs. T1, P=0.0086; Fig. 3E), ImmuneScore was not significantly associated with M classification (Fig. 3H). Furthermore, StromalScore was significantly associated with pathological stage (stage IV vs. I, P=0.016; stage IV vs. II, P=0.023; Fig. 3C) and M classification (P=0.0043; Fig. 3I), StromalScore was not significantly associated with T classification (Fig. 3F). The ESTIMATEScore demonstrated a significant association with pathological stage (stage IV vs. I, P=0.028; Fig. 3A) and M classification (P=0.014; Fig. 3G), and was associated with T classification in a similar manner to ImmuneScore (T2 vs. T1, P=0.026; T3 vs. T1, P=0.022; T4 vs. T1, P=0.03; Fig. 3D). The association with clinical characteristics demonstrated that immune and stromal cells may serve an important role in tumor progression.
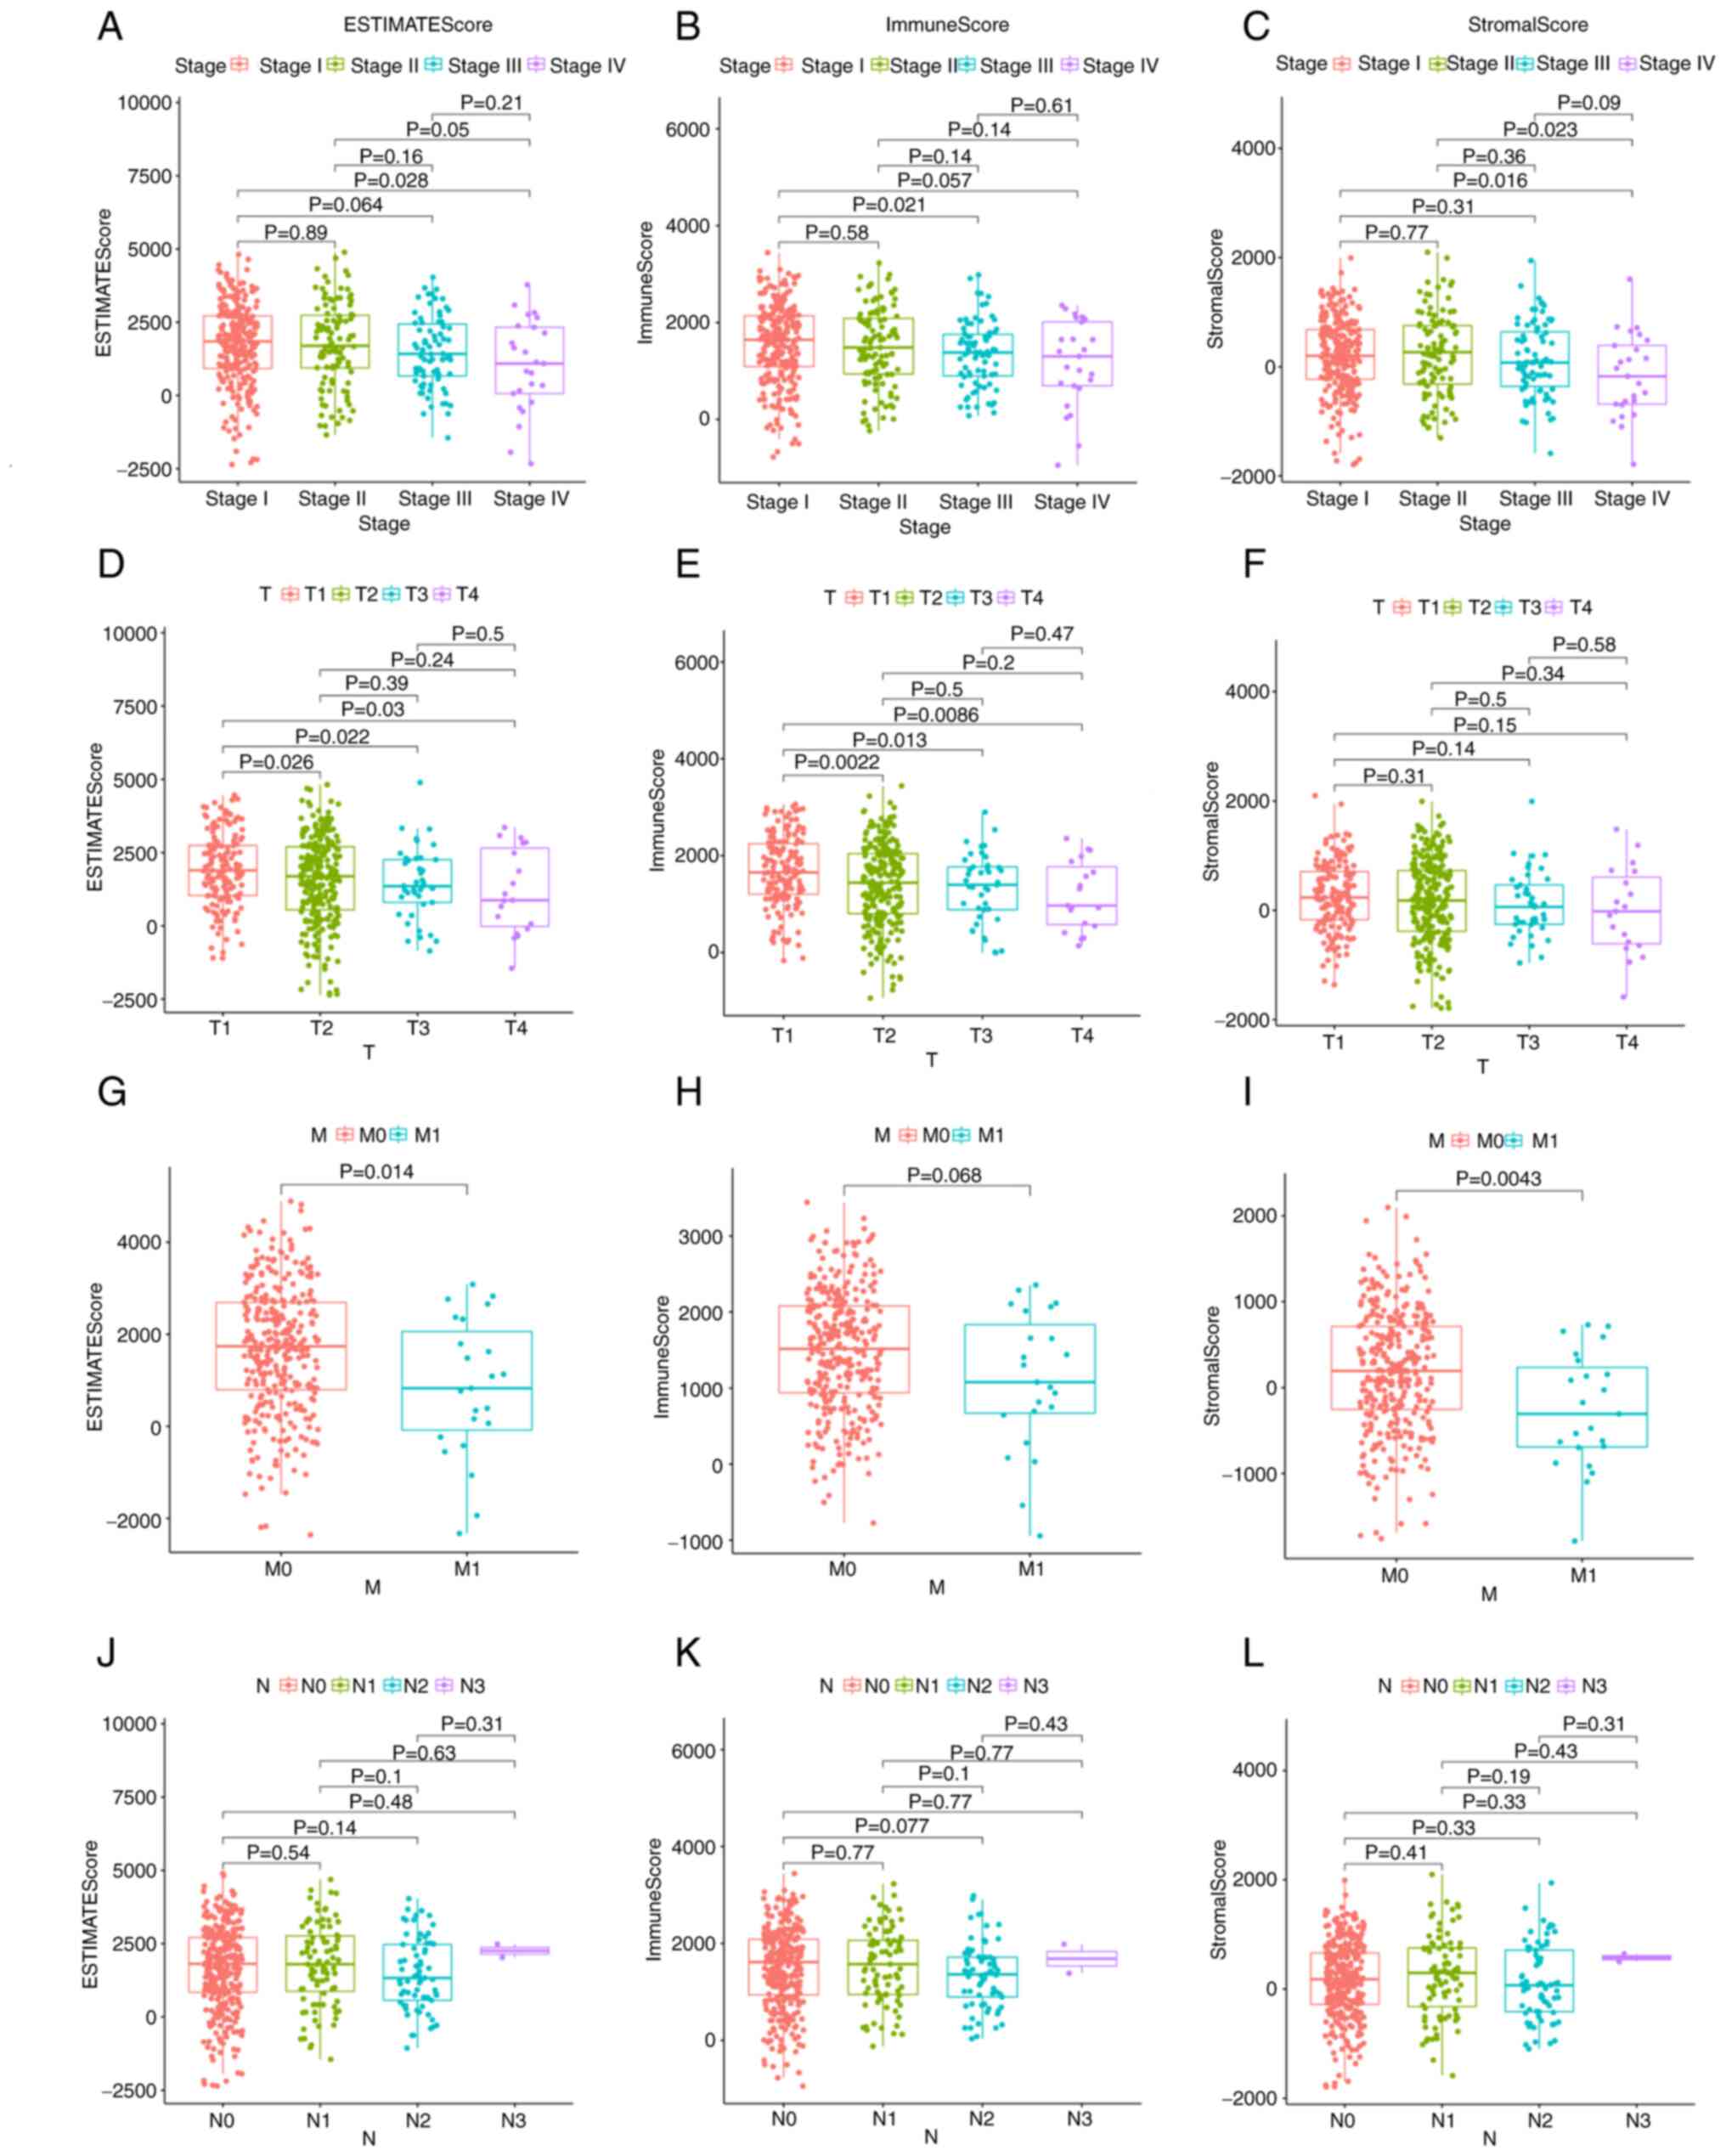 |
Figure 3.
EstimateScore, ImmuneScore and StromalScore were associated with clinicopathological characteristics. Association of (A) ESTIMATEScore, (B) ImmuneScore and (C) StromalScore with stage, as determined by Kruskal-Wallis rank sum test. Association of (D) ESTIMATEScore, (E) ImmuneScore and (F) StromalScore with T classification, as determined by Kruskal-Wallis rank sum test. Association of (G) ESTIMATEScore, (H) ImmuneScore and (I) StromalScore with M classification, as determined by Kruskal-Wallis rank sum test. Association of (J) ESTIMATEScore, (K) ImmuneScore and (L) StromalScore with N classification, as determined by Kruskal-Wallis rank sum test. N, node; M, metastasis; T, tumor.
|
DEGs in patients with LUAD are mainly concentrated in immune-related directions
After scoring the immune microenvironment of immune cells and stromal cells, we divided the two kinds of cells into high and low expression groups according to the median expression level and analyzed the differences to further evaluated which genes were different between the two groups. (Fig. S2). A total of 374 common DEGs were identified from the high and low score samples of the immune and stromal cells, including 318 upregulated genes and 56 downregulated genes (Fig. 4A and B). These co-expressed genes may serve an unusual role in LUAD. The functions of these genes were evaluated using GO enrichment analysis. The genes were mainly enriched in aspects related to immunity, such as the ‘regulation of lymphocyte activation’ and ‘T-cell activation’ (Fig. 4C). KEGG pathway enrichment analysis demonstrated that most results were concentrated in immune-related regions, such as ‘Cytokine-cytokine receptor interaction’ and ‘Chemokine signaling pathway’ (Fig. 4D), which suggested that immune factors were associated with the participation of the TME in LUAD.
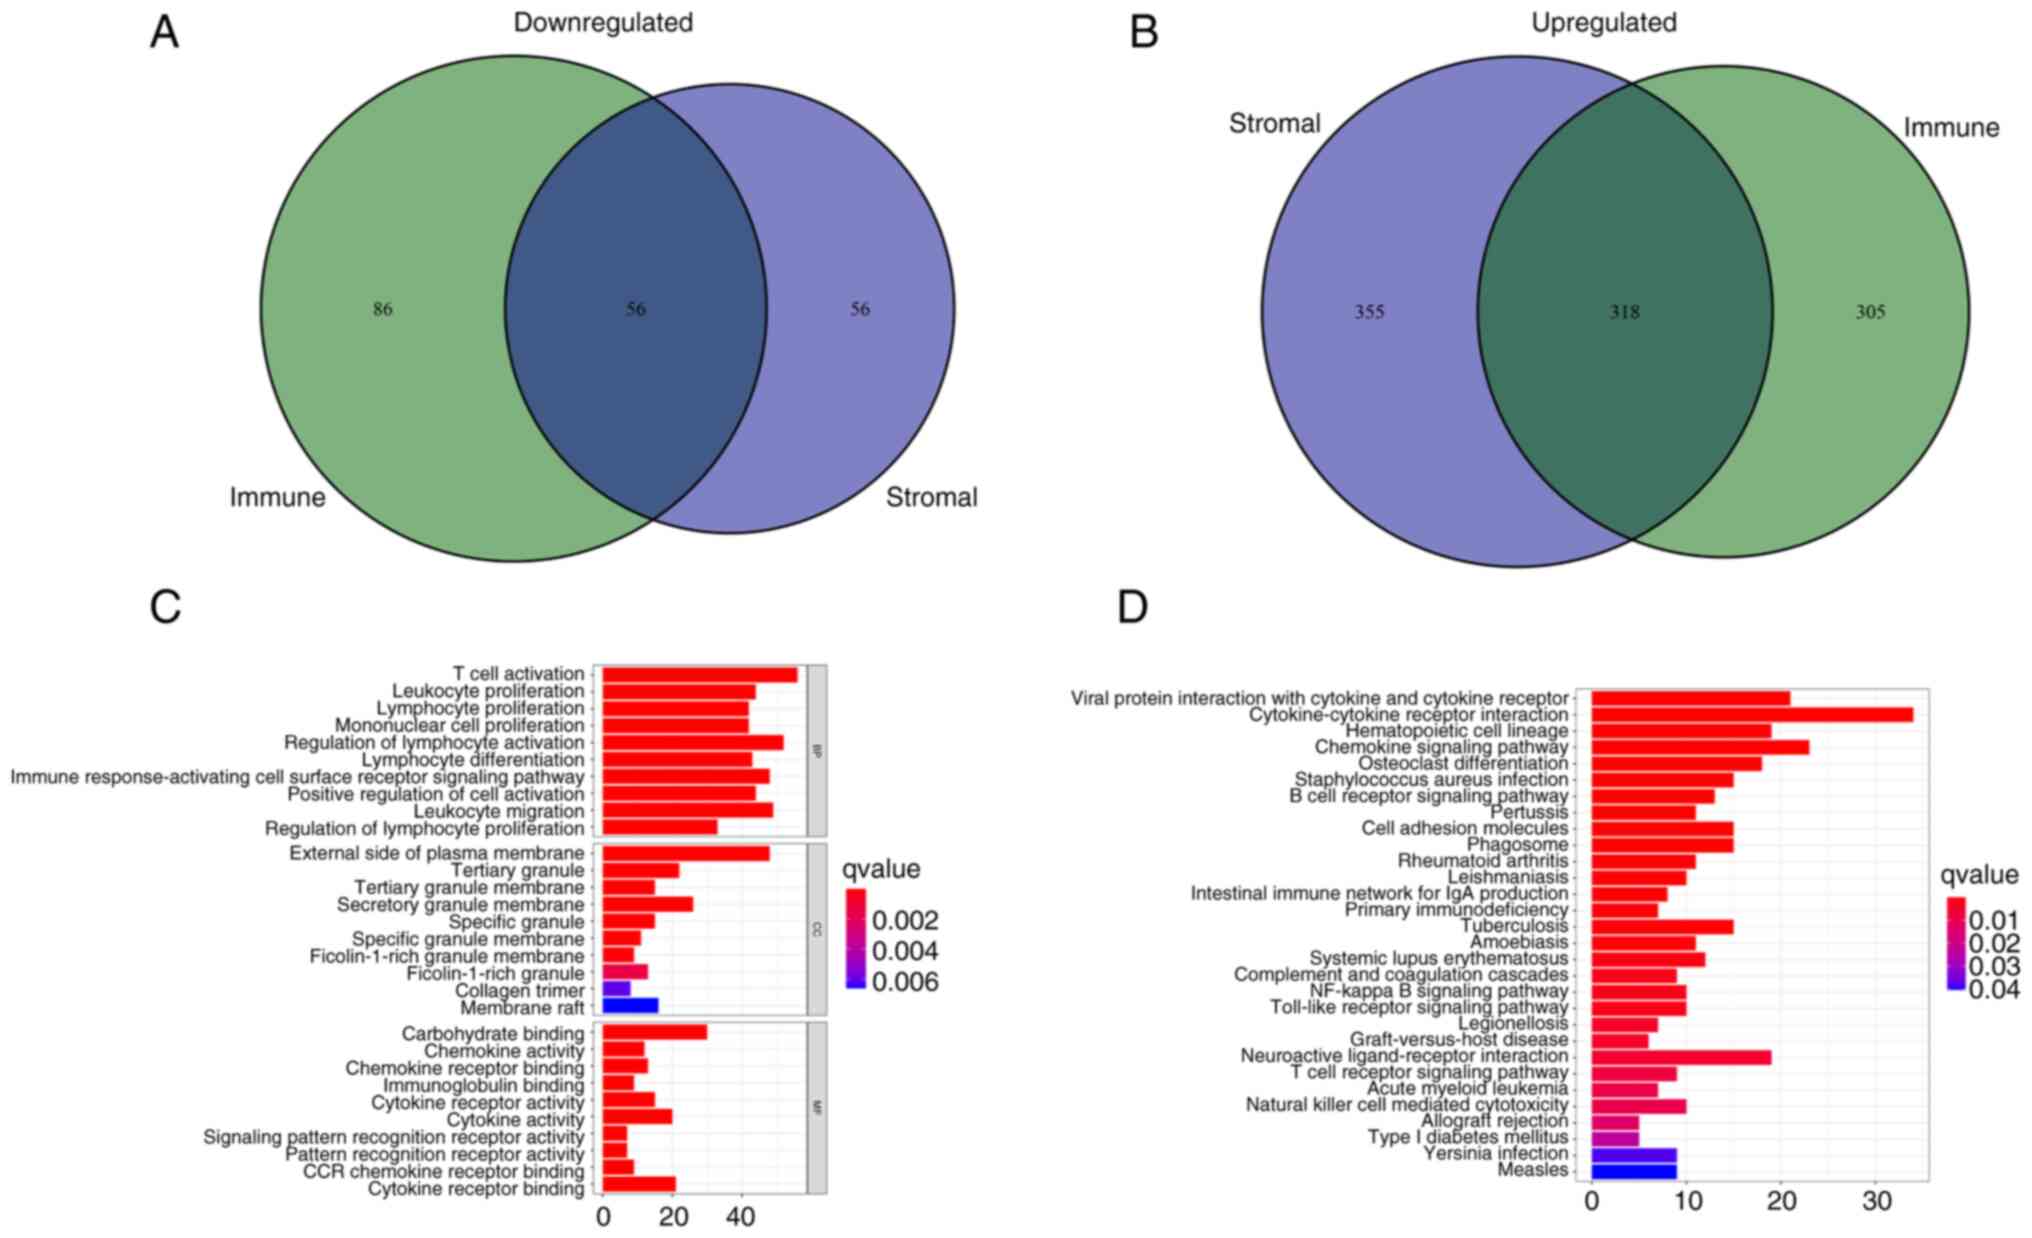 |
Figure 4.
Analyses of gene expression profiles of ImmuneScore and StromalScore. (A) Venn diagram presenting the number of downregulated DEGs with thresholds of false discovery rate <0.05 and |logFC|>1. (B) Venn diagram presenting the number of upregulated DEGs with thresholds of false discovery rate <0.05 and |logFC|>1. (C) Gene Ontology enrichment analysis of DEGs. (D) Kyoto Encyclopedia of Genes and Genomes enrichment analysis of DEGs. P<0.05 was considered to indicate statistical significance. DEGs, differentially expressed genes; BP, biological process; CC, cellular component; MF, molecular function.
|
Intersection analysis of the PPI network and univariate Cox regression analysis
The 374 DEGs obtained were imported into the STRING database and a PPI was constructed (Figs. 5A and S3). The PPI network was visualized using Cytoscape. After removal of single acting genes that did not interact with other genes, the gene that did have interactions with other genes were used to identify the key node. The 30 genes with the largest number of adjacent nodes were selected to further assess the genes related to the prognosis of LUAD (Fig. 5B). To visualize the main genes that affected the prognosis of LUAD, univariate Cox regression analysis was used (Fig. 5C). The results of both methods were combined into a Venn diagram and four overlapping genes, namely C-C motif chemokine receptor 2, BTK, protein tyrosine phosphatase receptor type C and NOX2 were identified (Fig. 5D; Table II).
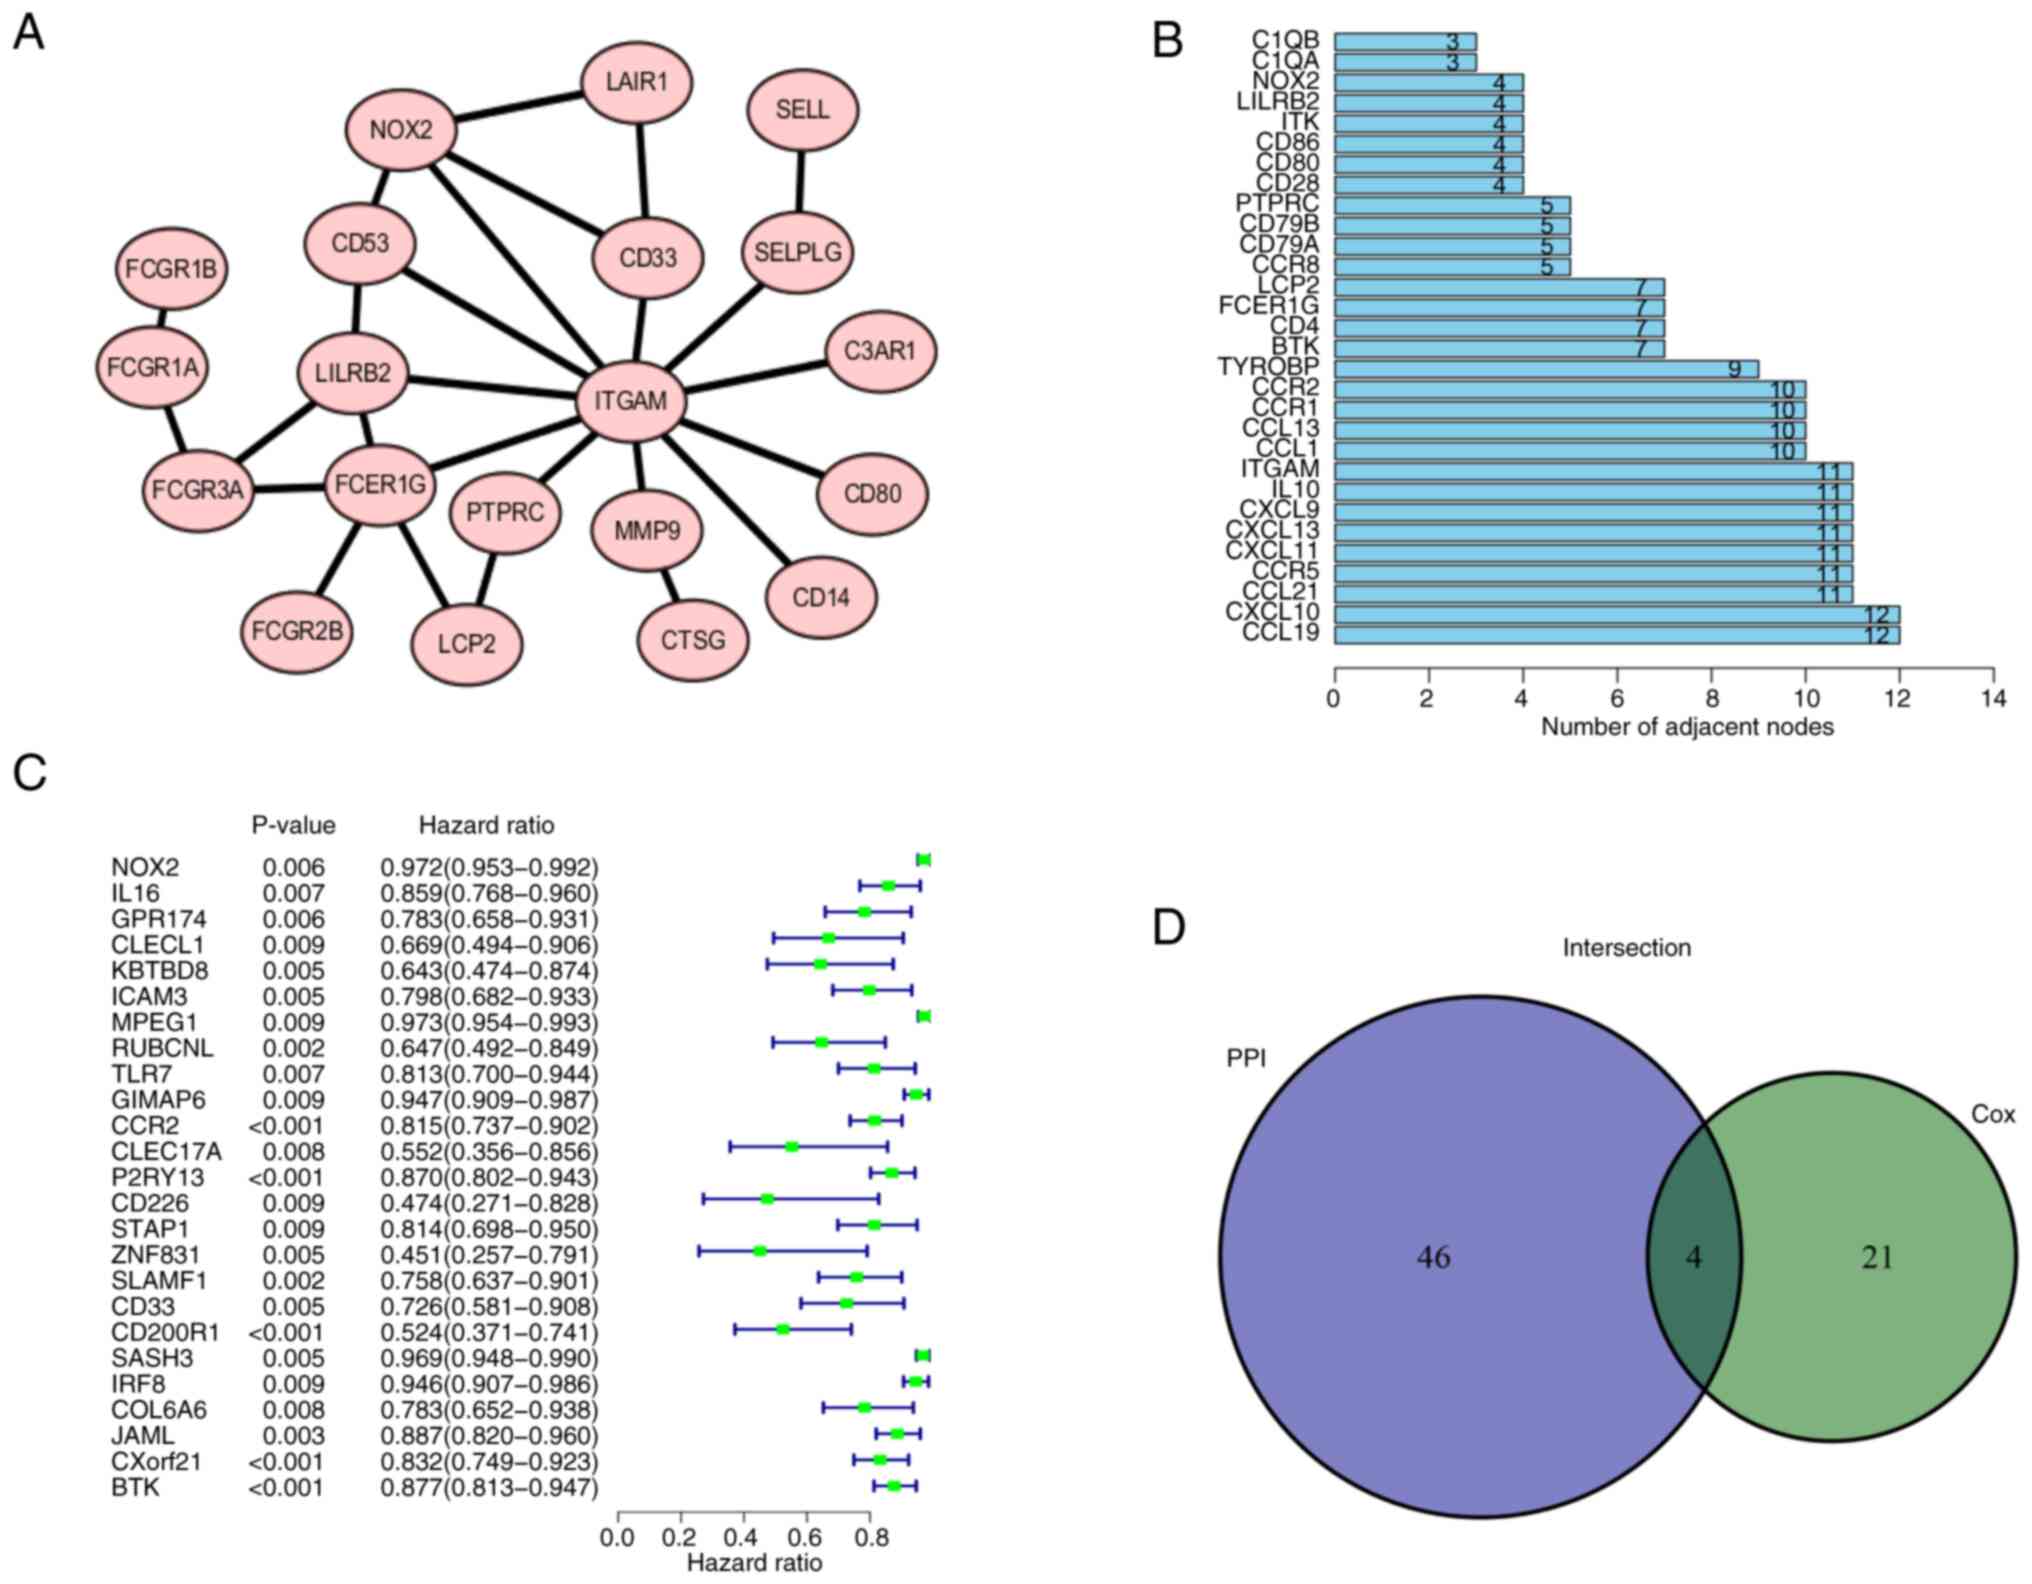 |
Figure 5.
PPI network and univariate Cox analysis. (A) PPI network of NOX2 was generated using the STRING platform. Local clustering coefficient, 0.879. (B) First 30 genes in the PPI network ordered by number of adjacent nodes. (C) Univariate Cox regression analysis. P<0.05 considered to indicate a statistically significant difference. (D) Intersection of (B) and (C) was combined in a Venn diagram. PPI, protein-protein interaction; NOX2, NADPH oxidase isoform 2.
|
|
Table II.
Details of the four differentially expressed genes.
|
Table II.
Details of the four differentially expressed genes.
| Gene name |
Gene ID |
Full name |
Location |
Expression |
Degree score |
P-value |
| CCR2 |
729230 |
C-C motif chemokine receptor 2 |
Chr3p21.31 |
Downregulated |
10 |
<0.001 |
| BTK |
695 |
Bruton tyrosine kinase |
ChrXq22.1 |
Downregulated |
7 |
<0.001 |
| PTPRC |
5788 |
Protein tyrosine phosphatase receptor type C |
Chr1q31.3-q32.1 |
Downregulated |
5 |
0.008 |
| NOX2 |
1536 |
Cytochrome b-245 β chain |
ChrXp21.1-p11.4 |
Downregulated |
4 |
0.006 |
High expression of NOX2 is beneficial to the prognosis of LUAD
Enrichment analysis of the function and signaling pathways of DEGs demonstrated that they were mainly associated with immunity. Therefore, NOX2, which serves a key role in immunity, was further assessed.
Firstly, patients with LUAD were divided into a high NOX expression group and a low NOX expression group according to the median value. The expression levels of NOX2 in the tumor tissues were lower compared with those in the normal (paracancerous) tissues of the same patient. The results of the NOX2 single-gene pairing difference analysis also supported this conclusion (Fig. 6A). In the survival analysis, the survival time of the high NOX expression group was longer than that of the low NOX expression group (Fig. 6B). Furthermore, NOX2 expression levels were significantly associated with the T classification (T3 vs. T1, P=0.019) of patients with LUAD (Fig. 6C). Overall, these results suggested that NOX2 expression levels were negatively associated with an unfavorable prognosis in patients with LUAD.
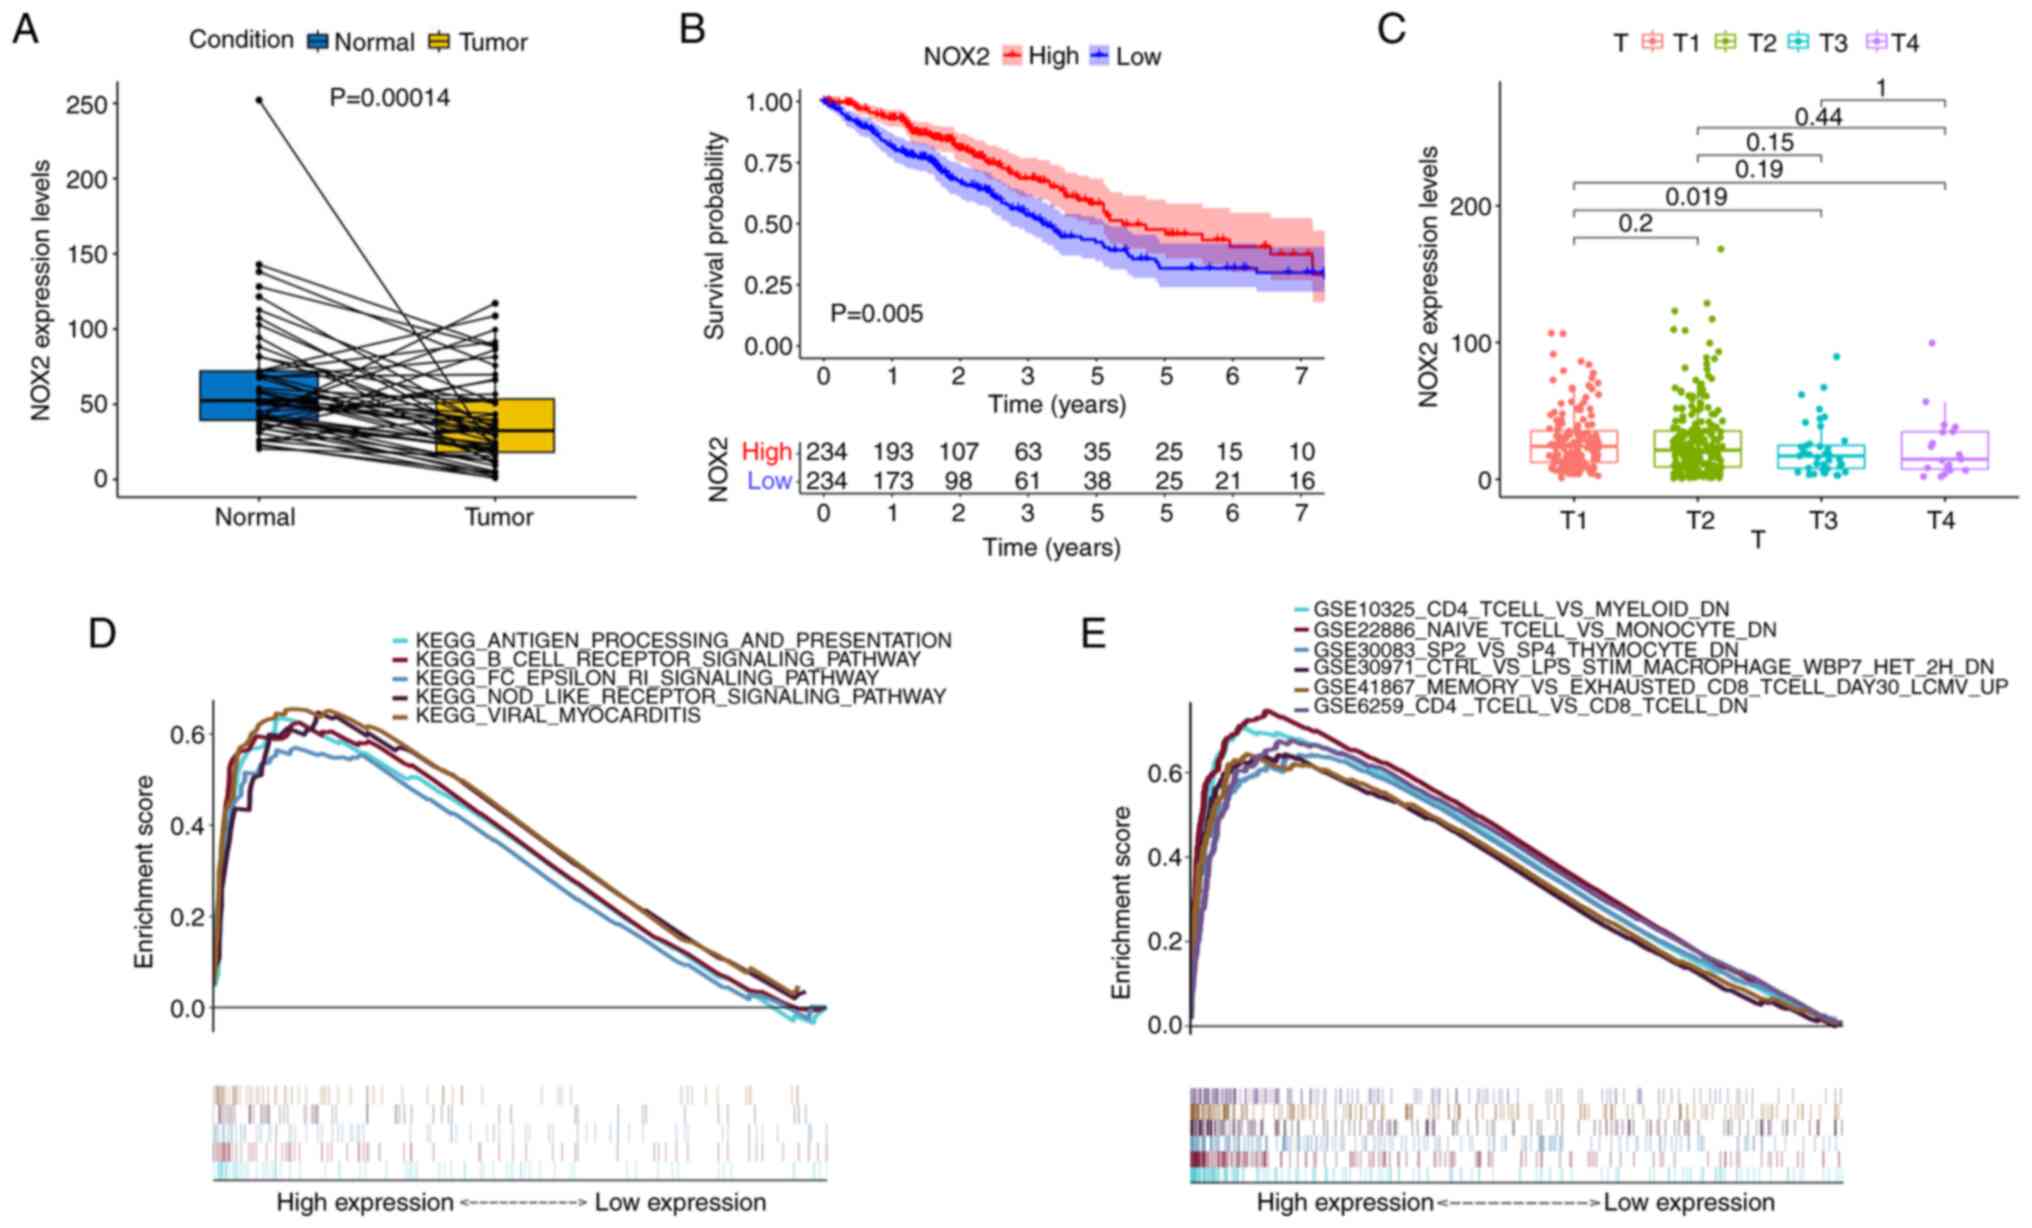 |
Figure 6.
Analysis of the association between NOX2 expression and survival and clinicopathological characteristics. (A) Paired differentiation analysis of NOX2 expression in tumor and normal groups derived from the same patients (n=54). (B) Kaplan-Meier analysis of NOX2 expression. The red and blue lines represent the proportion of surviving patients at each time node. The survival rate decreased over time and the group with high NOX2 expression demonstrated better survival. (C) Kruskal-Wallis rank sum test indicated that NOX2 expression was associated with T classification. (D) The enriched gene sets in the C2 dataset with high NOX2 expression levels. Particular signaling pathways were presented using different colored lines. The graph indicated the enrichment pathways and the vertical lines below indicated the number of genes enriched in each pathway. FDR< 0.05 was identified to be significant. (E) Enriched gene sets in the C7 collection of immunologic gene sets, in samples with high BTK expression. NOX2, NADPH oxidase isoform 2; GSEA, Gene Set Enrichment Analysis; FDR, false discovery rate.
|
GSEA revealed that NOX2 is mainly associated with immunity
To evaluate the association between the expression levels of NOX2 and prognosis, GSEA was performed. Bioinformatics results demonstrated that the high NOX2 expression group was associated with numerous immune-related signaling pathways, including B cell receptor signaling, viral myocarditis, and antigen processing and presentation in the C2 KEGG gene set (Fig. 6D). C7 immunological gene sets were enriched in immune-related activities, such as ‘CD4 T-CELL and MYELOID DN’ (Fig. 6E). These results indicated that the expression levels of NOX2 were associated with the immune response.
Downregulation of NOX2 expression in cancer cells and cancer tissues
The results of RT-qPCR and western blotting demonstrated that the mRNA and protein expression levels of NOX2 were significantly higher in normal cells compared with those in cancer cells, which was consistent with the results of the bioinformatics analysis (Fig. 7C and D). Furthermore, the results of immunochemical staining demonstrated that the protein expression levels of NOX2 were significantly higher in para-cancerous tissues compared with those in LUAD tissues (Fig. 7A and B). These results demonstrated that NOX2 was downregulated in LUAD cancer cells and cancer tissues.
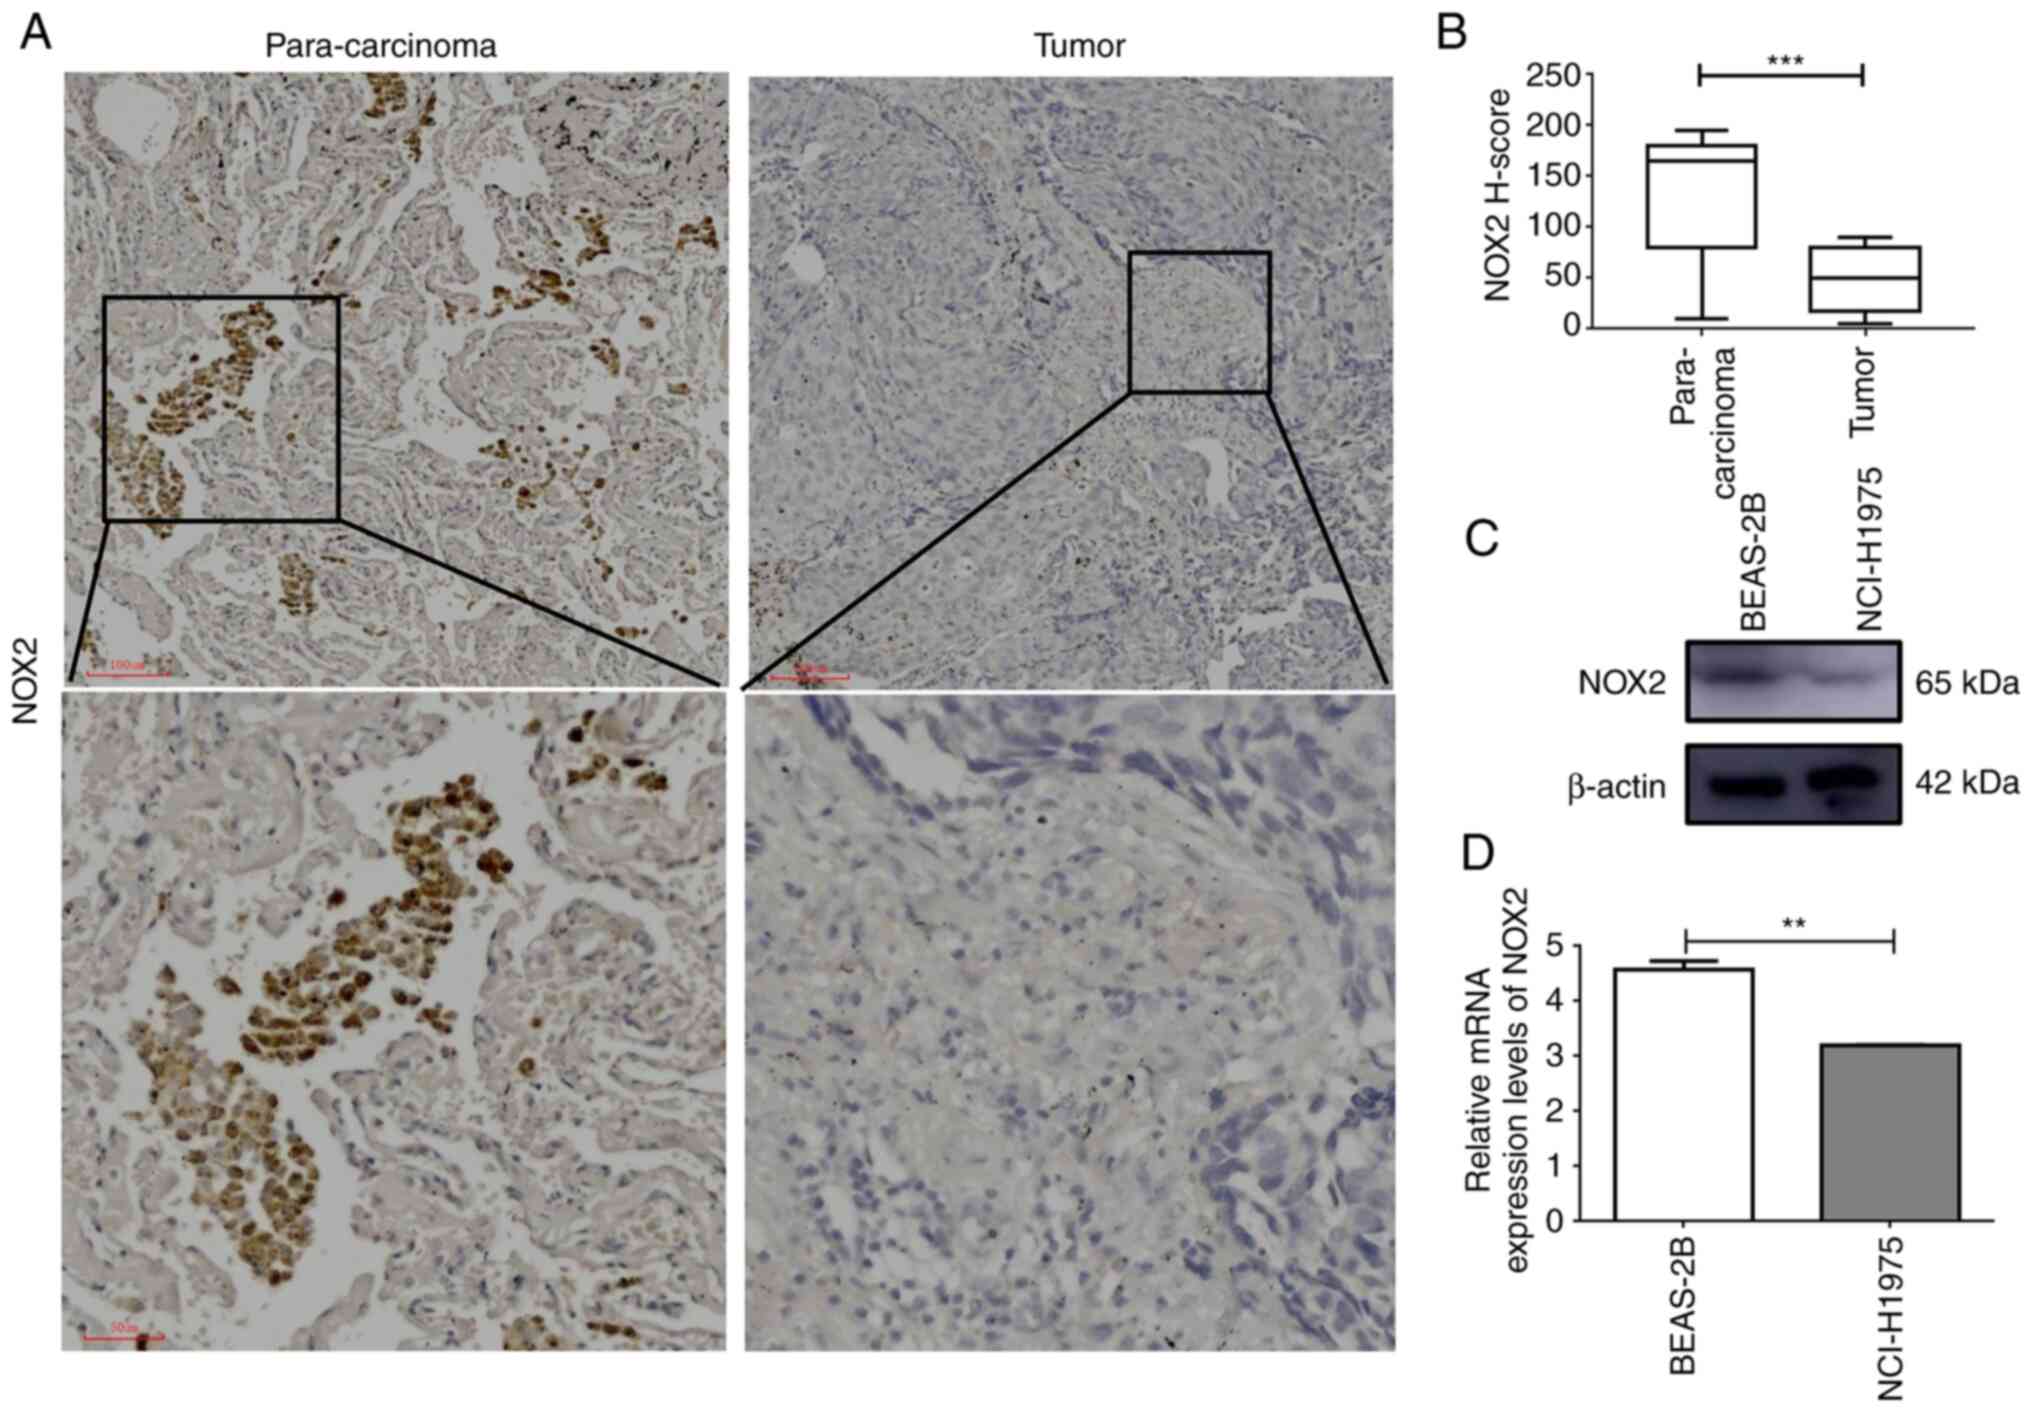 |
Figure 7.
NOX2 mRNA and protein expression levels are downregulated in LUAD cells and tissues. (A) Immunohistochemical analysis of LUAD tumor tissue and matching para-carcinoma tissue. (B) H-score of NOX2 determined by immunohistochemistry; analyzed by paired t-test. (C) Western blotting and (D) reverse transcription-quantitative PCR of the human bronchial epithelial BEAS-2B cell line and human lung cancer NCI-H1975 cell line. **P<0.01 and ***P<0.001. LUAD, lung adenocarcinoma; NOX2, NADPH oxidase isoform 2.
|
NOX2 expression is correlated with 13 types of TIC
To further evaluate the relationship between NOX2 and the TME in LUAD, the proportions of immune cells infiltrating LUAD samples were analyzed using CIBERSORT. A histogram was generated to visualize the profiles of the 22 types of immune cells (Fig. 8A). A violin plot, which illustrated the profile of the 22 immune cell subpopulations demonstrated that there were statistically significant differences in plasma cells (P<0.001), T cells CD4 memory activated (P=0.030), T cells follicular helper (P=0.019), T cells regulatory (P<0.001), NK cells activated (P=0.013), monocytes (P<0.001), macrophages M2 (P<0.001), mast cells resting (P<0.001), eosinophils (P<0.001) and neutrophils (P<0.001) (Fig. 8B). Of the total of 22 TICs, 13 types of TIC were identified which were significantly correlated with NOX2 expression levels, based on the intersection of the parts with significant differences between the results of the different analyses and immune cell subpopulations were combined (Table III; Fig. 9A and B). The 13 types of TIC which were significantly, weakly correlated with NOX2 were as follows: NK cells resting (R=0.13, P=0.0082), dendritic cells resting (R=0.15, P=0.0021), eosinophils (R=0.22, P=3.6×10⁻⁶), macrophages M1 (R=0.18, P=0.00011), macrophages M2 (R=0.2, P=2×10⁻⁵), monocytes (R=0.18, P=0.00016), neutrophils (R=0.22, P=4.2×10⁻⁶), T cells CD4 memory activated (R=0.28, P=3.9×10⁻⁹), B cells naive (R=−0.11, P=0.019), dendritic cells activated (R=−0.14, P=0.0037), plasma cells (R=−0.3, P=1.7×10⁻¹⁰), T cell follicular helper (R=−0.18, P=0.00015) and NK cells activated (R=−0.22, P=4.2×10⁻⁶). These R-values indicated that TIC was weakly correlated with NOX2.
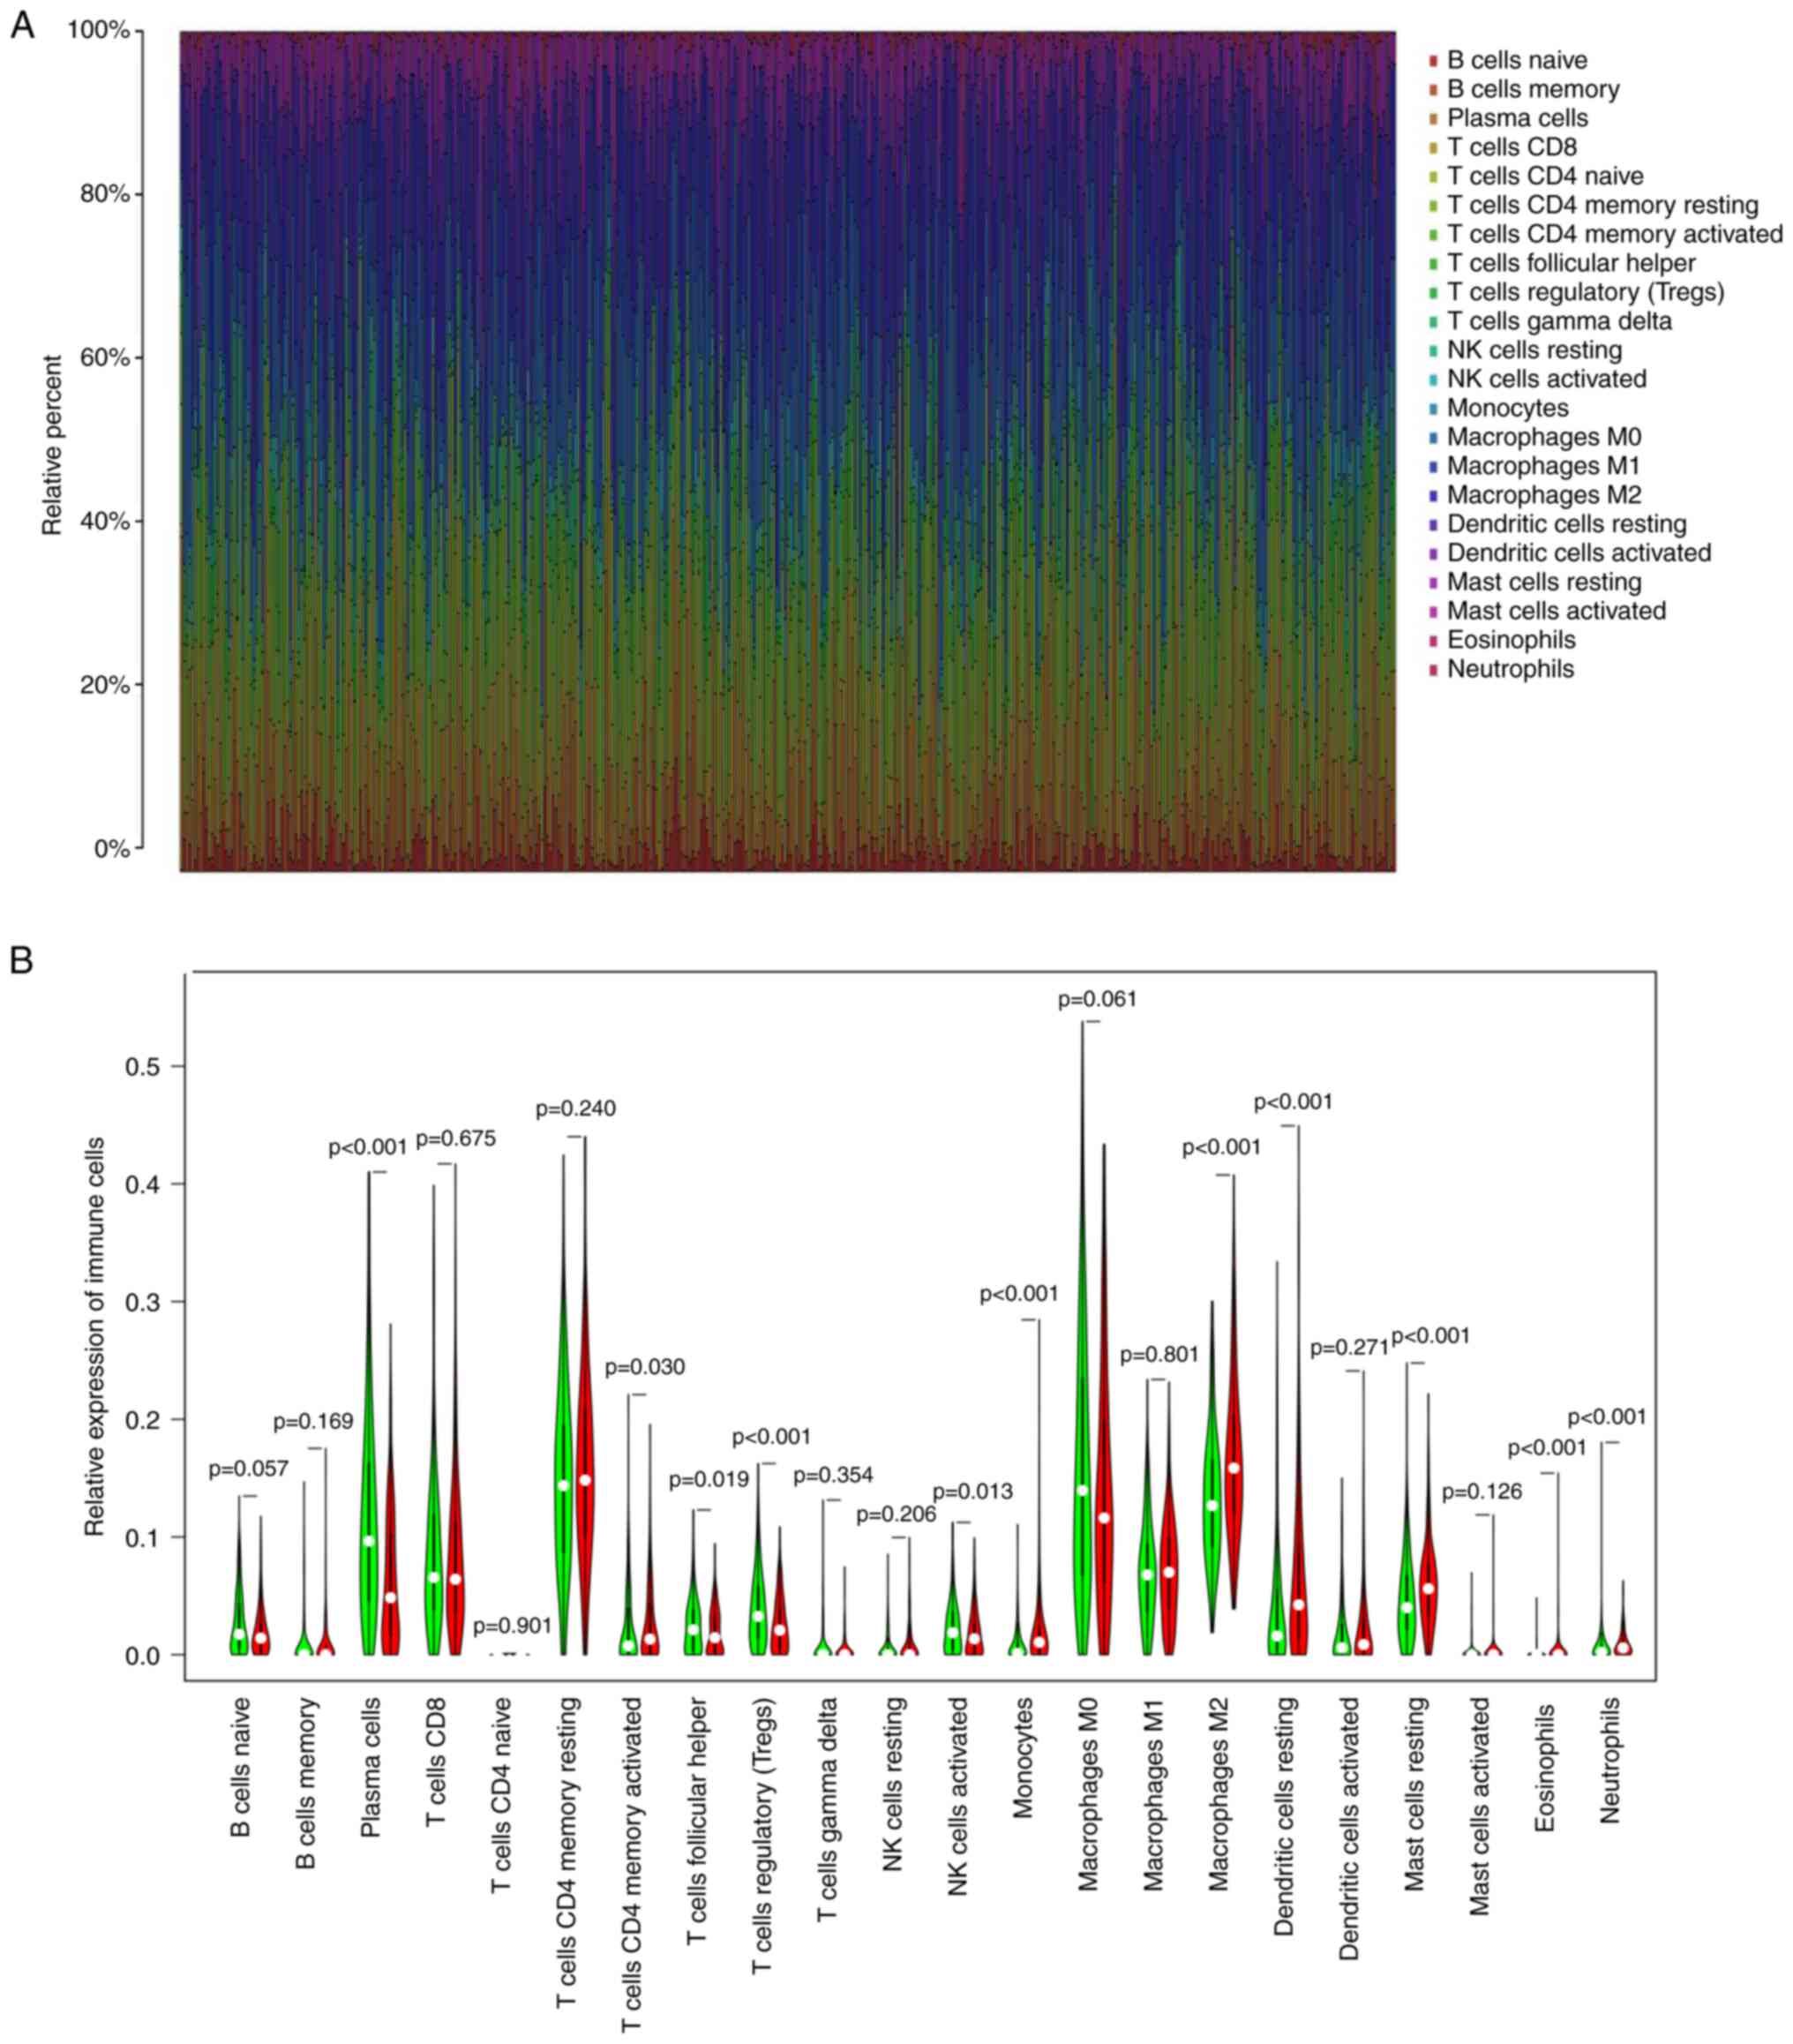 |
Figure 8.
Analysis of TIC proportion in LUAD samples. (A) Bar plot of the proportions of the 22 types of TICs in each LUAD sample. Each column presented the data for a single sample ID. (B) Violin plot showing analysis between the infiltration level of immune cells, and low (green) and high (red) NOX2 expression level groups; the expression groups were split according to the median NOX2 expression level. The Wilcoxon rank sum test was used to assess statistical significance. TIC, tumor-infiltrating immune cells; LUAD, lung adenocarcinoma; NOX2, NADPH oxidase isoform 2.
|
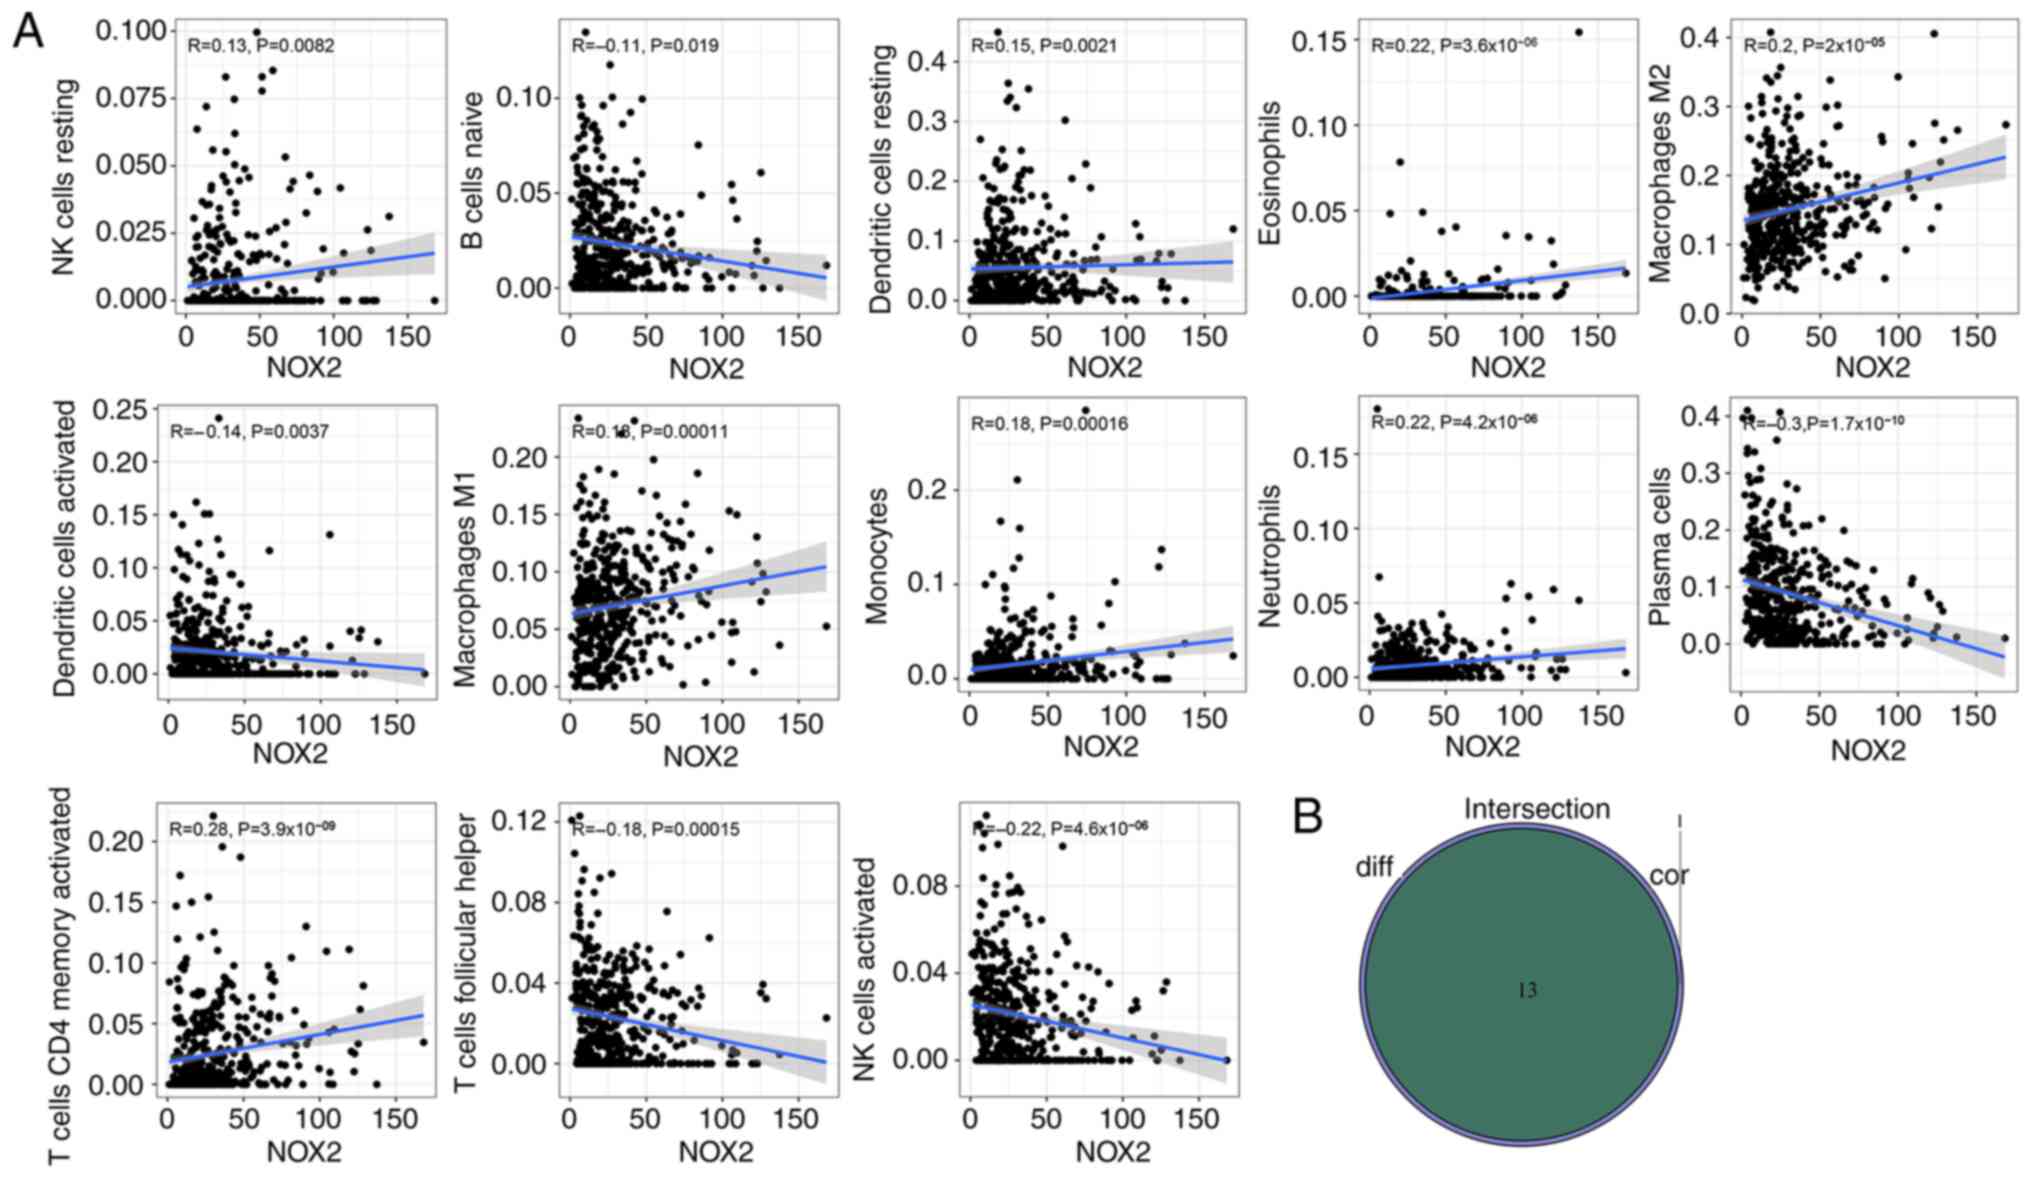 |
Figure 9.
Evaluation of NOX2 expression levels and the tumor microenvironment. (A) Scatter plots between the proportion of immune cells and NOX2 expression levels. The Pearson's correlation coefficient was used to test the correlation. Correlation coefficient R<0.3 in the scatter plot indicated a weak positive correlation with NOX2 and tumor purity and immune cells. (B) Venn plot presented the 13 types of TICs associated with NOX2 expression levels. The intersection of the differentially presented immune cells in the violin plot (Fig. 8B) and the scatter plot were combined in a Venn diagram.
|
|
Table III.
TICs co-determined by Wilcoxon rank sum difference and correlation test.
|
Table III.
TICs co-determined by Wilcoxon rank sum difference and correlation test.
| TICs |
Difference test (P-value) |
Correlation test (P-value) |
| B cells naive |
0.0192 |
0.0187 |
| NK cells resting |
0.0222 |
0.0082 |
| NK cells activated |
0.0131 |
4.2089×10⁻⁷ |
| T cells CD4 memory activated |
0.0303 |
3.9361×10⁻⁹ |
| T cells follicular helper |
0.0193 |
0.0001 |
| Dendritic cells activated |
2.7059×10⁻⁶ |
0.0037 |
| Dendritic cells resting |
3.4130×10⁻⁵ |
2.0585×10⁻³ |
| Plasma cells |
0.0006 |
1.6528×10⁻¹⁰ |
| Macrophages M1 |
8.0176×10⁻⁶ |
1.0633×10⁻⁴ |
| Macrophages M2 |
1.2484×10⁻⁸ |
2.0425×10⁻⁵ |
| Monocytes |
5.2589×10⁻⁸ |
0.0002 |
| Eosinophils |
1.2295×10⁻⁸ |
3.5960×10⁻⁶ |
| Neutrophils |
3.0231×10⁻⁸ |
4.1883×10⁻⁶ |
Discussion
In the present study, data from TCGA database were used to explore the differences in the immune microenvironment between normal lung tissue and cancer tissue in patients with LUAD. Aberrant expression of NOX2, a key gene involved in LUAD, was demonstrated. The signaling pathways associated with NOX2 were then evaluated using GO and KEGG enrichment analysis.
The TME serves an important role in the growth and development of tumors (37,38). The prognosis of patients with LUAD is poor and the recurrence rate is high. As part of an in-depth study of the TME and molecular cancer mechanisms, the potential prognostic indicators of LUAD require more attention. To support the development of new targeted drugs, the identification of potential prognostic targets is important (39,40). Transcriptome analysis of LUAD samples from TCGA database demonstrated that immune cell levels were closely related to the survival of patients with LUAD. The levels of immune cells were significantly associated with the clinicopathological features of LUAD, including pathological stage, T classification and M classification. These results suggested that the immune components of the TME may be an important factor that could affect the occurrence and prognosis of LUAD. GO analysis demonstrated that, 93 common DEGs were overlapping genes in both the immune and stromal groups, which indicated that DEGs were associated with numerous immune-related terms, which suggested the importance of immune microenvironment in tumorigenesis. It has previously been reported that the immune response can promote the development of numerous types of cancer (41). A relationship between DEGs and the immune response was also demonstrated by the KEGG analysis, which indicated that DEGs served an important role in regulation of the TME, and may affect the occurrence and prognosis of LUAD. Bioinformatics results demonstrated that NOX2 was expressed at low levels in LUAD tissues and univariate Cox analysis demonstrated that NOX2 was a tumor suppressor gene for LUAD. The low expression levels of NOX2 in LUAD were closely related to the clinicopathological features. Western blotting, RT-qPCR and immunohistochemistry also demonstrated the downregulation of NOX2 expression in patients with LUAD. The present study demonstrated that NOX2 could be a valuable prognostic marker for LUAD.
NOX2 is a member of the human NADPH oxidase family, which consists of two membrane-spanning subunits (CYBB and CYBA) and three cytoplasmic subunits (NCF1, NCF2 and NCF4) (42), and is a key enzyme in antigen presentation and regulation of adaptive immunity (43). NOX2 usually functions in resisting microorganisms, mainly through the activation of granular protease and the direct antibacterial activity of active oxidants (44–47). Immune regulation by NOX2 is mainly through the regulation of certain key signaling pathways that affect neutrophils (48). Furthermore, NOX2 functions in adaptive immunity and in the regulation of antigen-presenting cells (14). It has previously been reported that NOX2 myeloid cells (i.e., myeloid cells that express NOX2) are involved in tumorigenesis and progression, and the acting factors are reactive oxygen species (ROS) formed by myeloid cells in a malignant microenvironment (49). Under the stimulation of NOX2 by factors such as rapidly proliferating cancer cells, the cytoplasmic subunits recruit a GTPase (either Rac1 or Rac2), bind the transmembrane components gp91phox and p22phox and activate the enzymatic complex to transport electrons from NADPH to oxygen, thus generating ROS, which serve a role in phagocytic host defense against invading organisms (14). NOX2 serves a role in triggering and promoting cancer cell mutation, and affects the redox balance in cancer cells to control the proliferation and survival of cancer cells by production of ROS in the TME (50). The mechanism by which NOX2 regulates the TME through ROS is complex; the sensitivity of tumors to ROS will change depending on the situation. Therefore, while the deletion of NOX2 subunits has been reported to reduce the metastasis of LUAD, the expression of NOX2 has also been reported to improve the prognosis of patients with LUAD (15,16). NOX2 serves an active role in the macrophage-mediated immune response and participates in the inhibition of chronic granuloma (51), which suggested that NOX2 served an important role in tumor regulation and immune system.
The results of the present study were consistent with previous reports, in which groups with high NOX2 expression exhibit a better prognosis in LUAD (14,16,52). Furthermore, western blotting, RT-qPCR and immunostaining analysis demonstrated that NOX2 mRNA and protein expression levels in LUAD were significantly reduced. Moreover, GSEA results demonstrated that the group of cells with high expression levels of NOX2 were associated with various immune-related signaling pathways, which included cell adhesion molecule, chemokine signaling and B cell receptor signaling. These results suggested that NOX2 could be used as a potential biomarker to predict the prognosis of patients with LUAD. The violin plot demonstrated that the proportion of regulatory T cells (Tregs) and plasma cells in the NOX2 low expression group were significantly higher compared with those in the NOX2 high expression group. Previous research supported the conclusion that the increased proportion of Tregs was associated with poor clinical outcomes (53). High plasma cell infiltration in the TME has been reported to be associated with low survival in numerous solid tumors, including LUAD and breast cancer (53). Neutrophils, CD4+ T cells and dendritic cells in patients with LUAD were positively correlated with the expression levels of NOX2. These results suggested that NOX2 served an important role in regulating the activity of immune cells.
In this study, the bioinformatics analysis and experimental verification of NOX2 were preformed and the results suggested that NOX2 could serve as an important biomarker to provide a potential therapeutic target for LUAD. However, the present study has certain limitations, the effect of NOX2 was not tested on the animal level. Further studies of NOX2 in vivo and in vitro are needed to improve understanding of the potential relationship between tumor microenvironment and the prognosis of LUAD.
Supplementary Material
Supporting Data
Supporting Data
Acknowledgements
Not applicable.
Funding
Funding: No funding was received.
Availability of data and materials
The datasets used and/or analyzed during the current study are available from the corresponding author on reasonable request. The public datasets used during the present study are available from TCGA database (https://portal.gdc.cancer.gov).
Authors' contributions
YJL, CQY, QHM, LY and DH designed and edited the present study. YJL, QHM, LY and YHZ wrote the manuscript. YJL, DH, YHZ and YL collected and analyzed the data. All authors read and approved the final manuscript. YJL and LY confirm the authenticity of all the raw data.
Ethics approval and consent to participate
The Weifang Medical University Ethics Committee approved the study (approval no. 2022YX-077). All subjects provided written informed consent for use of their samples for the present study.
Patient consent for publication
Not applicable.
Competing interests
The authors declare that they have no competing interests.
References
|
1
|
Islami F, Ward EM, Sung H, Cronin KA, Tangka FKL, Sherman RL, Zhao J, Anderson RN, Henley SJ, Yabroff KR, et al: Annual report to the nation on the status of cancer, part 1: National cancer statistics. J Natl Cancer Inst. 113:1648–1669. 2021. View Article : Google Scholar : PubMed/NCBI
|
|
2
|
Bray F, Ferlay J, Soerjomataram I, Siegel RL, Torre LA and Jemal A: Global Cancer Statistics 2018: GLOBOCAN estimates of incidence and mortality worldwide for 36 cancers in 185 countries: CA. Cancer J Clin. 68:394–424. 2018. View Article : Google Scholar : PubMed/NCBI
|
|
3
|
Lemjabbar-Alaoui H, Hassan OU, Yang YW and Buchanan P: Lung cancer: Biology and treatment options. Biochim Biophys Acta. 1856:189–210. 2015.PubMed/NCBI
|
|
4
|
Mattiuzzi C and Lippi G: Cancer statistics: A comparison between World Health Organization (WHO) and global burden of disease (GBD). Eur J Public Health. 30:1026–1027. 2020. View Article : Google Scholar : PubMed/NCBI
|
|
5
|
Chen D, Wang R, Yu C, Cao F, Zhang X, Yan F, Chen L, Zhu H, Yu Z and Feng J: FOX-A1 contributes to acquisition of chemoresistance in human lung adenocarcinoma via transactivation of SOX5. EBioMedicine. 44:150–161. 2019. View Article : Google Scholar : PubMed/NCBI
|
|
6
|
Anichini A, Perotti VE, Sgambelluri F and Mortarini R: Immune escape mechanisms in non small cell lung cancer. Cancers (Basel). 12:36052020. View Article : Google Scholar : PubMed/NCBI
|
|
7
|
Estey E: Acute myeloid leukemia: 2016 Update on risk-stratification and management. Am J Hematol. 91:824–846. 2016. View Article : Google Scholar : PubMed/NCBI
|
|
8
|
Liang JY, Wang DS, Lin HC, Chen XX, Yang H, Zheng Y and Li YH: A novel ferroptosis-related gene signature for overall survival prediction in patients with hepatocellular carcinoma. Int J Biol Sci. 16:2430–2441. 2020. View Article : Google Scholar : PubMed/NCBI
|
|
9
|
Zhong F, Yao F, Cheng Y, Liu J, Zhang N, Li S, Li M, Huang B and Wang X: m6A-related lncRNAs predict prognosis and indicate immune microenvironment in acute myeloid leukemia. Sci Rep. 12:17592022. View Article : Google Scholar : PubMed/NCBI
|
|
10
|
Zhu R, Tao H, Lin W, Tang L and Hu Y: Identification of an immune-related gene signature based on immunogenomic landscape analysis to predict the prognosis of adult acute myeloid leukemia patients. Front Oncol. 10:5749392020. View Article : Google Scholar : PubMed/NCBI
|
|
11
|
Bi KW, Wei XG, Qin XX and Li B: BTK Has potential to be a prognostic factor for lung adenocarcinoma and an indicator for tumor microenvironment remodeling: A study based on TCGA data mining. Front Oncol. 10:4242020. View Article : Google Scholar : PubMed/NCBI
|
|
12
|
Singal G, Miller PG, Agarwala V, Li G, Kaushik G, Backenroth D, Gossai A, Frampton GM, Torres AZ, Lehnert EM, et al: Association of patient characteristics and tumor genomics with clinical outcomes among patients with non-small cell lung cancer using a clinicogenomic database. JAMA. 321:1391–1399. 2019. View Article : Google Scholar : PubMed/NCBI
|
|
13
|
Park JH, Pyun WY and Park HW: Cancer metabolism: Phenotype, signaling and therapeutic targets. Cells. 9:23082020. View Article : Google Scholar : PubMed/NCBI
|
|
14
|
Grauers Wiktorin H, Aydin E, Hellstrand K and Martner A: NOX2-Derived reactive oxygen species in cancer. Oxid Med Cell Longev. 2020:70959022020. View Article : Google Scholar : PubMed/NCBI
|
|
15
|
Aydin E, Johansson J, Nazir FH, Hellstrand K and Martner A: Role of NOX2-Derived reactive oxygen species in NK Cell-mediated control of murine melanoma metastasis. Cancer Immunol Res. 5:804–811. 2017. View Article : Google Scholar : PubMed/NCBI
|
|
16
|
Martner A, Aydin E and Hellstrand K: NOX2 in autoimmunity, tumor growth and metastasis. J Pathol. 247:151–154. 2019. View Article : Google Scholar : PubMed/NCBI
|
|
17
|
Kauffmann M, Krüger T and Aebert H: Surgery on extracorporeal circulation in early and advanced non-small cell lung cancer. Thorac Cardiovasc Surg. 61:103–108. 2013. View Article : Google Scholar : PubMed/NCBI
|
|
18
|
Mascaux C, Angelova M, Vasaturo A, Beane J, Hijazi K, Anthoine G, Buttard B, Rothe F, Willard-Gallo K, Haller A, et al: Immune evasion before tumour invasion in early lung squamous carcinogenesis. Nature. 571:570–575. 2019. View Article : Google Scholar : PubMed/NCBI
|
|
19
|
Djenidi F, Adam J, Goubar A, Durgeau A, Meurice G, de Montpréville V, Validire P, Besse B and Mami-Chouaib F: CD8+CD103+ tumor-infiltrating lymphocytes are tumor-specific tissue-resident memory T cells and a prognostic factor for survival in lung cancer patients. J Immunol. 194:3475–3486. 2015. View Article : Google Scholar : PubMed/NCBI
|
|
20
|
Gajewski TF, Schreiber H and Fu YX: Innate and adaptive immune cells in the tumor microenvironment. Nat Immunol. 14:1014–1022. 2013. View Article : Google Scholar : PubMed/NCBI
|
|
21
|
Kinoshita T, Muramatsu R, Fujita T, Nagumo H, Sakurai T, Noji S, Takahata E, Yaguchi T, Tsukamoto N, Kudo-Saito C, et al: Prognostic value of tumor-infiltrating lymphocytes differs depending on histological type and smoking habit in completely resected non-small-cell lung cancer. Ann Oncol. 27:2117–2123. 2016. View Article : Google Scholar : PubMed/NCBI
|
|
22
|
Hao J, Li M, Zhang T, Yu H, Liu Y, Xue Y, An R and Wang S: Prognostic value of tumor-infiltrating lymphocytes differs depending on lymphocyte subsets in esophageal squamous cell carcinoma: An updated meta-analysis. Front Oncol. 10:6142020. View Article : Google Scholar : PubMed/NCBI
|
|
23
|
Ding Q, Chen D, Wang W and Chen Y: Progress in research on the cribriform component in lung adenocarcinoma. Zhongguo Fei Ai Za Zhi. 23:621–625. 2020.(In Chinese). PubMed/NCBI
|
|
24
|
Tomczak K, Czerwinska P and Wiznerowicz M: The cancer genome atlas (TCGA): An immeasurable source of knowledge. Contemp Oncol (Pozn). 19((1A)): A68–A77. 2015.PubMed/NCBI
|
|
25
|
Yoshihara K, Shahmoradgoli M, Martínez E, Vegesna R, Kim H, Torres-Garcia W, Treviño V, Shen H, Laird PW, Levine DA, et al: Inferring tumour purity and stromal and immune cell admixture from expression data. Nat Commun. 4:26122013. View Article : Google Scholar : PubMed/NCBI
|
|
26
|
Ritchie ME, Phipson B, Wu D, Hu Y, Law CW, Shi W and Smyth GK: Limma powers differential expression analyses for RNA-sequencing and microarray studies. Nucleic Acids Res. 43:e472015. View Article : Google Scholar : PubMed/NCBI
|
|
27
|
Thomas PD: The gene ontology and the meaning of biological function. Methods Mol Biol. 1446:15–24. 2017. View Article : Google Scholar : PubMed/NCBI
|
|
28
|
Kanehisa M, Furumichi M, Tanabe M, Sato Y and Morishima K: KEGG: New perspectives on genomes, pathways, diseases and drugs. Nucleic Acids Res. 45((D1)): D353–D361. 2017. View Article : Google Scholar : PubMed/NCBI
|
|
29
|
Yu G, Wang LG, Han Y and He QY: clusterProfiler: An R package for comparing biological themes among gene clusters. OMICS. 16:284–287. 2012. View Article : Google Scholar : PubMed/NCBI
|
|
30
|
Szklarczyk D, Gable AL, Lyon D, Junge A, Wyder S, Huerta-Cepas J, Simonovic M, Doncheva NT, Morris JH, Bork P, et al: STRING v11: Protein-protein association networks with increased coverage, supporting functional discovery in genome-wide experimental datasets. Nucleic Acids Res. 47((D1)): D607–D613. 2019. View Article : Google Scholar : PubMed/NCBI
|
|
31
|
Shannon P, Markiel A, Ozier O, Baliga NS, Wang JT, Ramage D, Amin N, Schwikowski B and Ideker T: Cytoscape: A software environment for integrated models of biomolecular interaction networks. Genome Res. 13:2498–2504. 2003. View Article : Google Scholar : PubMed/NCBI
|
|
32
|
Subramanian A, Tamayo P, Mootha VK, Mukherjee S, Ebert BL, Gillette MA, Paulovich A, Pomeroy SL, Golub TR, Lander ES and Mesirov JP: Gene set enrichment analysis: A knowledge-based approach for interpreting genome-wide expression profiles. Proc Natl Acad Sci USA. 102:15545–15550. 2005. View Article : Google Scholar : PubMed/NCBI
|
|
33
|
Livak KJ and Schmittgen TD: Analysis of relative gene expression data using real-time quantitative PCR and the 2(−Delta Delta C(T)) Method. Methods. 25:402–408. 2001. View Article : Google Scholar : PubMed/NCBI
|
|
34
|
Magaki S, Hojat SA, Wei B, So A and Yong WH: An introduction to the performance of immunohistochemistry. Methods Mol Biol. 1897:289–298. 2019. View Article : Google Scholar : PubMed/NCBI
|
|
35
|
Newman AM, Liu CL, Green MR, Gentles AJ, Feng W, Xu Y, Hoang CD, Diehn M and Alizadeh AA: Robust enumeration of cell subsets from tissue expression profiles. Nat Methods. 12:453–457. 2015. View Article : Google Scholar : PubMed/NCBI
|
|
36
|
Quail DF and Joyce JA: Microenvironmental regulation of tumor progression and metastasis. Nat Med. 19:1423–1437. 2013. View Article : Google Scholar : PubMed/NCBI
|
|
37
|
Wood SL, Pernemalm M, Crosbie PA and Whetton AD: The role of the tumor-microenvironment in lung cancer-metastasis and its relationship to potential therapeutic targets. Cancer Treat Rev. 40:558–566. 2014. View Article : Google Scholar : PubMed/NCBI
|
|
38
|
Qi R, Zhao Y, Guo Q, Mi X, Cheng M, Hou W, Zheng H and Hua B: Exosomes in the lung cancer microenvironment: Biological functions and potential use as clinical biomarkers. Cancer Cell Int. 21:3332021. View Article : Google Scholar : PubMed/NCBI
|
|
39
|
Zhang Y and He J: The development of targeted therapy in small cell lung cancer. J Thorac Dis. 5:538–548. 2013.PubMed/NCBI
|
|
40
|
Ozga AJ, Chow MT and Luster AD: Chemokines and the immune response to cancer. Immunity. 54:859–874. 2021. View Article : Google Scholar : PubMed/NCBI
|
|
41
|
Chuong Nguyen MV, Lardy B, Paclet MH, Rousset F, Berthier S, Baillet A, Grange L, Gaudin P and Morel F: NADPH oxidases, Nox: New isoenzymes family. Med Sci (Paris). 31:43–52. 2015. View Article : Google Scholar : PubMed/NCBI
|
|
42
|
Savina A, Jancic C, Hugues S, Guermonprez P, Vargas P, Moura IC, Lennon-Duménil AM, Seabra MC, Raposo G and Amigorena S: NOX2 controls phagosomal pH to regulate antigen processing during crosspresentation by dendritic cells. Cell. 126:205–218. 2006. View Article : Google Scholar : PubMed/NCBI
|
|
43
|
Aurelius J, Martner A, Riise RE, Romero AI, Palmqvist L, Brune M, Hellstrand K and Thorén FB: Chronic myeloid leukemic cells trigger poly(ADP-ribose) polymerase-dependent inactivation and cell death in lymphocytes. J Leukoc Biol. 93:155–160. 2013. View Article : Google Scholar : PubMed/NCBI
|
|
44
|
Aurelius J, Thorén FB, Akhiani AA, Brune M, Palmqvist L, Hansson M, Hellstrand K and Martner A: Monocytic AML cells inactivate antileukemic lymphocytes: Role of NADPH oxidase/gp91(phox) expression and the PARP-1/PAR pathway of apoptosis. Blood. 119:5832–5837. 2012. View Article : Google Scholar : PubMed/NCBI
|
|
45
|
Hellstrand K, Asea A, Dahlgren C and Hermodsson S: Histaminergic regulation of NK cells. Role of monocyte-derived reactive oxygen metabolites. J Immunol. 153:4940–4947. 1994. View Article : Google Scholar : PubMed/NCBI
|
|
46
|
Mellqvist UH, Hansson M, Brune M, Dahlgren C, Hermodsson S and Hellstrand K: Natural killer cell dysfunction and apoptosis induced by chronic myelogenous leukemia cells: Role of reactive oxygen species and regulation by histamine. Blood. 96:1961–1968. 2000. View Article : Google Scholar : PubMed/NCBI
|
|
47
|
Amara N, Cooper MP, Voronkova MA, Webb BA, Lynch EM, Kollman JM, Ma T, Yu K, Lai Z, Sangaraju D, et al: Selective activation of PFKL suppresses the phagocytic oxidative burst. Cell. 184:4480–4494.e15. 2021. View Article : Google Scholar : PubMed/NCBI
|
|
48
|
Singel KL and Segal BH: NOX2-dependent regulation of inflammation. Clin Sci (Lond). 130:479–490. 2016. View Article : Google Scholar : PubMed/NCBI
|
|
49
|
van der Weyden L, Speak AO, Swiatkowska A, Clare S, Schejtman A, Santilli G, Arends MJ and Adams DJ: Pulmonary metastatic colonisation and granulomas in NOX2-deficient mice. J Pathol. 246:300–310. 2018. View Article : Google Scholar : PubMed/NCBI
|
|
50
|
Benyoucef A, Marchitto L and Touzot F: CRISPR gene-engineered CYBBko THP-1 cell lines highlight the crucial role of NADPH-induced reactive oxygen species for regulating inflammasome activation. J Allergy Clin Immunol. 145:1690–1693.e5. 2020. View Article : Google Scholar : PubMed/NCBI
|
|
51
|
You X, Ma M, Hou G, Hu Y and Shi X: Gene expression and prognosis of NOX family members in gastric cancer. Onco Targets Ther. 11:3065–3074. 2018. View Article : Google Scholar : PubMed/NCBI
|
|
52
|
Ohue Y and Nishikawa H: Regulatory T (Treg) cells in cancer: Can Treg cells be a new therapeutic target? Cancer Sci. 110:2080–2089. 2019. View Article : Google Scholar : PubMed/NCBI
|
|
53
|
Gentles AJ, Newman AM, Liu CL, Bratman SV, Feng W, Kim D, Nair VS, Xu Y, Khuong A, Hoang CD, et al: The prognostic landscape of genes and infiltrating immune cells across human cancers. Nat Med. 21:938–945. 2015. View Article : Google Scholar : PubMed/NCBI
|


