Introduction
Capecitabine (CAP), an inactive pro-drug form of
5-fluorouracil (5-FU), is widely used in the treatment of solid
tumors, including colorectal, breast, gastric, pancreatic and
biliary tract cancer (1,2). Following oral intake, CAP is absorbed
through the gastrointestinal tract, where it undergoes three
enzymatic conversions to become active 5-FU. Initially, CAP is
converted to 5′-dFCR by carboxlesterase, which is transformed into
5′-dFUR by cytidine deaminase. Subsequently, 5-FU is produced by
thymidine phosphorylase and the active form of 5-FU and its
metabolites exert therapeutic effects within tumor cells (3–5).
Hand-foot syndrome (HFS), also known as
palmar-plantar erythrodysesthesia, is the most commonly reported
side effect of oral capecitabine therapy, occurring in >50% of
patients (6). HFS is characterized
by distinct erythema and palmoplantar dysesthesia and patients with
this disease may experience edema, skin peeling and fissures on the
fingers or toes, which can progress to blistering, ulceration and
full-thickness skin necrosis (7).
Severe pain associated with HFS often impairs a patient's ability
to perform daily activities. Thus, reductions in dosage or drug
discontinuation may be required, compromising the efficacy of this
chemotherapy (8). Although various
mechanisms for capecitabine-induced HFS have previously been
suggested, including cox inflammatory reactions, metabolic enzymes,
transporters involved in drug absorption and genetic variations,
the specific mechanisms remain to be fully elucidated (9). Research continues; however, effective
prevention and treatment options are lacking due to the incomplete
understanding of the specific causes of HFS (10,11).
The present study aimed to examine the differential
metabolites between capecitabine-treated patients with and without
HFS. Untargeted metabolomics was performed using ultra-high
performance liquid chromatography-mass spectrometry/mass
spectrometry (UHPLC-MS/MS) to determine novel metabolites of
capecitabine that may be associated with HFS development.
In addition, specific metabolites associated with
capecitabine were verified at the cellular level, enhancing the
current understanding of the metabolic activation involved in
capecitabine-induced HFS. Collectively, results of the present
study may provide a theoretical basis for novel therapeutic
strategies to be used in the treatment of HFS.
Materials and methods
Patients
Between March 2021 and March 2023, a total of 85
patients who received capecitabine chemotherapy were admitted to
the Oncology Department of Nanjing Jiangning Hospital of
Traditional Chinese Medicine. The present study was approved by the
Institutional Ethics Committee of Nanjing Jiangning Hospital of
Traditional Chinese Medicine (approval no. JZL-2021-08K-01) and all
patients provided written informed consent. Patients were included
in the present study according to the following criteria: i) The
presence of malignant tumors confirmed through pathology, histology
or cytology; ii) the presence of any malignant tumors treated with
capecitabine chemotherapy, including adjuvant/neoadjuvant therapy
or palliative care; iii) aged 18–85 years; iv) Karnofsky
Performance Status (KPS) (12)
score of ≥60; v) expected survival time of >3 months; and vi)
concurrent radiotherapy or biological treatments, such as
trastuzumab or bevacizumab (that do not cause HFS or neuropathy).
Patients were excluded from the present study according to the
following criteria: i) Not meeting the inclusion criteria; ii) poor
treatment compliance and an inability to cooperate with treatment;
iii) a loss to follow-up during the medication intervention period;
and iv) voluntary withdrawal from treatment. Exit criteria was as
follows: i) The presence of severe adverse reactions, including
skin allergic reactions or rashes, leading to trial
discontinuation; and ii) worsening of conditions, leading to death.
The primary characteristics of patients are summarized in Table I.
 | Table I.Clinical characteristics of
patients. |
Table I.
Clinical characteristics of
patients.
| Item | HFS negative | HFS positive | P-value |
|---|
| Sex |
|
| 0.76a |
|
Male | 25 | 27 |
|
|
Female | 17 | 16 |
|
| Age, years | 25-85 | 38-80 | 0.09b |
| Mean
age | 64.31±14.23 | 59.35±12.14 |
|
| Tumor type |
|
| 0.65a |
| Gastric
cancer | 17 | 20 |
|
|
Colorectal cancer | 16 | 17 |
|
|
Others | 9 | 6 |
|
Sample collection and preparation
All patients received oral capecitabine (cat. no.
1D0733DE3; Qilu Pharmaceutical Co., Ltd.) for chemotherapy.
Capecitabine was administered orally twice daily (morning and
evening) at a dosage of 1,250 mg/m2. The treatment
regimen included two weeks of medication followed by a one-week
break, with each treatment cycle lasting three weeks. Patients
completed at least three consecutive cycles. According to the
National Cancer Institute's Common Terminology Criteria for Adverse
Events (CTCAE; version 5.0) (13),
grade 0 was classified as HFS-negative, while grades 1–3 were
classified as HFS-positive. Patients were divided into two groups
according to HFS status, with 42 patients who were HFS-negative and
43 patients who were HFS-positive. Following the completion of five
treatment cycles, patients fasted for at least 6 h prior to blood
sample collection. Blood samples were centrifuged at 4°C, 2,352 × g
for 5 min to obtain plasma and this was stored at −80°C.
Samples were obtained from each group for lipid
extraction and these were randomly combined to form 23 pooled
samples. In total, 100 µl of each liquid sample was extracted using
400 µl of methanol:acetonitrile (ratio, 1:1). The mixture was
sonicated at 40 kHz for 30 min at 5°C and samples were subsequently
stored at −20°C for 30 min to precipitate the proteins. Following
centrifugation at 13,000 × g and 4°C for 15 min, the supernatant
was transferred to new microtubes and evaporated to dryness under
nitrogen.
For UHPLC-MS/MS analysis, samples were reconstituted
in 100 µl of acetonitrile:water (ratio, 1:1) solution using
sonication in a 5°C water bath. The reconstituted metabolites were
centrifuged at 13,000 × g and 4°C for 15 min and the supernatant
was transferred to sample vials for LC-MS/MS analysis. As part of
system conditioning and quality control (QC), a pooled QC sample
was prepared by mixing equal volumes of all samples. QC samples
were processed and tested in the same manner as the analytic
samples. The complete sample set was injected at regular intervals
to monitor the stability of the analysis.
UHPLC-MS/MS analysis
UHPLC-MS/MS analysis was performed using the UHPLC-Q
Exactive HF-X system (Thermo Fisher Scientific, Inc.).
Chromatographic conditions
A 2-µl sample was separated prior to MS using an HSS
T3 column (100×2.1 mm i.d.; 1.8 µm). Mobile phases consisted of
solvent A (0.1% formic acid in water:acetonitrile; ratio, 95:5) and
solvent B (0.1% formic acid in acetonitrile:isopropanol:water;
ratio, 47.5:47.5:5). The solvent gradient was as follows: From
0–3.5 min, 0% B-24.5% B (0.4 ml/min); from 3.5–5 min, 24.5% B-65% B
(0.4 ml/min); from 5–5.5 min, 65% B-100% B (0.4 ml/min); from
5.5–7.4 min, 100% B maintained with a flow rate increasing from
0.4–0.6 ml/min; from 7.4–7.6 min, 100% B-51.5% B (0.6 ml/min); from
7.6–7.8 min, 51.5% B-0% B (0.6–0.5 ml/min); from 7.8–9 min, 0% B
(0.5–0.4 ml/min); and from 9–10 min, 0% B (0.4 ml/min) for system
equilibration. The sample injection volume was 2 µl with a flow
rate set-0.4 ml/min and the column temperature was maintained at
40°C. All samples were stored at 4°C during the analysis.
MS conditions
The mass spectrometric data was collected using a
Thermo UHPLC-Q Exactive HF-X Mass Spectrometer (Thermo Fisher
Scientific, Inc.) equipped with an electrospray ionization source,
operating in both positive and negative ion modes. The optimal
conditions were set as follows: Heater temperature, 425°C;
capillary temperature, 325°C; sheath gas flow rate, 50 arb;
auxiliary gas flow rate, 13 arb; ion-spray voltage floating, at
−3,500 V in negative mode and 3,500 V in positive mode; and
normalized collision energy set at 20–40-60 V for MS/MS. The full
MS resolution was 60,000 and MS/MS resolution was 7,500. Data
acquisition was performed in Data Dependent Acquisition (DDA) mode,
covering a mass range of 70–1,050 m/z.
Data pre-processing and
annotation
Following detection using MS, the raw data obtained
using LC/MS were pre-processed using Progenesis software (QI;
Waters Corporation). This process exported a three-dimensional data
matrix in CSV format, containing sample information, metabolite
names and mass spectral response intensities. Internal standard
peaks, along with known false positives, such as noise, column
bleed and derivatized reagent peaks, were removed from the matrix.
Data were de-duplicated and peak-pooled. Metabolites were
identified using Human Metabolome Database (HMDB) (version 4.0;
http://www.hmdb.ca), Metlin (https://metlin.scripps.edu; version 2021) and Majorbio
Database (https://www.majorbio.com; version
2022).
Processed data were uploaded to the Majorbio cloud
platform (https://cloud.majorbio.com) for
further analysis. Metabolic features detected in ≥80% of any sample
set were retained. Post-filtering, minimum values were entered for
metabolites that fell below the quantitation limit in specific
samples. Each metabolic feature was normalized using the sum
normalization method to minimize errors from sample preparation and
instrument instability, resulting in a normalized data matrix.
Variables with a relative standard deviation of >30% in QC
samples were excluded and the data were
log10-transformed to produce the final data matrix for
subsequent analysis.
Differential metabolites data
analysis
Following pre-processing of the data matrix,
Principal component analysis (PCA) and orthogonal least partial
squares discriminant analysis (OPLS-DA) were performed using the R
package, ropls (version, 1.6.2; http://cran.r-project.org/web/packages/ropls/)
(14). Overall data analysis was
conducted using R (R Core Team, http://www.R-project.org/). A 7-fold cross-validation
(>1.5 for upregulated and <0.67 for downregulated) and
statistical significance (P<0.05) was used to assess model
stability and robustness. Additionally, permutation tests were
conducted to validate the models, ensuring that the observed group
separation was statistically significant and not due to random
chance. To identify markedly differential metabolites, the present
study employed a combination of univariate and multivariate
statistical methods. Student's unpaired t-tests and fold difference
analysis were conducted to evaluate individual metabolite changes
between groups. Markedly differential metabolites were identified
based on the variable importance in the projection (VIP) from the
OPLS-DA model and the P-value from Student's t-test. Metabolites
with VIP >1 and P<0.05 were considered statistically
significant (15), resulting in
the identification of 193 differential metabolites.
The aforementioned metabolites were categorized and
mapped to their biochemical pathways using metabolic enrichment and
pathway analysis, through the Kyoto Encyclopedia of Genes and
Genomes (KEGG) database (http://www.genome.jp/kegg/). Metabolites were
classified according to the associated pathways or functions.
Enrichment analysis was performed to determine whether specific
functional groups of metabolites were present. This process
extended the annotation from single metabolites to groups of
metabolites. The Python package scipy.stats (https://docs.scipy.org/doc/scipy/) was used to
identify statistically significant enriched pathways using Fisher's
exact test. These metabolites are strongly associated with
neurotoxicity, immunomodulatory effects and inflammatory responses.
They exhibited the highest fold changes and statistical
significance between the HFS-positive and HFS-negative groups.
Notably, these metabolites have not been previously reported in the
context of capecitabine-induced toxicity, highlighting their
potential as novel biomarkers or therapeutic targets for managing
capecitabine-related adverse effects.
Cell culture and treatment
HaCaT immortalized epidermal cells (cat. no.
iCell-h066; iCell) were cultured in Dulbecco's Modified Eagle's
Medium (DMEM) (cat. no. 11965–092; Thermo Fisher Scientific, Inc.)
supplemented with 10% fetal bovine serum (FBS) (cat. no. 26140-079;
Thermo Fisher Scientific, Inc.) and 1% penicillin-streptomycin
(cat. no. 15140-122; Thermo Fisher Scientific, Inc.). The culture
environment was maintained at 37°C with 5% CO2. When the
cells reached 80–90% confluence, cells were treated with a 0.25%
trypsin-0.02% EDTA solution (w/v) for 5 min at 37°C. Subsequently,
cells were resuspended in DMEM with 10% FBS to reach a final
concentration of 2×10⁵ cells/ml and plated onto 96-well
plates for cell damage assays.
HaCaT cells had been used previously in other
institutions and authentication was conducted using short tandem
repeat (STR) profiling following the storage of cell seeds. Cell
detection was performed following DNA extraction using Axygen's
genome extraction kit (Axygen Scientific, Inc.). The 21-STR
amplification protocol was used to amplify and detect the STR locus
and sex gene amelogenin on the ABI 3730XL genetic analyzer (Applied
Biosystems; Thermo Fisher Scientific, Inc.). STR profiles were
compared using the Deutsche Sammlung von Mikroorganismen und
Zellkulturen (DSMZ) online STR analysis tool (https://celldive.dsmz.de/str,accessed).
This tool encompasses STR data from 2,455 cell lines sourced from
major repositories, including the American Type Culture Collection,
DSMZ, Japanese Collection of Research Bioresources and Rikagaku
Kenkyūjo databases.
Cell Counting Kit-8 (CCK-8) assay
Cell damage was assessed using a CCK-8 assay. HaCaT
cells were divided into blank control, capecitabine and metabolite
groups. Metabolites included aciclovir (cat. no. HY-17422;
MedChemExpress), genistein (cat. no. HY-14596; MedChemExpress),
Lamivudine (cat. no. HY-B0250; MedChemExpress) and Lomerizine (cat.
no. HY-B0768A; MedChemExpress). Cells were inoculated in 96-well
plates and treated with various concentrations of capecitabine and
its metabolites (0.001, 0.01, 0.1, 1, 10, 100, 200 and 400 µM).
Following incubation for 48 h at 37°C, 10 µl of CCK-8 solution
(cat. nos. HYCEZMBIO and HYCCK8-500T) were added to each well and
gently mixed. Plates were subsequently incubated for an additional
1–4 h in an incubator (model, 3311; Thermo Fisher Scientific,
Inc.). Absorbance was measured at a wavelength of at 450 nm using a
microplate reader (model AMR-100; Hangzhou Aoshen Instrument Co.,
Ltd.) and the average optical density for each well was calculated.
Cytotoxicity was analyzed through comparison with the blank control
group. A dose-response curve was plotted, the half-maximal
inhibitory concentration (IC50) was calculated and
aciclovir and lamivudine were identified as causing the highest
levels of cell damage.
Hoechst 33258 staining
HaCaT cells were divided into the following groups:
i) Blank control group; ii) 50% IC50 capecitabine group;
iii) IC50 capecitabine group and iv) metabolite group
(including acyclovir and lamivudine). Following treatment for 48 h
at 37°C, culture medium was removed and 0.5 ml of fixative solution
(4% paraformaldehyde; cat. no. 80096618; Sinopharm Chemical Reagent
Co., Ltd.) was added to fix the cells on coverslips for 15 min.
Cells were subsequently washed three times with PBS, with each wash
lasting 3 min and the residual PBS was removed using absorbent
paper. Subsequently, 0.5 ml of Hoechst 33258 staining solution (5
mg/l; cat. no. C1018; Beyotime Institute of Biotechnology) was
added and cells were incubated at room temperature for 5 min. Cells
were washed a further three times with PBS, with each wash lasting
3 min. A drop of anti-fade mounting medium (cat. no. 0100-1;
SouthernBiotech) was added and the coverslips were mounted. Cell
morphology was observed under a fluorescence microscope (ECLIPSE
Ci; Nikon Corporation).
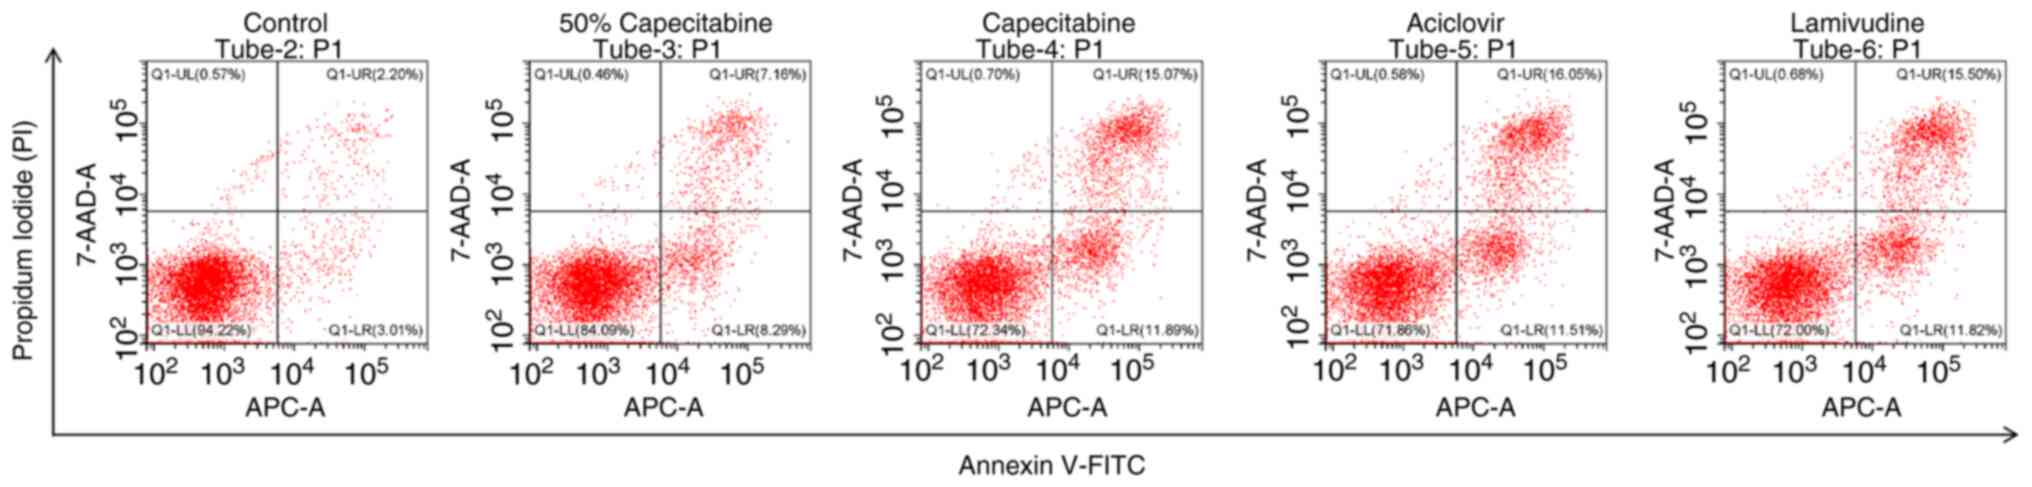
Annexin V/PI staining
HaCaT cells were divided into the following groups:
i) Blank control group; ii) 50% IC50 capecitabine group;
iii) IC50 capecitabine group and iv) metabolite group
(including acyclovir and lamivudine). The cells were digested with
0.25% trypsin without EDTA at 37°C for 2–3 min. After stopping the
digestion, the treated cells were collected and centrifuged at 215
× g for 5 min at 4°C. The supernatant was discarded and the pellet
resuspended in PBS. the cells were washed twice with PBS by
centrifugation at 215 × g for 5 min at 4°C each time. The Annexin
V-APC/7-AAD apoptosis detection kit (KGA1106-100; KeyGEN BioTECH)
was used for analysis. 7-AAD staining solution (5 µl) was added to
50 µl of Binding Buffer and mixed well. The prepared 7-AAD staining
solution was added to the collected cells and mixed well before
incubation at room temperature in the dark for 5–15 min. Following
incubation, 450 µl of Binding Buffer was added and mixed well.
Annexin V-APC (5 µl) was added and mixed well before incubation at
room temperature in the dark for 5–15 min. Flow cytometry was
performed using the CytoFLEX flow cytometer (Beckman Coulter)
equipped with CytExpert software (version 2.4; Beckman Coulter).
Data analysis was conducted using FlowJo software (FlowJo, LLC).
After staining and labeling the cells, multicolor compensation was
set up in the CytExpert software prior to data acquisition.In
FlowJo, cell debris and aggregates were excluded by gating based on
forward scatter (FSC) and side scatter (SSC). A dot plot of Annexin
V (X-axis) vs. PI (Y-axis) was used to identify four quadrants: LL
(Annexin V-/PI-): Viable cells, LR (Annexin V+/PI-): Early
apoptotic cells, UR (Annexin V+/PI+): Late apoptotic cells, UL
(Annexin V-/PI+): Necrotic cells.The total apoptosis rate was
calculated using the following formula: Total apoptosis rate
(%)=(Number of early apoptotic cells + Number of late apoptotic
cells)/(Number of viable cells + early apoptotic cells + late
apoptotic cells + necrotic cells) ×100%.
EdU detection
HaCaT cells were divided into the following groups:
i) Blank control group; ii) 50% IC50 capecitabine group;
iii) IC50 capecitabine group and iv) metabolite group
(including acyclovir and lamivudine). Cells were uniformly seeded
into 6-well plates using 2 ml of cell suspension per well and
cultured at 37°C with 5% CO2 for 48 h. EdU (cat. no.
C0081S; Beyotime Institute of Biotechnology) was diluted to 20 µM
using cell culture medium at a ratio of 1:500. Each well was
inoculated with the 20-µM diluted EdU solution and incubated for an
additional 2 h at 37°C. Following incubation, the medium was
removed and cells were fixed with 4% paraformaldehyde (cat. no.
80096618; Sinopharm Chemical Reagent Co., Ltd.) for 15 min,
followed by three washes with PBS. Cells were subsequently
permeabilized with 0.5% Triton-X-100 (cat. no. ST795; Beyotime
Institute of Biotechnology) for 20 min. After permeabilization,
cells were stained with EdU staining solution (cat. no. C0078S;
Beyotime Institute of Biotechnology) in the dark for 30 min at room
temperature. Following staining, the slides were washed three times
with PBS, and cell nuclei were stained with DAPI (cat. no. D9542;
Sigma-Aldrich; Marck KGaA) for 5 min in the dark at room
temperature. After washing with PBS, the cells were mounted with an
anti-fluorescence quenching agent (cat. no. 0100-01; Southern
Biotech) at room temperature and visualized using a fluorescence
microscope (Nikon ECLIPSE Ts2; Nikon Corporation). The imaging
system used was a Nikon DS-Fi3 (Nikon Corporation).
Calcein-AM/PI staining
HaCaT cells were divided into the following groups:
i) Blank control group; ii) 50% IC50 capecitabine group;
iii) IC50 capecitabine group and iv) metabolite group
(including acyclovir and lamivudine). In total, 1 ml of cell
suspension was added per well in a pre-prepared 12-well plate with
coverslips and cells were cultured overnight at 37°C in a 5%
CO2 incubator (Thermo Fisher Scientific, Inc.). Calcein
AM (1,000X) and PI (1,000X; cat. no. C2015S; Beyotime Institute of
Biotechnology) were diluted in detection buffer to prepare a 1X
Calcein AM/PI working solution. In total, 500 µl of the working
solution was added to each well. Cells were subsequently incubated
at 37°C in the dark for 30 min. Images were captured using an
inverted fluorescence microscope (ECLIPSE Ts2; Nikon
Corporation).
Statistical analyses
GraphPad Prism version 10.1.1 (Dotmatics) was used
for statistical analyses. The Student's unpaired t-tests and fold
difference analysis were used to calculate P-values between two
groups. For clinical characteristics of patients, the Student's
unpaired t-tests and χ2 test were performed. P<0.05
was considered to indicate a statistically significant
difference.
Results
Clinical characteristics of
patients
The primary characteristics of patients are
summarized in Table I. In the
present study, patients were categorized based on the presence of
HFS. Those without symptoms were classified as the HFS-negative
group, while those exhibiting symptoms were categorized as the
HFS-positive group. No statistically significant differences were
observed between the two groups in terms of age, sex or tumor type
(P>0.05), indicating that the groups were comparable.
Metabolomic profiles between
HFS-positive and HFS-negative groups
The raw data included QC and detection samples. In
the present study, the original data was pre-processed, including
filtering of missing values from the original data, simulation
(missing value recoding), data normalization (normalization), QC
verification and data conversion (16,17).
Following pre-processing of the raw data, 1,029 positive ion
metabolites and 1,413 negative ion metabolites were identified.
Among them, 968 positive ion metabolites and 1,358 negative ion
metabolites were present in the library. In total, 512 positive ion
metabolites and 671 positive ion metabolites were annotated using
KEGG. To determine the overall differences between the HFS-positive
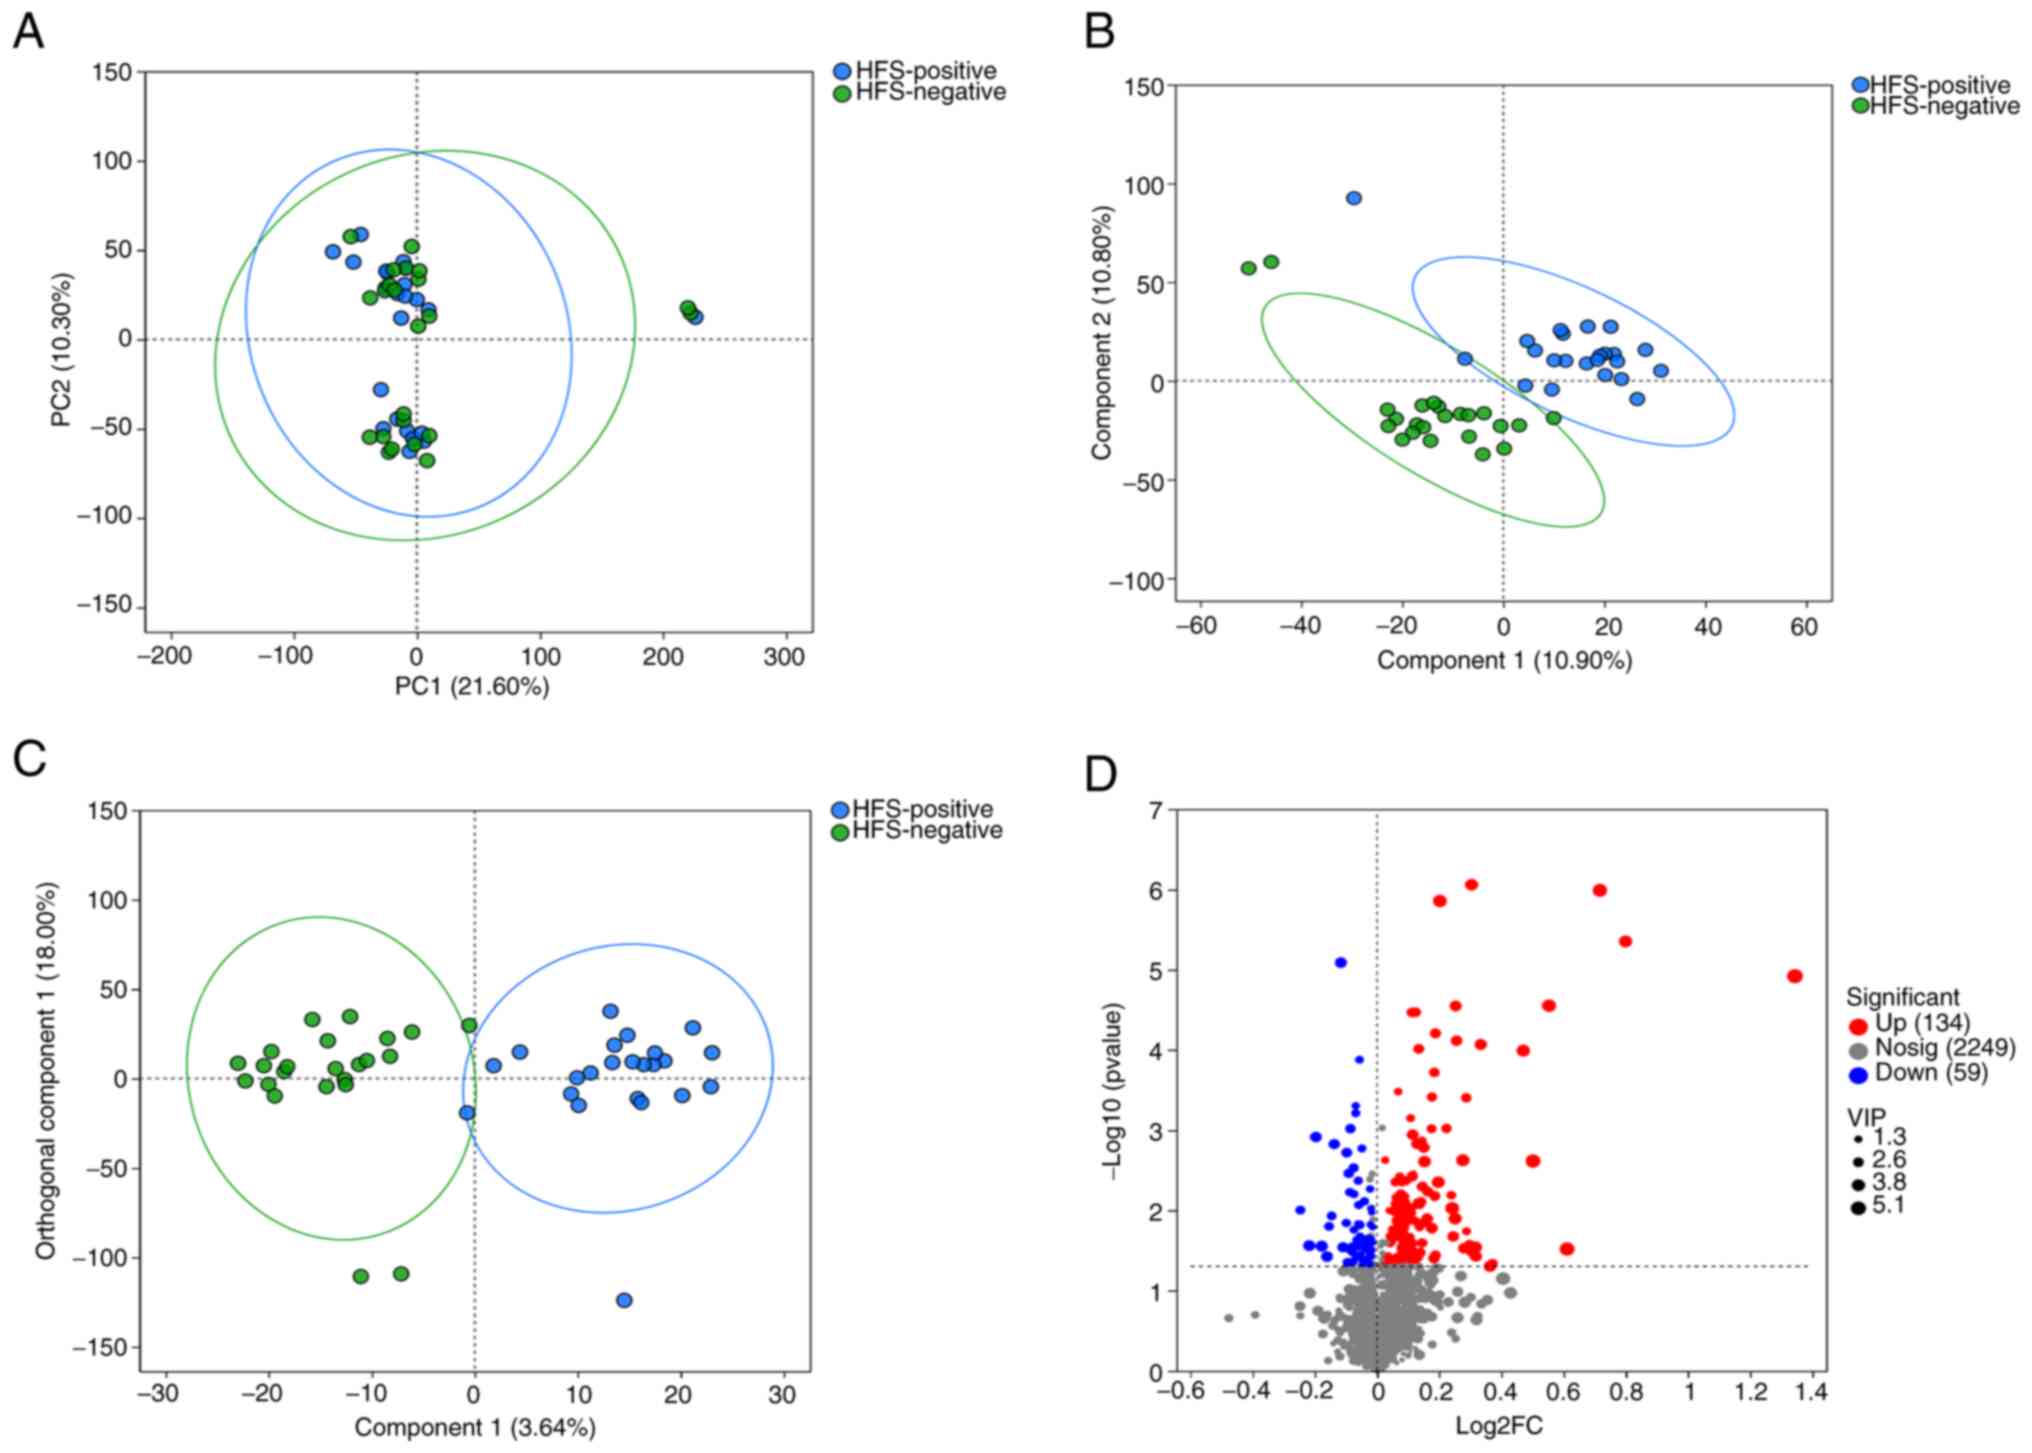
and HFS-negative groups, PCA and PLS-DA score plots were utilized.
Further analysis using the OPLS-DA model identified metabolites
with a VIP score of >1, a fold change (FC) of ≥1 and a P-value
of <0.05 as markedly differential metabolites. A total of 193
differential metabolites were identified, with 134 upregulated and
59 downregulated in the HFS-positive group.
Results of the PCA indicated minimal within-group
variability and significant between-group differences (Fig. 1A). The PLS-differential abundance
(DA) score plot demonstrated a notable separation between the two
groups (Fig. 1B). The OPLS-DA
score plot further confirmed the distinct differences between
groups, enhancing model performance (Fig. 1C). A volcano plot highlighted
differential metabolites between the two groups (Fig. 1D). Acyclovir's log2FC was 0.7171,
P-value=1.03×10⁻⁶, -log10(P-value) was 5.99,
Lamivudine's log2FC was 0.4707, P-value=1.021×10⁻⁴,
-log10(P-value) was 3.991, Genistein's log2FC was −0.1607,
P-value=3.762×10⁻², -log10(P-value) was 1.4248.
Lomerizine's log2FC was −0.1159, P-value=8.17×10⁻⁶ and
-log10(P-value) was 5.0885.
Differential metabolite analysis
To further investigate the potential causes of HFS
based on the differential metabolites identified between the
HFS-positive and HFS-negative groups, cluster analysis was
performed, including cluster and sub-cluster heatmaps (Fig. 2A). Using OPLS-DA/PLS-DA as the
supervised model, different changes in predicted pairings were
tested through seven-fold cross validation. VIP analysis of the
first principal component identified key metabolites contributing
to the classification and these were highlighted as potential
biomarkers for the promotion of metabolism (Fig. 2B).
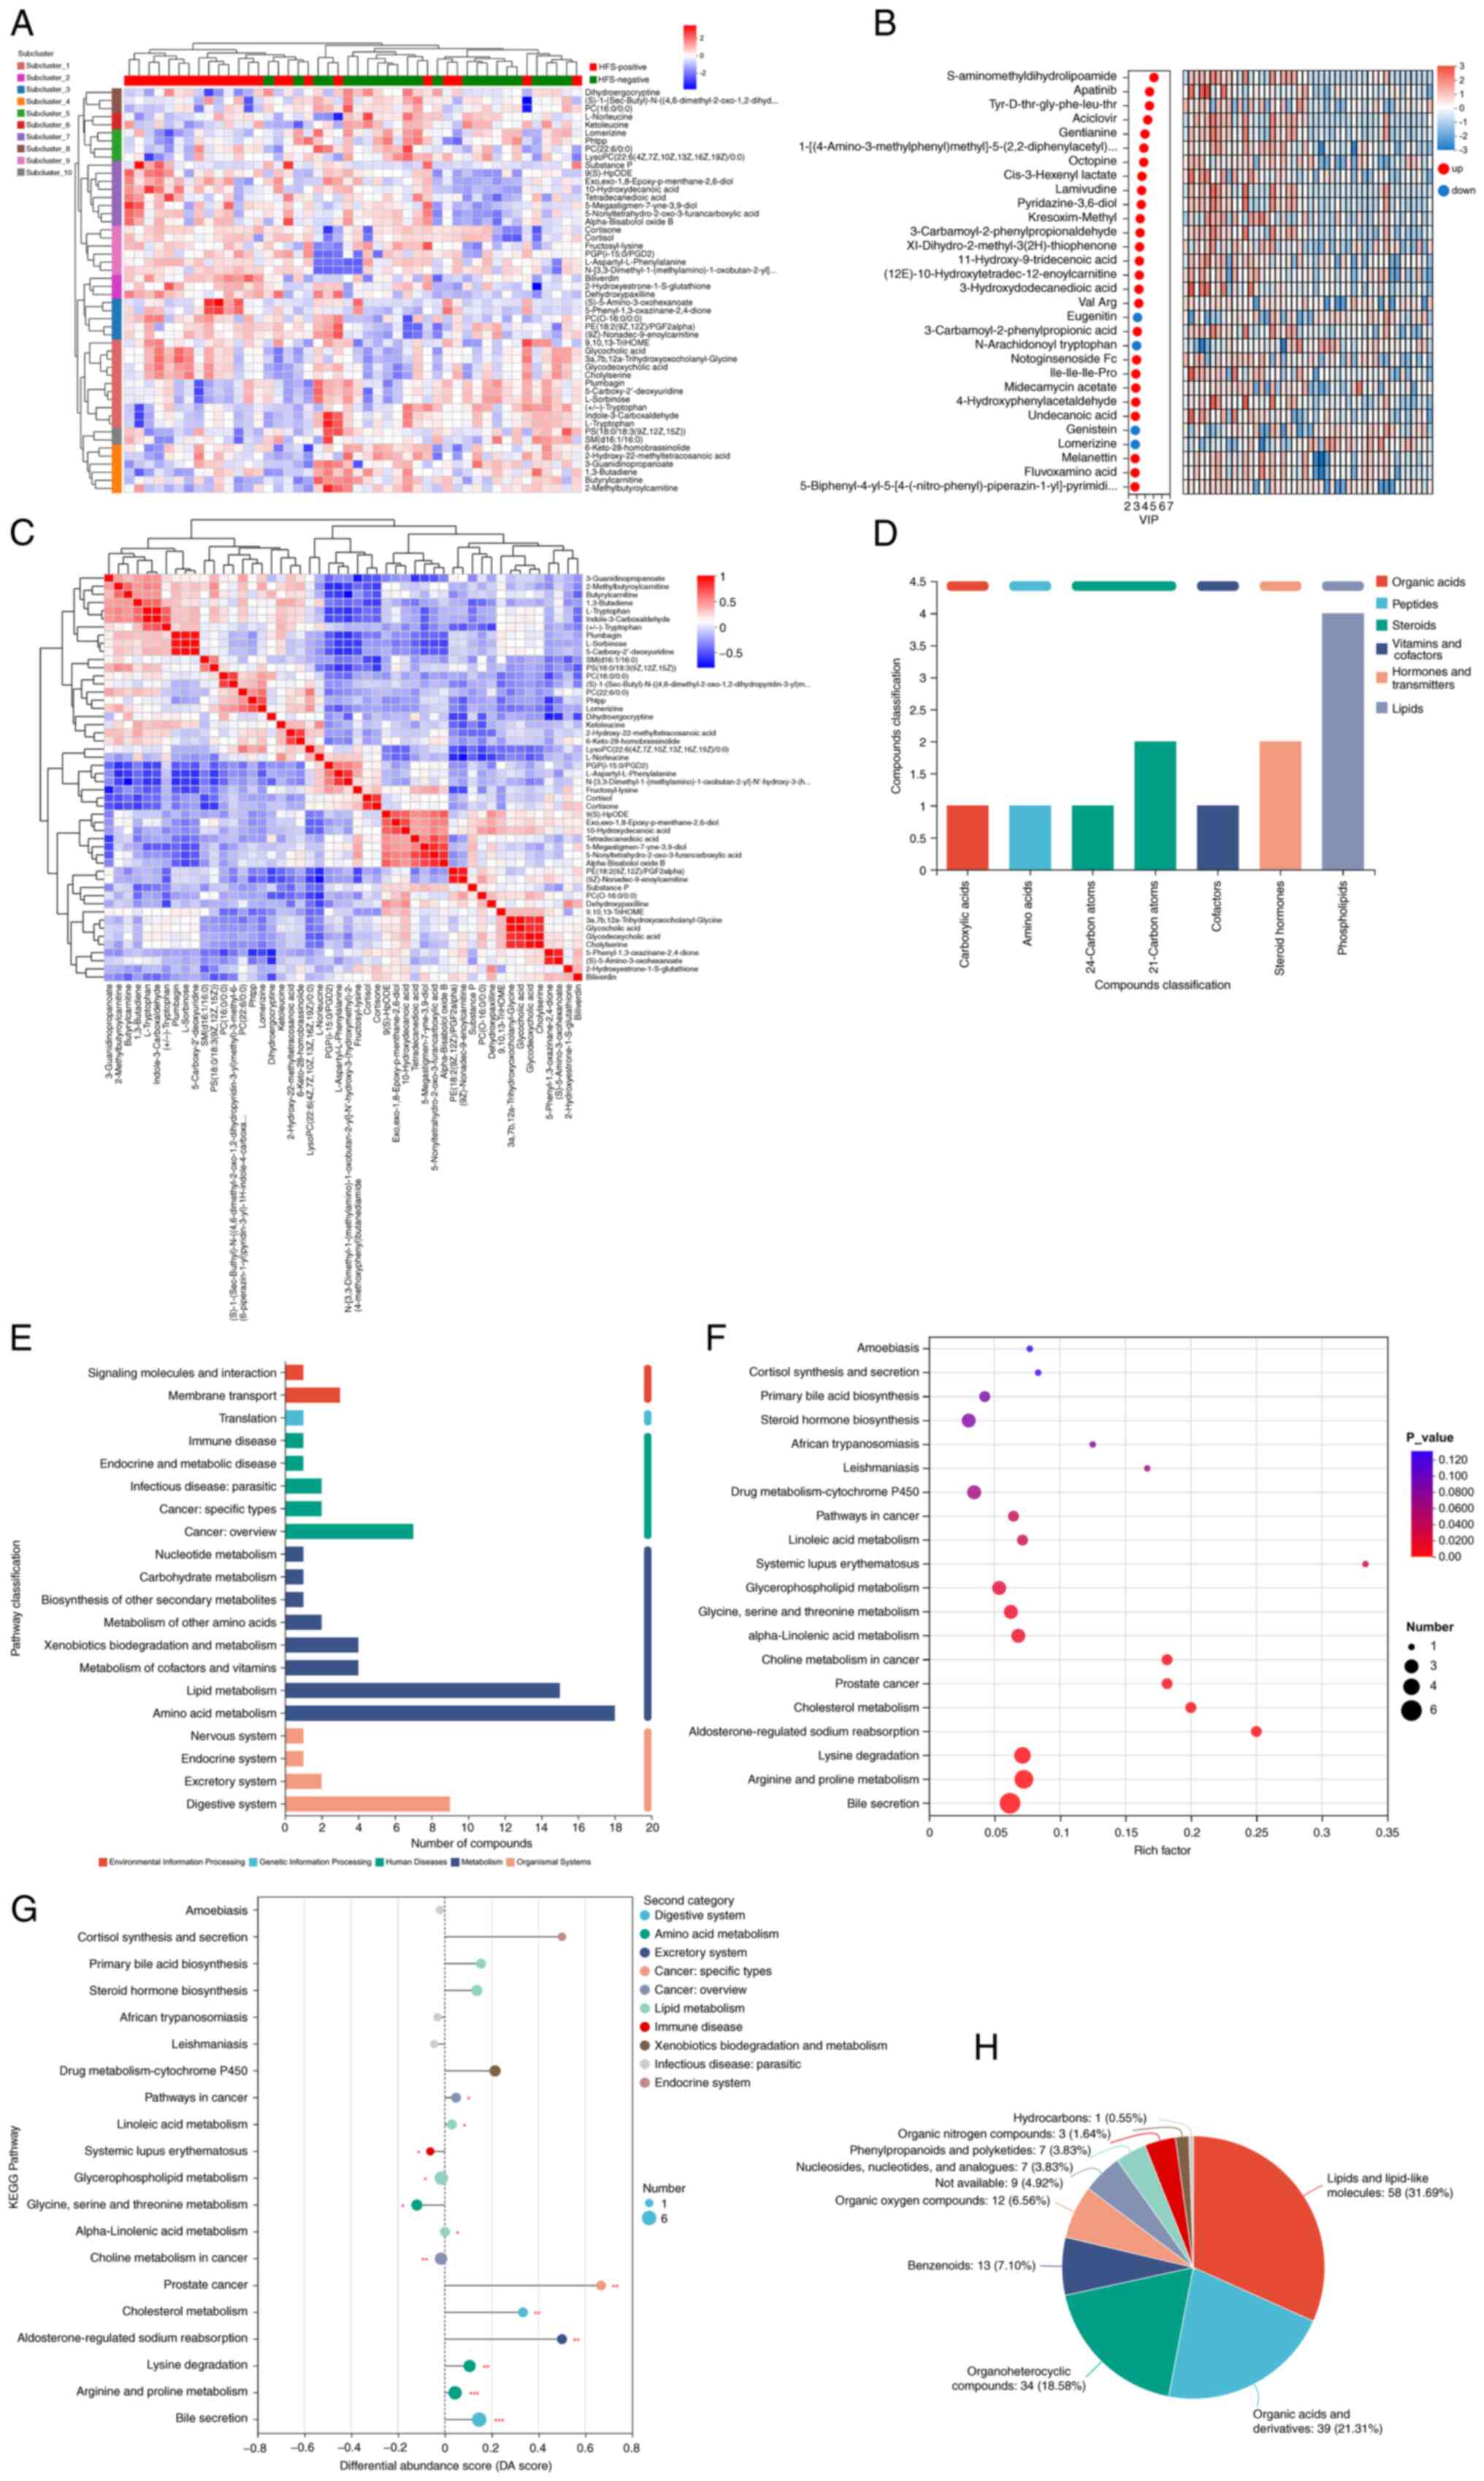 | Figure 2.Comprehensive metabolomic profiling
and pathway enrichment of differential metabolites in HFS-positive
vs. HFS-negative groups. (A) Heatmap of significantly altered
metabolites between the two groups. Red and green represent
HFS-positive and HFS-negative groups, respectively. (B) VIP
analysis of differential metabolites between the two groups. (C)
Differential metabolite correlation analysis. Names of metabolites
are in the right and bottom of the figure and metabolite clustering
dendrograms are in the left and top of the figure. (D) KEGG
indicated the biological functions of metabolites. (E) KEGG
metabolic pathways were used to classify differential metabolites
into five categories; namely, environmental information processing,
genetic information processing, human diseases, metabolism and
organismal systems. (F) Enriched KEGG pathways of 193 differential
metabolites between the HFS-positive and HFS-negative groups. (G)
DA score is indicative of changes in differential metabolites in
the metabolite pathway. (H) HMDB compound classification of the
differential metabolites. HFS, hand-foot syndrome; VIP, variable
importance in the projection; KEGG, Kyoto Encyclopedia of Genes and
Genomes; DA, differential abundance; HMDB, Human Metabolome
Database. |
Differential metabolite correlation
analysis
Correlation analysis aids in further understanding
the mutual regulatory relationship between metabolites during
biological state changes (18).
The correlation coefficient is positive and negative values
indicated positive and negative correlations. The closer the
absolute value was to 1, the higher the positive or negative
correlation of the metabolites (Fig.
2C). Based on their biological functions, metabolites were
categorized following mapping to the KEGG compound database
(https://www.kegg.jp/kegg/compound/),
including organic acids, peptides, steroids, vitamin and cofactors,
hormones and transmitters and lipids (Fig. 2D). According to the KEGG compound
identification, metabolic pathways involving the differential
metabolites were identified (Fig.
2E). KEGG pathway enrichment analysis and the differential
abundance score plot highlighted relevant metabolic pathways and
their biological functions. Specific pathways, including bile
secretion, arginine and proline metabolism, lysine degradation,
glycerophospholipid metabolism, glycine, serine and threonine
metabolism and alpha-linolenic acid metabolism demonstrated the
highest enrichment levels (Fig.
2F). Notably, the DA score reflected the overall change of all
metabolites in a metabolic pathway. A score of 1 indicated a trend
towards upregulation for all differential metabolites in that
pathway, while a score of −1 indicating a trend towards
downregulation (Fig. 2G). The
differential metabolites were classified in the HMDB as follows:
Lipids and lipid-like molecules, organic acids and derivatives,
organoheterocyclic compounds, benzenoids, organic oxygen compounds,
nucleosides, nucleotides and analogues (Fig. 2H).
Biological relevance of differential
metabolites
Collectively, these results suggested that the
differential metabolites may be associated with various biological
processes and molecular functions. Aciclovir and lamivudine are
classified as organoheterocyclic compounds in HMDB and, according
to the KEGG pathway analysis, these are involved in the bile
secretion pathway. Previous research indicates that these compounds
may exert notable neurotoxicity and immunomodulatory effects
(19–22). Genistein and lomerizine, involved
in KEGG metabolic pathways, demonstrated markedly alleviate various
inflammatory reactions (23–25).
Their presence suggested a potential role in modulating
inflammatory responses associated with HFS. Lipids and lipid-like
molecules and the enrichment of lipids in the differential
metabolite profile highlights their potential role in cell membrane
integrity and signaling pathways (26–28),
which may contribute to the pathogenesis of HFS. Organic acids and
derivatives, including intermediates of the TCA cycle and amino
acid metabolism (29,30), may reflect alterations in energy
metabolism and cellular homeostasis in response to capecitabine
treatment. Thus, further in vitro experiments are required
to verify the damaging effects of capecitabine and its metabolites
on HaCaT cells and to elucidate their mechanistic roles in HFS
development.
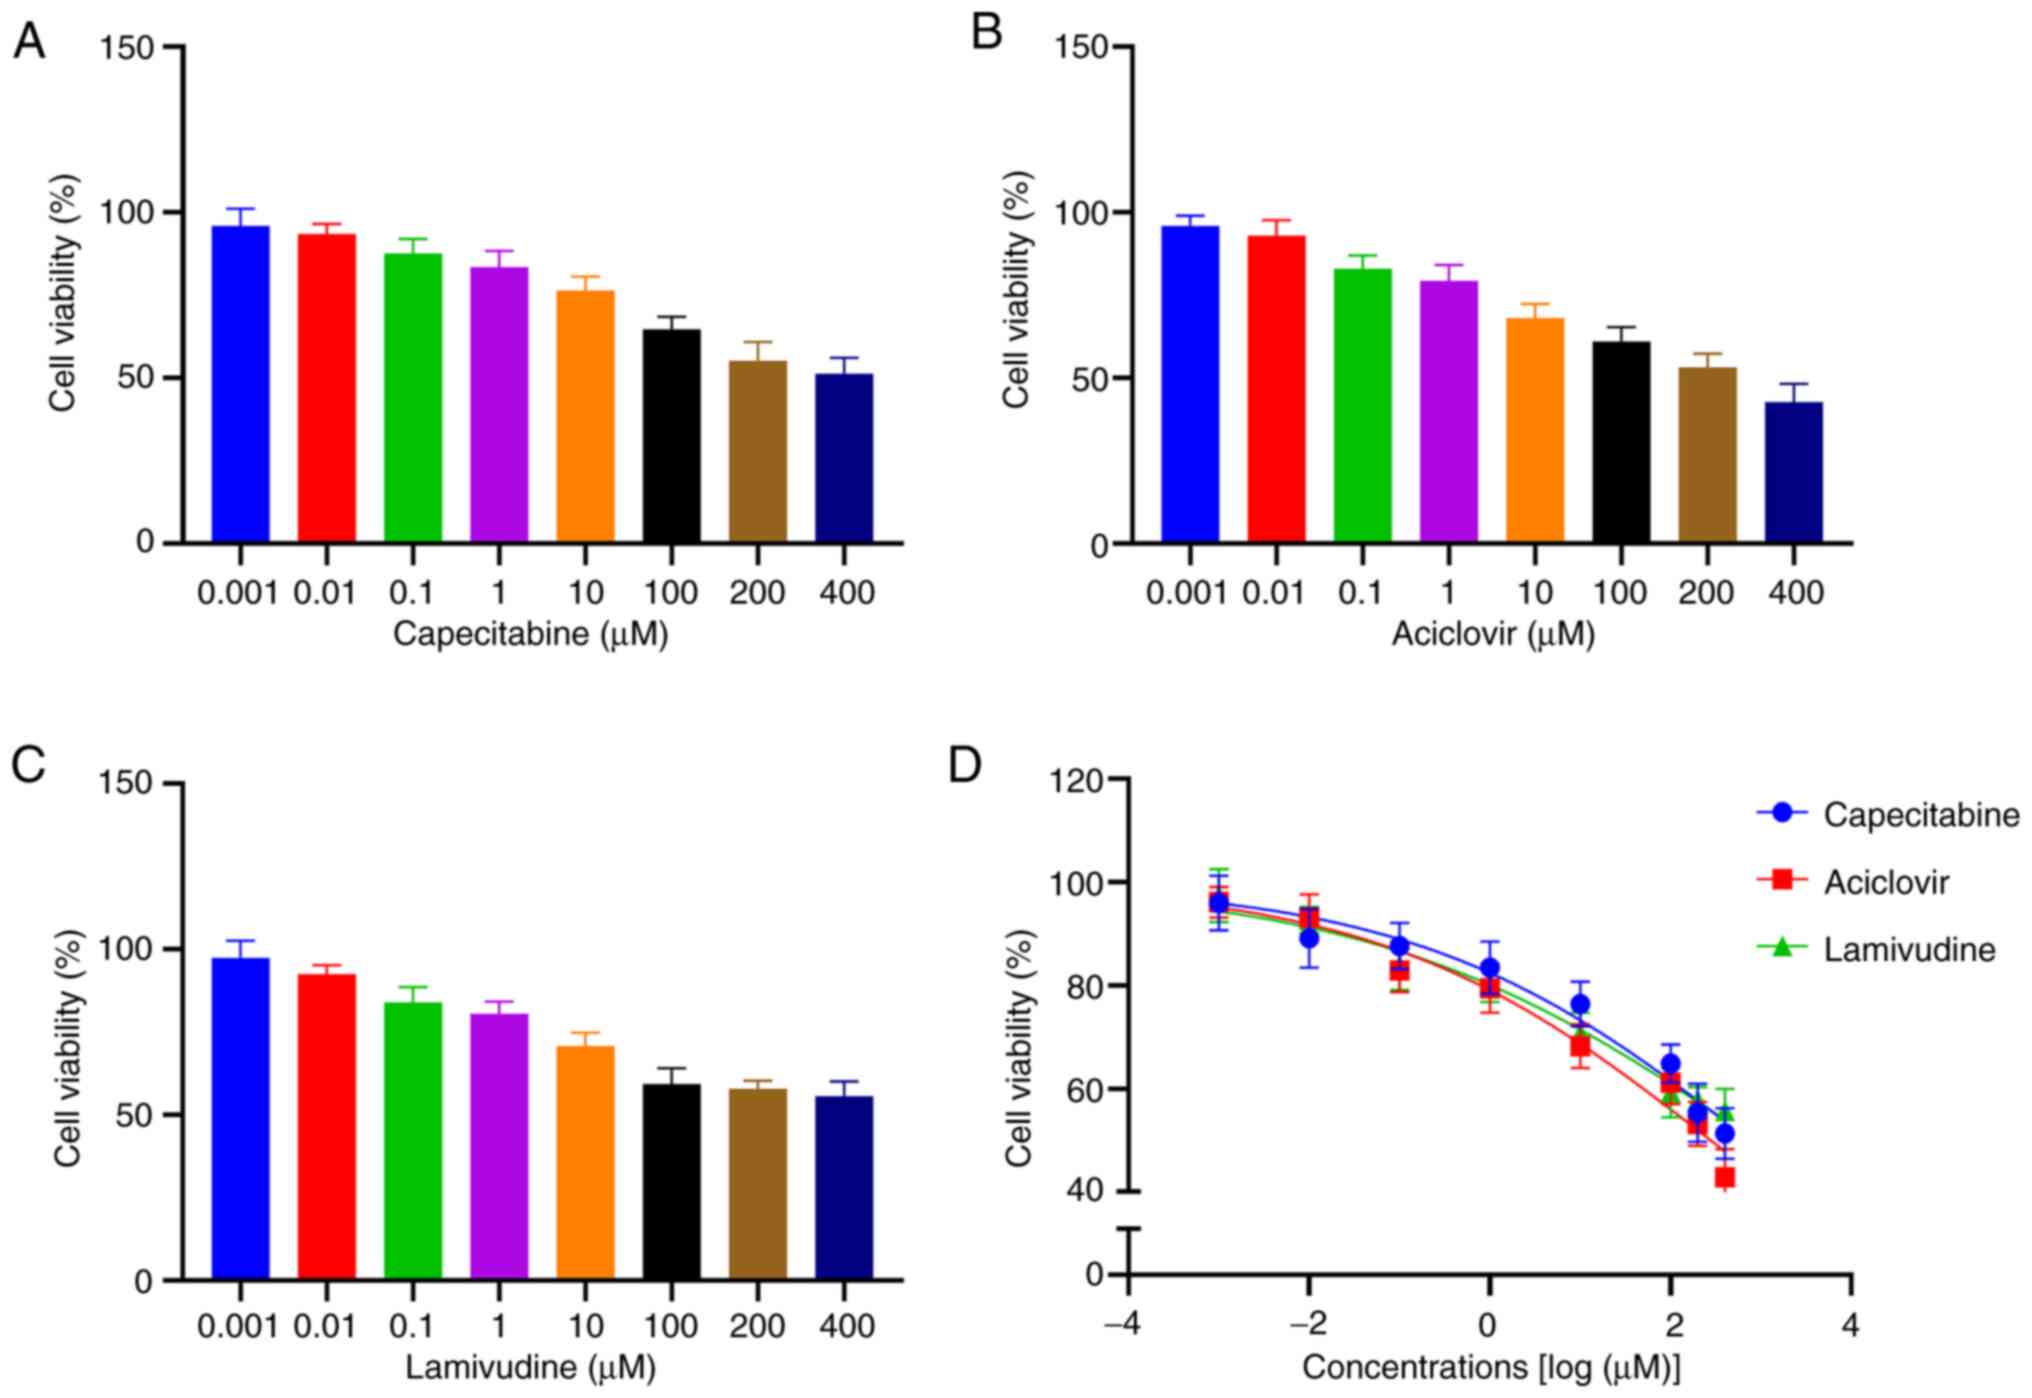
Cytotoxicity of capecitabine and its
metabolites on HaCaT cells
HaCaT cells were treated with varying concentrations
(0.001, 0.01, 0.1, 1, 10, 100, 200 and 400 µM) of capecitabine,
aciclovir, genistein, lomerizine and lamivudine. Cytotoxicity was
measured using the CCK-8 assay and IC50 values were
calculated. Aciclovir and lamivudine exhibited the highest levels
of toxicity in HaCaT cells (IC50 values, 278.1 and 853.5
µΜ, respectively) compared with genistein and lomerizine
(IC50 values, 13,982 and 1,511 µΜ, respectively).
Notably, the IC50 value for capecitabine was 752.2 µΜ.
Fig. 3 illustrates the association
between cell viability and concentration of aciclovir, lamivudine
and capecitabine.
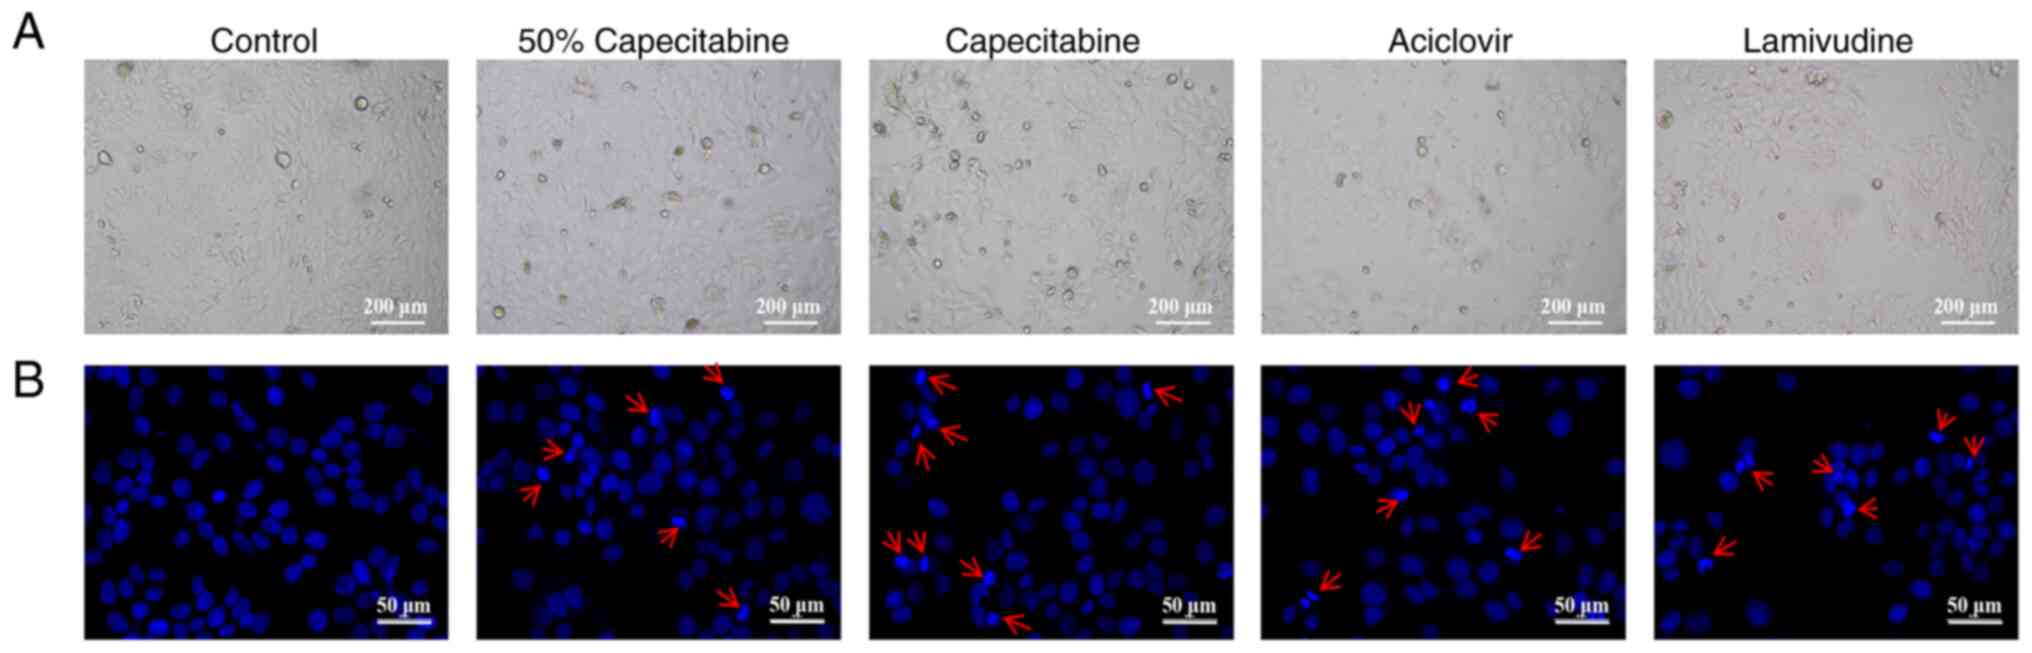
Effect of capecitabine and its
metabolites on cell morphology
Based on the calculated IC50 values,
HaCaT cells were treated with 50% IC50 capecitabine,
IC50 capecitabine, IC50 aciclovir and
IC50 lamivudine. Microscopic observation of cell
morphology (Fig. 4A) revealed a
reduction in cell number and signs of apoptosis in all groups.
Hoechst 33258 staining (Fig. 4B)
further confirmed nuclear condensation following treatment
(indicated by red arrows). Annexin V/PI staining (Fig. 5) revealed the apoptosis rate of
cells in each group.
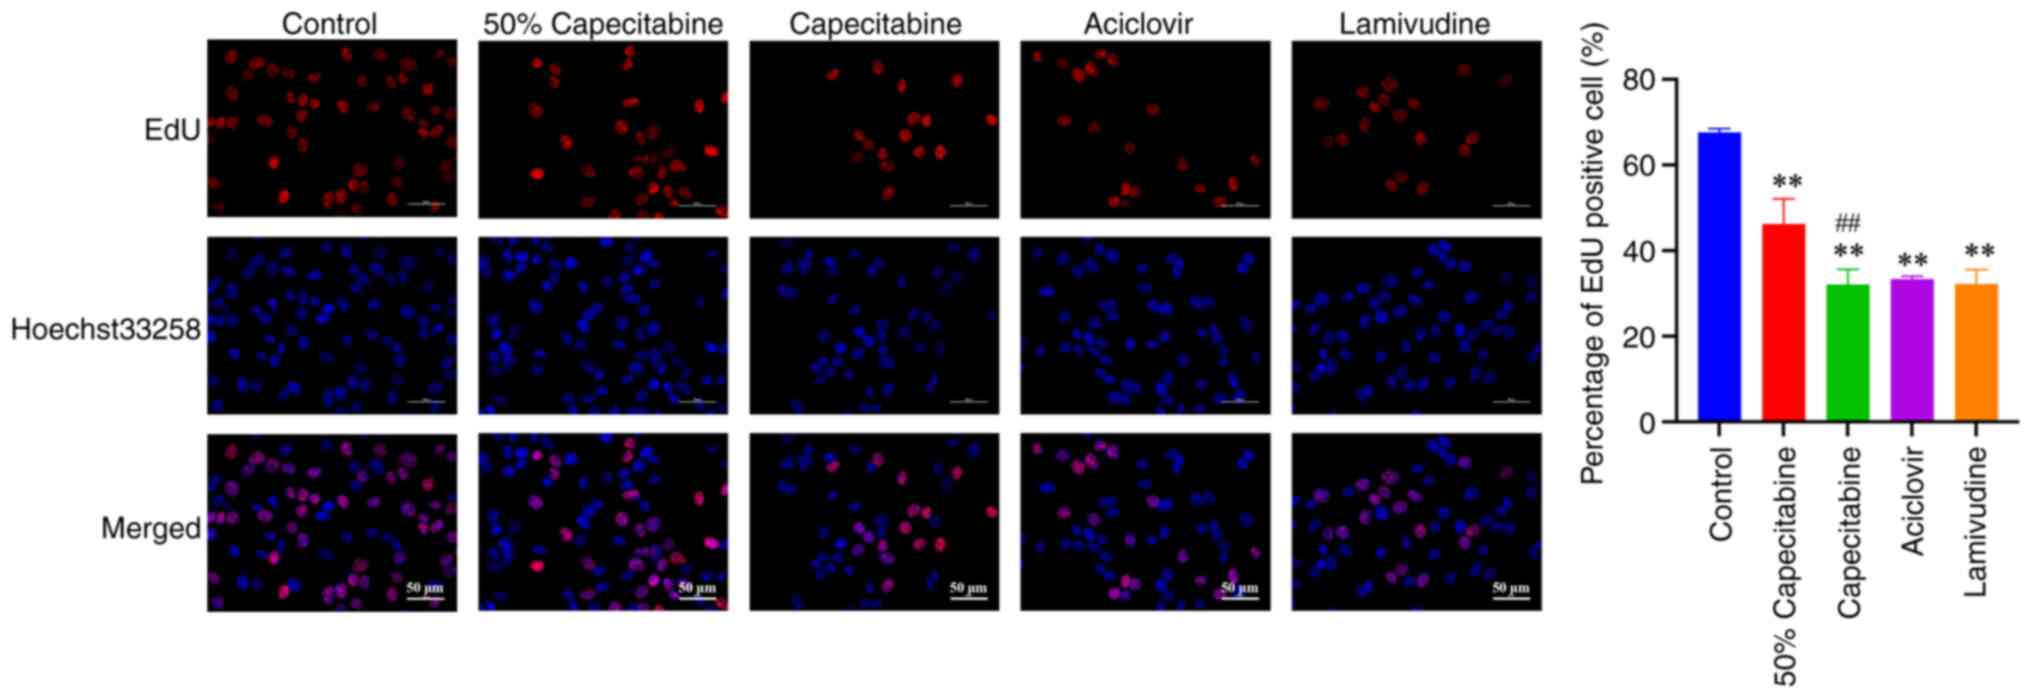
Effects of capecitabine and its
metabolites on HaCaT cell proliferation
The EdU assay was used to determine HaCaT cell
proliferation in blank control, 50% IC50 capecitabine,
IC50 capecitabine, IC50 aciclovir and
IC50 lamivudine groups. As shown in Fig. 6, the number of EdU-positive cells
in the capecitabine, aciclovir and lamivudine groups were markedly
reduced and this was indicative of inhibited HaCaT cell
proliferation.
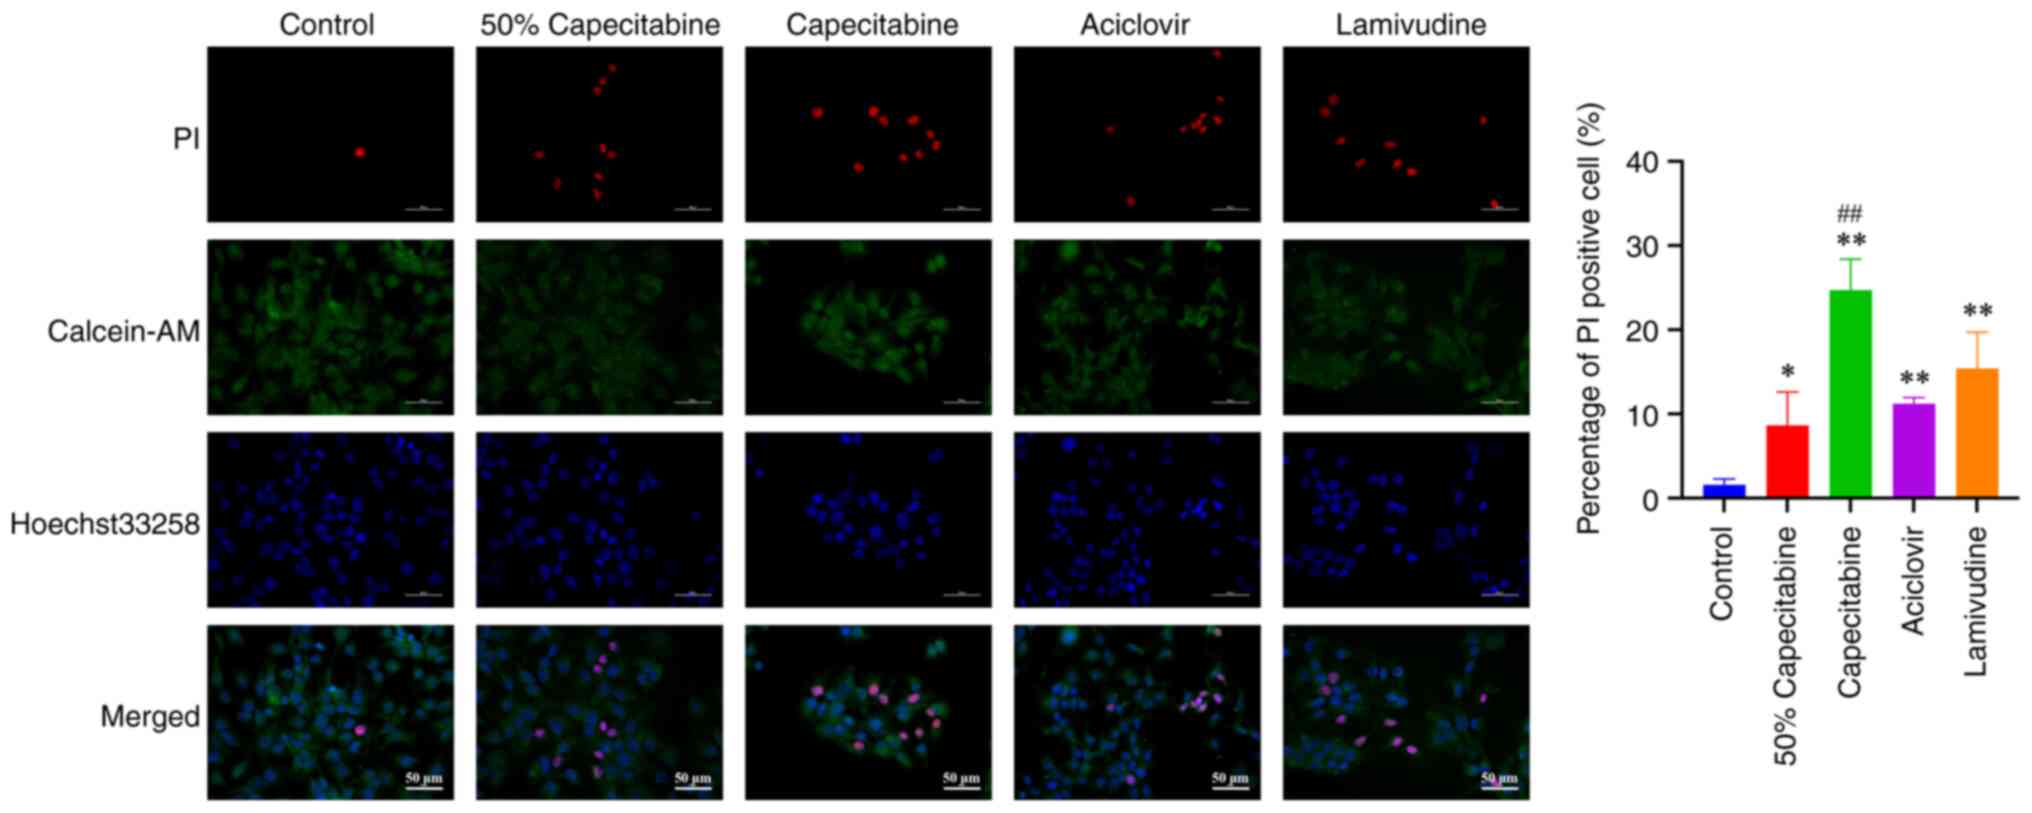
Cell viability
Using Calcein-AM/PI dual staining, the viability of
HaCaT cells was compared between control, 50% IC50 capecitabine,
IC50 capecitabine, IC50 aciclovir and
IC50 lamivudine groups. Green fluorescence resulting
from Calcein staining is indicative of live cells, while dead cells
are marked using red fluorescence resulting from PI staining. As
shown in Fig. 7, capecitabine,
aciclovir and lamivudine groups demonstrated different rates of
apoptosis, with capecitabine markedly promoting apoptosis, compared
with its metabolites.
Discussion
In the present study, 85 patients undergoing
capecitabine treatment for cancer were recruited. In total, >50%
of the participants developed HFS, highlighting the high incidence
of capecitabine-induced HFS. This condition markedly affects a
patient's quality of life. Thus, further investigations into the
metabolic mechanisms underlying capecitabine and early intervention
are required, without reducing therapeutic effectiveness.
The present study performed a non-targeted
metabolomic analysis of blood samples, which included lipids as
part of the broader metabolome. The present study did not
specifically isolate or focus on lipid fractions, as this would
require a targeted lipidomics approach. Instead, the goal was to
capture a wide range of metabolites.
The present study analyzed plasma rather than whole
blood to reduce complexity and ensure metabolite stability, as
whole blood contains cellular components that can introduce
variability. This approach aligns with standard practices in
non-targeted metabolomics and allows for broader metabolome
exploration.
The present study aimed to determine novel
metabolites of capecitabine in patients with capecitabine-induced
HFS. Significant differences in metabolites between HFS-positive
and HFS-negative patients were observed using untargeted
metabolomics. A total of 193 differential metabolites were
identified, with 134 upregulated and 59 downregulated. Results of
the bioinformatics analysis demonstrated that aciclovir,
lamivudine, genistein and lomerizine exhibited high VIP values.
Further in vitro validation of these compounds was performed
based on the specific functions.
Results of the present study revealed that ciclovir
and lamivudine exerted the highest levels of cell damage.
Hochest33258 staining revealed that treatment with capecitabine,
aciclovir and lamivudine led to high levels of cell damage,
apoptosis and nuclear condensation. Annexin V/PI staining revealed
that treatment with capecitabine, aciclovir and lamivudine led to
high rates of apoptosis. Moreover, results of EdU assays
demonstrated that capecitabine, aciclovir and lamivudine inhibited
HaCaT cell proliferation. Calcein-AM/PI double staining indicated
cell necrosis following treatment with capecitabine, acyclovir and
lamivudine, with aciclovir and lamivudine treatment inducing
notably higher rates of apoptosis. In vitro experiments
confirmed the cytotoxic effects of aciclovir and lamivudine on
HaCaT cells. Collectively, these results suggested that aciclovir
and lamivudine may play a role in the development of HFS.
Aciclovir is a nucleoside analog that is
structurally similar to guanosine and this metabolite may cause
neurotoxicity. Results of previous studies demonstrated that
aciclovir-induced neurotoxicity may cause confusion, psychiatric
symptoms and in some cases, seizures, myoclonus and dysarthria
(22,31,32).
The observed neurotoxicity is often reversible and results of
previous studies suggested that it may be associated with the
accumulation of aciclovir and its metabolite,
9-(carboxymethoxymethyl)guanine. Pharmacokinetic data also
indicates that hepatic and renal clearance rates are closely
associated with its toxicity (33,34).
Lamivudine, a nucleoside reverse transcriptase
inhibitor (NRTI), is primarily associated with peripheral
neuropathy, including distal sensory peripheral neuropathy
(35,36) Oxygen-dependent tissues, such as the
heart muscle, skeletal and smooth muscles, as well as the central
and peripheral nervous systems, are susceptible to NRTI-related
toxicity. NRTIs contain an azido group, which competes with natural
thymidine triphosphate as a substrate for DNA polymerase γ, leading
to the termination of mitochondrial DNA (mtDNA) synthesis. This
inhibits both nuclear and mtDNA polymerases, causing DNA chain
termination at the nucleoside analog insertion point (37). Prolonged exposure to nucleoside
analogs may result in short-term mitochondrial damage. Previous
studies suggested that NRTI-induced peripheral neuropathy may be
caused by mitochondrial toxicity (38,39).
HFS is one of the most severe side effects
associated with capecitabine treatment in patients with cancer. The
observed levels of neurotoxicity are associated with the severity
of HFS, with higher levels of neurotoxicity corresponding to more
severe HFS. Notably, investigations that are focused on HFS risk
factors have not specifically focused on grade 2 and 3 HFS
(40–42). At present, research is focused on
the inflammatory response in patients with HFS (43,44).
Although the active component of capecitabine is 5-fluorouracil
(5-FU), metabolic analysis has not yet detected this metabolite.
Moreover, patients receiving systemic 5-FU alone experience fewer
symptoms associated with HFS, compared with those treated with
capecitabine (45). Results of
in vitro studies demonstrate that capecitabine may induce
keratinocyte death through the activation of apoptotic pathways and
the reduction of mitochondrial membrane potential (46). Notably, reactive metabolites
produced during metabolism may lead to drug toxicity (47,48).
Therefore, further investigations are required to determine the
specific role of metabolites associated with capecitabine and to
further clarify the mechanisms underlying HFS. This may aid in
treatment optimization, leading to personalized capecitabine
therapy.
Results of the present study provided valuable
insights into the cytotoxic effects of capecitabine and its
metabolites, with aciclovir and lamivudine affecting cellular
damage at the highest level. The identified metabolites may exhibit
potential as biomarkers to predict susceptibility to HFS, enabling
early identification of at-risk patients. Further investigations
are required to determine the specific mechanism by which
metabolites cause cell damage, leading to the development of novel
treatment options. For example, inhibitors that target these
specific pathways may aid in reducing the toxic effects of
capecitabine on skin cells. Patients exhibiting high levels of
these metabolites may benefit from personalized capecitabine dosing
strategies to minimize the risk of developing HFS while maintaining
therapeutic efficacy.
In conclusion, the present study used untargeted
metabolomics to identify metabolites associated with
capecitabine-induced HFS, offering novel insights into the
metabolic pathways involved in HFS. However, the present study
showed limitations, including a small sample size. Additional
large-scale investigations are required to determine the specific
mechanisms of capecitabine and the presence of metabolites in urine
or plasma samples. Further investigations should aim to identify
biomarkers for the development of personalized treatment options
for HFS.
Acknowledgments
Not applicable.
Funding
The present study was supported by Nanjing Health Science and
Technology Development Special Fund Project (grant no.
YKK21232).
Availability of data and materials
The data generated in the present study may be found
in the OMIX, China National Center for Bioinformation/Beijing
Institute of Genomics, Chinese Academy of Sciences at the following
URL https://ngdc.cncb.ac.cn/omix/release/OMIX009348.
Authors' contributions
YB performed all experiments, with the assistance of
HC, BS, ZW, YD, YH and YW. CZ and ZS interpreted the results. YB
and HC wrote the manuscript, contributed to the design of the study
and collected the data. LG was involved in the conception and
design of the study, provided critical interpretation of the data,
and contributed substantially to revising the manuscript for
important intellectual content. YB, HC and LG confirm the
authenticity of all the raw data. All authors read and approved the
final manuscript.
Ethics approval and consent to
participate
The present study was conducted according to the
guidelines of the Declaration of Helsinki and approved by the
Institutional Ethics Committee of Nanjing Jiangning Hospital of
Traditional Chinese Medicine (approval no. JZL-2021-08K-01).
Written informed consent was obtained from all individual
participants included in the present study.
Patient consent for publication
Not applicable.
Competing interests
The authors declare that they have no competing
interests.
References
|
1
|
Jo JH, Kim YT, Choi HS, Kim HG, Lee HS,
Choi YW, Kim DU, Lee KH, Kim EJ, Han JH, et al: Efficacy of GV1001
with gemcitabine/capecitabine in previously untreated patients with
advanced pancreatic ductal adenocarcinoma having high serum eotaxin
levels (KG4/2015): An open-label, randomised, Phase 3 trial. Br J
Cancer. 130:43–52. 2024. View Article : Google Scholar : PubMed/NCBI
|
|
2
|
Primrose JN, Fox RP, Palmer DH, Malik HZ,
Prasad R, Mirza D, Anthony A, Corrie P, Falk S, Finch-Jones M, et
al: Capecitabine compared with observation in resected biliary
tract cancer (BILCAP): A randomised, controlled, multicentre, phase
3 study. Lancet Oncol. 20:663–673. 2019. View Article : Google Scholar : PubMed/NCBI
|
|
3
|
Knikman JE, Rosing H, Guchelaar HJ, Cats A
and Beijnen JH: A review of the bioanalytical methods for the
quantitative determination of capecitabine and its metabolites in
biological matrices. Biomed Chromatogr. 34:e47322020. View Article : Google Scholar : PubMed/NCBI
|
|
4
|
Alzahrani SM, Al Doghaither HA, Al-Ghafari
AB and Pushparaj PN: 5-Fluorouracil and capecitabine therapies for
the treatment of colorectal cancer (Review). Oncol Rep. 50:1752023.
View Article : Google Scholar : PubMed/NCBI
|
|
5
|
Wang Z, Li X, Yang Y, Zhang F, Li M and
Chen W, Gao S and Chen W: A sensitive and efficient method for
determination of capecitabine and its five metabolites in human
plasma based on one-step liquid-liquid extraction. J Anal Methods
Chem. 2019:93717902019. View Article : Google Scholar : PubMed/NCBI
|
|
6
|
King TL, Voon PJ, Yuen KH and Mohamed Noor
DA: Hand-foot syndrome in cancer patients on capecitabine:
Examining prevalence, impacts, and associated risk factors at a
cancer centre in Malaysia. Support Care Cancer. 32:3452024.
View Article : Google Scholar : PubMed/NCBI
|
|
7
|
de Queiroz MVR, de Medeiros ACTR, Toledo
SP, de Abreu Sarmenghi KD and de Vasconcellos VF: Hand-foot
syndrome caused by capecitabine: incidence, risk factors and the
role of dermatological evaluation. Ecancermedicalscience.
16:13902022.PubMed/NCBI
|
|
8
|
Ahn HR, Lee SK, Youn HJ, Yun SK and Lee
IJ: Stevens-Johnson syndrome and concurrent hand foot syndrome
during treatment with capecitabine: A case report. World J Clin
Cases. 9:4279–4284. 2021. View Article : Google Scholar : PubMed/NCBI
|
|
9
|
Lou Y, Wang Q, Zheng J, Hu H, Liu L, Hong
D and Zeng S: Possible pathways of capecitabine-induced hand-foot
syndrome. Chem Res Toxicol. 29:1591–1601. 2016. View Article : Google Scholar : PubMed/NCBI
|
|
10
|
Hiromoto S, Kawashiri T, Yamanaka N,
Kobayashi D, Mine K, Inoue M, Uchida M and Shimazoe T: Use of
omeprazole, the proton pump inhibitor, as a potential therapy for
the capecitabine-induced hand-foot syndrome. Sci Rep. 11:89642021.
View Article : Google Scholar : PubMed/NCBI
|
|
11
|
Lu W, Huang Z, Chen S, Lv H, Chen X, Lei
J, Ke C, Hong C, Wei Y, Su R, et al: The effectiveness of
EVOSKIN(R)Palm and sole moisturizing cream in treating
capecitabine-associated hand-foot syndrome: A randomized
double-blind clinical trial. Ann Palliat Med. 10:3009–3017. 2021.
View Article : Google Scholar : PubMed/NCBI
|
|
12
|
Schag CC, Heinrich RL and Ganz PA:
Karnofsky performance status revisited: Reliability, validity, and
guidelines. J Clin Oncol. 2:187–193. 1984. View Article : Google Scholar : PubMed/NCBI
|
|
13
|
Freites-Martinez A, Santana N,
Arias-Santiago S and Viera A: Using the common terminology criteria
for adverse events (CTCAE-Version 5.0) to evaluate the severity of
adverse events of anticancer therapies. Actas Dermosifiliogr (Engl
Ed). 112:90–92. 2021.(In English, Spanish). View Article : Google Scholar : PubMed/NCBI
|
|
14
|
R Core Team, . R: A language and
environment for statistical computing. R Foundation for Statistical
Computing; Vienna: 2021
|
|
15
|
Li C, Zhang J, Wu R, Liu Y, Hu X, Yan Y
and Ling X: A novel strategy for rapidly and accurately screening
biomarkers based on ultraperformance liquid chromatography-mass
spectrometry metabolomics data. Anal Chim Acta. 1063:47–56. 2019.
View Article : Google Scholar : PubMed/NCBI
|
|
16
|
Karaman I: Preprocessing and pretreatment
of metabolomics data for statistical analysis. Adv Exp Med Biol.
965:145–161. 2017. View Article : Google Scholar : PubMed/NCBI
|
|
17
|
Yang J, Zhao X, Lu X, Lin X and Xu G: A
data preprocessing strategy for metabolomics to reduce the mask
effect in data analysis. Front Mol Biosci. 2:42015. View Article : Google Scholar : PubMed/NCBI
|
|
18
|
Liang JH, Lin Y, Ouyang T, Tang W, Huang
Y, Ye W, Zhao JY, Wang ZN and Ma CC: Nuclear magnetic
resonance-based metabolomics and metabolic pathway networks from
patient-matched esophageal carcinoma, adjacent noncancerous tissues
and urine. World J Gastroenterol. 25:3218–3230. 2019. View Article : Google Scholar : PubMed/NCBI
|
|
19
|
Berry L and Venkatesan P:
Aciclovir-induced neurotoxicity: Utility of CSF and serum CMMG
levels in diagnosis. J Clin Virol. 61:608–610. 2014. View Article : Google Scholar : PubMed/NCBI
|
|
20
|
Perez Valero I, Cabello A, Ryan P, De La
Fuente-Moral S, Santos I, Vivancos MJ, Gonzalez A, Gorgolas M,
Cuevas G, Diaz De Santiago A, et al: Randomized trial evaluating
the neurotoxicity of dolutegravir/abacavir/lamivudine and its
reversibility after switching to
elvitegravir/cobicistat/emtricitabine/tenofovir alafenamide: GESIDA
9016. Open Forum Infect Dis. 7:ofaa4822020. View Article : Google Scholar : PubMed/NCBI
|
|
21
|
Tarpey AE, Loranger A, Plambeck R and
Malesker MA: Neurotoxicity secondary to valacyclovir. J Pharm
Technol. 38:251–252. 2022. View Article : Google Scholar : PubMed/NCBI
|
|
22
|
Vonberg FW, Dawson A, Scott G and Davies
N: Aciclovir-induced neurotoxicity. Pract Neurol. 23:157–159. 2023.
View Article : Google Scholar : PubMed/NCBI
|
|
23
|
Garbiec E, Cielecka-Piontek J, Kowalowka
M, Holubiec M and Zalewski P: Genistein-opportunities related to an
interesting molecule of natural origin. Molecules. 27:8152022.
View Article : Google Scholar : PubMed/NCBI
|
|
24
|
Park JH, Hwang JW, Lee HJ, Jang GM, Jeong
YJ, Cho J, Seo J and Hoe HS: Lomerizine inhibits LPS-mediated
neuroinflammation and tau hyperphosphorylation by modulating NLRP3,
DYRK1A, and GSK3α/β. Front Immunol. 14:11509402023. View Article : Google Scholar : PubMed/NCBI
|
|
25
|
Wei TT, Chandy M, Nishiga M, Zhang A,
Kumar KK, Thomas D, Manhas A, Rhee S, Justesen JM, Chen IY, et al:
Cannabinoid receptor 1 antagonist genistein attenuates
marijuana-induced vascular inflammation. Cell. 185:2387–2389.e23.
2022. View Article : Google Scholar : PubMed/NCBI
|
|
26
|
Hannun YA and Obeid LM: Principles of
bioactive lipid signalling: Lessons from sphingolipids. Nat Rev Mol
Cell Biol. 9:139–150. 2008. View Article : Google Scholar : PubMed/NCBI
|
|
27
|
van Meer G, Voelker DR and Feigenson GW:
Membrane lipids: Where they are and how they behave. Nat Rev Mol
Cell Biol. 9:112–124. 2008. View Article : Google Scholar : PubMed/NCBI
|
|
28
|
Dennis EA and Norris PC: Eicosanoid storm
in infection and inflammation. Nat Rev Immunol. 15:511–523. 2015.
View Article : Google Scholar : PubMed/NCBI
|
|
29
|
Brosnan JT: Interorgan amino acid
transport and its regulation. J Nutr. 133 (6 Suppl 1):2068S–2072S.
2003. View Article : Google Scholar : PubMed/NCBI
|
|
30
|
DeBerardinis RJ and Chandel NS:
Fundamentals of cancer metabolism. Sci Adv. 2:e16002002016.
View Article : Google Scholar : PubMed/NCBI
|
|
31
|
Arlemalm A, Hellden A, Karlsson L and
Carlsson B: Rapid determination of acyclovir, its main metabolite
9-carboxymethoxymethylguanine, ganciclovir, and penciclovir in
human serum using LC-MS/MS. Biomed Chromatogr. 36:e53152022.
View Article : Google Scholar : PubMed/NCBI
|
|
32
|
Abuhelwa Z, Beran A, Venkataramany BS,
Hinch BT and Assaly R: Concurrent nephrotoxicity and neurotoxicity
induced by oral valacyclovir in a patient with previously normal
kidney function. Cureus. 14:e236932022.PubMed/NCBI
|
|
33
|
Aboelezz A and Mahmoud SH: Acyclovir
dosing in herpes encephalitis: A scoping review. J Am Pharm Assoc
(2003). 64:1020402024. View Article : Google Scholar : PubMed/NCBI
|
|
34
|
Takeda S, Ueno S, Zenda R, Muto K, Iseki K
and Harada K: Simultaneous analysis of acyclovir and its metabolite
using hydrophilic interaction liquid chromatography-tandem mass
spectrometry. J Anal Toxicol. 48:204–209. 2024. View Article : Google Scholar : PubMed/NCBI
|
|
35
|
Leger PD, Johnson DH, Robbins GK, Shafer
RW, Clifford DB, Li J, McLaren PJ and Haas DW: Genome-wide
association study of peripheral neuropathy with D-drug-containing
regimens in AIDS clinical trials Group protocol 384. J Neurovirol.
20:304–308. 2014. View Article : Google Scholar : PubMed/NCBI
|
|
36
|
Bokore A, Korme B and Bayisa G:
Determinants of anti-retroviral regimen changes among HIV/AIDS
patients of east and west Wollega zone health institutions, Oromia
region, west Ethiopia: A cross-sectional study. BMC Pharmacol
Toxicol. 19:282018. View Article : Google Scholar : PubMed/NCBI
|
|
37
|
Dalakas MC: Peripheral neuropathy and
antiretroviral drugs. J Peripher Nerv Syst. 6:14–20. 2001.
View Article : Google Scholar : PubMed/NCBI
|
|
38
|
Youle M: Acetyl-L-carnitine in
HIV-associated antiretroviral toxic neuropathy. CNS Drugs. 21
(Suppl 1):25–30; discussion 45–26. 2007. View Article : Google Scholar : PubMed/NCBI
|
|
39
|
Dagan T, Sable C, Bray J and Gerschenson
M: Mitochondrial dysfunction and antiretroviral nucleoside analog
toxicities: What is the evidence? Mitochondrion. 1:397–412. 2002.
View Article : Google Scholar : PubMed/NCBI
|
|
40
|
Chantharakhit C and Sujaritvanichpong N:
Predictive factors for the development of capecitabine-induced
hand-foot syndrome: A retrospective observational cohort study. Ann
Med Surg (Lond). 86:73–77. 2024. View Article : Google Scholar : PubMed/NCBI
|
|
41
|
Yap YS, Kwok LL, Syn N, Chay WY, Chia JWK,
Tham CK, Wong NS, Lo SK, Dent RA, Tan S, et al: Predictors of
hand-foot syndrome and pyridoxine for prevention of
capecitabine-induced hand-foot syndrome: A Randomized clinical
trial. JAMA Oncol. 3:1538–1545. 2017. View Article : Google Scholar : PubMed/NCBI
|
|
42
|
Kwakman JJM, Simkens LHJ, van Rooijen JM,
van de Wouw AJ, Ten Tije AJ, Creemers GJM, Hendriks MP, Los M, van
Alphen RJ, Polee MB, et al: Randomized phase III trial of S-1
versus capecitabine in the first-line treatment of metastatic
colorectal cancer: SALTO study by the Dutch colorectal cancer
group. Ann Oncol. 28:1288–1293. 2017. View Article : Google Scholar : PubMed/NCBI
|
|
43
|
Santhosh A, Sharma A, Bakhshi S, Kumar A,
Sharma V, Malik PS, Pramanik R, Gogia A, Prasad CP, Sehgal T, et
al: Topical diclofenac for prevention of capecitabine-associated
hand-foot syndrome: A double-blind randomized controlled trial. J
Clin Oncol. 42:1821–1829. 2024. View Article : Google Scholar : PubMed/NCBI
|
|
44
|
Lian S, Zhang X, Zhang Y and Zhao Q:
Pyridoxine for prevention of hand-foot syndrome caused by
chemotherapy agents: A meta-analysis. Clin Exp Dermatol.
46:629–635. 2021. View Article : Google Scholar : PubMed/NCBI
|
|
45
|
Azuma Y, Hata K, Sai K, Udagawa R,
Hirakawa A, Tohkin M, Ryushima Y, Makino Y, Yokote N, Morikawa N,
et al: Significant association between hand-foot syndrome and
efficacy of capecitabine in patients with metastatic breast cancer.
Biol Pharm Bull. 35:717–724. 2012. View Article : Google Scholar : PubMed/NCBI
|
|
46
|
Chen M, Chen J, Peng X, Xu Z, Shao J, Zhu
Y, Li G, Zhu H, Yang B, Luo P and He Q: The contribution of
keratinocytes in capecitabine-stimulated hand-foot-syndrome.
Environ Toxicol Pharmacol. 49:81–88. 2017. View Article : Google Scholar : PubMed/NCBI
|
|
47
|
Guengerich FP and MacDonald JS: Applying
mechanisms of chemical toxicity to predict drug safety. Chem Res
Toxicol. 20:344–369. 2007. View Article : Google Scholar : PubMed/NCBI
|
|
48
|
Park SY, Kim MW, Kang JH, Hwang JH, Choi
H, Park J, Seong JK, Yoon YS and Oh SH: Loss of Ninjurin1
alleviates acetaminophen-induced liver injury via enhancing
AMPKα-NRF2 pathway. Life Sci. 350:1227822024. View Article : Google Scholar : PubMed/NCBI
|