Introduction
Leukemia disrupts the homeostasis of the
hematopoietic system and causes abnormal proliferation of blast
cells (1). Acute myeloid leukemia
(AML), including its M2 subtype, reduces survival in adults;
therefore, establishing effective treatment strategies is critical
for improving prognosis (2,3).
Chemotherapy, such as the ‘7+3’ regimen, remains the standard
first-line treatment for AML. However, in some relapsed or
refractory cases, total body irradiation (TBI) is used as part of
conditioning regimens before hematopoietic stem cell
transplantation to eradicate residual leukemic cells (4,5).
Repeated exposure to radiation in such settings may, in rare cases,
contribute to the emergence of leukemic cells with reduced
radiosensitivity, potentially impeding complete remission. Although
the concept of ‘radiation-resistant AML’ is not widely recognized
in clinical settings, where resistance is more commonly associated
with chemotherapy, TBI has been implicated as a contributing factor
in therapy-related AML (6).
Furthermore, a phase II clinical trial evaluating treosulfan,
fludarabine, and low-dose TBI in pediatric and young adult AML/MDS
patients highlighted the clinical relevance and complex outcomes of
TBI-based regimens, including relapse and non-relapse mortality
(7). While radiation resistance is
not a routine concern in AML treatment, these findings support the
relevance of exploring the molecular basis of radiation
response.
In the present study, we employed an in vitro
AML model to investigate the acquisition of radioresistance.
Specifically, we previously established a radioresistant AML cell
line (Res-HL60) derived from HL60 cells, an AML M2 subtype cell
line of human origin, and investigated the molecular mechanisms
underlying radioresistance. Through repeated irradiation, the
Res-HL60 cells acquired smaller morphology, increased proliferative
potency, and showed elevated expression of CD38 cell surface
antigen and several mRNAs (8–12).
However, the upstream regulatory mechanism governing these gene
expression changes remains unclear, necessitating further
investigation.
MicroRNAs (miRNAs), a class of noncoding RNAs that
regulate mRNA translation, have been implicated in cancer
progression and cell behavior, and their expression patterns are
increasingly recognized as diagnostic and prognostic biomarkers
(13,14). Additionally, miRNAs have emerged as
potential therapeutic targets in cancer. Despite this, the profile
of miRNA expression in radioresistant AML cells such as Res-HL60
has not been previously reported. Given that chromosomal
abnormalities, epigenetic dysregulation, and impaired miRNA
biogenesis, potentially triggered by frequent radiation exposure,
can all influence miRNA expression (15), investigating these changes may help
clarify the molecular basis of acquired radioresistance. Therefore,
in this study, we performed transcriptome analysis focusing on
miRNA expression in Res-HL60 cells to explore mechanisms associated
with radioresistance in AML.
Materials and methods
Leukemia cell line and culture
The human AML cell line HL60 (wild-type: Wt-HL60)
was obtained from the RIKEN BioResource Center. The Res-HL60 cell
line was generated by exposing Wi-HL60 cells to 4-Gy irradiation
per week for 4 weeks. Wt-HL60 and Res-HL60 cells were cultured in
RPMI-1640 medium (Thermo-Fisher Scientific, Inc.) supplemented with
10% heat-inactivated fetal bovine serum (Japan Bioserum, Inc.) and
1% penicillin/streptomycin (Thermo-Fisher Scientific, Inc.) in a
humidified atmosphere containing 5% CO2 at 37°C. In this
study, the control group was defined as non-irradiated Wt-HL60
cells cultured under these standard conditions (5% CO2
and 95% air). The characteristics of Res-HL60 cells, including
higher proliferative capacity, smaller cell size and altered
chemical reactivity, have been reported previously by our group
(8–12). In the present study, a time-course
analysis of morphological changes in Res-HL60 cells was conducted
(Fig. 1). Cells were initially
seeded at a density of 2×10⁵ cells/ml on Day-1. X-ray
irradiation was performed on Day 0. On Day 2 (i.e., the third day
after initial seeding), cells were passaged and reseeded at
2×10⁵ cells/ml. When the cell density remained below
2×10⁵ cells/ml, only medium replacement was performed.
No additional supplements (e.g., non-essential amino acids, sodium
pyruvate) were added. To calculate the cumulative total viable cell
number including all passages, the following formula was used:
Cumulative cell number (/ml)=A × [(2×10⁵) +
B]/(2×105), where ‘A’ is the viable cell number
(cells/ml) measured up to Day 2 (before passaging), and ‘B’ is the
net increase in viable cell number (cells/ml) from Day 3 onward,
relative to the reseeded density (2×10⁵ cells/ml). B=0
for Days 0–2. This method allowed us to reflect the overall
proliferation dynamics across reseeding and media replacement
steps. The updated y-axis label in Fig. 2A and B reflects this definition. To
confirm the identity and authenticity of the cell lines used in
this study, short tandem repeat (STR) profiling was performed. The
STR profiles of both Wt-HL60 and Res-HL60 showed a perfect match
with the reference profile for HL60 (Cellosaurus ID: CVCL_0002,
URL: http://www.cellosaurus.org/CVCL_0002), as provided by
the RIKEN BioResource Center, indicating no evidence of
contamination or misidentification. The STR profiles are provided
in Fig. S1 and Table SI.
Irradiation
X-ray irradiation (150 kVp, 20 mA with 0.5-mm
aluminum and 0.3-mm copper filters) was performed using an X-ray
generator (MBR-1520R-3; Hitachi Medical Co., Ltd.) at a distance of
45 cm between the focus and target. The dose was monitored during
irradiation using a thimble ionization chamber set next to the
sample. The dose rate was 1 Gy/min. The cultured cells were exposed
to X-rays as previously described (8–12).
Flow cytometry analysis
Flow cytometry was performed using Cell Lab
Quanta™ Sc MPL system (Beckman Colter Immunotech) to
assess cell size, granularity, and CD38 surface expression. Unlike
conventional flow cytometers that use forward scatter to estimate
cell size, the Cell Lab Quanta utilizes Electric Volume (EV), which
is based on the Coulter principle, to directly measure cell size
via changes in electrical resistance as cells pass through an
aperture. This method allows for accurate assessment of cell volume
independent of optical scattering. Granularity, representing
internal cellular complexity, was evaluated based on side scatter
(SSC) intensity, as is standard in flow cytometry. CD38 expression
was also assessed due to its dual relevance as both a hematopoietic
differentiation marker and a potential indicator of acquired
radioresistance. CD38 is a well-characterized surface antigen known
to be markedly upregulated during granulocytic differentiation of
HL60 cells (16). Furthermore, our
previous studies demonstrated sustained CD38 expression in Res-HL60
cells even in the absence of differentiation-inducing agents,
suggesting a role in the radioresistant phenotype (8–12).
Based on these findings, CD38 was utilized in this study both as a
marker of differentiation and as a surrogate indicator of radiation
resistance.
DNA fragmentation
The Comet Assay Single Cell Gel Electrophoresis
Assay (cat. no. 4250-050-K; TREVIGEN, Inc., Gaithersburg, USA) was
used to evaluate the DNA fragments of the cells irradiated with
X-rays. One day after seeding in a 60-mmφ culture dish at a
concentration of 1.0×10⁵ cells/ml, the cells were
irradiated with 1–4 Gy of X-rays, and the cells were collected
after 24 h. The collected cells were fixed on glass slide
(Matsunami Grass Inc., Osaka, Japan) using LM Agarose (TREVIGEN
Inc.). The glass slide to which the sample was attached was
immersed in an alkaline solution [200-mM NaOH, 1-mM
ethylenediaminetetraacetic acid (EDTA)], and electrophoresis (21 V,
3 A, 30 min, 4°C) was performed. After washing the glass slide with
distilled water and 70% EtOH and drying, it was stained with 100 µl
of a staining solution containing a mixture of SYBR Green (TREVIGEN
Inc.) and TE Buffer (10-mM Tris, 1-mM EDTA). After drying, the tail
moment was observed using a fluorescence microscope (OLYMPUS Inc.).
Images were taken using Comet Assay IV (Instem, Conshohocken, USA)
for observation purposes. Tail moment was calculated using the
formula: Tail Moment=Tail Length × % Tail DNA/100, using Comet
Assay IV software. This calculation reflects both the extent and
the intensity of DNA fragmentation in individual cells.
Extraction of total RNAs from
cells
Total intracellular RNAs (four replicates performed
in parallel) were extracted using ISOGEN II (Nippon Gene Co., Ltd.)
according to the manufacturer's instructions. The purity and
concentration of extracellular RNAs were assessed using a NanoDrop
spectrophotometer (NanoDrop Technologies; Thermo-Fisher Scientific,
Inc.). The RNA samples had 260/280-nm absorbance ratios of 1.8–2.0.
Furthermore, the peaks of the small RNAs were confirmed using an
Agilent 2100 Bioanalyzer (Agilent Technologies, Inc.).
Microarray analysis of miRNAs
SurePrint G3 human miRNA 8×60-K Microarray (Agilent
Technologies Inc.) was used to analyze intracellular microRNA
expression. Cyanine 3 labeling was performed with 1 ng of
intracellular microRNA using an miRNA Complete Labeling and
Hybridization kit (Agilent Technologies Inc.), following the
manufacturer's instructions. After hybridization and washing of the
microarray slide, fluorescence image scanning was performed using a
SureScan G 2600 D (Agilent Technologies Inc.). The expression data
were processed using GeneSpring GX14.5 (Agilent Technologies, Inc.)
to normalize the quantiles of all values in the respective
microarrays. The obtained microarray data were registered with the
Gene Expression Omnibus (GEO) (GSE285934).
Reverse transcription-quantitative PCR
(RT-qPCR) analysis
First-strand cDNA was synthesized using
Mir-X™ miRNA First-Strand Synthesis Kit (Takara Bio
Inc., Otsu, Japan; Cat. Nos. 638313) according to the
manufacturer's protocol (Protocol No. PT5001-1). MiRNA expression
was assessed by qPCR using TB Green Advantage qPCR Premix (Takara
Bio Inc., Cat. Nos. 639676) on a SmartCycler® II system
(Takara Bio Inc.). The thermocycling conditions were as follows:
95°C for 10 sec, followed by 40 cycles of 95°C for 5 sec and 60°C
for 20 sec. Relative miRNA expression levels were calculated using
the 2−ΔΔCq method. U6 small nuclear RNA, included as an
internal control primer set in the Mir-X™ First-Strand
Synthesis Kit (Takara Bio Inc., Cat. Nos. 638313), was used for
normalization. The exact primer sequences for U6 were not publicly
disclosed, and direct inquiries to the manufacturer did not yield
this information. However, the Mir-X™ system is widely
used and has been independently validated in numerous peer-reviewed
studies for reliable miRNA quantification. We adhered strictly to
the manufacturer's standardized protocol to ensure data
reproducibility and accuracy. For the analysis ΔCq was calculated
as (Cq of target miRNA-Cq of U6). ΔΔCq was defined as (ΔCq of
Res-HL60-ΔCq of Wt-HL60), and fold change was calculated as
2−ΔΔCq, with Wt-HL60 set as the baseline (fold change-1)
(17). Sequences of the target
miRNAs were obtained from the miRBase database (https://www.mirbase.org/). MiRNA-specific forward
primers were synthesized by Eurofins Genomics Inc. and are listed
in Table I. A universal reverse
primer provided in the Mir-X™ kit was used for all
miRNAs. The Mir-X™ qRT-PCR system employs a
poly(A)-tailing strategy followed by reverse transcription with an
adapter-anchored oligo(dT) primer. This approach selectively
amplifies mature polyadenylated miRNAs, while excluding pre-miRNAs,
long non-coding RNAs, and host transcripts lacking poly(A) tails.
The specificity of the amplification was further supported by the
observation of single, sharp melt curve peaks in all reactions.
 | Table I.Sequences of miRNA primers for
reverse transcription-quantitative PCR. |
Table I.
Sequences of miRNA primers for
reverse transcription-quantitative PCR.
| Primer name | Accession no. | Sequence,
5′-3′ |
|---|
| hsa-miR-3612 | MIMAT0017989 |
AGGAGGCATCTTGAGAAATGGA |
| hsa-miR-324-5p | MIMAT0000761 |
CGCATCCCCTAGGGCATTGGTG |
|
hsa-miR-146a-5p | MIMAT0000449 |
TGAGAACTGAATTCCATGGGTT |
| hsa-miR-1246 | MIMAT0005898 |
AATGGATTTTTGGAGCAGG |
|
hsa-miR-3190-3p | MIMAT0022839 |
TGTGGAAGGTAGACGGCCAGAGA |
|
hsa-miR-3156-5p | MIMAT0015030 |
AAAGATCTGGAAGTGGGAGACA |
| hsa-miR-124-3p | MIMAT0000422 |
TAAGGCACGCGGTGAATGCCAA |
| hsa-miR-9-3p | MIMAT0000442 |
ATAAAGCTAGATAACCGAAAGT |
| hsa-miR-324-3p | MIMAT0000762 |
CCCACTGCCCCAGGTGCTGCTGG |
| hsa-let-7e-5p | MIMAT0000066 |
TGAGGTAGGAGGTTGTATAGTT |
| hsa-miR-3669 | MIMAT0018092 |
TACGGAATATGTATACGGAATAT |
| hsa-miR-29b-3p | MIMAT0000100 |
TAGCACCATTTGAAATCAGTGTT |
|
hsa-miR-30c-1-3p | MIMAT0004674 |
CTGGGAGAGGGTTGTTTACTCC |
| hsa-miR-671-5p | MIMAT0003880 |
AGGAAGCCCTGGAGGGGCTGGAG |
| hsa-miR-425-5p | MIMAT0003393 |
AATGACACGATCACTCCCGTTGA |
| hsa-miR-345-5p | MIMAT0000772 |
GCTGACTCCTAGTCCAGGGCTC |
| hsa-miR-610 | MIMAT0003278 |
TGAGCTAAATGTGTGCTGGGA |
| hsa-miR-4260 | MIMAT0016881 |
CTTGGGGCATGGAGTCCCA |
|
hsa-miR-376c-3p | MIMAT0000720 |
AACATAGAGGAAATTCCACGT |
| hsa-miR-512-3p | MIMAT0002823 |
AAGTGCTGTCATAGCTGAGGTC |
| hsa-miR-744-3p | MIMAT0004946 |
CTGTTGCCACTAACCTCAACCT |
| hsa-miR-27b-3p | MIMAT0000419 |
TTCACAGTGGCTAAGTTCTGC |
| hsa-miR-7-2-3p | MIMAT0004554 |
CAACAAATCCCAGTCTACCTAA |
| hsa-miR-769-3p | MIMAT0003887 |
CTGGGATCTCCGGGGTCTTGGTT |
|
hsa-miR-3675-5p | MIMAT0018098 |
TATGGGGCTTCTGTAGAGATTTC |
| hsa-miR-101-5p | MIMAT0004513 |
CAGTTATCACAGTGCTGATGCT |
| hsa-miR-20b-5p | MIMAT0001413 |
CAAAGTGCTCATAGTGCAGGTAG |
Statistical analysis
Statistical analyses were performed using the Origin
software package (Pro version 9.0; OriginLab Corporation,
Northampton, MA, USA) and Microsoft Excel (Microsoft Office 365).
To evaluate the statistical significance of differences between the
control and experimental groups, an unpaired Student's t-test was
used, as the data met assumptions for parametric testing. All
results are presented as the mean ± SEM based on four independent
experiments. P<0.05 was considered to indicate a statistically
significant difference.
Results
Analysis of cell damage exposed to
IR
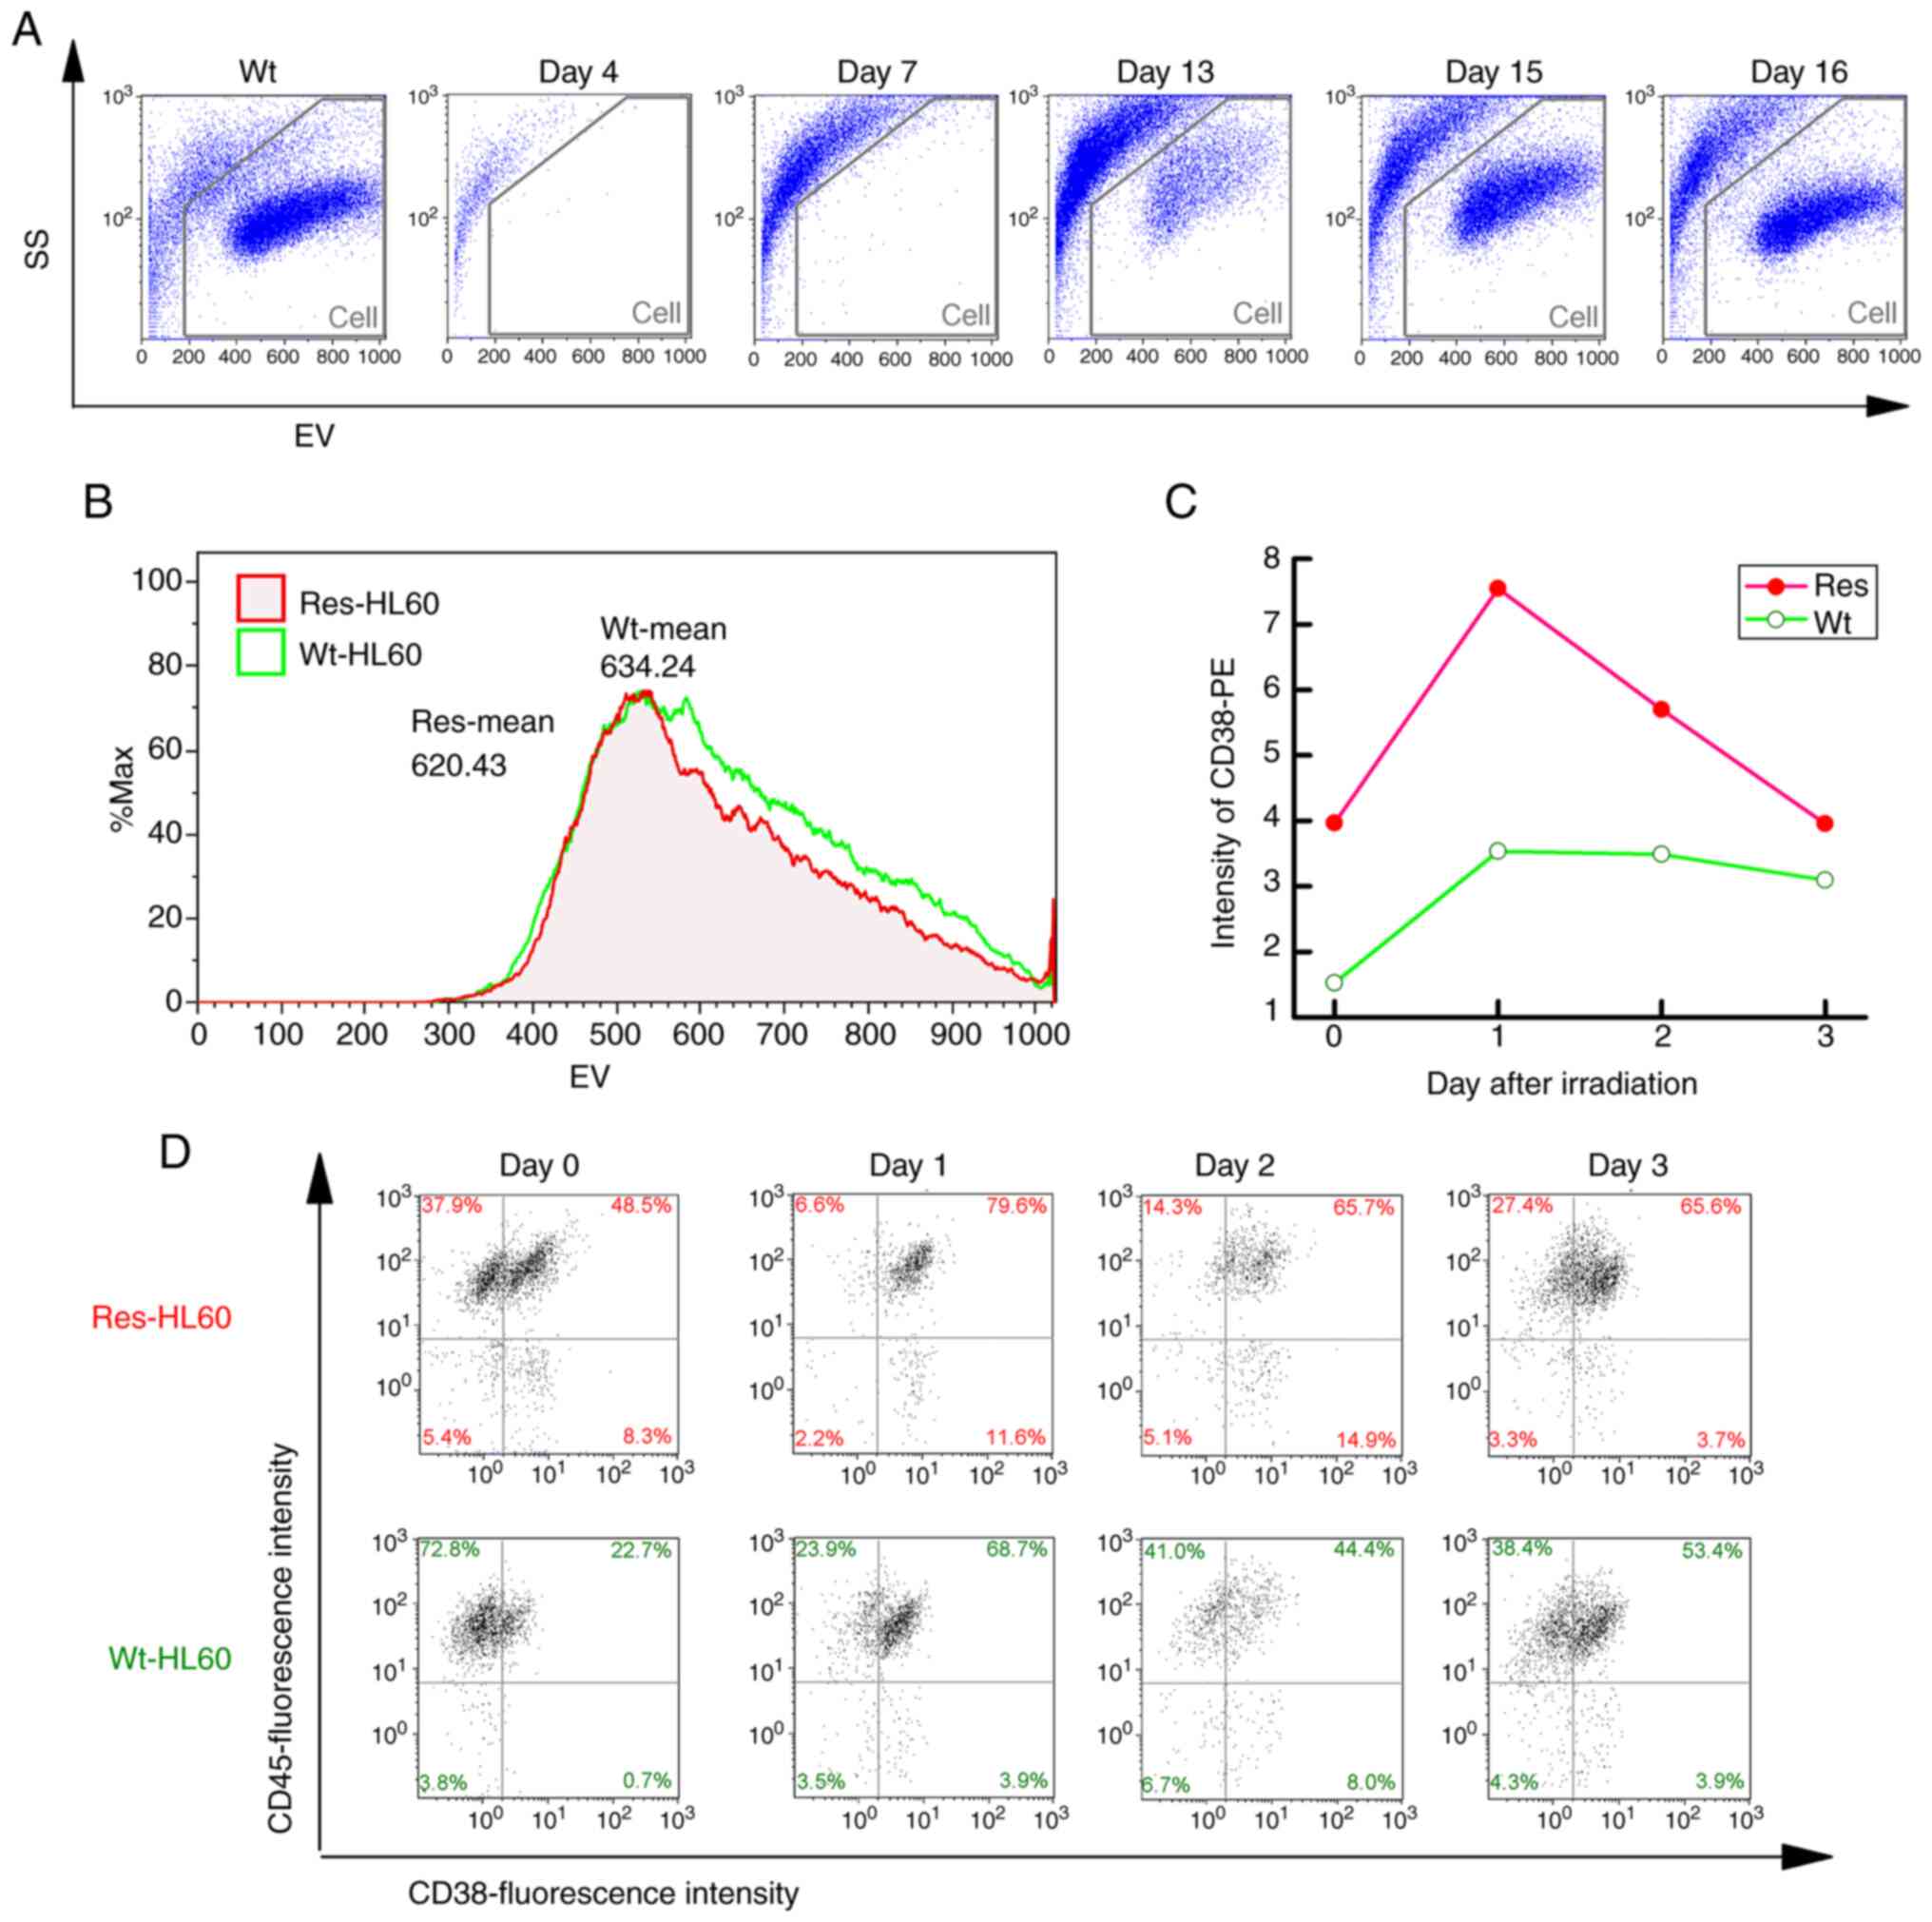
The cell population exposed to 4-Gy radiation
temporarily disappeared but reappeared on days 15–16 (Fig. 1A). However, it was confirmed that
Res-HL60 had a decreased EV (Wt: 634.24, Res: 620.43) (Fig. 1B). Furthermore, the expression of
the CD38 cell surface antigen in Res-HL60 cells was significantly
increased after radiation compared with that in the wild-type cells
(maximum on day 1: Res=7.55±0.53, Wt=3.54±0.89), confirming a
similar previously reported response (Fig. 1C and D). In our previous study, we
evaluated CD38 as a differentiation marker and found that its
expression was consistently elevated in Res-HL60 cells (8). The Res-HL60 cells seeded at
1×10⁵ cells/ml exhibited approximately 30-fold
proliferation (3.1±0.4×10⁵ cells/ml) on day 5, and the
Wt-HL60 cells exhibited approximately 15-fold proliferation
(1.6±0.1×10⁵ cells/ml) (Fig. 2A). The 4-Gy irradiation condition
of Res-HL60 cells was also maintained approximately 5-fold after
exposure on day 4 (4.9±0.5×10⁵ cells/ml); however, it
remained at the level observed on day 0 in Wt-HL60 cells
(1.9±0.1×10⁵ cells/ml) (Fig. 2B). The extent of DNA damage caused
by radiation exposure in these cells was determined using a comet
assay (Fig. 2C). The tail moment
of Res-HL60 cells irradiated with 1–4 Gy was similar to that
observed in cells without irradiation, whereas the tail moment of
Wt-HL60 cells exposed to irradiation was significantly increased
(Fig. 2D).
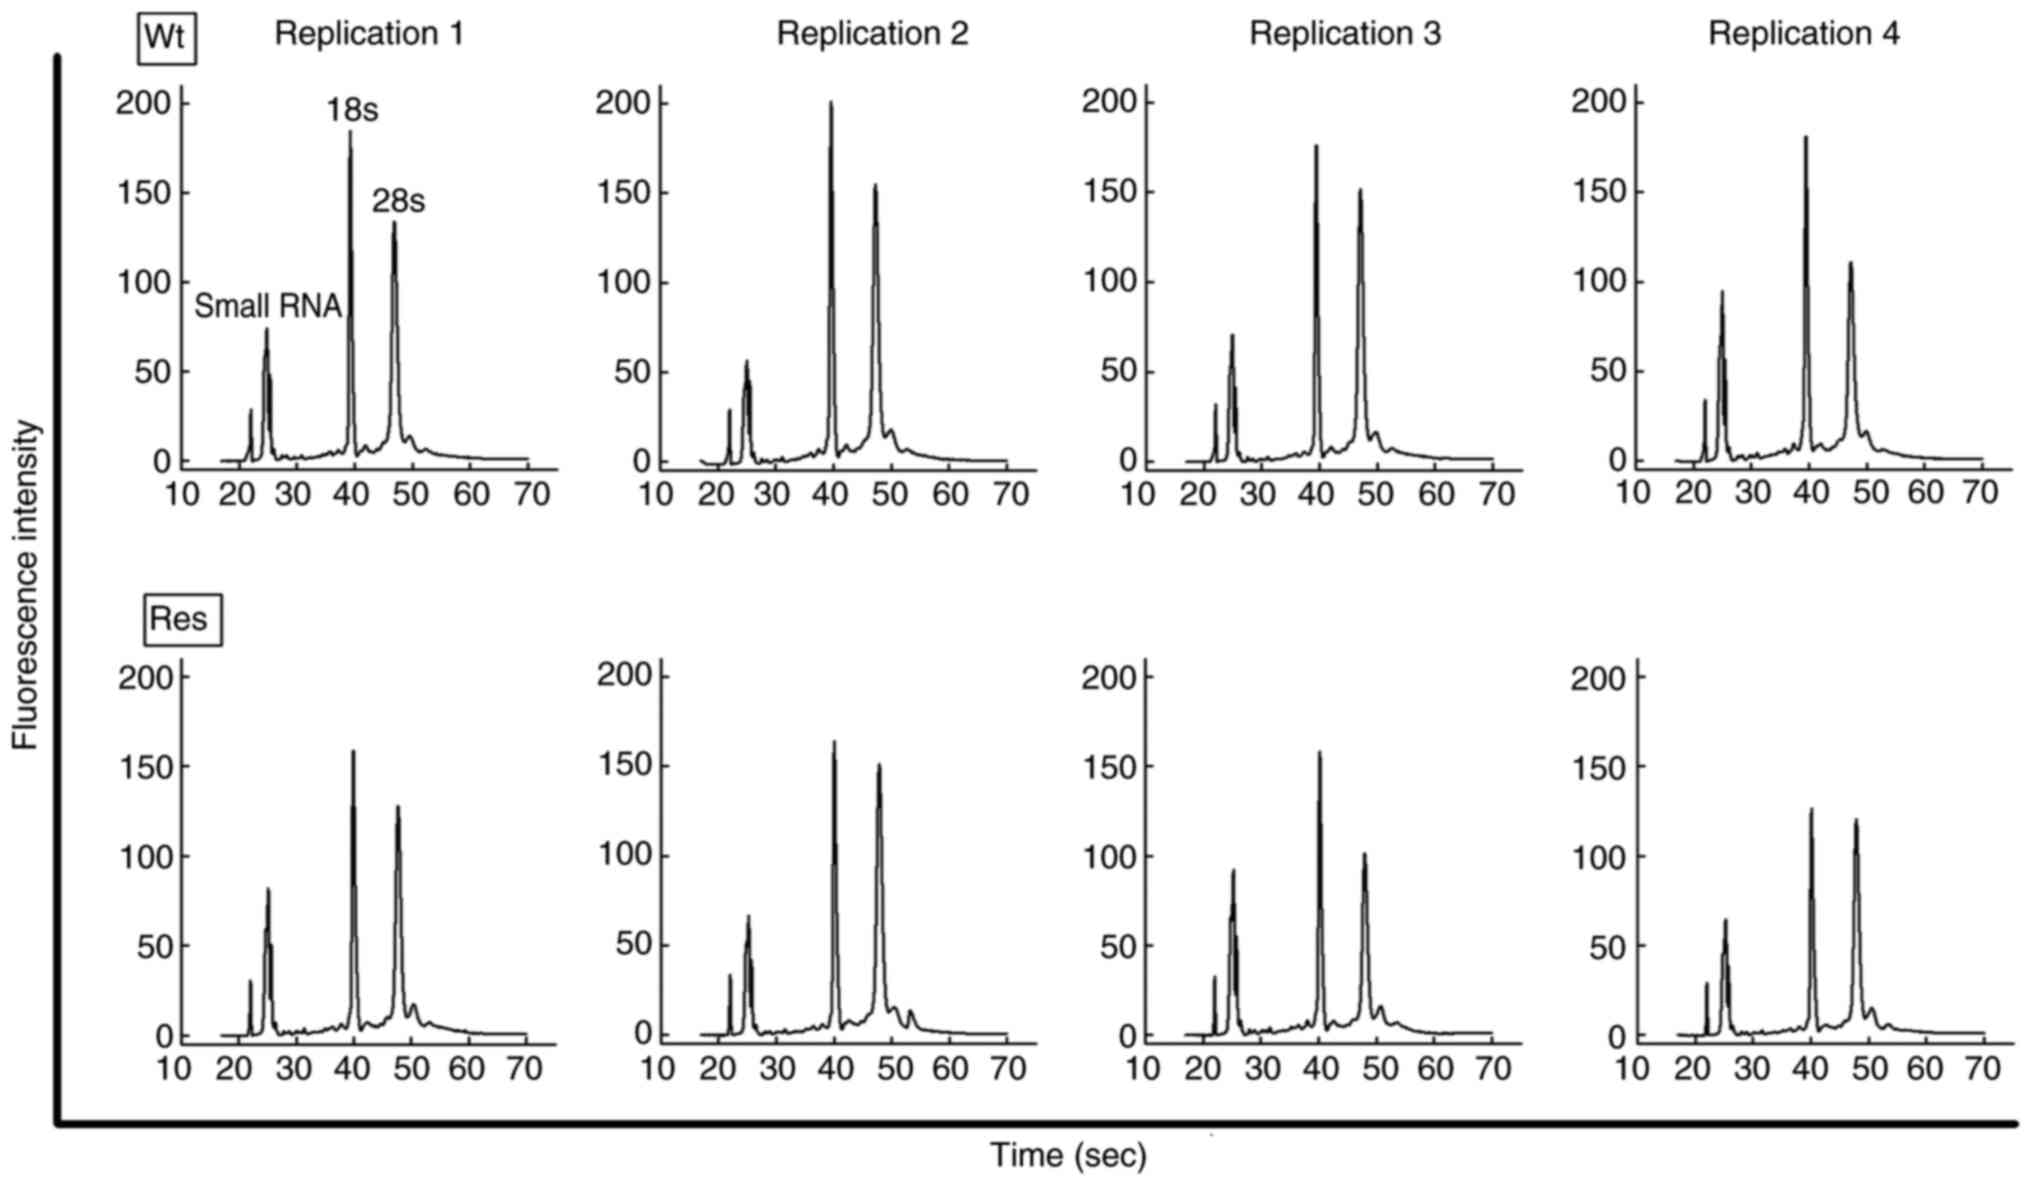
Expression profiles of miRs
To clarify the miRNA expression profiles of Res-HL60
cells, total RNAs were extracted from these cells. Using an Agilent
bioanalyzer, the extracted total RNAs were confirmed to have an RIN
value (max-10) and rRNA 18s and 28s peaks, which reveal whether
small RNAs, including miRNAs, are of sufficient concentration and
quality for analysis (Fig. 3).
Total RNAs extracted from each cell exhibited an RIN >9 in all
samples. Furthermore, the peak of small RNAs, 18s, and 28s in the
histogram was cleared, and these samples were considered to have
good quality for RNA analysis (Table
II).
| Table II.Concentration and quality of total
RNA extracted from Res-HL60 cells and Wt-HL60 cells. |
Table II.
Concentration and quality of total
RNA extracted from Res-HL60 cells and Wt-HL60 cells.
| Sample list | Concentration of
total RNA, µg/106 cells | RNA integrity
number | Ratio of rRNA,
28s/18s |
|---|
| Wt |
|
|
|
|
Replication 1 | 3.6 | 9.5 | 1.03 |
|
Replication 2 | 5.6 | 9.5 | 0.98 |
|
Replication 3 | 6.5 | 9.6 | 1.16 |
|
Replication 4 | 4.4 | 9.1 | 0.84 |
| Mean ±
SE | 5.0±0.6 | 9.4±0.1 | 1.0±0.1 |
| Res |
|
|
|
|
Repliction 1 | 5.5 | 9.4 | 0.98 |
|
Replication 2 | 4.3 | 9.6 | 1.18 |
|
Replication 3 | 3.6 | 9.2 | 0.76 |
|
Replication 4 | 4.1 | 9.6 | 1.13 |
| Mean ±
SE | 4.4±0.3 | 9.5±0.1 | 1.0±0.1 |
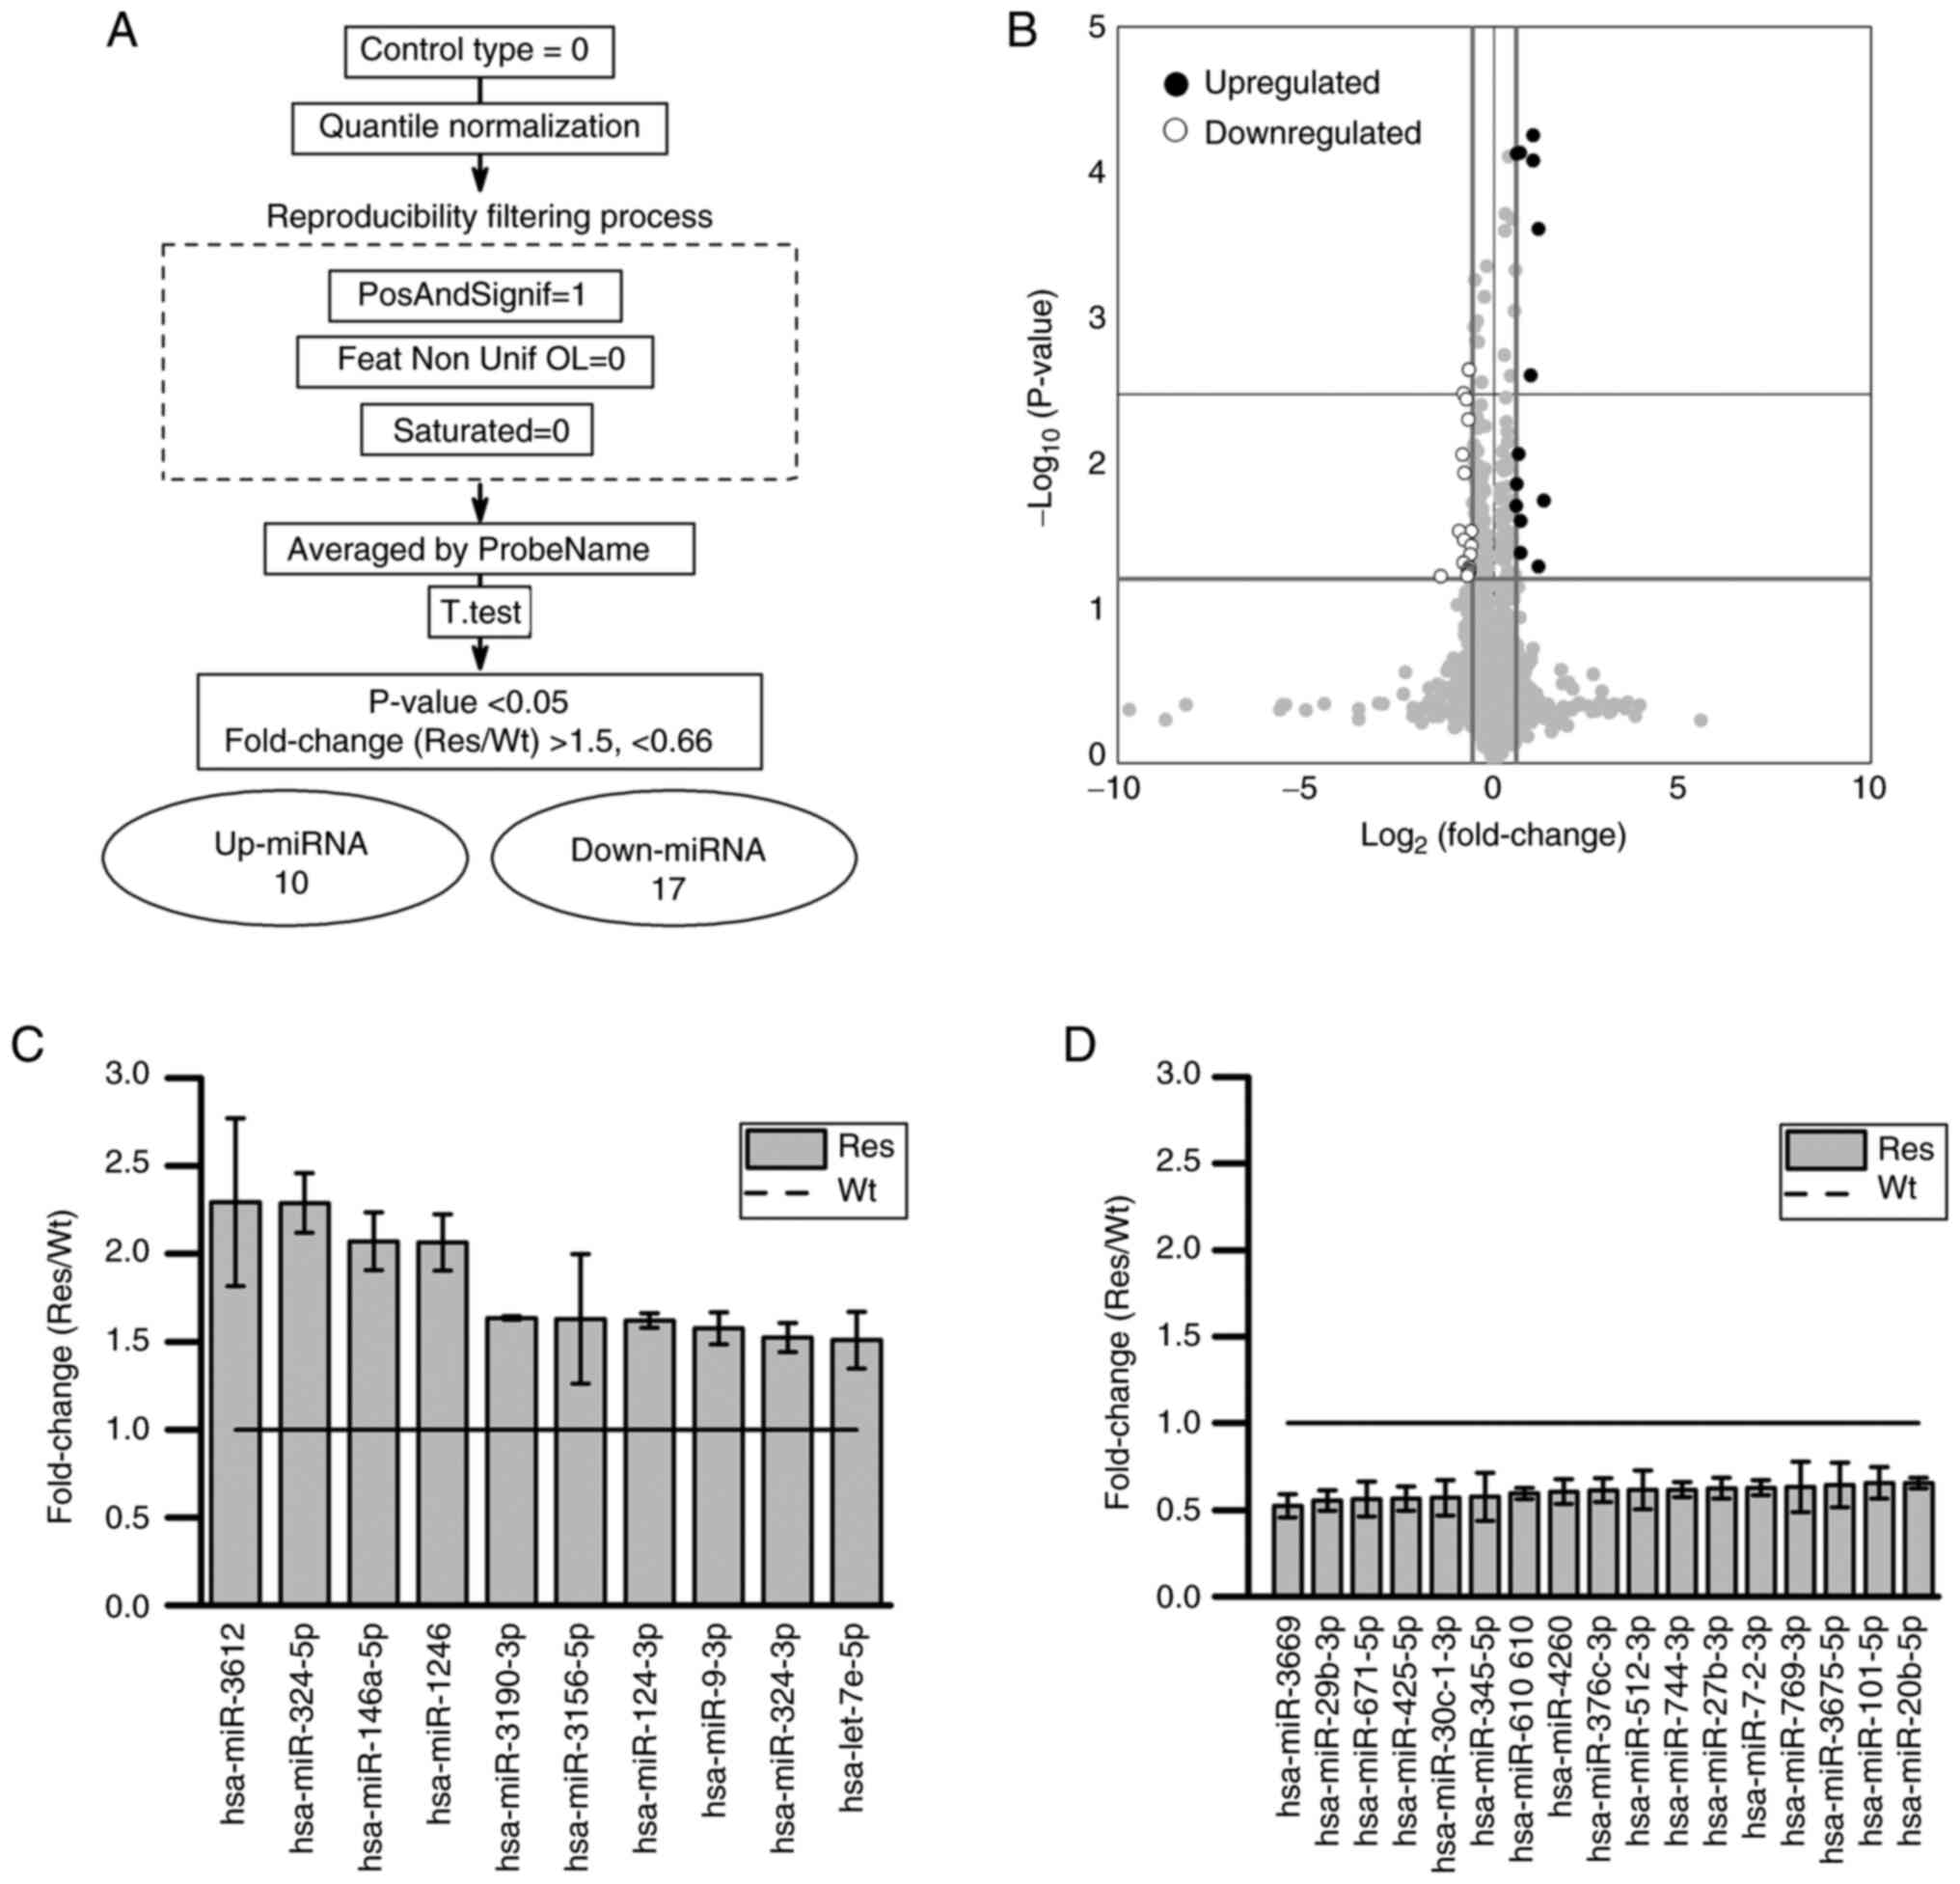
After miRNA microarray analysis, data were extracted
after quantile normalization, excluding under background, and
collection of unsaturated signals (Fig. 4A). After processing, the signal
values obtained using multiple types of detection probes were
averaged for each miRNA name, yielding 1,187 miRNA data. Among the
miRNAs that significantly increased or decreased in Res compared
with Wt, 10 miRNAs had a fold change (Res/Wt) >1.5, and 17
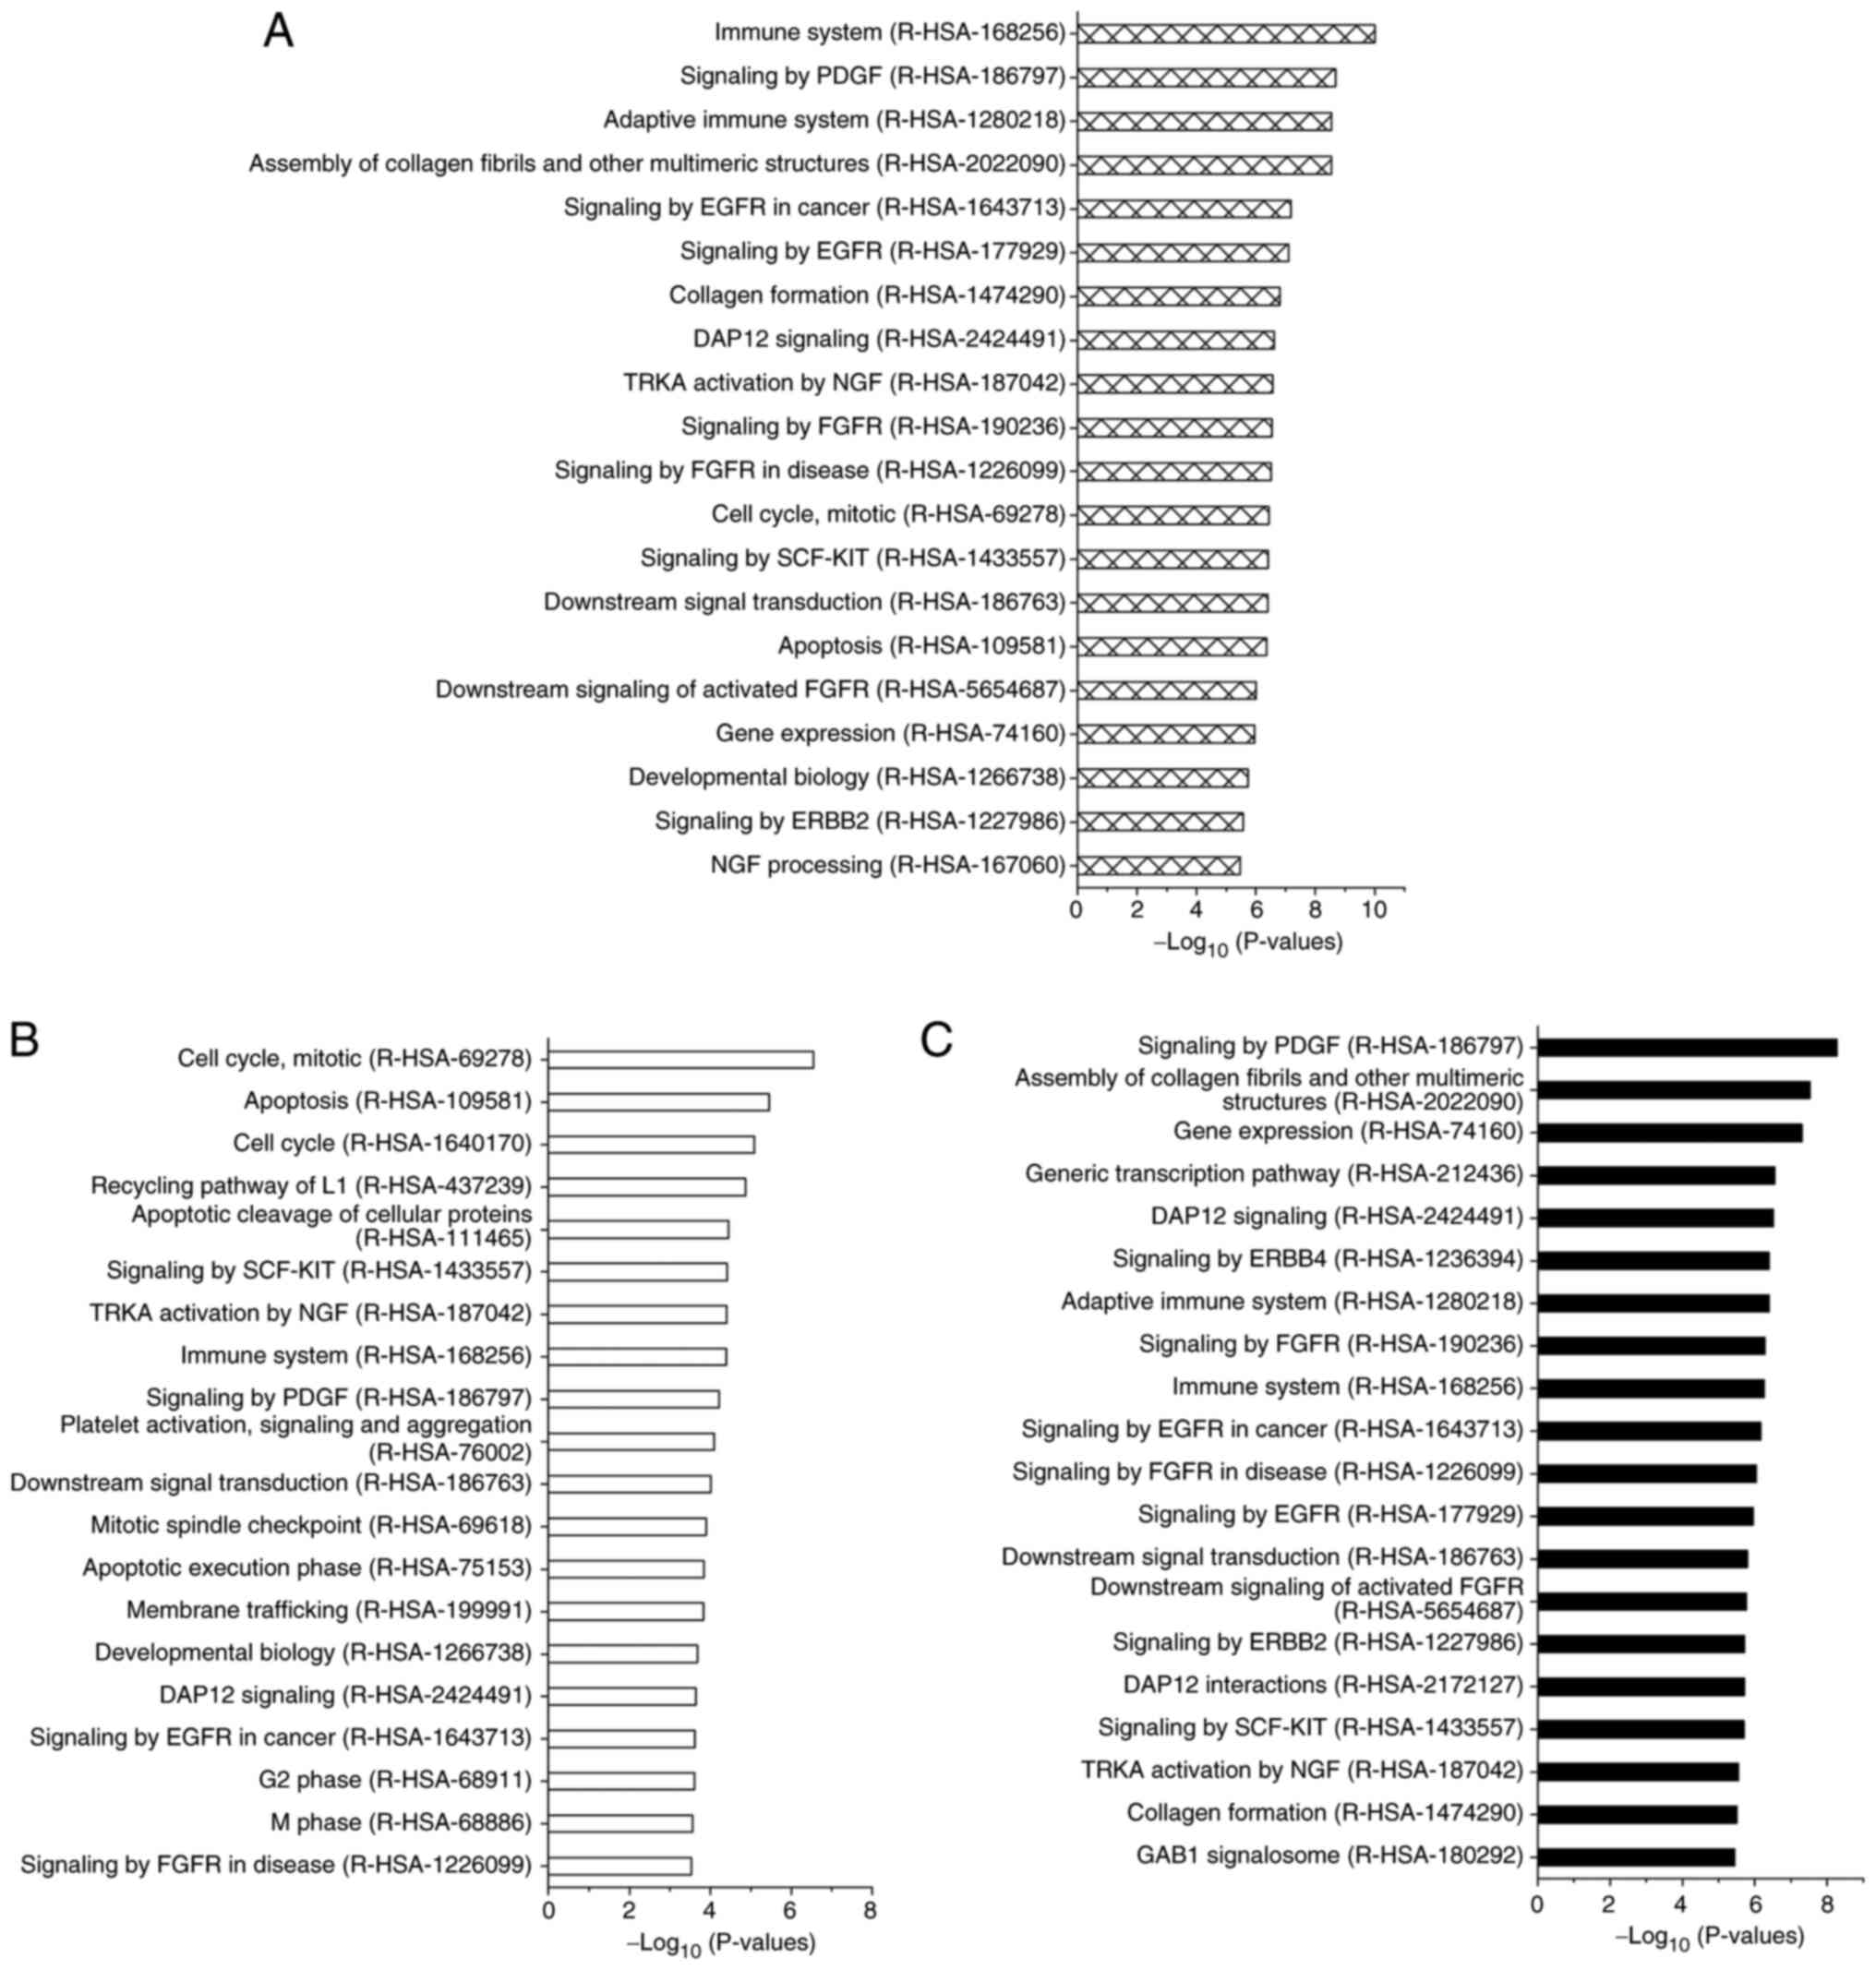
miRNAs had a fold change (Res/Wt) <0.66 (Fig. 4B-D). For the 27 miRNAs that
exhibited expression changes in the microarray analysis, a
functional enrichment analysis using the Reactome Pathway Database
in OmicsNet 2.0 was performed to estimate the associated mRNA
expression pathways. Cellular functional changes were observed in
the following pathways: ‘Immune System (R-HAS-168256)’, ‘Signaling
by PGDF (R-HAS-186797)’, ‘Adaptive Immune System (R-HAS-1280218)’,
‘Signaling by EGFR in Cancer (R-HAS-1643713)’, ‘Apoptosis
(R-HAS-109581)’, and ‘Cell Cycle, Mitotic (R-HAS-69278)’ for tumor
growth and/or invasion (Fig.
5A).
Furthermore, when we focused on the functional
analysis of the target mRNAs of the 10 upregulated miRNAs in
Res-HL60 cells, these mRNAs were strongly related to the following
functional pathways: ‘cell cycle’, ‘cell division’ and ‘apoptosis’
(Fig. 5B). In contrast, the target
mRNAs of the 16 downregulated miRNAs in Res-HL60 cells were
strongly related to the following functional pathways: ‘Signaling
by PDGF’ and ‘Assembly of collagen fibrils and other multimeric
structures (R-HAS-2022090)’ (Fig.
5C).
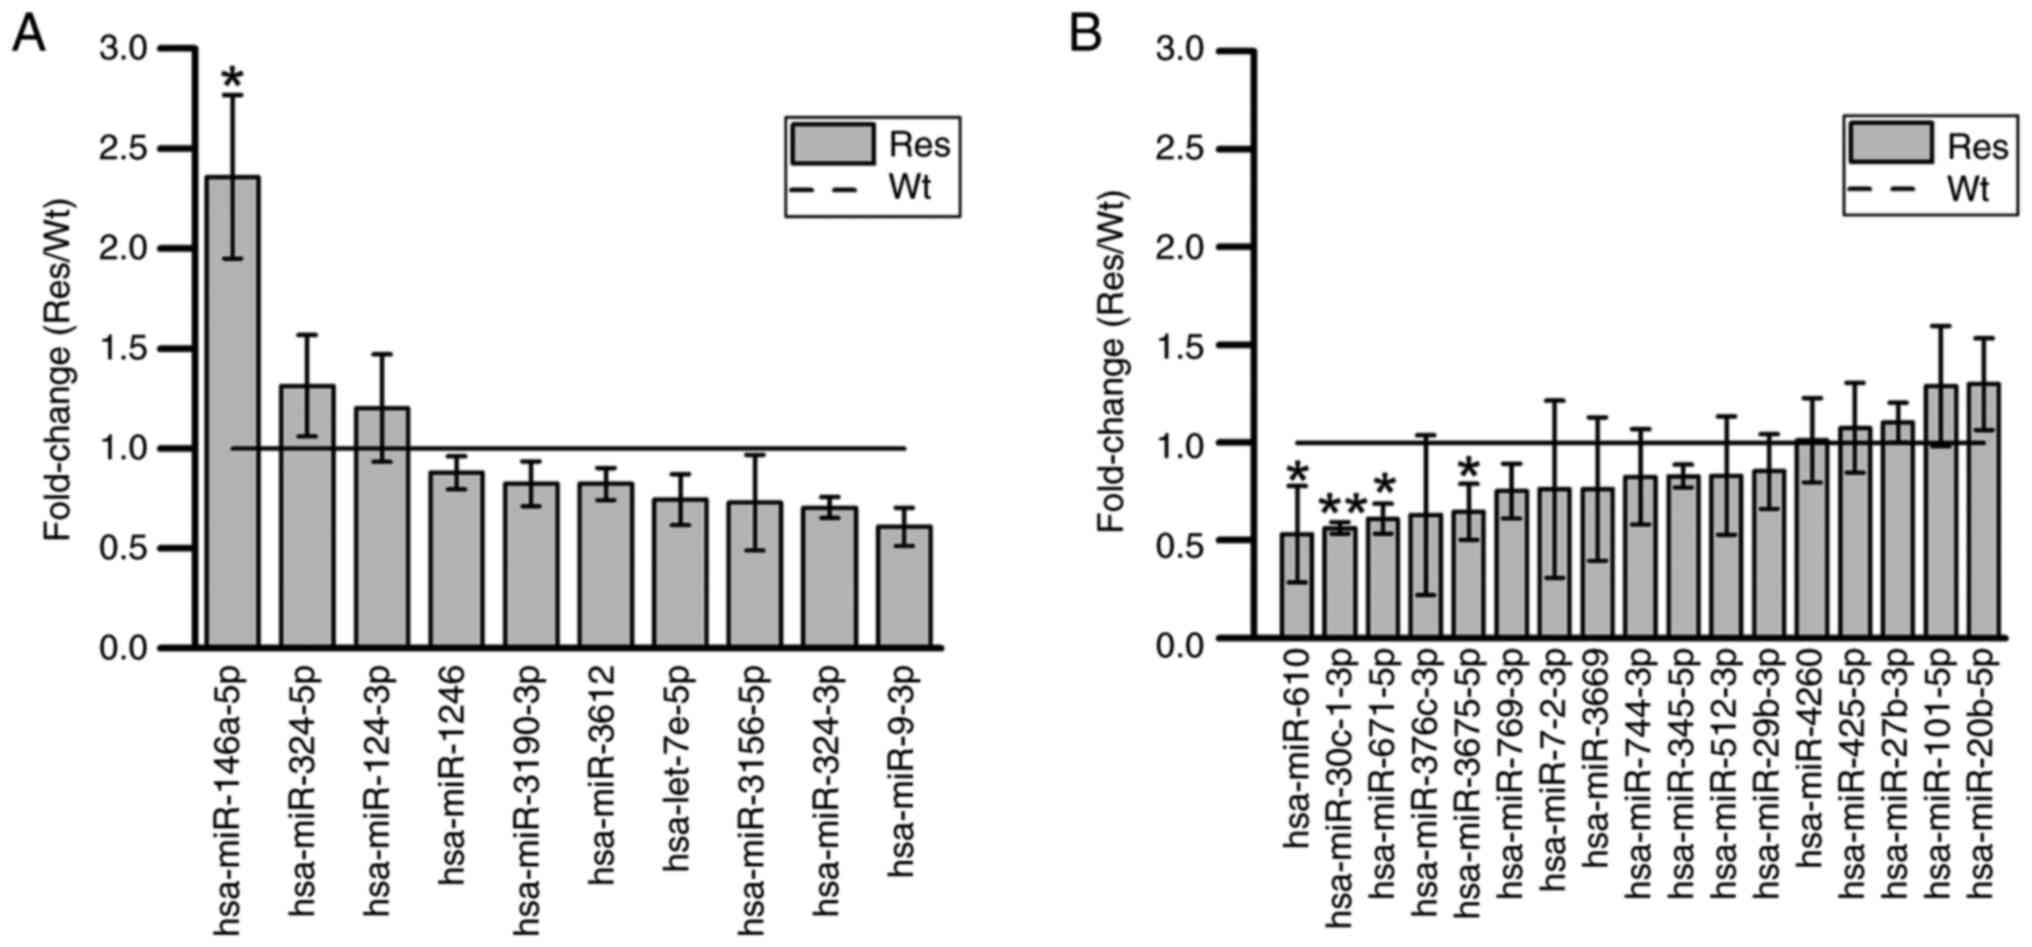
Validation of the expression of 27
miRNAs
The significant expression of the 27 miRNAs obtained
from these microarray analysis signals was reconfirmed by RT-qPCR.
Thus, the expression of miRNA-146a-5p was significantly increased,
whereas the expression of miRNA-30c-1-3p, miRNA-671-5p, miRNA-610,
and miRNA-3675-5p was significantly decreased (Fig. 6).
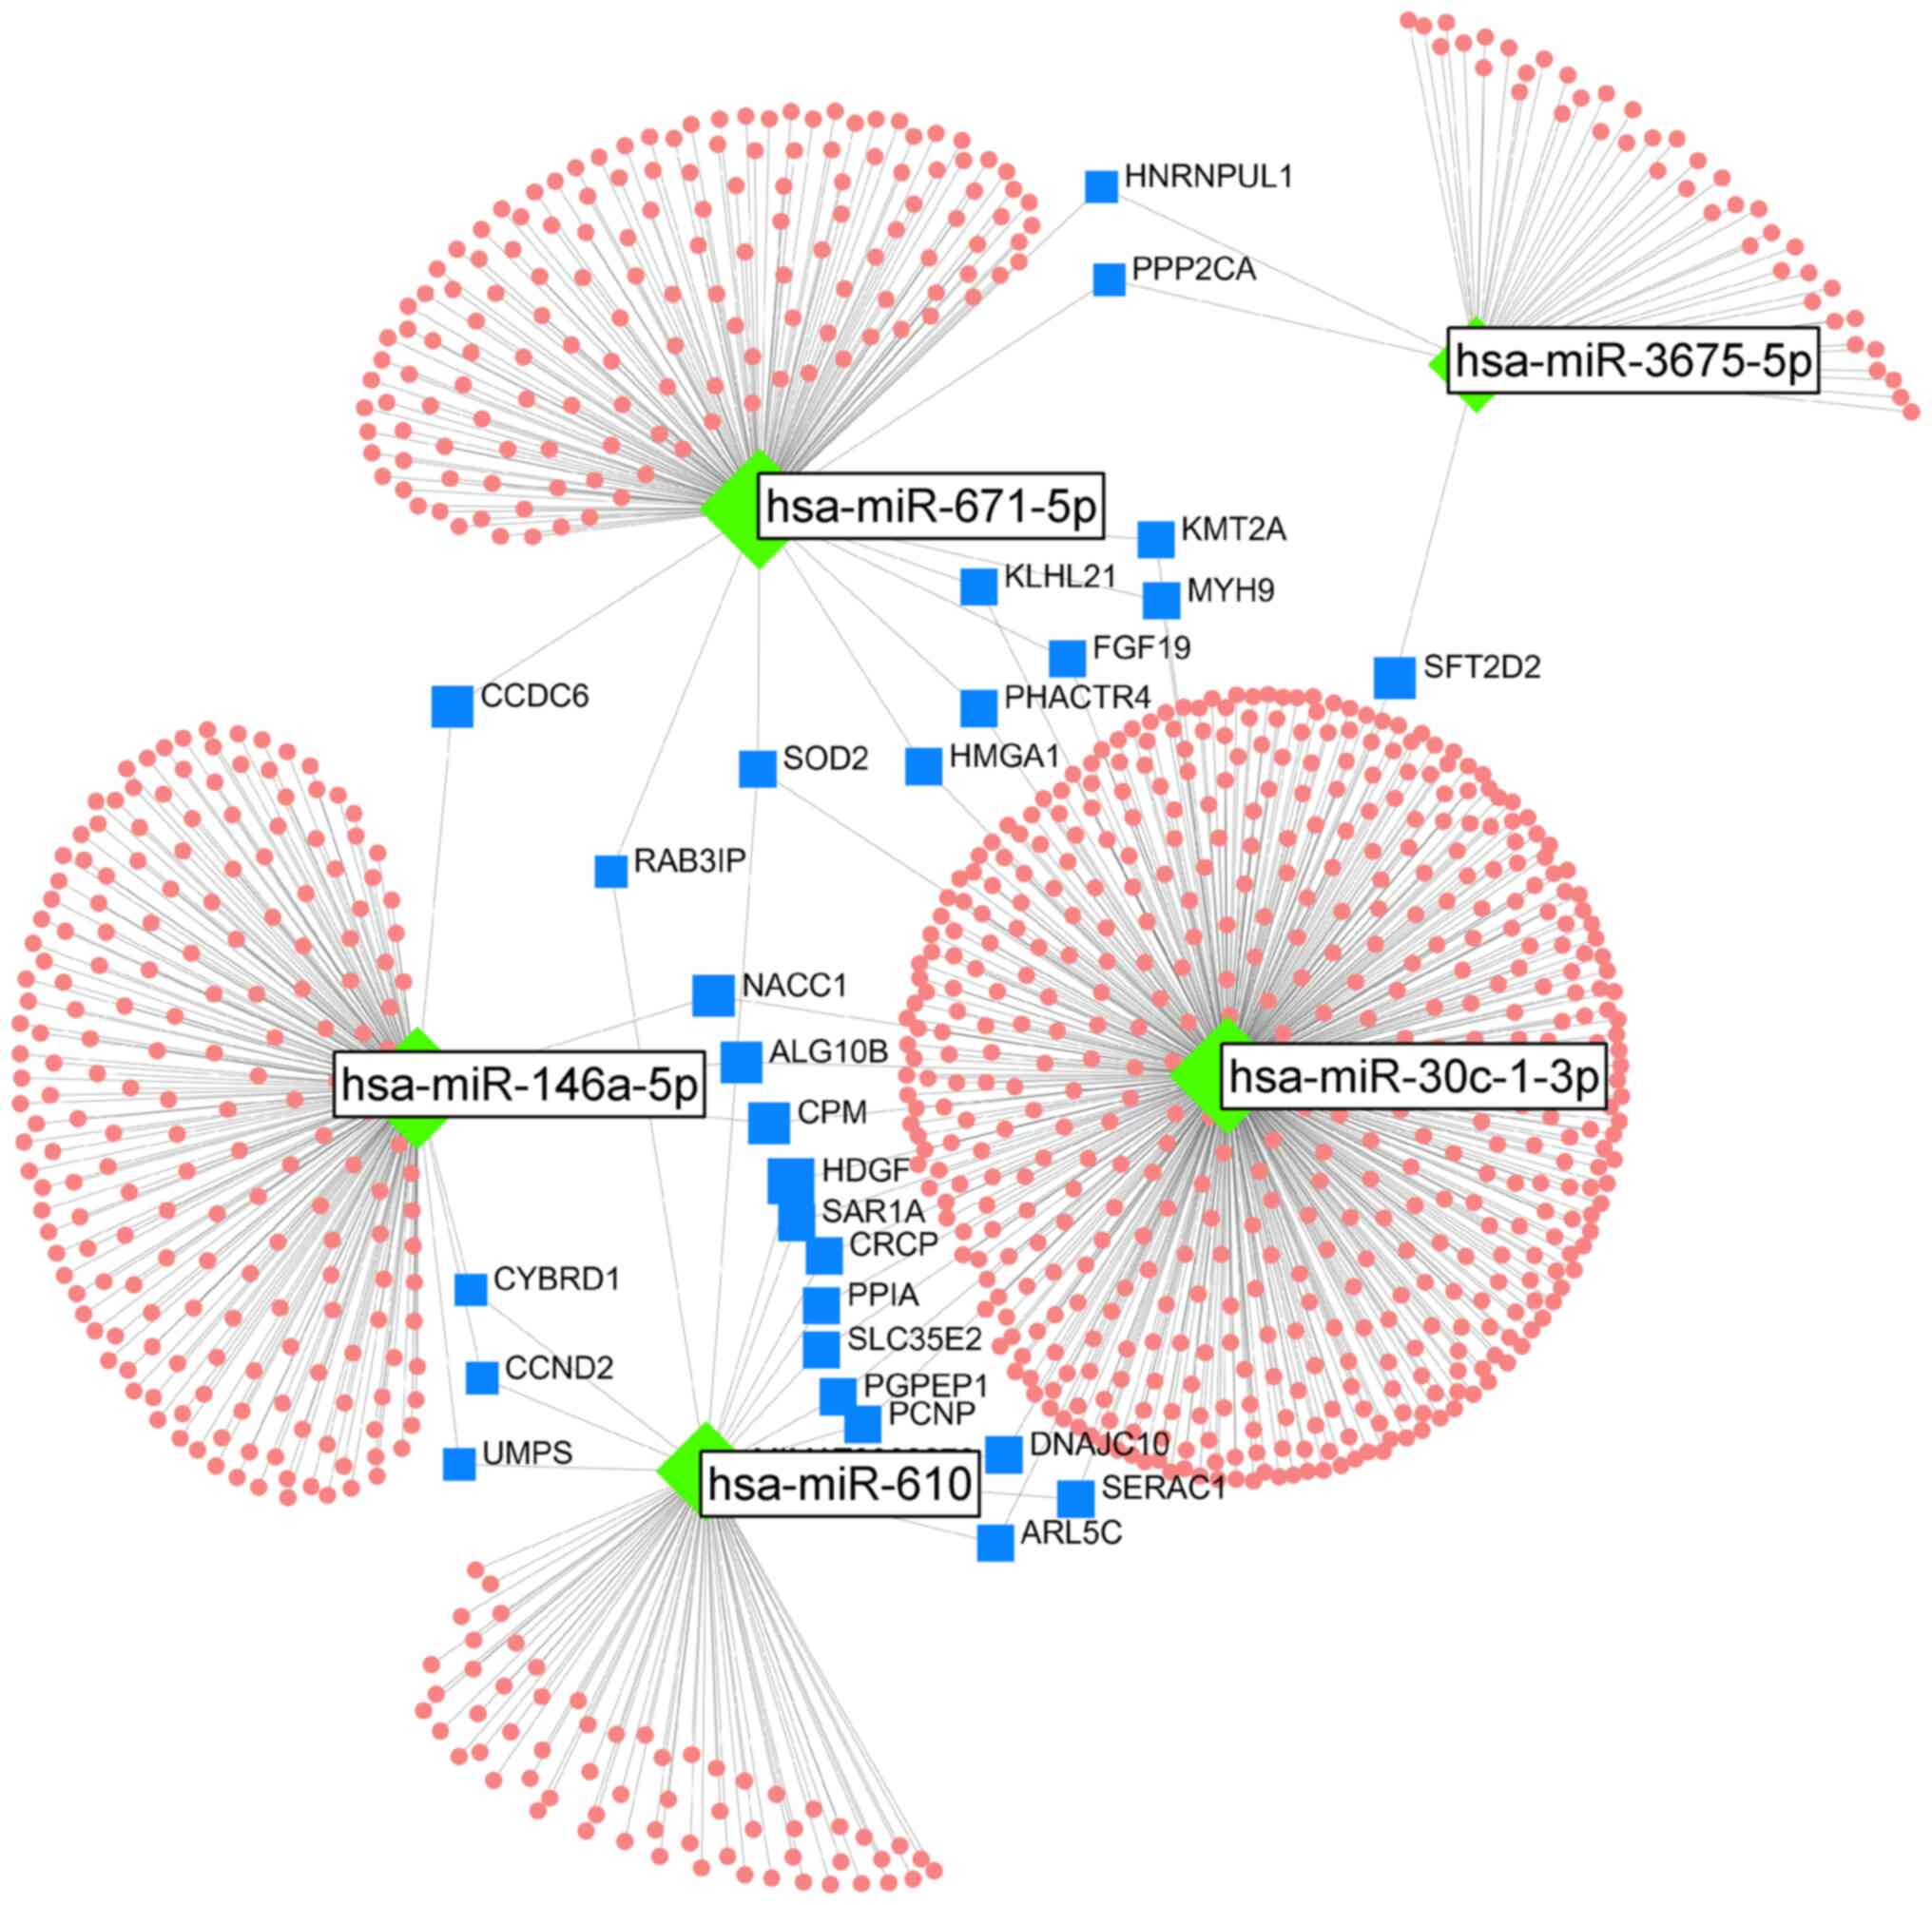
Analysis of bioinformatics: The mRNA networks
controlled by the five reproduced miRNAs were analyzed using
OmicsNet 2.0. In this network, 28 mRNAs were associated with two or
more miRNAs (Fig. 7). Of these 28
target mRNAs, seven (i.e., ALG10B, CCDC6, CCND2, CPM, CYBRD1,
NACC1, and UMPS) were targeted by miRNA-146a-5p, which is an
upregulated miRNA, and the other four miRNAs, which are
downregulated. Furthermore, three miRNAs (i.e., miRNA-610,
miRNA-671-5p, and miRNA-30c-1-3p) targeted superoxide dismutase 2
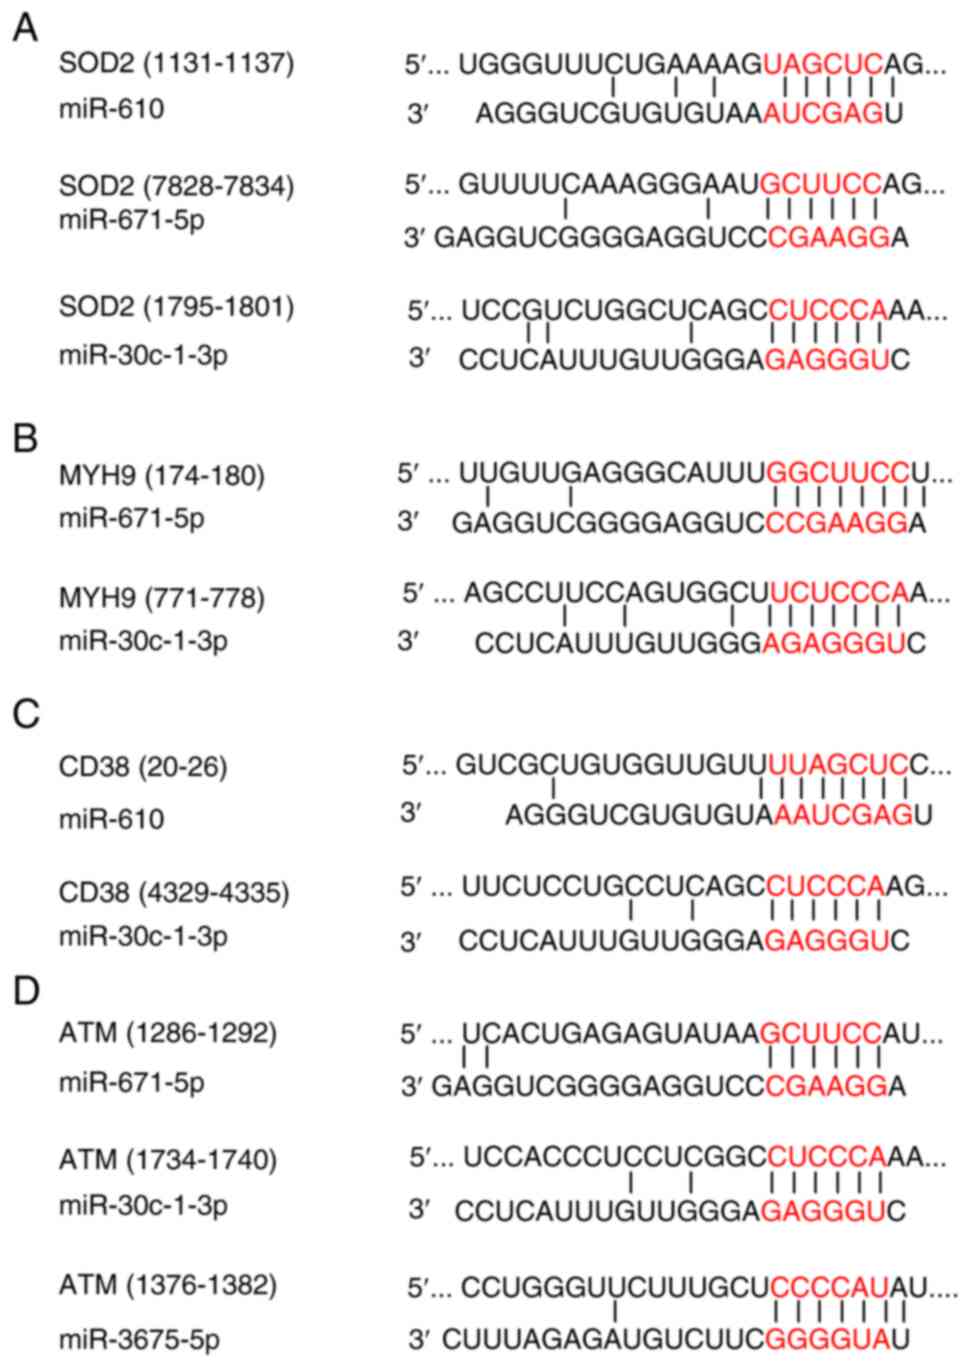
(SOD2). In the Target Scan analysis, three miRNAs (miRNA-610,
miRNA-671-5p, and miRNA-30c-1-3p) were predicted to bind to the
3′-UTR region of SOD2, which was predicted as the target mRNA
(Fig. 8). Furthermore, two miRNAs
(i.e., miRNA-671-5p and miRNA-30c-1-3p) were predicted to bind to
the 3′-UTR region of MYH9 mRNA. The putative target sites of
miR-610 and miR-30c-1-3p for CD38 mRNA and miR-3675-5p, miR-671-5p,
and miR-30c-1-3p for ATM mRNA were located in the 3′-UTR
region.
Discussion
In this study, we analyzed the miRNA expression
profile of a radioresistant AML cell model (Res-HL60) derived from
the HL60 cell line, which belongs to the FAB M2 subtype of AML. We
reconfirmed that Res-HL60 cells, which were established by repeated
irradiation of HL60 cells, maintained the morphological
characteristics previously described, even when remade (Fig. 1). The HL60 cell line, which is
derived from a patient with AML, exhibits inherently low CD38
expression, as previously reported (18). We have previously evaluated CD38 as
a differentiation marker and found that its expression was
consistently elevated in Res-HL60 cells (8). In this study, we observed transient
increases in CD38 expression immediately after irradiation. This
upregulation has been reported to be associated with cellular
activation and proliferation (19). CD38 was selected as the primary
marker in this study because it is a well-established
differentiation-associated antigen in the HL60 model system; its
expression increases markedly during granulocytic differentiation,
as demonstrated by Partida-Sánchez et al (16). In our Res-HL60 cells, CD38
consistently showed strong upregulation both under baseline
conditions and immediately after irradiation. These observations,
combined with CD38′s known roles in NAD+-dependent
calcium signaling and immune modulation, made it a biologically
relevant candidate for investigating radioresistant phenotypes in
AML. Although Breitman et al broadly discussed the HL60
differentiation model, CD38-specific functional insights were
established in later work (20).
In this context, ‘cellular activation’ refers to an increased
responsiveness of cells to external stimuli, such as radiation,
typically accompanied by changes in surface markers, including CD38
upregulation. Although direct functional activation markers were
not assessed in this study, similar CD38 upregulation has been
correlated with cell activation and immune modulation in leukemia
models. Our previously established Res-HL60 cells demonstrated
enhanced proliferative capacity compared to Wt-HL60 cells, as
evidenced by shortened population doubling times and increased
viable cell counts (8–12). Although these proliferation
characteristics were not re-evaluated in the present study, the
phenotypic stability and CD38 expression patterns observed here are
consistent with those findings.
Furthermore, DNA fragments did not increase in these
cells due to radiation, and the response was confirmed to be
similar to γ-H2AX, a marker for DNA double-strand breaks, and to
previous DNA ladder analyses (9,21).
In these damage responses in Res-HL60 cells, 27 miRNAs (10
upregulated and 17 downregulated) showed altered expression in the
microarray analysis. Among them, five miRNAs (miR-146a-5p,
miR-30c-1-3p, miR-671-5p, miR-610, and miR-3675-5p) consistently
demonstrated significant changes in the same direction across both
microarray and RT-qPCR validation experiments. This consistency
suggests that these five miRNAs may play a regulatory role in
modulating molecular pathways associated with the development of
radiation resistance. These five miRNAs have been implicated in
tumor proliferation, radiosensitivity, and hematopoiesis (22–30).
miR-146a functions together with TRAF1 and IRAK1 as negative
feedback factors for the two toll-like receptor pathway proteins
(22). It is also involved in
regulating the transcriptional activity of NF-κB, which is
necessary for the differentiation of hematopoietic cells (23,24).
In radiotherapy for meningioma, the expression of miR-30c-1-3p is
suppressed when treatment resistance occurs (25). In another report, the suppression
of miR-30c-1-3p expression was associated with the progression of
prostate cancer (26). The
overexpression of miR-671-5p has been shown to significantly
increase apoptosis and DNA damage in human glioblastoma cells
(27). In neuroblastoma cells, the
overexpression of miR-610 induces apoptosis and reduces cell
viability (28). miR-3651 promotes
the proliferation of hepatocellular carcinoma and colorectal cancer
cells (29,30). These reports from various cell
types suggest that changes in miRNA expression in radioresistant
AML are triggered by cell viability activity.
The analysis of linking target mRNA networks of five
miRNAs with radioresistant AML is new information, and 11 target
mRNAs of these miRs (i.e., ALG10B, CCDC6, CCND2, CPM, CYBRD1,
NACC1, UMPS, SOD2, MYH9, CD38, and ATM) may regulate the expression
of its associated proteins and transcription factors in a complex
manner. SOD2 can scavenge active oxygen produced by radiation
irradiation, and SOD2 has been reported to protect against cellular
stress (31). Furthermore, MYH9 is
involved in cell division, cell migration, and maintenance of cell
morphology and acts as an antiapoptotic agent in head and neck
cancers where MYH9 is highly expressed (32). Moreover, it also reduces
intracellular reactive oxygen species levels through the activation
of the MAPK signaling pathway and Nrf2/keap1 pathway and the
promotion of the production of the antioxidant enzyme GCLC. It is
also involved in radioresistance. This observation may also explain
the morphological stability and resistance to radiation-induced
apoptosis observed in Res-HL60 cells. To further investigate the
clinical relevance of these target genes, we examined publicly
available AML gene expression datasets from The Cancer Genome Atlas
(TCGA) and the Gene Expression Omnibus (GEO). Yu et al have
reported that MYH9 overexpression was significantly associated with
poor prognosis in patients with AML based on TCGA-LAML data
(33). This finding is also
supported by GSE12417 (GEO), a dataset originally published by
Metzeler et al (34), which
includes cytogenetically normal AML cases. In a recent analysis by
Zhai et al (35), MYH9 was
among the genes linked to adverse outcomes in this cohort.
Expression of ATM, although not frequently mutated in AML, has been
implicated in treatment responses; low ATM expression enhances
sensitivity to FLT3 inhibitors and may affect DNA damage signaling
(36). SOD2 has not been directly
studied in AML; however, it plays a key role in scavenging reactive
oxygen species. A meta-analysis of pan-cancer TCGA datasets by Noh
et al (31) reported that
SOD2 upregulation is associated with treatment resistance,
suggesting its potential role in radioresistant phenotypes. We note
that original survival analyses were not performed in this study.
Instead, we relied on published results from previous analyses of
these public datasets. This approach was taken due to the
experimental focus of our study on the HL60-derived model. However,
we fully acknowledge the importance of such analyses in increasing
the translational relevance of our findings. While we agree with
the reviewer's suggestion to perform updated survival analyses
using the most recent TCGA and GEO datasets, this was beyond the
scope of the current in vitro study. Nonetheless,
incorporating such analyses is a clear objective for future work.
We plan to conduct comprehensive bioinformatics evaluations of
MYH9, ATM, and SOD2 expression in larger patient cohorts using
integrated clinical and molecular data. Furthermore, the use of
radiation-resistant AML patient samples to validate these gene
targets was not feasible in the present study due to sample
unavailability. However, this represents a crucial next step.
Future studies will aim to collect and analyze patient-derived AML
samples, particularly from individuals with known radiation
treatment history, to directly confirm the relevance of MYH9, ATM,
and SOD2 in clinical radioresistance. These findings complement our
in vitro results and support the relevance of SOD2, ATM, and
MYH9 in AML radioresistance.
Most functions inferred from the Reactome analysis
were related to anti-apoptotic processes and were associated with
upregulated miR-146a-5p. Our original hypothesis was that
miR-146a-5p promotes apoptosis by inhibiting antiapoptotic
molecules, thereby enhancing radiosensitivity in Res-HL60 cells.
However, the results of the inhibition of anti-apoptotic molecules
did not support this hypothesis. Instead, these findings suggest
that miR-146a-5p regulates an alternative pathway that could
contribute to radiation resistance. Target-scan analysis
revealed that the high expression of CD38 cell surface antigen
protein, CD38 mRNA, and intracellular ATM is related to the
regulation of the five miRNAs revealed here (Fig. 8). These miRNA regulations provide
molecular biology information supporting previous cellular
responses. This information enhances our understanding of the
molecular mechanisms underlying radiation resistance in AML. To
further elucidate the mechanisms linking CD38 expression and
radiation resistance, our future studies will focus on dissecting
the intracellular signaling pathways downstream of CD38.
Specifically, we plan to investigate NAD+ metabolism and
calcium signaling pathways, both of which are regulated by CD38 and
are known to affect cell survival, DNA repair capacity, and
oxidative stress responses. These pathways may provide crucial
mechanistic links between CD38 expression and the observed
radioresistant phenotype in AML cells. In addition, combining CD38
expression analysis with metabolic profiling may help clarify its
functional relevance in therapeutic resistance. This approach may
also reveal novel therapeutic targets to overcome resistance in
CD38-expressing AML subtypes. Although CD38 was a useful marker in
our initial evaluation, we recognized that other markers, such as
CD34, CD123, and ALDH are also relevant in the context of leukemia
stemness and therapy resistance. Exploring the role of these
markers was not within the scope of this study. However, future
studies incorporating a broader panel of surface markers are
warranted to further elucidate the mechanisms of AML
radioresistance.
One limitation of this study is the lack of a
regulatory analysis for the expression of the five miRNAs in AML
cells, including investigations of intracellular signaling pathways
and knockdown of the 11 predicted target mRNAs. Another limitation
is that all experiments were performed using a single cell line,
HL60, and its derived radioresistant subline. Although HL60 is a
widely used model for AML studies, it does not capture the full
genetic and phenotypic heterogeneity of AML, which can
significantly affect radiosensitivity and miRNA profiles.
Therefore, caution should be exercised when generalizing these
findings. Future studies should include additional AML cell lines
representing different molecular subtypes, as well as
patient-derived primary cells, to validate the observed miRNA and
mRNA expression patterns. Furthermore, functional assays using
miRNA mimics/inhibitors or siRNA-mediated knockdown of key targets
such as MYH9, ATM, and SOD2 are necessary to directly confirm their
roles in radiation resistance. Such validations will be crucial for
establishing the broader applicability and clinical relevance of
our findings. Clinically, the identified miRNAs and their targets
(e.g., MYH9, ATM, SOD2) may serve as biomarkers for predicting
radiotherapy resistance in AML. They may also provide novel
therapeutic targets to overcome such resistance, enabling more
personalized treatment strategies. Although our findings are
currently preclinical, they lay important groundwork for future
translational research aimed at improving AML patient outcomes.
In summary, further studies are warranted to clarify
the role of these miRNA-mRNA networks in therapy-resistant
leukemia. Future investigations employing integrative miRNA-mRNA
analyses, as demonstrated here, may further elucidate the molecular
basis of radiosensitivity in AML.
Supplementary Material
Supporting Data
Supporting Data
Acknowledgements
Not applicable.
Funding
This work was supported by JSPS KAKENHI, Grants-in-Aid for
Scientific Research (B) (grant no. 21H02861/23K21419, to Satoru
Monzen) and Takeda Science Foundation 2022 (to Satoru Monzen). The
funders played no role in the study design, data collection and
analysis, decision to publish, or preparation of the
manuscript.
Availability of data and materials
The sequencing data generated in the present study
may be found in the GEO under accession number GSE285934 or at the
following URL: https://www.ncbi.nlm.nih.gov/geo/query/acc.cgi?acc=GSE285934.
The other data generated in the present study may be requested from
the corresponding author.
Authors' contributions
HS, YH and SM designed the study, prepared the
manuscript draft and participated in the revision of the
manuscript. HS, MK, MC and SM performed the biological analysis and
collection of the experimental data. SM supervised the study,
critically reviewed the manuscript and provided final approval for
the version to be submitted and published. All authors have read
and approved the final version of the manuscript. HS and SM confirm
the authenticity of all the raw data.
Ethics approval and consent to
participate
Not applicable.
Patient consent for publication
Not applicable.
Competing interests
The authors declare that they have no competing
interests.
References
|
1
|
Nemkov T, D'Alessandro A and Reisz JA:
Metabolic underpinnings of leukemia pathology and treatment. Cancer
Rep (Hoboken). 2:e11392019.PubMed/NCBI
|
|
2
|
Shallis RM, Wang R, Davidoff A, Ma X and
Zeidan AM: Epidemiology of acute myeloid leukemia: Recent progress
and enduring challenges. Blood Rev. 36:70–87. 2019. View Article : Google Scholar : PubMed/NCBI
|
|
3
|
Wang ZY and Chen Z: Acute promyelocytic
leukemia: From highly fatal to highly curable. Blood.
111:2505–2515. 2008. View Article : Google Scholar : PubMed/NCBI
|
|
4
|
Reske SN, Deisenhofer S, Glatting G,
Zlatopolskiy BD, Morgenroth A, Vogg ATJ, Buck AK and Friesen C:
123I–ITdU-mediated nanoirradiation of DNA efficiently induces cell
kill in HL60 leukemia cells and in doxorubicin-, beta-, or
gamma-radiation-resistan cell lines. J Nucl Med. 48:1000–1007.
2007. View Article : Google Scholar : PubMed/NCBI
|
|
5
|
Godley LA and Larson RA: Therapy-related
myeloid leukemia. Semin Oncol. 35:418–429. 2008. View Article : Google Scholar : PubMed/NCBI
|
|
6
|
Bhatia S: Therapy-related myelodysplasia
and acute myeloid leukemia. Semin Oncol. 40:666–675. 2013.
View Article : Google Scholar : PubMed/NCBI
|
|
7
|
Nemecek ER, Hilger RA, Adams A, Shaw BE,
Kiefer D, Le-Rademacher J, Levine JE, Yanik G, Leung W, Talano JA,
et al: Treosulfan, fludarabine, and low-dose total body irradiation
for children and young adults with acute myeloid leukemia or
myelodysplastic syndrome undergoing allogeneic hematopoietic cell
transplantation: prospective phase II trial of the pediatric blood
and marrow transplant consortium. Biol Blood Marrow Transplant.
24:1651–1656. 2018. View Article : Google Scholar : PubMed/NCBI
|
|
8
|
Monzen S, Takimura K, Kashiwakura I and
Hosokawa Y: Acute promyelocytic leukemia mutated to radioresistance
suppressed monocyte lineage differentiation by phorbol 12-myristate
13-acetate. Leuk Res. 37:1162–1169. 2013. View Article : Google Scholar : PubMed/NCBI
|
|
9
|
Hazawa M, Hosokawa Y, Monzen S, Yoshino H
and Kashiwakura I: Regulation of DNA damage response and cell cycle
in radiation-resistant HL60 myeloid leukemia cells. Oncol Rep.
28:55–61. 2012.PubMed/NCBI
|
|
10
|
Monzen S, Chiba M, Ueno T, Morino Y,
Terada K, Yamaya H and Hosokawa Y: A radioresistant fraction of
acute promyelocytic leukemia cells exhibit CD38 cell-surface
antigen and mRNA expression. Oncol Lett. 15:6709–6714.
2018.PubMed/NCBI
|
|
11
|
Monzen S, Chiba M and Hosokawa Y: Genetic
network profiles associated with established resistance to ionizing
radiation in acute promyelocytic leukemia cells and their
extracellular vesicles. Oncol Rep. 35:749–756. 2016. View Article : Google Scholar : PubMed/NCBI
|
|
12
|
Morino Y, Sugiyama H, Yamane K, Kikuchi M,
Yamanaka T, Honda K and Monzen S: Additive antitumor effect of
arsenic trioxide with exposure to ionizing radiation to human acute
promyelocytic leukemia HL-60 cells. Oncol Rep. 52:1092024.
View Article : Google Scholar : PubMed/NCBI
|
|
13
|
He B, Zhao Z, Cai Q, Zhang Y, Zhang P, Shi
S, Xie H, Peng X, Yin W, Tao Y and Wang X: miRNA-based biomarkers,
therapies, and resistance in cancer. Int J Biol Sci. 16:2628–2647.
2020. View Article : Google Scholar : PubMed/NCBI
|
|
14
|
Sun Z, Shi K, Yang S, Liu J, Zhou Q, Wang
G, Song J, Li Z, Zhang Z and Yuan W: Effect of exosomal miRNA on
cancer biology and clinical applications. Mol Cancer. 17:1472018.
View Article : Google Scholar : PubMed/NCBI
|
|
15
|
Peng Y and Croce CM: The role of MicroRNAs
in human cancer. Signal Transduct Target Ther. 1:150042016.
View Article : Google Scholar : PubMed/NCBI
|
|
16
|
Partida-Sánchez S, Cockayne DA, Monard S,
Jacobson EL, Oppenheimer N, Garvy B, Kusser K, Goodrich S, Howard
M, Harmsen A, et al: Cyclic ADP-ribose production by CD38 regulates
intracellular calcium release, extracellular calcium influx and
chemotaxis in neutrophils and is required for bacterial clearance
in vivo. Nat Med. 7:1209–1216. 2001. View Article : Google Scholar : PubMed/NCBI
|
|
17
|
Livak KJ and Schmittgen TD: Analysis of
relative gene expression data using real-time quantitative PCR and
the 2(−Delta Delta C(T)) method. Methods. 25:402–408. 2001.
View Article : Google Scholar : PubMed/NCBI
|
|
18
|
Mouly E, Planquette C, Rousseau E and
Delansorne R: Inecalcitol enhances daratumumab-induced
antibody-dependent cell cytotoxicity towards multiple myeloma and
acute myeloid leukemia cell lines. Blood. 132 (Suppl 1):S14472018.
View Article : Google Scholar
|
|
19
|
Zhong X and Ma H: Targeting CD38 for acute
leukemia. Front Oncol. 12:10077832022. View Article : Google Scholar : PubMed/NCBI
|
|
20
|
Breitman TR, Chen ZX and Takahashi N:
Potential applications of cytodifferentiation therapy in
hematologic malignancies. Semin Hematol. 31 (4 Suppl 5):S18–S25.
1994.
|
|
21
|
Johansson P, Fasth A, Ek T and Hammarsten
O: Validation of a flow cytometry-based detection of γ-H2AX, to
measure DNA damage for clinical applications. Cytometry B Clin
Cytom. 92:534–540. 2017. View Article : Google Scholar : PubMed/NCBI
|
|
22
|
Yuan W, Sun Q, Jiang Y, Zhang X, Chen L,
Xie C, Qin F, Chen Y, Lv H, Chen W and Xiao Y: MiR-146a affects the
alteration in myeloid differentiation induced by hydroquinone in
human CD34+ hematopoietic progenitor cells and HL-60
cells. Toxicol Res (Camb). 5:848–858. 2016. View Article : Google Scholar : PubMed/NCBI
|
|
23
|
Vergani E, Dugo M, Cossa M, Frigerio S, Di
Guardo L, Gallino G, Mattavelli I, Vergani B, Lalli L, Tamborini E,
et al: miR-146a-5p impairs melanoma resistance to kinase inhibitors
by targeting COX2 and regulating NFkB-mediated inflammatory
mediators. Cell Commun Signal. 18:1562020. View Article : Google Scholar : PubMed/NCBI
|
|
24
|
Tse AKW, Wan CK, Shen XL, Zhu GY, Cheung
HY, Yang M and Fong WF: 1,25-dihydroxyvitamin D3 induces biphasic
NF-kappaB responses during HL-60 leukemia cells differentiation
through protein induction and PI3K/Akt-dependent
phosphorylation/degradation of IkappaB. Exp Cell Res.
313:1722–1734. 2007. View Article : Google Scholar : PubMed/NCBI
|
|
25
|
Zhang X, Zhang G, Huang H, Li H, Lin S and
Wang Y: Differentially expressed MicroRNAs in radioresistant and
radiosensitive atypical meningioma: A clinical study in chinese
patients. Front Oncol. 10:5012020. View Article : Google Scholar : PubMed/NCBI
|
|
26
|
Chen W, Yao G and Zhou K:
miR-103a-2-5p/miR-30c-1-3p inhibits the progression of prostate
cancer resistance to androgen ablation therapy via targeting
androgen receptor variant 7. J Cell Biochem. 120:14055–14064. 2019.
View Article : Google Scholar : PubMed/NCBI
|
|
27
|
Lin JC, Kuo CY, Tsai JT and Liu WH:
miR-671-5p inhibition by MSI1 promotes glioblastoma tumorigenesis
via radioresistance, tumor motility and cancer stem-like cell
properties. Biomedicines. 10:212021. View Article : Google Scholar : PubMed/NCBI
|
|
28
|
Qiu X and Qin F: Retraction: FAM64A
antagonizes tumor suppressive effects of miR-610 in neuroblastoma
in vitro. J Neurosurg Sci. Apr 16–2021.(Epub ahead of print).
View Article : Google Scholar : PubMed/NCBI
|
|
29
|
Liu Y, Hu L, Liu O, Ye J and Zhang J:
miR-3651 participates in the growth cycle of hepatocellular
carcinoma cells and promotes the malignant metastasis via the
PI3K/AKT/mTOR signalling pathway. J Oncol. 2022:57449992022.
View Article : Google Scholar : PubMed/NCBI
|
|
30
|
Li C, Ding D, Gao Y and Li Y:
MicroRNA-3651 promotes colorectal cancer cell proliferation through
directly repressing T-box transcription factor 1. Int J Mol Med.
45:956–966. 2020.PubMed/NCBI
|
|
31
|
Noh JK, Woo SR, Yun M, Lee MK, Kong M, Min
S, Kim SI, Lee YC, Eun YG and Ko SG: SOD2- and NRF2-associated gene
signature to predict radioresistance in head and neck cancer.
Cancer Genomics Proteomics. 18:675–684. 2021. View Article : Google Scholar : PubMed/NCBI
|
|
32
|
You GR, Chang JT, Li YL, Huang CW, Tsai
YL, Fan KH, Kang CJ, Huang SF, Chang PH and Cheng AJ: MYH9
facilitates cell invasion and radioresistance in head and neck
cancer via modulation of cellular ROS levels by activating the
MAPK-Nrf2-GCLC pathway. Cells. 11:28552022. View Article : Google Scholar : PubMed/NCBI
|
|
33
|
Yu M, Wang J, Zhu Z, Hu C, Ma Q, Li X, Yin
X, Huang J, Zhang T, Ma Z, et al: Prognostic impact of MYH9
expression on patients with acute myeloid leukemia. Oncotarget.
8:156–163. 2017. View Article : Google Scholar : PubMed/NCBI
|
|
34
|
Metzeler KH, Hummel M, Bloomfield CD,
Spiekermann K, Braess J, Sauerland MC, Heinecke A, Radmacher M,
Marcucci G, Whitman SP, et al: An 86-probe-set gene-expression
signature predicts survival in cytogenetically normal acute myeloid
leukemia. Blood. 112:4193–4201. 2008. View Article : Google Scholar : PubMed/NCBI
|
|
35
|
Zhai Y, Shen H and Wei H: A comprehensive
metabolism-related gene signature predicts the survival of patients
with acute myeloid leukemia. Genes (Basel). 15:632023. View Article : Google Scholar : PubMed/NCBI
|
|
36
|
Gregory MA, D'Alessandro A,
Alvarez-Calderon F, Kim J, Nemkov T, Adane B, Rozhok AI, Kumar A,
Kumar V, Pollyea DA, et al: ATM/G6PD-driven redox metabolism
promotes FLT3 inhibitor resistance in acute myeloid leukemia. Proc
Natl Acad Sci USA. 113:E6669–E6678. 2016. View Article : Google Scholar : PubMed/NCBI
|


![Cell proliferation curve and DNA
fragmentation analysis. (A) Cumulative proliferation of Wt-HL60 and
Res-HL60 cells under non-irradiated conditions. Cells were seeded
at 2×10⁵ cells/ml on Day-1 and cultured without
irradiation. On Day 2, the cells were passaged to maintain the same
seeding density. If cell density remained below this threshold,
only the medium was replaced without passaging. The cumulative
number of viable cells was calculated using the formula: Cumulative
cell number (/ml)=A × [(2×10⁵) + B]/(2×105),
where ‘A’ is the viable cell number up to Day 2, and ‘B’ is the net
increase from Day 3 onward relative to the reseeding density. (B)
Cumulative proliferation of Wt-HL60 and Res-HL60 cells under 4-Gy
irradiated conditions. The same seeding and passaging protocol as
in (A) was followed, except that the cells were exposed to 4 Gy of
X-ray irradiation on Day 0. Cell proliferation was then monitored
to assess the impact of irradiation on the growth of wild-type and
resistant HL60 cells. Cumulative viable cell numbers were
calculated using the same formula as in (A). (C) Representative
images of the comet assay showing DNA damage 24 h after X-ray
exposure at doses of 1–4 Gy. (D) Quantification of DNA damage based
on tail moment calculated from the comet assay shown in (C). Data
are shown as the mean ± standard error of the mean from four
independent experiments. *P<0.05, **P<0.01 vs. Wt-HL60,
determined by unpaired Student's t-test. Wt, wild type; Res,
resistant.](/article_images/mmr/32/4/mmr-32-04-13645-g01.jpg)