Introduction
Colorectal cancer (CRC) is the third and fourth most
common cancer in females and males, respectively, accounting for
610,000 mortalities worldwide each year. An estimated 14,180 and
15,960 new cases of CRC in males and females, respectively,
occurred in Brazil in 2012. These values correspond with an
estimated risk of 15 new CRC cases in males and 16 in females per
100,000 per year (1).
The overall survival rate of patients with CRC is
highly dependent on the disease stage at the time of diagnosis. The
estimated five-year survival rates range from 85–90% for patients
with stage I tumors to <5% for patients with stage IV diseases.
Although the number of new CRC cases and mortalities from CRC has
declined in more recent years, approximately half of all CRC
patients develop a local recurrence or distant metastases during
the course of their disease (2). To
date, clinical, pathological or molecular markers for the
identification of patients who are at risk of developing distant
metastases have not been established (3).
CRC is curable in ~90% cases if it is detected at an
early stage (4). The early
detection of CRC through screening programs that detect mucosal
changes which are predictive of colorectal tumors reduces the
incidence and mortality rates of this disease (5,6).
Current non-invasive screening procedures for CRC are not
effective. Fecal occult blood test (FOBT), a commonly used
non-invasive screening procedure, reduces CRC-related mortality by
20% when performed every two years (7). Despite improvements in sensitivity,
FOBT has a low detection rate for early-stage tumors and
precancerous lesions, such as polyps (8). Although invasive screening tests,
including colonoscopy and retosigmoidoscopia are more effective,
they are extremely costly and require extensive preparation of the
bowel, invasion of patient privacy and sedation (9). Therefore, there is a requirement for
sensitive and specific diagnostic markers that may be used to
control the adenoma-to-carcinoma sequence of CRC (2).
Sporadic CRC is a consequence of the accumulation of
genetic and epigenetic alterations that result in the
transformation of normal colonic epithelial cells to
adenocarcinomas. The loss of genomic stability and subsequent
genetic alterations in tumor suppressor genes and oncogenes
initiate carcinogenesis and tumor progression (10). CRC carcinogenesis is associated with
alterations in oncogenes, including KRAS, and tumor
suppressor genes, including adenomatous polyposis coli
(APC), deleted in CRC and tumor protein p53. Over 25
years ago, Vogelstein et al identified an extensive loss of
DNA methylation in the non-promoter regions in colon cancer cells.
This global hypomethylation has been associated with an increased
genomic instability and overexpression of a variety of genes that
are implicated in CRC pathogenesis (11). A common event in the tumorigenesis
of CRC is believed to be the association of global hypomethylation
with discrete hypermethylation at the promoter regions of specific
genes that are involved in cell cycle regulation, DNA repair,
apoptosis, angiogenesis, adhesion and invasion (12). As the aberrant methylation of
promoter regions precedes genetic alterations, epigenetic events
that are associated with CRC may have great potential to be used as
biomarkers for the detection of early-stage disease (13).
The aim of the present study was to investigate the
epigenetic changes (DNA methylation) in 24 candidate genes in CRC
tumors. A total of five candidate hypermethylated (HM) genes were
identified, which may be useful epigenetic markers for non-invasive
CRC screening.
Materials and methods
Subjects
The epigenetic changes in 24 candidate genes
(Table I) were evaluated in tissues
from patients with CRC and from normal controls. The test group
consisted of 10 randomly selected patients with primary colorectal
adenocarcinoma who underwent surgical resection at the Federal
University of São Paulo (São Paulo, Brazil). The control group
consisted of 10 individuals with a normal colonoscopy and without a
previous diagnosis of inflammatory bowel disease or malignant
disease. This study was approved by the Ethical Committee of the
Federal of São Paulo (São Paulo, Brazil). All patients provided
written informed consent.
 | Table IHM and UM genes in the control
group. |
Table I
HM and UM genes in the control
group.
| Control | Mean (%) | Median (%) | SD (%) | N | CI (%) | P-value |
|---|
| APC |
| HM | 32.5 | 34.0 | 17.6 | 9 | 11.5 | 0.028 |
| UM | 67.5 | 66.0 | 17.6 | 9 | 11.5 | |
| CDH1 |
| HM | 34.6 | 39.4 | 17.6 | 9 | 11.5 | 0.043 |
| UM | 65.4 | 60.6 | 17.6 | 9 | 11.5 | |
| CDKN2A |
| HM | 31.6 | 22.3 | 17.7 | 9 | 11.5 | 0.028 |
| UM | 68.4 | 77.7 | 17.7 | 9 | 11.5 | |
| CDKN2A |
| HM | 33.9 | 27.6 | 15.8 | 9 | 10.4 | 0.043 |
| UM | 66.1 | 72.4 | 15.8 | 9 | 10.4 | |
| DKK2 |
| HM | 30.4 | 25.0 | 18.9 | 9 | 12.4 | 0.028 |
| UM | 69.6 | 75.0 | 18.9 | 9 | 12.4 | |
| DKK3 |
| HM | 33.7 | 29.8 | 17.0 | 9 | 11.1 | 0.046 |
| UM | 66.3 | 70.2 | 17.0 | 9 | 11.1 | |
| HIC1 |
| HM | 40.9 | 42.8 | 10.0 | 9 | 6.5 | 0.043 |
| UM | 59.1 | 57.2 | 10.0 | 9 | 6.5 | |
| HNF1B |
| HM | 50.0 | 50.0 | 0.0 | 9 | - | 1.000 |
| UM | 50.0 | 50.0 | 0.0 | 9 | - | |
| HS3ST2 |
| HM | 32.8 | 25.6 | 17.4 | 9 | 11.4 | 0.046 |
| UM | 67.2 | 74.4 | 17.4 | 9 | 11.4 | |
| IGF2 |
| HM | 51.7 | 50.0 | 4.1 | 8 | 2.9 | 0.465 |
| UM | 48.3 | 50.0 | 4.1 | 8 | 2.9 | |
| MLH1 |
| HM | 28.9 | 26.9 | 20.6 | 9 | 13.5 | 0.018 |
| UM | 71.1 | 73.1 | 20.6 | 9 | 13.5 | |
|
hsa-mir-342 |
| HM | 32.6 | 30.1 | 17.4 | 9 | 11.4 | 0.028 |
| UM | 67.4 | 69.9 | 17.4 | 9 | 11.4 | |
| OPCML |
| HM | 42.7 | 47.6 | 10.3 | 9 | 6.7 | 0.043 |
| UM | 57.3 | 52.4 | 10.3 | 9 | 6.7 | |
| PCDH10 |
| HM | 47.7 | 50.0 | 18.6 | 9 | 12.2 | 0.612 |
| UM | 52.3 | 50.0 | 18.6 | 9 | 12.2 | |
| RASSF1 |
| HM | 32.5 | 33.4 | 16.6 | 9 | 10.8 | 0.028 |
| UM | 67.5 | 66.6 | 16.6 | 9 | 10.8 | |
| RUNX3 |
| HM | 52.6 | 50.0 | 4.3 | 9 | 2.8 | 0.068 |
| UM | 47.4 | 50.0 | 4.3 | 9 | 2.8 | |
| SFRP1 |
| HM | 38.2 | 33.8 | 11.9 | 9 | 7.8 | 0.043 |
| UM | 61.8 | 66.2 | 11.9 | 9 | 7.8 | |
| SFRP2 |
| HM | 37.4 | 35.4 | 13.1 | 9 | 8.6 | 0.043 |
| UM | 62.6 | 64.6 | 13.1 | 9 | 8.6 | |
| SFRP5 |
| HM | 52.5 | 50.0 | 5.2 | 9 | 3.4 | 0.180 |
| UM | 47.5 | 50.0 | 5.2 | 9 | 3.4 | |
| SPARC |
| HM | 48.7 | 50.0 | 2.3 | 9 | 1.5 | 0.593 |
| UM | 49.2 | 50.0 | 4.4 | 9 | 2.9 | |
| TMEFF2 |
| HM | 29.2 | 22.7 | 17.4 | 9 | 11.3 | 0.046 |
| UM | 63.6 | 77.3 | 29.4 | 9 | 19.2 | |
| UCHL1 |
| HM | 34.5 | 37.8 | 16.2 | 9 | 10.6 | 0.043 |
| UM | 65.5 | 62.2 | 16.2 | 9 | 10.6 | |
| WIF1 |
| HM | 34.8 | 50.0 | 19.0 | 9 | 12.4 | 0.080 |
| UM | 53.1 | 50.0 | 17.7 | 9 | 11.6 | |
| WT1 |
| HM | 28.3 | 14.0 | 26.2 | 9 | 17.1 | 0.069 |
| UM | 65.1 | 54.1 | 27.3 | 9 | 17.8 | |
DNA extraction
The CRC tissues were removed by the surgical
pathologist and immediately frozen in liquid nitrogen. The freshly
frozen tumor tissues (25 mg) were cut into small sections and
incubated for 6 h at 56ºC. During the incubation period, the tissue
samples were vortexed every 30 min to promote lysis. Biopsy
specimens were collected from the control group during the
colonoscopy and placed into tubes containing Allprotect (Qiagen,
Hilden, Germany). Sterile gauze was used to remove the excess
Allprotect from the specimens. The entire biopsy fragment (≤10 mg)
was used for DNA extraction. The biopsy fragments were incubated
overnight at 56ºC and periodically vortexed to promote lysis. The
DNA was extracted from the surgical and biopsy specimens using the
QIAamp DNA Mini kit (Qiagen) and QIAamp DNA Micro kit (Qiagen),
respectively, according to the manufacturer’s instructions. The DNA
was eluted in nuclease-free water and stored at −20ºC. The
extracted DNA was quantified using a NanoDrop 1000
spectrophotometer (Thermo Fisher Scientific Inc., Wilmington, DE,
USA).
Methylation analysis
The methylation analysis was performed using the
Methyl-Profiler™ DNA Methylation Polymerase Chain Reaction (PCR)
Array System (SA Biosciences, Hilden, Germany). The Methyl-Profiler
PCR Array System relies on the differential cleavage of target
sequences using two separate restriction endonucleases, whose
activities require either the presence or absence of methylated
cytosines in their respective recognition sequences. The relative
amount of DNA that remained following each enzyme digestion was
quantified by quantitative PCR (qPCR) using the ABI StepOnePlus™
RT-PCR System (Applied Biosystems, Carlsbad, CA, USA).
The relative fractions of HM, intermediate
methylated and unmethylated (UM) DNA were determined by comparing
the amount in each digestion with that of a mock digest using the
standard ΔCt method.
Statistical analysis
Receiver operating characteristic curves were used
to assess the sensitivity, specificity and accuracy of the cancer
detection methods, and for the prediction of the cancer genes.
Non-parametric tests were used for the statistical analysis due to
the low subject numbers (<25 subjects). The
Wilcoxon-Mann-Whitney test was used to compare the HM and UM genes
in the test and control groups. A multivariate cluster analysis was
performed using Euclidean distance to group the genes that
displayed similar methylation statuses. P<0.05 was considered to
indicate a statistically significant difference, and P-values of
0.05–0.10 were considered marginally significant. The statistical
analyses were performed using SPSS software, version 16 (SPSS,
Inc., Chicago, IL, USA), Minitab 15 (Minitab, State College, PA,
USA) and Excel Office 2007 (Microsoft, Redmond, WA, USA) (14–15).
Results
The present study identified five genes among a
panel of 24 cancer-related genes, which had the greatest potential
to be CRC biomarkers based on their epigenetic alterations. From
the test and control groups, one patient each was excluded due to
technical issues. Therefore, nine patients were assigned to the
test and control groups, respectively. The methylation statuses of
the 24 genes from the test and control groups are shown in Tables I and II.
| Table IIHM and UM genes in the CRC group. |
Table II
HM and UM genes in the CRC group.
| CRC | Mean (%) | Median (%) | SD (%) | N | CI (%) | P-value |
|---|
| APC |
| HM | 33.3 | 37.6 | 16.9 | 9 | 11.1 | 0.012 |
| UM | 66.7 | 62.4 | 16.9 | 9 | 11.1 | |
| CDH1 |
| HM | 36.5 | 47.0 | 14.4 | 9 | 9.4 | 0.018 |
| UM | 63.5 | 53.0 | 14.4 | 9 | 9.4 | |
| CDKN2A |
| HM | 36.1 | 43.8 | 14.7 | 9 | 9.6 | 0.028 |
| UM | 63.9 | 56.2 | 14.7 | 9 | 9.6 | |
| CDKN2A |
| HM | 37.7 | 46.0 | 15.0 | 9 | 9.8 | 0.046 |
| UM | 62.3 | 54.0 | 15.0 | 9 | 9.8 | |
| DKK2 |
| HM | 44.8 | 50.0 | 20.9 | 8 | 14.5 | 0.500 |
| UM | 55.2 | 50.0 | 20.9 | 8 | 14.5 | |
| DKK3 |
| HM | 38.7 | 39.8 | 20.4 | 9 | 13.3 | 0.116 |
| UM | 61.3 | 60.2 | 20.4 | 9 | 13.3 | |
| HIC1 |
| HM | 44.9 | 50.0 | 11.2 | 9 | 7.3 | 0.345 |
| UM | 55.1 | 50.0 | 11.2 | 9 | 7.3 | |
| HNF1B |
| HM | 50.0 | 50.0 | 0.0 | 9 | - | 1.000 |
| UM | 50.0 | 50.0 | 0.0 | 9 | - | |
| HS3ST2 |
| HM | 37.0 | 44.5 | 15.5 | 8 | 10.7 | 0.043 |
| UM | 63.0 | 55.5 | 15.5 | 8 | 10.7 | |
| IGF2 |
| HM | 50.4 | 50.0 | 3.3 | 5 | 2.9 | 0.593 |
| UM | 49.6 | 50.0 | 3.3 | 5 | 2.9 | |
| MLH1 |
| HM | 33.6 | 39.5 | 18.1 | 9 | 11.8 | 0.018 |
| UM | 65.0 | 56.2 | 19.0 | 9 | 12.4 | |
|
hsa-mir-342 |
| HM | 38.8 | 46.9 | 21.5 | 8 | 14.9 | 0.172 |
| UM | 61.2 | 53.1 | 21.5 | 8 | 14.9 | |
| OPCML |
| HM | 46.8 | 47.0 | 14.5 | 9 | 9.5 | 0.446 |
| UM | 52.5 | 50.0 | 14.7 | 9 | 9.6 | |
| PCDH10 |
| HM | 55.5 | 50.0 | 9.2 | 9 | 6.0 | 0.144 |
| UM | 44.3 | 50.0 | 9.0 | 9 | 5.9 | |
| RASSF1 |
| HM | 34.9 | 37.6 | 14.8 | 9 | 9.7 | 0.028 |
| UM | 61.5 | 56.7 | 15.3 | 9 | 10.0 | |
| RUNX3 |
| HM | 58.9 | 53.8 | 13.4 | 9 | 8.8 | 0.063 |
| UM | 41.1 | 46.2 | 13.4 | 9 | 8.8 | |
| SFRP1 |
| HM | 47.0 | 50.0 | 9.5 | 9 | 6.2 | 0.686 |
| UM | 53.0 | 50.0 | 9.5 | 9 | 6.2 | |
| SFRP2 |
| HM | 44.5 | 50.0 | 16.3 | 9 | 10.7 | 0.498 |
| UM | 55.5 | 50.0 | 16.3 | 9 | 10.7 | |
| SFRP5 |
| HM | 52.1 | 50.0 | 5.4 | 9 | 3.5 | 0.225 |
| UM | 47.9 | 50.0 | 5.4 | 9 | 3.5 | |
| SPARC |
| HM | 47.9 | 50.0 | 13.6 | 9 | 8.9 | 0.345 |
| UM | 52.1 | 50.0 | 13.6 | 9 | 8.9 | |
| TMEFF2 |
| HM | 41.2 | 47.0 | 21.9 | 9 | 14.3 | 0.327 |
| UM | 54.6 | 50.0 | 22.1 | 9 | 14.5 | |
| UCHL1 |
| HM | 43.2 | 47.2 | 18.9 | 9 | 12.4 | 0.271 |
| UM | 56.8 | 52.8 | 18.9 | 9 | 12.4 | |
| WIF1 |
| HM | 46.1 | 50.0 | 20.7 | 9 | 13.5 | 0.866 |
| UM | 49.6 | 48.6 | 19.4 | 9 | 12.7 | |
| WT1 |
| HM | 29.8 | 26.6 | 17.8 | 9 | 11.6 | 0.017 |
| UM | 70.2 | 73.4 | 17.8 | 9 | 11.6 | |
The five genes that had the highest average UM
percentages in the control group were MLH1 (71.7%),
DKK2 (69.6%), CDKN2A (68.4%), APC (67.5%) and
hsa-mir-342 (67.4%; Table
III). RUNX3 (58.9%), PCDH10 (55.5%), SFRP5
(52.1%), IGF2 (50.4%) and Hnf1b (50.0%) were the five
genes with the highest average HM percentages in the test group
(Table IV).
| Table IIIUM symbol in the control group. |
Table III
UM symbol in the control group.
| UM control | Mean (%) | Median (%) | SD (%) | N | CI (%) | P-value |
|---|
| APC | 67.5 | 66.0 | 17.6 | 9 | 11.5 | 0.688 |
| CDH1 | 65.4 | 60.6 | 17.6 | 9 | 11.5 | 0.393 |
| CDKN2A | 68.4 | 77.7 | 17.7 | 9 | 11.5 | 0.448 |
| CDKN2A | 66.1 | 72.4 | 15.8 | 9 | 10.4 | 0.301 |
| DKK2 | 69.6 | 75.0 | 18.9 | 9 | 12.4 | 0.824 |
| DKK3 | 66.3 | 70.2 | 17.0 | 9 | 11.1 | 0.305 |
| HIC1 | 59.1 | 57.2 | 10.0 | 9 | 6.5 | 0.163 |
| HNF1B | 50.0 | 50.0 | 0.0 | 9 | - | 0.002 |
| HS3ST2 | 67.2 | 74.4 | 17.4 | 9 | 11.4 | 0.349 |
| IGF2 | 48.3 | 50.0 | 4.1 | 8 | 2.9 | 0.008 |
| MLH1 | 71.1 | 73.1 | 20.6 | 9 | 13.5 | - |
|
hsa-mir-342 | 67.4 | 69.9 | 17.4 | 9 | 11.4 | 0.562 |
| OPCML | 57.3 | 52.4 | 10.3 | 9 | 6.7 | 0.163 |
| PCDH10 | 52.3 | 50.0 | 18.6 | 9 | 12.2 | 0.037 |
| RASSF1 | 67.5 | 66.6 | 16.6 | 9 | 10.8 | 0.451 |
| RUNX3 | 47.4 | 50.0 | 4.3 | 9 | 2.8 | 0.001 |
| SFRP1 | 61.8 | 66.2 | 11.9 | 9 | 7.8 | 0.163 |
| SFRP2 | 62.6 | 64.6 | 13.1 | 9 | 8.6 | 0.225 |
| SFRP5 | 47.5 | 50.0 | 5.2 | 9 | 3.4 | 0.002 |
| SPARC | 49.2 | 50.0 | 4.4 | 9 | 2.9 | 0.011 |
| TMEFF2 | 63.6 | 77.3 | 29.4 | 9 | 19.2 | 0.448 |
| UCHL1 | 65.5 | 62.2 | 16.2 | 9 | 10.6 | 0.345 |
| WIF1 | 53.1 | 50.0 | 17.7 | 9 | 11.6 | 0.022 |
| WT1 | 65.1 | 54.1 | 27.3 | 9 | 17.8 | 0.626 |
| Table IVHM Symbol in the CRC group. |
Table IV
HM Symbol in the CRC group.
| HM CRC | Mean (%) | Median (%) | SD (%) | N | CI (%) | P-value |
|---|
| APC | 33.3 | 37.6 | 16.9 | 9 | 11.1 | 0.001 |
| CDH1 | 36.5 | 47.0 | 14.4 | 9 | 9.4 | 0.003 |
| CDKN2A | 36.1 | 43.8 | 14.7 | 9 | 9.6 | 0.004 |
| CDKN2A | 37.7 | 46.0 | 15.0 | 9 | 9.8 | 0.008 |
| DKK2 | 44.8 | 50.0 | 20.9 | 8 | 14.5 | 0.098 |
| DKK3 | 38.7 | 39.8 | 20.4 | 9 | 13.3 | 0.018 |
| HIC1 | 44.9 | 50.0 | 11.2 | 9 | 7.3 | 0.035 |
| HNF1B | 50.0 | 50.0 | 0.0 | 9 | - | 0.024 |
| HS3ST2 | 37.0 | 44.5 | 15.5 | 8 | 10.7 | 0.005 |
| IGF2 | 50.4 | 50.0 | 3.3 | 5 | 2.9 | 0.200 |
| MLH1 | 33.6 | 39.5 | 18.1 | 9 | 11.8 | 0.002 |
|
hsa-mir-342 | 38.8 | 46.9 | 21.5 | 8 | 14.9 | 0.053 |
| OPCML | 46.8 | 47.0 | 14.5 | 9 | 9.5 | 0.056 |
| PCDH10 | 55.5 | 50.0 | 9.2 | 9 | 6.0 | 0.387 |
| RASSF1 | 34.9 | 37.6 | 14.8 | 9 | 9.7 | 0.003 |
| RUNX3 | 58.9 | 53.8 | 13.4 | 9 | 8.8 | - |
| SFRP1 | 47.0 | 50.0 | 9.5 | 9 | 6.2 | 0.065 |
| SFRP2 | 44.5 | 50.0 | 16.3 | 9 | 10.7 | 0.053 |
| SFRP5 | 52.1 | 50.0 | 5.4 | 9 | 3.5 | 0.225 |
| SPARC | 47.9 | 50.0 | 13.6 | 9 | 8.9 | 0.067 |
| TMEFF2 | 41.2 | 47.0 | 21.9 | 9 | 14.3 | 0.057 |
| UCHL1 | 43.2 | 47.2 | 18.9 | 9 | 12.4 | 0.046 |
| WIF1 | 46.1 | 50.0 | 20.7 | 9 | 13.5 | 0.120 |
| WT1 | 29.8 | 26.6 | 17.8 | 9 | 11.6 | 0.003 |
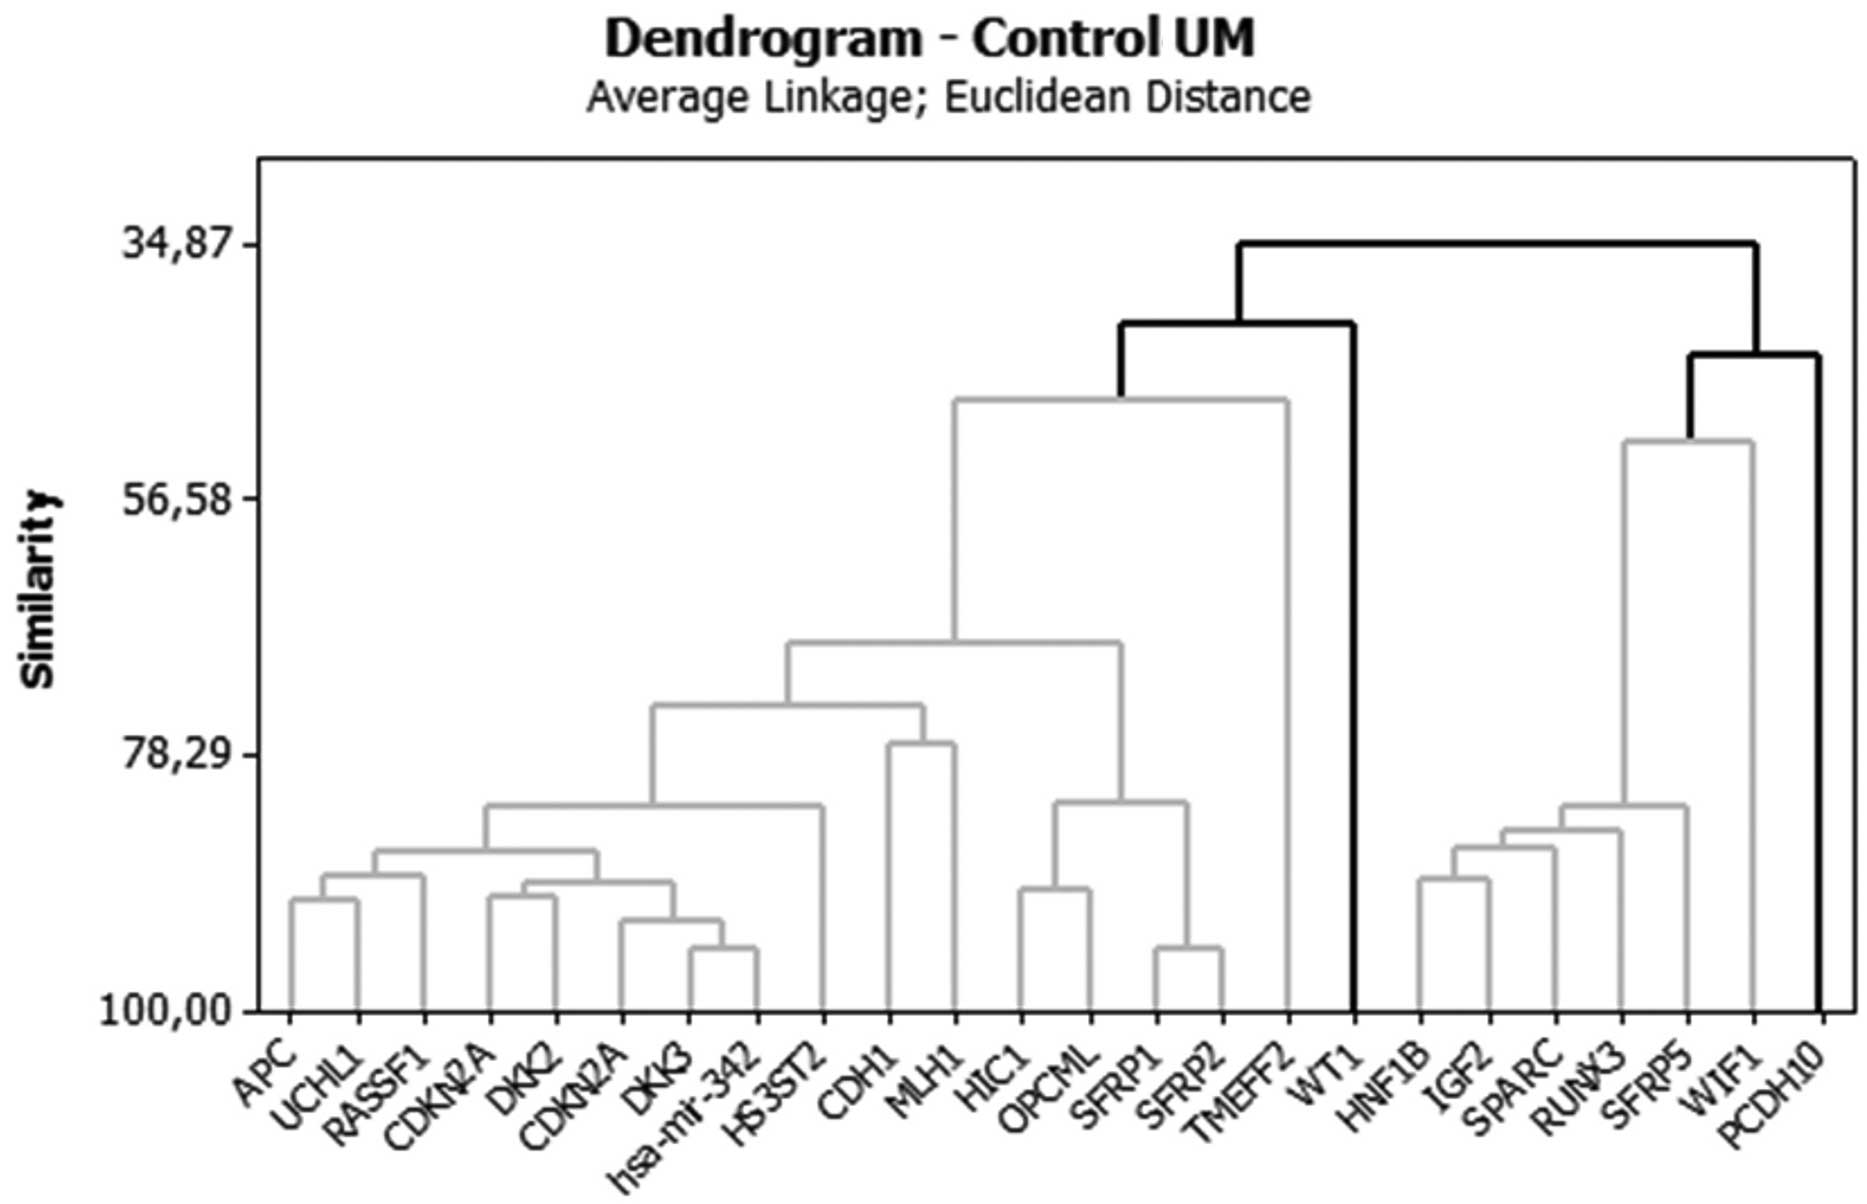
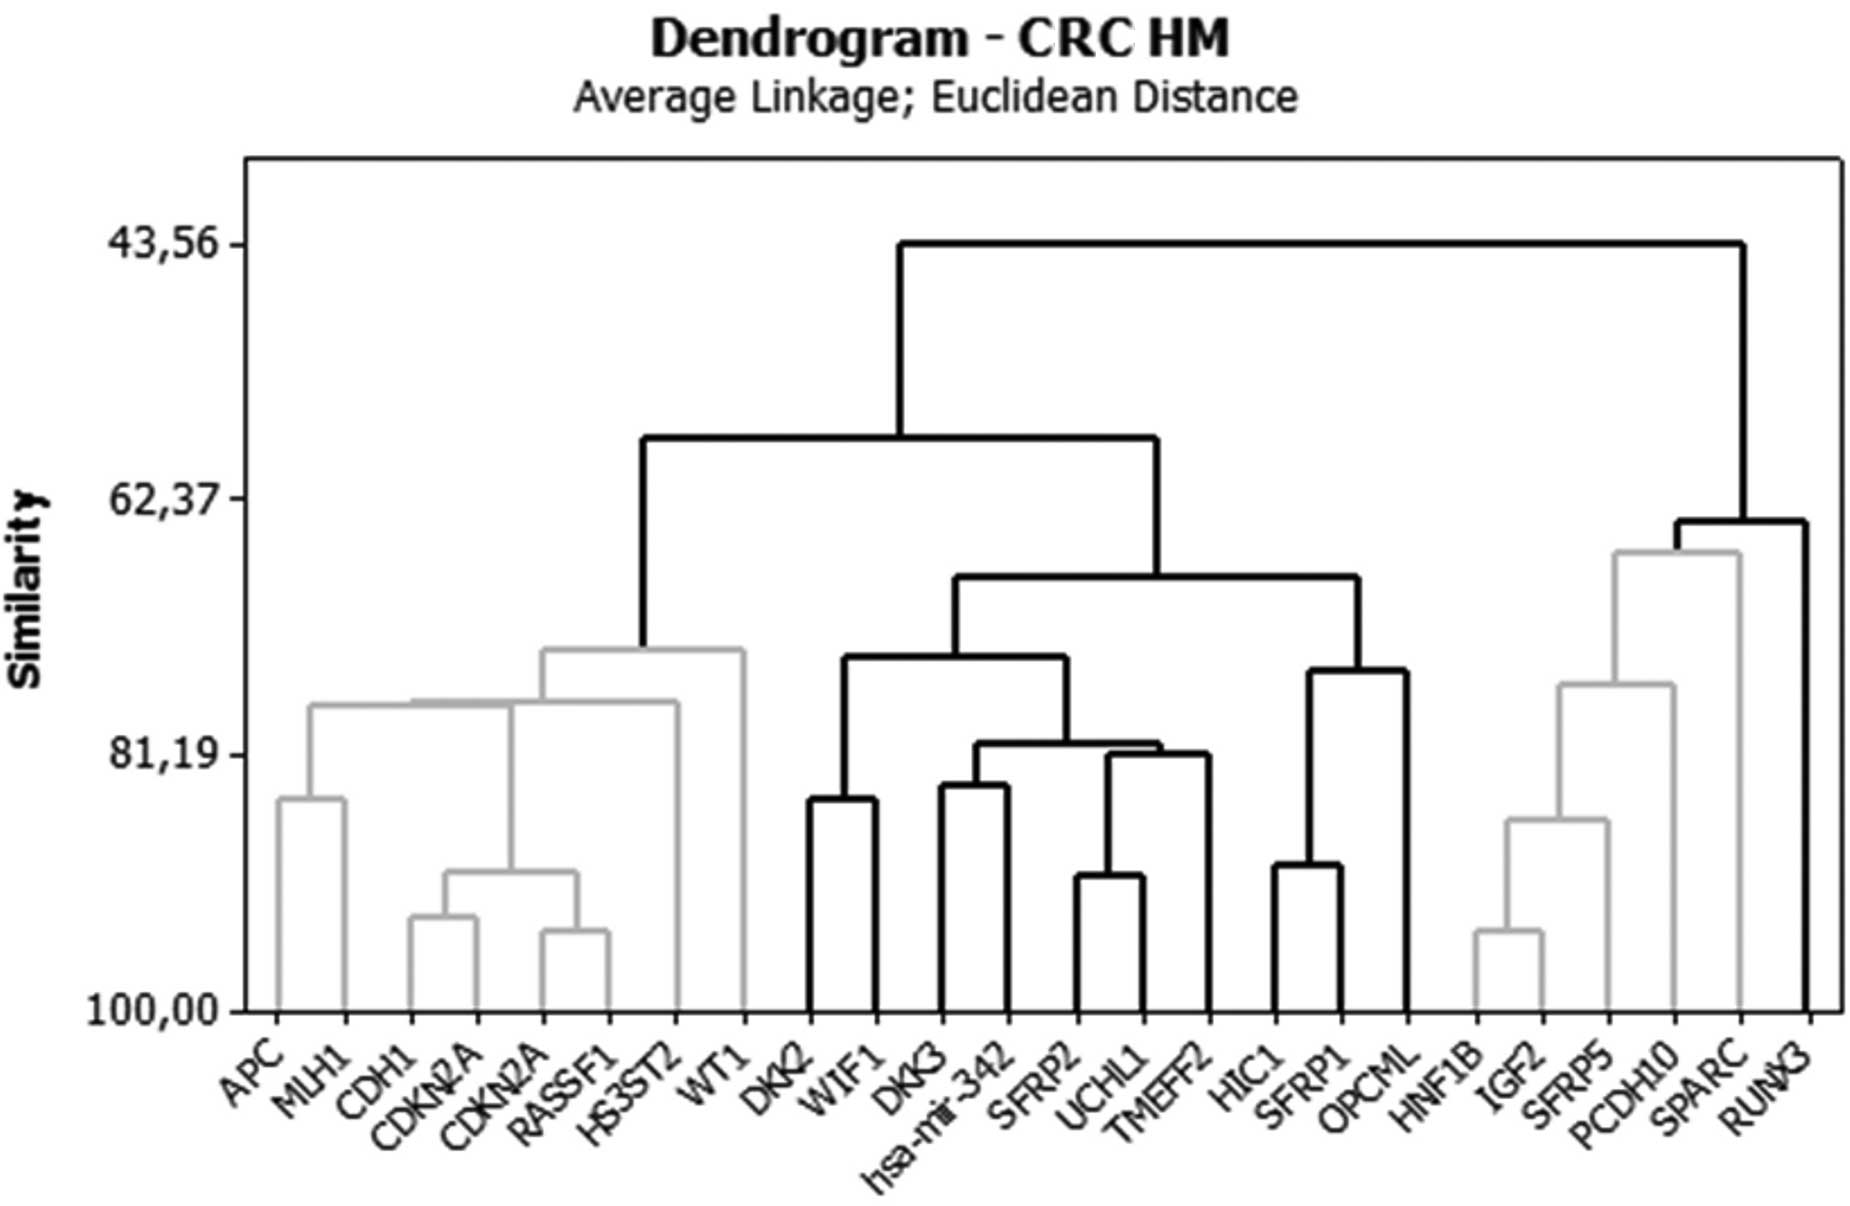
The analysis of groups or clusters is an exploratory
multivariate analysis technique that allows subjects to be grouped
into homogeneous or compact groups based on one or more common
characteristics (14,15). Each subject in the same cluster is
more similar to each other than to those in the other clusters. In
the present study, a cluster analysis using Euclidean distance was
performed in order to group the genes that displayed similar
methylation behaviors. Tables V and
VI show the distance values
between the centers (centroids) of the clusters for each analysis.
The larger the distance between the clusters, the more distinct the
clusters are. Cluster analysis data are best visualized using
graphs called dendograms, which display the associations between
the clusters (i.e., groups of genes). (Figs. 1 and 2).
| Table VDistance of centers of clusters in
control. |
Table V
Distance of centers of clusters in
control.
| Control | Cluster 1 | Cluster 2 | Cluster 3 |
|---|
| HM |
| Cluster 2 | 0.6463 | | |
| Cluster 3 | 0.6127 | 0.5009 | |
| Cluster 4 | 0.4068 | 0.9848 | 0.8757 |
| UM | | | |
| Cluster 2 | 0.6480 | | |
| Cluster 3 | 0.6076 | 0.5782 | |
| Cluster 4 | 0.5948 | 0.8421 | 1.0852 |
| Table VIDistance of centers of clusters in
CRC patients. |
Table VI
Distance of centers of clusters in
CRC patients.
| CRC | Cluster 1 | Cluster 2 | Cluster 3 |
|---|
| HM |
| Cluster 2 | 0.4219 | | |
| Cluster 3 | 0.6637 | 0.4780 | |
| Cluster 4 | 1.0034 | 0.7238 | 0.3792 |
| UM |
| Cluster 2 | 0.4585 | | |
| Cluster 3 | 0.3655 | 0.3473 | |
| Cluster 4 | 0.7114 | 0.5155 | 0.4690 |
Discussion
Epigenetics is the study of heritable and
age-related modifications of the genome that occur without a change
in the primary DNA sequence. In recent years, epigenetics has
become an emerging field due to the fundamental role of epigenetic
modifications, including DNA methylation, specific histone
modifications and noncoding RNAs (i.e., silencing RNA and
microRNA), in the regulation of gene expression (16). Epigenetic alterations, particularly
aberrant DNA methylation, contribute to tumor initiation and
progression. The methylation of tumor-specific loci, rather than
the presence of methylation, is key in carcinogenesis (2). The finding that aberrant DNA
methylation is associated with the occurrence of early CRC lesions
suggests that epigenetic alterations are involved in the initiation
of CRC. However, the possibility that aberrant DNA methylation is a
secondary phenomenon cannot be excluded (17). Therefore, a knowledge of DNA
methylation patterns and the detection of HM genes in normal and
cancerous tissues may facilitate an understanding of the
tumorigenesis of CRC, leading to the identification of new
diagnostic, prognostic and predictive biomarkers. Furthermore, the
epigenetic changes due to DNA methylation in cancer represent an
attractive therapeutic target, as they are reversible in nature,
unlike genetic alterations (18).
Since methylated genes that are present in tumor tissues may be
identified in urine and serum, epigenetic biomarkers represent a
non-invasive screening method for CRC diagnosis.
The methylation of CpG islands occurs early in
carcinogenesis but may also be detected in normal epithelium as a
result of aging and inflammation. As methylated alleles may be
detected with a very high degree of sensitivity, there is great
scope in using methylation as a potential early detection system
for cancer. A variety of genome-wide methods are currently
available for the discovery of differentially methylated markers.
However, these methods typically produce large numbers of potential
candidates. An estimated 500 genes may be involved in CRC based on
DNA methylation studies (19).
Thus, downstream selection processes are critical for the
identification of clinically relevant markers that have the
necessary properties to perform adequately in future tests
(20).
Despite the association of epigenetic alterations in
DNA methylation and carcinogenesis, certain studies have failed to
demonstrate an association between the methylation status of a gene
and cancer (21). Furthermore,
certain studies have indicated that methylated genes retain their
normal function (21). Based on
this information, it is important to determine not only the
presence of gene methylation but also the extent of methylation.
For example, a gene that is 30% methylated may display alternative
behaviors than a gene that is 60% methylated. Based only on the
presence of methylation, the two genes would have been classified
in the same group. Numerous studies use qualitative techniques to
assess methylation status by defining a cut-off value based on the
amount of methylated cytosines that are required to repress gene
expression. Based on a common PCR-based method of methylation
analysis using bisulfite treatment of DNA, the minimum methylation
level for a gene to be considered HM is 10–20% methylation
(22). In the present study, using
a qPCR-based technique, a group of five HM genes with the highest
percentage of methylation were identified in CRC patients,
RUNX3, PCDH10, SFRP5, IGF2 and
Hnf1b. These genes were observed to have the greatest
potential of gene expression repression and, therefore, were the
most promising biomarkers for the diagnosis of CRC. A group of five
genes that had the highest unmethylation percentage were identified
in the control group, MLH1, DKK2, CDKN2A,
APC and hsa-mir-342. Alterations in these genes are
commonly associated with CRC carcinogenesis. These 10 genes did not
differ quantitatively between the test and control groups, but they
qualitatively represented the genes with the highest percentages of
methylation and unmethylation. These data suggested that in the
control group, the genes were not providing a protective effect,
but in the carcinogenic process, they submitted a contrary
profile.
In summary, the present preliminary study identified
the methylation profiles of normal and cancerous colonic epithelial
tissues, and provided the groundwork for future large-scale
methylation studies. As DNA methylation is significant in CRC
initiation, this study will be useful in understanding the
epigenetic mechanisms of CRC and identifying biomarkers for the
detection of early-stage disease.
Acknowledgements
This study was supported by The São Paulo Research
Foundation (FAPESP).
References
|
1
|
INCA. 2013, Instituto Nacional do Câncer.
Ministério da Saúde. http://www.inca.gov.br/estimativa/2012/.
Accessed January 10, 2013
|
|
2
|
Kim MS, Lee J and Sidransky D: DNA
methylation markers in colorectal cancer. Cancer Metastasis Rev.
29:181–206. 2010. View Article : Google Scholar : PubMed/NCBI
|
|
3
|
Pellegrini ML, Argibay P and Gómez DE:
Genetics and epigenetics of colorectal cancer. Acta Gastroenterol
Latinoam. 41:247–261. 2011.(In Spanish).
|
|
4
|
Toribara NW and Sleisenger MH: Screening
for colorectal cancer. N Eng J Med. 332:861–867. 1995. View Article : Google Scholar : PubMed/NCBI
|
|
5
|
Winawer SJ: Colorectal cancer screening.
Best Pract Res Clin Gastroenterol. 21:1031–1048. 2007. View Article : Google Scholar
|
|
6
|
Pignone MP and Lewis CL: Using quality
improvement techniques to increase colon cancer screening. Am J
Med. 122:419–420. 2009. View Article : Google Scholar : PubMed/NCBI
|
|
7
|
Atkin W: Options for screening for
colorectal cancer. Scand J Gastroenterol Suppl. 237:13–16. 2003.
View Article : Google Scholar : PubMed/NCBI
|
|
8
|
Imperiale TF, Ransohoff DF, Itzkowitz SH,
et al: Fecal DNA versus fecal occult blood for colorectal-cancer
screening in an average-risk population. N Engl J Med.
351:2704–2714. 2004. View Article : Google Scholar : PubMed/NCBI
|
|
9
|
Grützmann R, Molnar B, Pilarsky C, et al:
Sensitive detection of colorectal cancer in peripheral blood by
septin 9 DNA methylation assay. PLoS One. 3:e37592008.PubMed/NCBI
|
|
10
|
Grady WM and Carethers JM: Genomic and
epigenetic instability in colorectal cancer pathogenesis.
Gastroenterology. 135:1079–1099. 2008. View Article : Google Scholar : PubMed/NCBI
|
|
11
|
Vogelstein B, Fearon ER, Hamilton SR, et
al: Genetic alterations during colorectal-tumor development. N Eng
J Med. 319:525–532. 1988. View Article : Google Scholar : PubMed/NCBI
|
|
12
|
Carmona FJ and Esteller M: Epigenomics of
human colon cancer. Mutat Res. 693:53–60. 2010. View Article : Google Scholar : PubMed/NCBI
|
|
13
|
Rawson JB and Bapat B: Epigenetic
biomarkers in colorectal cancer diagnostics. Expert Rev Mol Diagn.
12:499–509. 2012. View Article : Google Scholar : PubMed/NCBI
|
|
14
|
Conover WI: Practcal Nonparametric
Statistics. 1st edition. John Wiley & Sons, Inc; New York, NY,
USA: 1971
|
|
15
|
Daniel WW and Cross CL: Biostatistics: a
foundation for analysis in the health sciences. 6th edition. John
Wiley; Georgia, USA: 1995
|
|
16
|
Migheli F and Migliore L: Epigenetics of
colorectal cancer. Clin Genet. 81:312–318. 2012. View Article : Google Scholar
|
|
17
|
Lange CP, Campan M, Hinoue T, et al:
Genome-scale discovery of DNA-methylation biomarkers for
blood-based detection of colorectal cancer. PLoS One. 7:e502662012.
View Article : Google Scholar : PubMed/NCBI
|
|
18
|
Karpf AR and Jones DA: Reactivating the
expression of methylation silenced genes in human cancer. Oncogene.
21:5496–5503. 2012. View Article : Google Scholar : PubMed/NCBI
|
|
19
|
Schuebel KE, Chen W, Cope L, et al:
Comparing the DNA hypermethylome with gene mutations in human
colorectal cancer. PLoS Genet. 3:1709–1723. 2007. View Article : Google Scholar : PubMed/NCBI
|
|
20
|
Lofton-Day C, Model F, Devos T, et al: DNA
methylation biomarkers for blood-based colorectal cancer screening.
Clin Chem. 54:414–423. 2008. View Article : Google Scholar : PubMed/NCBI
|
|
21
|
Goel A and Boland CR: Epigenetics of
colorectal cancer. Gastroenterology. 143:1442–1460. 2012.
View Article : Google Scholar
|
|
22
|
Ausch C, Kim YH, Tsuchiya KD, et al:
Comparative analysis of PCR-based biomarker assay methods for
colorectal polyp detection from fecal DNA. Clin Chem. 55:1559–63.
2009. View Article : Google Scholar : PubMed/NCBI
|