Introduction
Resistance to chemotherapeutic agents, either de
novo or developing during a course of treatment, is a major
clinical issue for patients with colorectal cancer (1–3).
Current response rates to combination chemotherapy are ~50%, and as
resistance develops in almost all patients, understanding the
mechanisms behind this is vital. Despite previous intense
investigations, these mechanisms are not completely understood.
For disease stages II and above, chemotherapy is
routine, consisting of intravenous 5-fluorouracil (5-FU; or oral
capecitabine) with or without oxaliplatin and/or irinotecan
(4). 5-FU is an analogue of uracil,
which is metabolised intracellularly to toxic compounds, causing
DNA damage and the blocking of DNA replication and translation
(5). Oxaliplatin is a
platinum-based drug, which forms platinum-DNA adducts in cells,
causing G2 arrest, inhibiting growth and leading to
apoptosis (6). Irinotecan, once
converted to the active metabolite SN-38, binds to and inhibits
topoisomerase I at the initial stages of DNA replication, which
leads to cell cycle arrest and DNA damage with subsequent apoptosis
(7).
Obesity is an established risk factor for colorectal
cancer incidence and mortality (8–10), but
the impact on survival and treatment response remains controversial
(11–14). In breast cancer patients, the
response rate to neoadjuvant chemotherapy (predominantly
anthracycline-based regimes) has been lower in overweight and obese
patients compared with normal and underweight patients (15). Obesity is associated with insulin
resistance, which alters the levels of plasma glucose, insulin and
insulin-like growth factor-1 (IGF-1) (16–18).
Insulin is a potent mitogen and stimulates DNA
synthesis (19). Experimental
models have shown that pretreatment with insulin increases the
effect of subsequent 5-FU treatment in the human colon cancer cell
line, Ls-174-t (5). Insulin also
increases 5-FU uptake and 5-FU-mediated apoptosis. By contrast,
insulin has been found to decrease the toxic effects of 5-FU in
HT29 colorectal cancer cells (20).
IGF-1 functions as an anti-apoptotic growth factor
(21). Breast cancer cells with
abnormalities in the IGF-pathway showed IGF-1-mediated suppression
of apoptosis and subsequently, were more resistant to doxorubicin
and paclitaxel (22). Similarly,
IGF-1 increased resistance to 5-FU in the SW480 colon cancer cell
line, which was reversible by IGF-1 receptor (IGF-1R) inhibition
(23). In addition, HT29 colorectal
cancer cells, selected for resistance to 5-FU and oxaliplatin,
showed increased expression and activation of IGF-1R (3).
Hypoxic conditions promote the development of
treatment resistance, partly through hypoxia-inducible factor-1
(HIF-1)-mediated pathways (24).
HIF-1 is the master regulator of molecular responses to hypoxia,
controlling >100 genes involved in tumour aggression (25). Previous studies have shown that
HIF-1α expression, stability and activity may be modulated by
metabolic disturbances, including a number of cytokines and growth
factors and specifically, insulin and IGF-1 (26,27).
Conflicting results with regard to the impact of
obesity-related factors on chemoresponse have been published
previously (5,20,23),
as aforementioned. The aim of the current study was to investigate
the effect of increased levels of insulin and IGF-1 and altered
levels of glucose, on the cellular response to standard
chemotherapy in vitro. The response of two colorectal cancer
cells, one derived from a primary adenocarcinoma (WiDr), the other
from a metastatic site of an adenocarcinoma (SW620), was compared
with a stromal cell type [human microvascular endothelial cells
(HMEC)-1)]. The duration of stimulation (pretreatment time) was
also investigated to distinguish between acute and chronic
disturbance in the insulin/IGF-1 axis.
Materials and methods
Cell culture
Human colon cancer cells (primary adenocarcinoma,
WiDr and metastatic adenocarcinoma, SW620; American Type Culture
Collection, Manassas, VA, USA) and HMEC-1 cells (Centers for
Disease Control and Prevention, Atlanta, GA, USA) were used
(28). Cancer cell genotypes are
listed in Table I and HMEC-1 cells
were assumed to be wild-type (no contrasting evidence was
reported). Cells were cultivated in high (25 mM) or normal (5.6 mM)
glucose Dulbecco’s modified Eagle’s medium (DMEM; Gibco, Carlsbad,
CA, USA) with 10% cosmic calf serum (CCS; Thermo Scientific
HyClone, Logan, UT, USA) in standard conditions (humidified at 37°C
in 5% CO2), unless specified otherwise. Glucose
concentrations in cell culture were monitored over time (Optium
Xceed; Abbott Diabetes Care, Doncaster, Australia), demonstrating
that glucose concentrations reduced by ~18% over 24 h in a
confluent cell culture.
 | Table ICellular characteristics and
viability of cancer and stromal cells grown in high or normal
glucose media, following 5-day treatment with insulin or IGF-1
compared with controls with no pretreatment (equivalent to
100%). |
Table I
Cellular characteristics and
viability of cancer and stromal cells grown in high or normal
glucose media, following 5-day treatment with insulin or IGF-1
compared with controls with no pretreatment (equivalent to
100%).
| | High glucose (25
mM) | Normal glucose (5.6
mM) |
|---|
| |
|
|
|---|
| Mutated
oncogenesa | Insulin (10
nM) | IGF-1 (13 nM) | Insulin (10
nM) | IGF-1 (13 nM) |
|---|
| WiDrb | TP53, PIK3CA and
BRAF | 142±11 | 155±12 | 114±21 | 115±10 |
| SW620c | TP53 and KRAS | 124±4 | 136±7 | 113±10 | 137±1 |
| HMEC-1d | | 113±3 | 136±8 | 116±1 | 125±4 |
Cell viability assay
Cells were cultivated in DMEM with 10% CCS with high
(25 mM) or normal (5.6 mM) glucose concentrations and incubated for
24 h. Plain media, IGF-1 (13 nM; Sigma-Aldrich, St. Louis, MO, USA)
or insulin (10 nM; Invitrogen Life Technologies, Carlsbad, CA, USA)
were added to the cells 24, 4 or 0 h prior to the addition of 5-FU
(0.2–200 μM), oxaliplatin (0.001–100 μM) or irinotecan (0.001–100
μM). Each treatment was tested in four wells per experiment, with
three independent experiments, and the cells were treated for 72 h.
Cell viability was estimated by standard
3-(4,5-dimethylthiazol-2-yl)-2,5-diphenyltetrazolium bromide (MTT)
assay (29), calculated as a
percentage of the controls (0 μM of chemotherapy drug) and adjusted
for background absorbance. The concentration of drug able to reduce
viability to 50% (IC50) was calculated from equations
obtained by model fitting. Although it is accepted that MTT, an
indicator of metabolically active mitochondria, potentially
overestimates the number of viable cells compared with several
other viability methods (30), it
remains widely used in drug discovery and allows for comparisons
with previously published data.
Western blot analysis
Media was replaced with serum-reduced DMEM (0.1%
CCS) 24 h prior to and throughout the experiment. The cells were
treated for 4 h with IGF-1 (13 nM), insulin (10 nM),
CoCl2 (100 μM positive control) (31) or plain media (negative control).
Nuclear protein fractions were extracted and analysed by western
blot analysis following standard protocols (31). A total of 40 μg protein extract was
loaded per well for the total and nuclear fractions. Anti-HIF-1α
(1:250; clone 54/HIF-1α; BD Biosciences, San Jose, CA, USA) and
anti-β-actin (1:2,000; clone AC-15; Sigma-Aldrich) were
simultaneously used as primary antibodies to detect HIF-1α and to
verify equal loading of protein. Horseradish peroxidase
(HRP)-conjugated polyclonal goat anti-mouse antibody (1:1,000;
DakoCytomation, Glostrup, Denmark) was used as a secondary
antibody. For IGF-1R protein detection, total protein extracts were
analysed, using anti-human IGF-1R (1:100; C-20; Santa Cruz
Biotechnology, Inc., Santa Cruz, CA, USA) as the primary antibody
and HRP-conjugated polyclonal goat anti-rabbit antibody (1:1,000;
DakoCytomation) as the secondary antibody.
HIF-1α cell-based enzyme-linked
immunosorbent assay
Cells were plated into 96-well plates provided in
the human/mouse total HIF-1α immunoassay kit (R&D Systems,
Minneapolis, MN, USA) at recommended concentrations
(104/well) and cultivated under standard conditions. The
media was replaced with serum-reduced DMEM (0.1% CCS) 24 h prior to
and throughout the experiments. The cells were treated with
CoCl2 (100 μM positive control), plain media (negative
control), IGF-1 (13 nM) and insulin (10 nM) for 4 h. The cells were
then fixed with 4% formaldehyde and analysed immediately by
immunoassay according to the manufacturer’s instructions.
Data analysis
SPSS 16.0 (SPSS, Inc., Chicago, IL, USA) and
Microsoft Excel 2007 (Microsoft Corporation, Redmond, WA, USA)
software were used for the statistical analysis and graphical
presentation of the results.
For the MTT assay results, several linear regression
models using ln transformation of drug concentration (μM) or cell
viability (percent) or the two variables together were tested. The
model was considered to be a good fit if the R2 value
was >0.8. Different models were allowed to be used for the
various cell lines and chemotherapy drugs. However, within these,
the same model was used across the various growth factors,
pretreatments and media conditions. Selected models were used to
calculate the IC50 and ultra-low dose (ULD) values and
for multiple regression analysis.
The following linear regression models were selected
to fit the viability data according to the R2 values: ln
transformation of drug concentration for WiDr treated with 5-FU and
oxaliplatin, for all treatments of SW620 and for HMEC-1 treated
with 5-FU; and ln transformation of cell viability for WiDr treated
with irinotecan and for HMEC-1 treated with oxaliplatin and
irinotecan. IC50 values were calculated from the
equations obtained by model fitting. These values were used to
compare the effect of growth factors on the cellular response to
chemotherapy. Independent sample t-tests were used to compare
IC50, ULD and HIF-1α protein levels between the various
treatments. In the multivariable regression analysis the effect of
growth factors on the response to chemotherapy drugs was estimated
by B coefficients (regression ‘slopes’).
Results
Effect of growth factors and glucose
concentrations on cell viability
Glucose concentrations were specifically selected to
be clinically relevant and are those used widely in cancer cell
culture studies. The lower glucose concentration (5.6 mM)
approximates the lower threshold for normal fasting glucose and the
high glucose concentration (25 mM) falls in the hyperglycemic range
associated with diabetes (32).
Specifically, high glucose concentrations are standard in cancer
cell culture studies (33). Growth
factor concentrations were selected from previously published
patient data; 10 nM insulin (plasma, 2 nM) (34) and 13 nM IGF-1 (plasma, 109 ng/ml)
(35).
IGF-1 and insulin increased the proportion of cells
with metabolically active mitochondria (cell viability) of stromal
and cancer cells by between 13 and 55% (HMEC-1 in high glucose with
insulin and WiDr in high glucose with IGF-1, respectively). IGF-1
generally increased viability more than insulin (with the exception
of WiDr under normal glucose conditions), and an increased
viability was more apparent in high glucose than in normal glucose
conditions (with the exception of SW620 with IGF-1 and HMEC-1 with
insulin) (Table I).
Western blot analysis confirmed that the two cancer
cell lines expressed IGF-1R (36),
with levels not notably affected by glucose concentration (Fig. 1A). IGF-1R levels appeared higher in
WiDr compared with SW620, as reported previously (36).
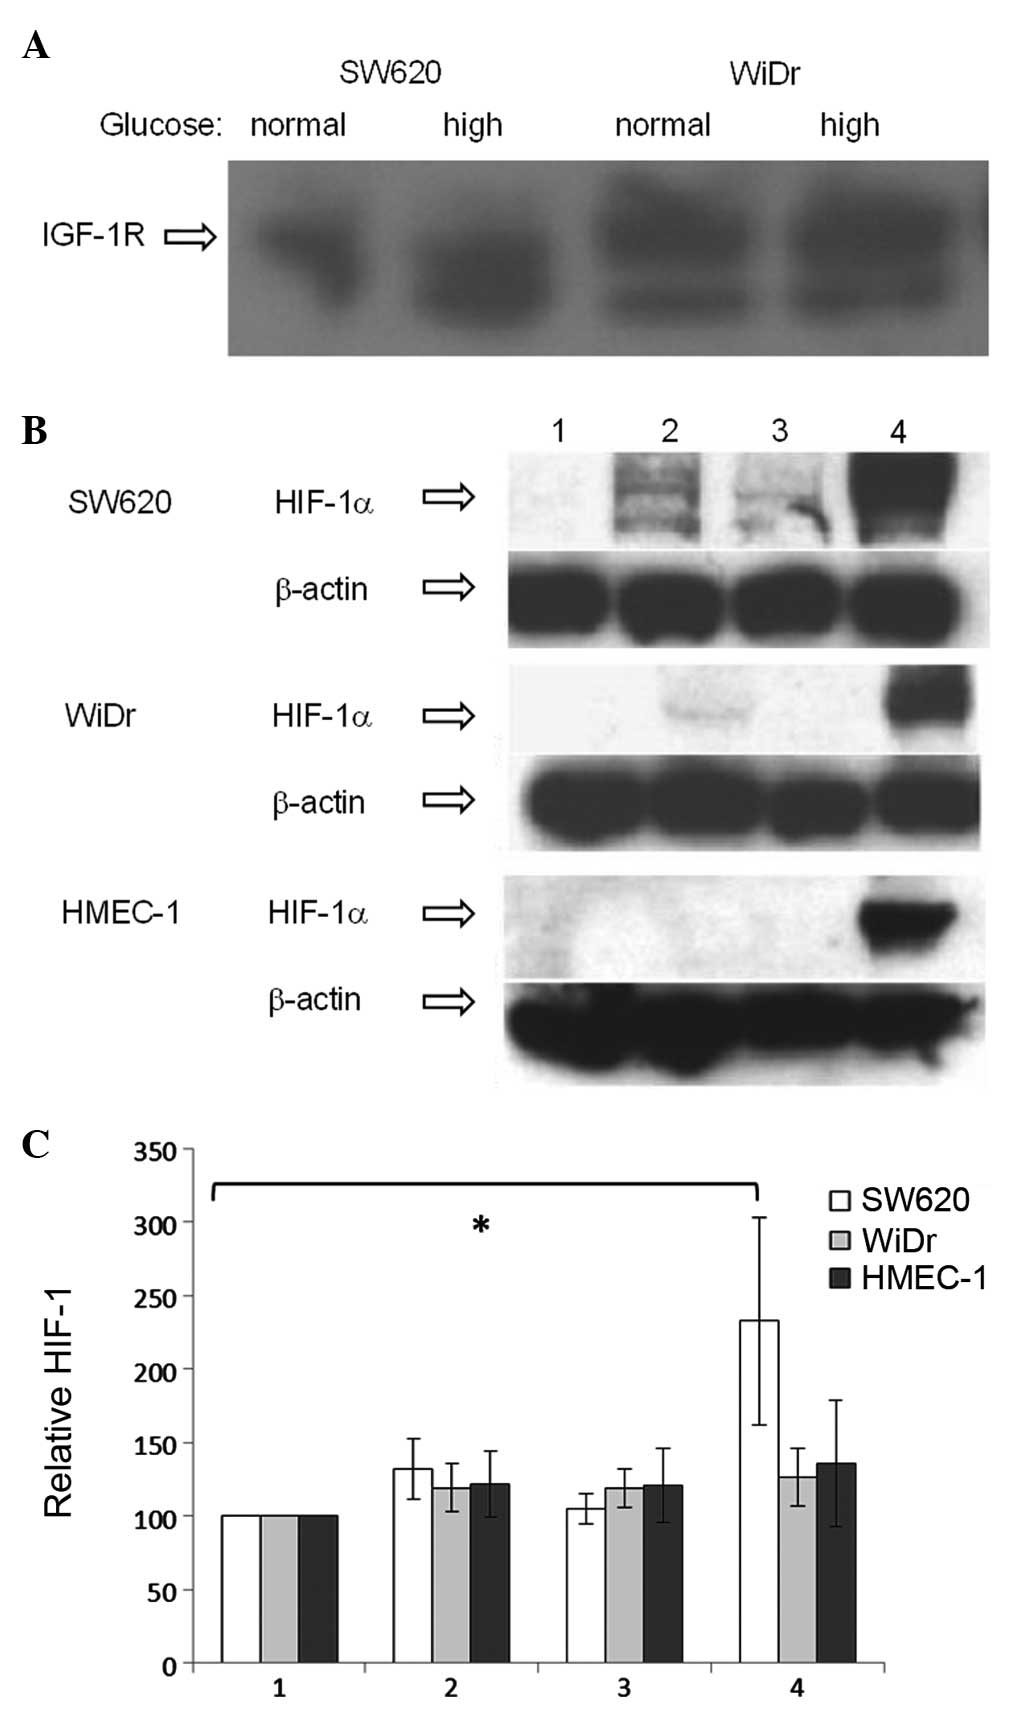 | Figure 1(A) Protein levels of IGF-1R in WiDr
and SW620 cells, as detected by western blot analysis. (B) Western
blot analysis of HIF-1α protein levels in nuclear fractions of
colon cancer cell lines (WiDr and SW620) and human microvascular
endothelial cells (HMEC-1) in response to IGF-1 (13 nM), insulin
(10 nM) or CoCl2 (100 μM). Protein loading, 40 μg/well;
HIF-1α band detected at ~120 kDa. Lane 1, untreated (negative
control); 2, IGF-1; 3, insulin; and 4, CoCl2 (positive
control). (C) Cell-based ELISA of HIF-1α protein levels in total
protein fraction in response to IGF-1 and insulin. Column 1,
untreated (negative control); 2, IGF-1; 3, insulin; and 4,
CoCl2 (positive control). HIF-1α levels were
standardized to untreated cells (100%). *P=0.031. IGF-1R,
insulin-like growth factor-1 receptor; HIF-1α, hypoxia-inducible
factor-1α; ELISA, enzyme-linked immunosorbent assay; HMEC-1, human
microvascular endothelial cells. |
Effect of IGF-1, insulin and glucose
concentrations on cellular response to chemotherapy
The concentrations of chemotherapy agents used in
the current study were within the clinically relevant ranges: 5-FU,
0.2–200 μM (maximum plasma concentration, 426 μM); oxaliplatin,
0.001–100 μM (maximum plasma concentration, 3.3 mM); and
irinotecan, 0.001–100 μM (maximum plasma concentration, 10 mM)
(37–42).
The mean IC50 and results of the t-tests
for each condition in all cell lines are presented in Table II. For the majority of cell lines,
no significant difference was identified in the concentrations of
drugs required to reduce IC50 between the growth
factor-treated and control cells. The duration of incubation with
growth factors did not consistently modify the drug response, nor
did the glucose concentration. Only one set of data demonstrated
significant differences; IGF-1-treated SW620 cells in high glucose
were more resistant to irinotecan treatment compared with the
controls (P=0.009). Treatment with irinotecan in the presence of
insulin under the same conditions showed a similar trend, although
a significant difference was not observed (P=0.096).
| Table IIComparison of IC50 values
of various chemotherapy drugs in WiDr, SW620 and HMEC-1 cells. |
Table II
Comparison of IC50 values
of various chemotherapy drugs in WiDr, SW620 and HMEC-1 cells.
| High glucose
DMEM | Normal glucose
DMEM |
|---|
|
|
|
|---|
| 5-FU | Oxaliplatin | Irinotecan | 5-FU | Oxaliplatin | Irinotecan |
|---|
|
|
|
|
|
|
|
|---|
| Parameter | No | IGF-1 | Insulin | No | IGF-1 | Insulin | No | IGF-1 | Insulin | No | IGF-1 | Insulin | No | IGF-1 | Insulin | No | IGF-1 | Insulin |
|---|
| Pretreatment, 24
h |
| WiDr |
| IC50,
μM | 200.00 | 146.30 | 145.40 | 37.17 | 9.58 | 4.94 | 17.58 | 11.11 | 13.99 | 114.39 | 200.00 | 139.41 | 70.07 | 77.83 | 41.09 | 15.1 | 19.32 | 16.70 |
| P-value | | 0.29 | 0.18 | | 0.17 | 0.17 | | 0.42 | 0.62 | | 0.26 | 0.78 | | 0.94 | 0.70 | | 0.60 | 0.54 |
| SW620 |
| IC50,
μM | 19.41 | 11.12 | 7.47 | 0.44 | 0.39 | 0.37 | 1.19 | 2.32 | 0.71 | 41.84 | 19.25 | 33.39 | 1.38 | 0.51 | 0.67 | 2.86 | 3.38 | 4.15 |
| P-value | | 0.21 | 0.15 | | 0.86 | 0.86 | | 0.42 | 0.58 | | 0.45 | 0.76 | | 0.32 | 0.40 | | 0.88 | 0.74 |
| HMEC-1 |
| IC50,
μM | 42.48 | 83.48 | 17.64 | 24.84 | 31.78 | 20.66 | 6.61 | 3.44 | 3.98 | 136.25 | 138.38 | 133.42 | 11.35 | 21.96 | 14.69 | 5.41 | 4.68 | 3.01 |
| P-value | | 0.54 | 0.32 | | 0.27 | 0.35 | | 0.35 | 0.44 | | 0.98 | 0.97 | | 0.46 | 0.56 | | 0.69 | 0.20 |
| Pretreatment, 4
h |
| WiDr |
| IC50,
μM | 144.72 | 131.62 | 156.61 | 14.40 | 3.33 | 9.14 | 14.03 | 10.49 | 13.47 | 166.68 | 194.02 | 117.84 | 45.44 | 25.91 | 20.51 | 16.02 | 16.92 | 14.60 |
| P-value | | 0.88 | 0.87 | | 0.35 | 0.62 | | 0.40 | 0.79 | | 0.5 | 0.42 | | 0.49 | 0.43 | | 0.85 | 0.61 |
| SW620 |
| IC50,
μM | 51.95 | 43.07 | 8.87 | 0.53 | 1.04 | 0.58 | 0.09 | 0.69 | 1.30 | 74.28 | 67.20 | 61.72 | 12.19 | 0.59 | 3.38 | 67.90 | 1.12 | 3.34 |
| P-value | | 0.86 | 0.40 | | 0.28 | 0.92 | | 0.01 | 0.10 | | 0.94 | 0.88 | | 0.38 | 0.53 | | 0.42 | 0.43 |
| HMEC-1 |
| IC50,
μM | 28.84 | 13.46 | 22.78 | 21.31 | 16.84 | 20.05 | 3.02 | 3.26 | 3.43 | 139.51 | 77.25 | 72.07 | 3.48 | 13.42 | 4.60 | 2.08 | 3.91 | 2.01 |
| P-value | | 0.16 | 0.57 | | 0.44 | 0.79 | | 0.87 | 0.49 | | 0.51 | 0.49 | | 0.16 | 0.80 | | 0.34 | 0.98 |
| Pretreatment, 0
h |
| WiDr |
| IC50,
μM | 162.58 | 138.73 | 139.19 | 28.56 | 9.05 | 7.94 | 12.08 | 12.76 | 9.59 | 156.15 | 106.05 | 156.15 | 73.15 | 14.77 | 11.90 | 18.42 | 16.91 | 11.99 |
| P-value | | 0.74 | 0.76 | | 0.54 | 0.52 | | 0.89 | 0.63 | | 0.45 | 0.48 | | 0.46 | 0.44 | | 0.66 | 0.11 |
| SW620 |
| IC50,
μM | 21.34 | 39.25 | 40.56 | 0.56 | 0.79 | 1.32 | 3.04 | 26.46 | 28.90 | 11.19 | 37.93 | 12.56 | 0.54 | 0.93 | 0.55 | 2.49 | 5.45 | 2.10 |
| P-value | | 0.61 | 0.56 | | 0.67 | 0.43 | | 0.41 | 0.43 | | 0.41 | 0.84 | | 0.26 | 0.96 | | 0.48 | 0.81 |
| HMEC-1 |
| IC50,
μM | 29.04 | 21.79 | 35.17 | 20.43 | 11.50 | 22.82 | 4.41 | 2.34 | 4.41 | 151.19 | 99.31 | 137.24 | 6.44 | 5.48 | 9.53 | 2.97 | 4.72 | 4.41 |
| P-value | | 0.43 | 0.59 | | 0.21 | 0.70 | | 0.21 | 1.00 | | 0.52 | 0.87 | | 0.83 | 0.59 | | 0.59 | 0.64 |
To compare entire response curves, as opposed to
single data points (IC50), a multivariable regression
model was developed (Table III).
As predicted, chemotherapy drug concentration exhibited a
significant effect on cell viability in all cases (P<0.001). In
the majority of cases, the presence or the duration of pretreatment
with growth factors, or the glucose concentration of the media did
not significantly change the chemoresponse.
| Table IIIMultivariable regression analysis of
viability in response to various treatment conditions. |
Table III
Multivariable regression analysis of
viability in response to various treatment conditions.
| WiDr | SW620 | HMEC-1 |
|---|
|
|
|
|
|---|
| High glucose
DMEM | Normal glucose
DMEM | High glucose
DMEM | Normal glucose
DMEM | High glucose
DMEM | Normal glucose
DMEM |
|---|
|
|
|
|
|
|
|
|---|
| Parameter | Drug | IGF-1 | Insulin | Drug | IGF-1 | Insulin | Drug | IGF-1 | Insulin | Drug | IGF-1 | Insulin | Drug | IGF-1 | Insulin | Drug | IGF-1 | Insulin |
|---|
| 5-FU |
| 24 h |
|
R2 | 0.581 | | | 0.617 | | | 0.794 | | | 0.761 | | | 0.753 | | | 0.513 | | |
| B | −12.22 | −12.553 | −31.381 | −20.081 | 71.588 | 8.719 | −10.82 | −6.325 | −12.622 | −14.976 | −0.433 | 2.13 | −12.578 | 1.5 | −14.571 | −8.327 | −0.356 | −10.786 |
| P-value |
<0.001 | 0.144 |
<0.001 |
<0.001 |
<0.001 | 0.542 |
<0.001 | 0.135 | 0.004 |
<0.001 | 0.945 | 0.734 |
<0.001 | 0.789 | 0.01 |
<0.001 | 0.955 | 0.088 |
| 4 h |
|
R2 | 0.543 | | | 0.796 | | | 0.442 | | | 0.268 | | | 0.841 | | | 0.513 | | |
| B | −10.45 | −7.15 | −1.72 | −19.332 | 45.551 | 7.633 | −18.843 | 7.483 | −35.412 | −20.218 | 20.657 | 16.618 | −12.158 | −10.881 | −4.618 | −6.392 | −5.099 | −12.119 |
| P-value |
<0.001 | 0.323 | 0.811 |
<0.001 |
<0.001 | 0.341 |
<0.001 | 0.663 | 0.042 |
<0.001 | 0.416 | 0.513 |
<0.001 | 0.008 | 0.25 |
<0.001 | 0.299 | 0.016 |
| 0 h |
|
R2 | 0.488 | | | 0.589 | | | 0.69 | | | 0.799 | | | 0.878 | | | 0.57 | | |
| B | −10.63 | 15.076 | −0.43 | −15.501 | −19.406 | −28.259 | −12.532 | 4.996 | 11.183 | −10.29 | 10.724 | 0.818 | −11.755 | −3.533 | 0.716 | −6.921 | −10.993 | −5.923 |
| P-value |
<0.001 | 0.078 | 0.959 |
<0.001 | 0.061 | 0.006 |
<0.001 | 0.432 | 0.082 |
<0.001 | 0.007 | 0.835 |
<0.001 | 0.284 | 0.827 |
<0.001 | 0.021 | 0.207 |
| Oxaliplatin |
| 24 h |
|
R2 | 0.74 | | | 0.586 | | | 0.823 | | | 0.835 | | | 0.953 | | | 0.799 | | |
| B | −8.65 | −4.03 | −15.98 | −13.796 | 58.84 | 12.797 | −9.218 | −2.779 | −7.768 | −11.521 | −10.129 | −6.099 | −0.023 | 0.117 | −0.086 | −0.025 | 0.305 | −0.1 |
| P-value |
<0.001 | 0.552 | 0.021 |
<0.001 | 0.001 | 0.439 |
<0.001 | 0.607 | 0.153 |
<0.001 | 0.133 | 0.362 |
<0.001 | 0.043 | 0.128 |
<0.001 | 0.038 | 0.489 |
| 4 h |
|
R2 | 0.851 | | | 0.792 | | | 0.715 | | | 0.536 | | | 0.949 | | | 0.814 | | |
| B | −8.86 | −8.043 | 5.36 | −13.144 | 40.668 | 9.011 | −12.64 | 12.225 | 0.835 | −15.765 | −18.702 | 4.921 | −0.025 | −0.087 | −0.009 | −0.023 | 0.111 | −0.069 |
| P-value |
<0.001 | 0.102 | 0.273 |
<0.001 |
<0.001 | 0.328 |
<0.001 | 0.243 | 0.936 |
<0.001 | 0.334 | 0.798 |
<0.001 | 0.181 | 0.891 |
<0.001 | 0.369 | 0.579 |
| 0 h |
|
R2 | 0.581 | | | 0.704 | | | 0.854 | | | 0.887 | | | 0.905 | | | 0.772 | | |
| B | −8.57 | 14.16 | −2.5 | −10.89 | −8.12 | −23.3 | −10.538 | 3.281 | 12.353 | −9.431 | 5.029 | 0.02 | −0.027 | −0.262 | 0.074 | −0.031 | 0.375 | 0.41 |
| P-value |
<0.001 | 0.146 | 0.769 |
<0.001 | 0.388 | 0.015 |
<0.001 | 0.566 | 0.034 |
<0.001 | 0.253 | 0.996 |
<0.001 | 0.011 | 0.465 |
<0.001 | 0.051 | 0.032 |
| Irinotecan |
| 24 h |
|
R2 | 0.832 | | | 0.793 | | | 0.78 | | | 0.749 | | | 0.843 | | | 0.555 | | |
| B | −0.043 | −0.089 | 0.074 | −0.062 | 0.315 | 0.072 | −8.417 | 3.646 | −6.583 | −8.786 | 5.782 | 3.273 | −0.069 | 0.037 | 0.088 | −0.04 | 0.422 | 0.362 |
| P-value |
<0.001 | 0.69 | 0.739 |
<0.001 | 0.115 | 0.711 |
<0.001 | 0.52 | 0.248 |
<0.001 | 0.383 | 0.621 |
<0.001 | 0.881 | 0.719 |
<0.001 | 0.181 | 0.254 |
| 4 h |
|
R2 | 0.914 | | | 0.808 | | | 0.707 | | | 0.493 | | | 0.869 | | | 0.681 | | |
| B | −0.046 | −0.239 | −0.066 | −0.065 | 0.083 | −0.022 | −9.722 | 20.874 | 22.045 | −12.972 | −12.462 | −2.064 | −0.073 | −0.146 | 0.148 | −0.033 | 0.115 | −0.168 |
| P-value |
<0.001 | 0.142 | 0.682 |
<0.001 | 0.659 | 0.906 |
<0.001 | 0.015 | 0.011 |
<0.001 | 0.468 | 0.904 |
<0.001 | 0.604 | 0.601 |
<0.001 | 0.574 | 0.415 |
| 0 h |
|
R2 | 0.885 | | | 0.854 | | | 0.694 | | | 0.838 | | | 0.924 | | | 0.572 | | |
| B | −0.047 | 0.014 | −0.108 | −0.052 | 0.029 | −0.297 | −8.829 | 12.802 | 19.176 | −7.507 | 7.323 | 0.014 | −0.108 | −0.337 | −0.013 | −0.037 | 0.174 | −0.027 |
| P-value |
<0.001 | 0.943 | 0.578 |
<0.001 | 0.281 | 0.611 |
<0.001 | 0.104 | 0.016 |
<0.001 | 0.097 | 0.997 |
<0.001 | 0.008 | 0.913 |
<0.001 | 0.475 | 0.915 |
Of the results that showed statistically significant
changes, the addition of IGF-1 to tumour cell lines increased the
resistance to chemotherapy: WiDr 5-FU in normal glucose at 24 h
(P<0.001) and 4 h (P<0.001); WiDr oxaliplatin in normal
glucose at 24 h (P<0.001) and 4 h (P<0.001); SW620 5-FU in
normal glucose at 0 h (P=0.007); and SW620 irinotecan in high
glucose at 4 h (P=0.015).
The addition of insulin to WiDr significantly
increased sensitivity to chemotherapy: 5-FU in high glucose at 24 h
(P<0.001) and in normal glucose at 0 h (P=0.006); and
oxaliplatin in high glucose at 24 h (P=0.021) and in normal glucose
at 0 h (P=0.015). In addition, insulin induced variable effects in
the SW620 cells, such as increased sensitivity; 5-FU in high
glucose at 24 h (P=0.004) and 4 h (P=0.042), and increased
resistance; oxaliplatin in high glucose at 0 h (P=0.034) and
irinotecan in high glucose at 4 h (P=0.011) and 0 h (P=0.016).
The impact of growth factors in the HMEC-1
endothelial cell line on the chemoresponse was variable; IGF-1 in
high glucose marginally increased resistance (oxaliplatin at 24 h,
P=0.043), but also sensitivity (5-FU at 4 h, P=0.008; oxaliplatin
at 0 h, P=0.011; and irinotecan at 0 h, P=0.008). In normal glucose
IGF-1 increased 5-FU sensitivity (0 h, P=0.021), but marginally
decreased sensitivity to oxaliplatin (24 h, P=0.038). Insulin
increased sensitivity (5-FU in high glucose at 24 h, P=0.01; and in
normal glucose at 4 h, P=0.016), but also resistance slightly
(oxaliplatin in normal glucose at 0 h, P=0.032).
Effect of ULDs of chemotherapy on cell
viability
WiDr cells showed significantly increased viability
when treated with ULDs (defined as 1/1,000 of IC50) of
chemotherapy in normal glucose conditions with IGF-1, ranging
between 182% (oxaliplatin at 4 h, P=0.003) and 240% (5-FU at 4 h,
P=0.018), compared with WiDr in normal glucose without growth
factors or chemotherapy (viability, 100%) (Table IV). Similar trends were observed at
24 h; WiDr viability in normal glucose with IGF-1 increased to 195%
with ULDs of oxaliplatin (P=0.082) and to 283% with ULDs of 5-FU
(P=0.088). The viability of cells at ULDs was calculated from the
equations obtained by model fitting, and the values were used to
compare the effect of growth factors on the cellular response to
chemotherapy. No significant differences were identified in ULD
response between growth factor-treated and control cells under high
glucose conditions or insulin, and this effect was not observed in
the SW620 or HMEC-1 cells.
| Table IVComparison of ULD effects of various
chemotherapy drugs in WiDr, SW620 and HMEC-1 cells. |
Table IV
Comparison of ULD effects of various
chemotherapy drugs in WiDr, SW620 and HMEC-1 cells.
| High glucose
DMEM | Normal glucose
DMEM |
|---|
|
|
|
|---|
| 5-FU | Oxaliplatin | Irinotecan | 5-FU | Oxaliplatin | Irinotecan |
|---|
|
|
|
|
|
|
|
|---|
| Parameter | No | IGF-1 | Insulin | No | IGF-1 | Insulin | No | IGF-1 | Insulin | No | IGF-1 | Insulin | No | IGF-1 | Insulin | No | IGF-1 | Insulin |
|---|
| Pretreatment 24
h | | | | | | | | | | | | | | | | | | |
| WiDr |
| ULD, %
viability | 158.17 | 168.8 | 125.46 | 103.76 | 125.05 | 105.41 | 90.36 | 109.5 | 89.22 | 149.58 | 283.39 | 176.06 | 114.75 | 194.54 | 131.1 | 102.72 | 181.35 | 117.53 |
| P-value | | 0.804 | 0.17 | | 0.271 | 0.894 | | 0.378 | 0.927 | | 0.088 | 0.461 | | 0.082 | 0.436 | | 0.43 | 0.414 |
| SW620 |
| ULD, %
viability | 122.42 | 139.86 | 111.91 | 113.38 | 122.15 | 102.32 | 105.83 | 119.95 | 98.59 | 182.65 | 146.21 | 164.41 | 123.79 | 129.72 | 135.22 | 93.65 | 121.95 | 116.43 |
| P-value | | 0.338 | 0.641 | | 0.251 | 0.558 | | 0.112 | 0.658 | | 0.324 | 0.693 | | 0.704 | 0.691 | | 0.128 | 0.341 |
| HMEC-1 |
| ULD, %
viability | 147.85 | 144.61 | 117.25 | 91.98 | 94.92 | 78.18 | 89.53 | 102.14 | 71.14 | 118.89 | 122.22 | 107.01 | 75.01 | 92.94 | 72.21 | 61.48 | 87.38 | 71.11 |
| P-value | | 0.889 | 0.228 | | 0.795 | 0.152 | | 0.4 | 0.136 | | 0.862 | 0.619 | | 0.448 | 0.787 | | 0.447 | 0.724 |
| Pretreatment 4
h |
| WiDr |
| ULD, %
viability | 127.37 | 132.37 | 135.44 | 102.25 | 113.3 | 118.13 | 91.07 | 83.81 | 94.34 | 144.82 | 239.52 | 182.69 | 104.38 | 181.73 | 134.42 | 107.06 | 132.64 | 107.58 |
| P-value | | 0.83 | 0.747 | | 0.224 | 0.17 | | 0.598 | 0.699 | | 0.018 | 0.232 | | 0.003 | 0.078 | | 0.423 | 0.972 |
| SW620 |
| ULD, %
viability | 191.21 | 232.28 | 117 | 135.51 | 164.54 | 111.75 | 103.67 | 144.75 | 102.83 | 146.65 | 221.37 | 208.63 | 125.87 | 189.04 | 161.85 | 109.53 | 170.64 | 140.75 |
| P-value | | 0.711 | 0.378 | | 0.5 | 0.403 | | 0.226 | 0.946 | | 0.516 | 0.561 | | 0.421 | 0.526 | | 0.432 | 0.573 |
| HMEC-1 |
| ULD, %
viability | 141.66 | 131.75 | 128.54 | 85.62 | 74.83 | 80.42 | 81.2 | 69.32 | 76.69 | 100.87 | 106.02 | 94.57 | 58.83 | 68.49 | 54.94 | 60.45 | 63.28 | 58.62 |
| P-value | | 0.507 | 0.311 | | 0.226 | 0.478 | | 0.872 | 0.761 | | 0.796 | 0.784 | | 0.458 | 0.768 | | 0.861 | 0.921 |
| Pretreatment 0
h |
| WiDr |
| ULD, %
viability | 117.1 | 157.06 | 123.6 | 93.93 | 132.27 | 101.42 | 90.68 | 100.67 | 78.24 | 173.63 | 170.8 | 145.77 | 127.95 | 135.3 | 116.12 | 131.87 | 116.16 | 91.93 |
| P-value | | 0.249 | 0.782 | | 0.299 | 0.525 | | 0.737 | 0.551 | | 0.953 | 0.526 | | 0.731 | 0.567 | | 0.594 | 0.203 |
| SW620 |
| ULD, %
viability | 121.4 | 136.46 | 151.84 | 112.97 | 124.57 | 73.96 | 100.79 | 113.19 | 119.05 | 119 | 127.38 | 119.01 | 111.46 | 121.38 | 112.61 | 96.44 | 108.8 | 100.36 |
| P-value | | 0.361 | 0.199 | | 0.371 | 0.555 | | 0.107 | 0.089 | | 0.453 | 0.999 | | 0.263 | 0.697 | | 0.101 | 0.357 |
| HMEC-1 |
| ULD, %
viability | 131.97 | 136.21 | 125.41 | 82.43 | 71.37 | 85.95 | 93.89 | 72.49 | 85.04 | 102.84 | 105.13 | 96 | 68.06 | 63.88 | 63.32 | 65.46 | 75.61 | 74.85 |
| P-value | | 0.646 | 0.35 | | 0.27 | 0.56 | | 0.244 | 0.195 | | 0.938 | 0.816 | | 0.846 | 0.812 | | 0.705 | 0.696 |
Effect of IGF-1 and insulin on HIF-1α
protein levels
Western blot analysis of the nuclear protein
fractions of SW620, WiDr and HMEC-1 showed extremely low or
undetectable basal levels of HIF-1α protein (Fig. 1B). As predicted, a marked increase
in HIF-1α protein was observed in all cell lines in response to
CoCl2, an agent used as a positive control as it
interferes with HIF-1 degradation (31). An increase in HIF-1α protein levels
in response to IGF-1 and insulin treatment was observed in the
SW620 cells, with a weaker increase due to IGF-1 and no increase
due to insulin in the WiDr cells. No visible changes from the basal
HIF-1α protein levels in response to IGF-1 or insulin were observed
in HMEC-1.
The effect of IGF-1 and insulin on total HIF-1α
protein levels was further quantified using a cell-based
immunoassay, with basal levels defined as 100% (Fig. 1C). An increase in HIF-1α protein
levels was observed in all 3 cell lines in response to
CoCl2 [SW620, 233% (P=0.031); WiDr, 126%; and HMEC-1,
136%]. HIF-1α protein levels appeared to be increased in response
to IGF-1 in SW620 (132%; P=0.057) and to insulin and IGF-1 in WiDr
(insulin, 119%; and IGF-1, 119%) and HMEC-1 (insulin, 121%; and
IGF-1, 121%) cell lines, but the increases were not statistically
significant.
Discussion
The present study demonstrated that the
obesity-related conditions of elevated glucose, insulin and IGF-1
levels may increase cell viability and in selected cases,
resistance to chemotherapy and accumulation of the global
transcription factor, HIF-1. The effect became clearer when the
total survival pattern of the cells was analysed in a multivariable
regression model, instead of analysing single points
(IC50). Notably, however, a specific induction of cell
viability by the combination of obesity-related factors and ULD
chemotherapy (0.2 μM 5-FU and 0.04 μM oxaliplatin) was identified.
This observation deserves further investigation, since the plasma
levels of 5-FU in patients with colorectal cancer stay at 0.01–1 μM
for several days following bolus administration (37). Similarly, platinum concentrations
stay at >3 μM (1/1,000 of its maximum plasma concentration) for
over 500 h following oxaliplatin infusion (38). In addition, extremely low doses of
chemotherapy are more likely to circulate in obese cancer patients
where under-dosing or capped dosing is common (43). The under-dosing of obese colorectal
cancer patients has been shown to result in reduced
progression-free and overall survival rates (44).
In WiDr, a significant effect of growth factors was
observed more often in normal glucose conditions. By contrast,
significant effects in SW620 were mainly observed in high glucose
conditions, whereas in HMEC-1, the results did not differ according
to glucose concentration. These results indicate that different
types of colorectal cancer and stromal cells may vary in their
dependence on glucose levels and the insulin/IGF axis, particularly
when treated with chemotherapy. This may be associated with the
particular metabolic pathways each cancer depends on and may be
elucidated further using genetic and proteomic studies.
The results of the multivariable regression analysis
from the current study are consistent with certain previously
published studies, which have shown a chemosensitivity-promoting
effect of insulin (5,45,46)
and IGF-1 (47,48), although the effects varied with the
cell line. Insulin is likely to act via growth promotion (49) and IGF-1 through the inhibition of
apoptosis (50), via the
phosphatidylinositol 3-kinase/Akt and mitogen-activated protein
kinase/p38 signalling pathways (51).
Hypoxia has been shown to increase drug resistance
(24), but the results of the
present study show that HIF-1 is unlikely to be the main mechanism
underlying IGF-1- and insulin-mediated drug response, as increases
in HIF-1 levels were not associated with changes in the
chemoresponse. However, the present results confirmed those of
previous studies, which demonstrated that insulin, IGF-1 and high
glucose levels regulate HIF-1α (27,52).
The present study showed only a marginal impact of
the prevailing glucose and insulin/IGF-1 environment on the
chemotherapy response in colorectal cells in vitro, at
clinically relevant 5-FU, oxaliplatin and irinotecan
concentrations. However, there was evidence of a proliferative
effect on WiDr cells at extremely low concentrations of 5-FU and
oxaliplatin, alone or with IGF-1, as may occur in obesity. These
in vitro results may have clinical implications in Western
societies with increasing rates of obesity and colorectal cancer
and the frequent under-dosing of obese cancer patients.
Acknowledgements
The authors would like to thank the funding agencies
Genesis Oncology Trust (Bruce Blue Award, GUD) and the Tertiary
Education Commission (Top Achiever Doctoral Scholarship, EV) for
their generous contributions.
References
|
1
|
Siegel R, DeSantis C, Virgo K, et al:
Cancer treatment and survivorship statistics, 2012. CA Cancer J
Clin. 62:220–241. 2012. View Article : Google Scholar : PubMed/NCBI
|
|
2
|
Lucas AS, O’Neil BH and Goldberg RM: A
decade of advances in cytotoxic chemotherapy for metastatic
colorectal cancer. Clin Colorectal Cancer. 10:238–244. 2011.
View Article : Google Scholar : PubMed/NCBI
|
|
3
|
Dallas NA, Xia L, Fan F, et al:
Chemoresistant colorectal cancer cells, the cancer stem cell
phenotype, and increased sensitivity to insulin-like growth
factor-I receptor inhibition. Cancer Res. 69:1951–1957. 2009.
View Article : Google Scholar
|
|
4
|
Aschele C, Bergamo F and Lonardi S:
Chemotherapy for operable and advanced colorectal cancer. Cancer
Treat Rev. 35:509–516. 2009. View Article : Google Scholar : PubMed/NCBI
|
|
5
|
Zou K, Ju J and Xie H: Pretreatment with
insulin enhances anticancer functions of 5-fluorouracil in human
esophageal and colonic cancer cells. Acta Pharmacol Sin.
28:721–730. 2007. View Article : Google Scholar
|
|
6
|
Graham J, Muhsin M and Kirkpatrick P:
Oxaliplatin. Nat Rev Drug Discov. 3:11–12. 2004. View Article : Google Scholar
|
|
7
|
Armand JP, Ducreux M, Mahjoubi M, et al:
CPT-11 (Irinotecan) in the treatment of colorectal cancer. Eur J
Cancer. 31A:1283–1287. 1995. View Article : Google Scholar : PubMed/NCBI
|
|
8
|
Calle EE, Rodriguez C, Walker-Thurmond K
and Thun MJ: Overweight, obesity, and mortality from cancer in a
prospectively studied cohort of U.S. adults. N Engl J Med.
348:1625–1638. 2003. View Article : Google Scholar
|
|
9
|
Moghaddam AA, Woodward M and Huxley R:
Obesity and risk of colorectal cacner: a meta-analysis of 31
studies with 70,000 events. Cancer Epidemiol Biomarkers Prev.
16:2533–2547. 2007. View Article : Google Scholar : PubMed/NCBI
|
|
10
|
Renehan AG, Tyson M, Egger M, Heller RF
and Zwahlen M: Body-mass index and incidence of cancer: a
systematic review and meta-analysis of prospective observational
studies. Lancet. 371:569–578. 2008. View Article : Google Scholar : PubMed/NCBI
|
|
11
|
Campbell PT, Newton CC, Dehal AN, Jacobs
EJ, Patel AV and Gapstur SM: Impact of body mass index on survival
after colorectal cancer diagnosis: the Cancer Prevention Study-II
Nutrition Cohort. J Clin Oncol. 30:42–52. 2012. View Article : Google Scholar
|
|
12
|
Simkens LH, Koopman M, Mol L, et al:
Influence of body mass index on outcome in advanced colorectal
cancer patients receiving chemotherapy with or without targeted
therapy. Eur J Cancer. 47:2560–2567. 2011. View Article : Google Scholar
|
|
13
|
Meyerhardt JA, Niedzwiecki D, Hollis D, et
al: Impact of body mass index and weight change after treatment on
cancer recurrence and survival in patients with stage III colon
cancer: findings from Cancer and Leukemia Group B 89803. J Clin
Oncol. 26:4109–4115. 2008. View Article : Google Scholar
|
|
14
|
Griggs JJ and Sabel MS: Obesity and cancer
treatment: weighing the evidence. J Clin Oncol. 26:4060–4062. 2008.
View Article : Google Scholar : PubMed/NCBI
|
|
15
|
Litton JK, Gonzalez-Angulo AM, Warneke CL,
et al: Relationship between obesity and pathologic response to
neoadjuvant chemotherapy among women with operable breast cancer. J
Clin Oncol. 26:4072–4077. 2008. View Article : Google Scholar
|
|
16
|
Pollak M: Insulin and insulin-like growth
factor signalling in neoplasia. Nat Rev Cancer. 8:915–928. 2008.
View Article : Google Scholar : PubMed/NCBI
|
|
17
|
Ahmed RL, Thomas W and Schmitz KH:
Interactions between insulin, body fat, and insulin-like growth
factor axis proteins. Cancer Epidemiol Biomarkers Prev. 16:593–597.
2007. View Article : Google Scholar : PubMed/NCBI
|
|
18
|
Biddinger SB and Kahn CR: From mice to
men: insights into the insulin resistance syndromes. Annu Rev
Physiol. 68:123–158. 2006. View Article : Google Scholar : PubMed/NCBI
|
|
19
|
Renehan AG, Frystyk J and Flyvbjerg A:
Obesity and cancer risk: the role of the insulin-IGF axis. Trends
Endocrinol Metab. 17:328–336. 2006. View Article : Google Scholar : PubMed/NCBI
|
|
20
|
Chen J, Katsifis A, Hu C and Huang XF:
Insulin decreases therapeutic efficacy in colon cancer cell line
HT29 via the activation of the PI3K/Akt pathway. Curr Drug Discov
Technol. 8:119–125. 2011. View Article : Google Scholar
|
|
21
|
Adachi Y, Lee CT, Coffee K, et al: Effects
of genetic blockade of the insulin-like growth factor receptor in
human colon cancer cell lines. Gastroenterology. 123:1191–1204.
2002. View Article : Google Scholar : PubMed/NCBI
|
|
22
|
Gooch JL, Van Den Berg CL and Yee D:
Insulin-like growth factor (IGF)-1 rescues breast cancer cells from
chemotherapy-induced cell death - proliferative and anti-apoptotic
effects. Breast Cancer Res Treat. 56:1–10. 1999. View Article : Google Scholar : PubMed/NCBI
|
|
23
|
Perer ES, Madan AK, Shurin A, et al:
Insulin-like growth factor I receptor antagonism augments response
to chemoradiation therapy in colon cancer cells. J Surg Res.
94:1–5. 2000. View Article : Google Scholar
|
|
24
|
Roberts DL, Williams KJ, Cowen RL, et al:
Contribution of HIF-1 and drug penetrance to oxaliplatin resistance
in hypoxic colorectal cancer cells. Br J Cancer. 101:1290–1297.
2009. View Article : Google Scholar : PubMed/NCBI
|
|
25
|
Mole DR and Ratcliffe PJ: Cellular oxygen
sensing in health and disease. Pediatr Nephrol. 23:681–694. 2008.
View Article : Google Scholar : PubMed/NCBI
|
|
26
|
Fukuda R, Hirota K, Fan F, Jung YD, Ellis
LM and Semenza GL: Insulin-like growth factor 1 induces
hypoxia-inducible factor 1-mediated vascular endothelial growth
factor expression, which is dependent on MAP kinase and
phosphatidylinositol 3-kinase signaling in colon cancer cells. J
Biol Chem. 277:38205–38211. 2002. View Article : Google Scholar
|
|
27
|
Doronzo G, Russo I, Mattiello L, Riganti
C, Anfossi G and Trovati M: Insulin activates hypoxia-inducible
factor-1alpha in human and rat vascular smooth muscle cells via
phosphatidylinositol-3 kinase and mitogen-activated protein kinase
pathways: impairment in insulin resistance owing to defects in
insulin signalling. Diabetologia. 49:1049–1063. 2006. View Article : Google Scholar
|
|
28
|
Ades EW, Candal FJ, Swerlick RA, George
VG, Summers S, Bosse DC and Lawley TJ: HMEC-1: establishment of an
immortalized human microvascular endothelial cell line. J Invest
Dermatol. 99:683–690. 1992. View Article : Google Scholar : PubMed/NCBI
|
|
29
|
Mosmann T: Rapid colorimetric assay for
cellular growth and survival: application to proliferation and
cytotoxicity assays. J Immunol Methods. 65:55–63. 1983. View Article : Google Scholar : PubMed/NCBI
|
|
30
|
Wang P, Henning SM and Heber D:
Limitations of MTT and MTS-based assays for measurement of
antiproliferative activity of green tea polyphenols. PLoS One.
5:e102022010. View Article : Google Scholar : PubMed/NCBI
|
|
31
|
Dachs GU, Steele AJ, Coralli C, et al:
Anti-vascular agent Combretastatin A-4-P modulates hypoxia
inducible factor-1 and gene expression. BMC Cancer. 6:2802006.
View Article : Google Scholar : PubMed/NCBI
|
|
32
|
American Diabetes Association. Diagnosis
and classification of diabetes mellitus. Diabetes Care. 35(Suppl
1): S64–S71. 2012. View Article : Google Scholar
|
|
33
|
Bartrons R and Caro J: Hypoxia, glucose
metabolism and the Warburg’s effect. J Bioenerg Biomembr.
39:223–229. 2007.
|
|
34
|
Costa A, Rios M, Casamitjana R, Gomis R
and Conget I: High prevalence of abnormal glucose tolerance and
metabolic disturbances in first degree relatives of NIDDM patients.
A study in Catalonia, a mediterranean community. Diabetes Res Clin
Pract. 41:191–196. 1998. View Article : Google Scholar
|
|
35
|
Kajantie E, Fall CH, Seppälä M, et al:
Serum insulin-like growth factor (IGF)-I and IGF-binding protein-1
in elderly people: relationships with cardiovascular risk factors,
body composition, size at birth, and childhood growth. J Clin
Endocrinol Metab. 88:1059–1065. 2003. View Article : Google Scholar
|
|
36
|
Lahm H, Amstad P, Wyniger J, Yilmaz A,
Fischer JR, Schreyer M and Givel JC: Blockade of the insulin-like
growth-factor-I receptor inhibits growth of human colorectal cancer
cells: evidence of a functional IGF-II-mediated autocrine loop. Int
J Cancer. 58:452–459. 1994. View Article : Google Scholar : PubMed/NCBI
|
|
37
|
Bocci G, Danesi R, Di Paolo AD, et al:
Comparative pharmacokinetic analysis of 5-fluorouracil and its
major metabolite 5-fluoro-5,6-dihydrouracil after conventional and
reduced test dose in cancer patients. Clin Cancer Res. 6:3032–3037.
2000.
|
|
38
|
Morrison JG, White P, McDougall S, et al:
Validation of a highly sensitive ICP-MS method for the
determination of platinum in biofluids: application to clinical
pharmacokinetic studies with oxaliplatin. J Pharm Biomed Anal.
24:1–10. 2000. View Article : Google Scholar : PubMed/NCBI
|
|
39
|
Casale F, Canaparo R, Serpe L, Muntoni E,
Pepa CD, Costa M, Mairone L, Zara GP, Fornari G and Eandi M: Plasma
concentrations of 5-fluorouracil and its metabolites in colon
cancer patients. Pharmacol Res. 50:173–179. 2004. View Article : Google Scholar : PubMed/NCBI
|
|
40
|
Kjellström J, Kjellén E and Johnsson A: In
vitro radiosensitization by oxaliplatin and 5-fluorouracil in a
human colon cancer cell line. Acta Oncol. 44:687–693.
2005.PubMed/NCBI
|
|
41
|
Takimoto CH, Morrison G, Harold N, et al:
Phase I and pharmacologic study of irinotecan administered as a
96-hour infusion weekly to adult cancer patients. J Clin Oncol.
18:659–667. 2000.
|
|
42
|
Tobin PJ, Beale P, Noney L, et al: A pilot
study on the safety of combining chrysin, a non-absorbable inducer
of UGT1A1, and irinotecan (CPT-11) to treat metastatic colorectal
cancer. Cancer Chemother Pharmacol. 57:309–316. 2006. View Article : Google Scholar
|
|
43
|
Hunter RJ, Navo MA, Thaker PH, Bodurka DC,
Wolf JK and Smith JA: Dosing chemotherapy in obese patients: actual
versus assigned body surface area (BSA). Cancer Treat Rev.
35:69–78. 2009. View Article : Google Scholar
|
|
44
|
Chambers P, Daniels SH, Thompson LC and
Stephens RJ: Chemotherapy dose reductions in obese patients with
colorectal cancer. Ann Oncol. 23:748–753. 2012. View Article : Google Scholar : PubMed/NCBI
|
|
45
|
Ayre SG, Garcia y Bellon DP and Garcia DP
Jr: Insulin, chemotherapy, and the mechanisms of malignancy: the
design and the demise of cancer. Med Hypotheses. 55:330–334. 2000.
View Article : Google Scholar : PubMed/NCBI
|
|
46
|
Damyanov C, Radoslavova M, Gavrilov V and
Stoeva D: Low dose chemotherapy in combination with insulin for the
treatment of advanced metastatic tumors. Preliminary experience. J
BUON. 14:711–715. 2009.PubMed/NCBI
|
|
47
|
Min Y, Adachi Y, Yamamoto H, et al:
Insulin-like growth factor I receptor blockade enhances
chemotherapy and radiation responses and inhibits tumour growth in
human gastric cancer xenografts. Gut. 54:591–600. 2005. View Article : Google Scholar
|
|
48
|
Warshamana-Greene GS, Litz J, Buchdunger
E, Garcia-Echeverria C, Hofmann F and Krystal GW: The insulin-like
growth factor-I receptor kinase inhibitor, NVP-ADW742, sensitizes
small cell lung cancer cell lines to the effects of chemotherapy.
Clin Cancer Res. 11:1563–1571. 2005. View Article : Google Scholar : PubMed/NCBI
|
|
49
|
Desbois-Mouthon C, Cadoret A, Blivet-Van
Eggelpoël MJ, et al: Insulin-mediated cell proliferation and
survival involve inhibition of c-Jun N-terminal kinases through a
phosphatidylinositol 3-kinase- and mitogen-activated protein kinase
phosphatase-1-dependent pathway. Endocrinology. 141:922–931.
2000.
|
|
50
|
Hopkins A, Crowe PJ and Yang JL: Effect of
type 1 insulin-like growth factor receptor targeted therapy on
chemotherapy in human cancer and the mechanisms involved. J Cancer
Res Clin Oncol. 136:639–650. 2010. View Article : Google Scholar : PubMed/NCBI
|
|
51
|
Sung MK, Yeon JY, Park SY, Park JH and
Choi MS: Obesity-induced metabolic stresses in breast and colon
cancer. Ann NY Acad Sci. 1229:61–68. 2011. View Article : Google Scholar : PubMed/NCBI
|
|
52
|
Scharte M, Jurk K, Kehrel B, Zarbock A,
Van Aken H and Singbartl K: IL-4 enhances hypoxia induced
HIF-1alpha protein levels in human transformed intestinal cells.
FEBS Lett. 580:6399–6404. 2006. View Article : Google Scholar : PubMed/NCBI
|
|
53
|
Ikediobi ON, Davies H, Bignell G, et al:
Mutation analysis of 24 known cancer genes in the NCI-60 cell line
set. Mol Cancer Ther. 5:2606–2612. 2006. View Article : Google Scholar : PubMed/NCBI
|
|
54
|
Spitzner M, Emons G, Kramer F, et al: A
gene expression signature for chemoradiosensitivity of colorectal
cancer cells. Int J Radiat Oncol Biol Phys. 78:1184–1192. 2010.
View Article : Google Scholar : PubMed/NCBI
|


