Introduction
Pituitary adenomas, accounting for ~15% of all
diagnosed intracranial tumors, are benign monoclonal adenomas that
originate from cells of the anterior pituitary gland (1). Surgical resection, with or without
adjuvant radiotherapy, is always the first line of treatment for
the majority of pituitary adenomas, with the exception of
prolactinomas (2). However, these
treatments cannot usually control invasive pituitary adenomas due
to the limited understanding of the underlying molecular
mechanisms. Thereby, further research into the tumorigenesis will
contribute to identifying novel therapeutic targets, which will be
conductive to the development of novel therapeutic approaches for
pituitary adenomas.
In past years, considerable progress has been made
in identifying the key players in pituitary adenomas. A previous
study has shown that the phosphoinositide 3-kinase/AKT signaling
pathway is activated and enhanced in pituitary adenomas, which may
be due to the mutation and amplification of an oncogene,
PIK3CA (3). Mutation in
another oncogene, GNAS, which encodes the guanine
nucleotide-activating α subunit has also been suggested to be
involved in pituitary hyperplasia (4). Meanwhile, a tumor suppressor aryl
hydrocarbon receptor-interacting protein has been demonstrated to
function in modulating cellular signaling and cAMP signaling
pathways via regulation of the localization of the aryl hydrocarbon
receptor (5). Also, the absence of
expression of another two tumor suppressors, growth arrest and
DNA-damage-inducible β (GADD45β) and γ (GADD45γ), has been observed
in human pituitary adenomas (6,7). Aberrant
methylation of a number of genes, such as DAPK (8) and FGFR2 (9) has been confirmed to have a momentous
role in pituitary tumorigenesis. Additionally, certain cell cycle
regulators, such as p16, p21, p27, cyclin D1 and cyclin E, have
also been demonstrated to function in pituitary tumorigenesis
(8,10). Recently, certain microRNAs (miRNA/miR)
have been found to be crucial in pituitary adenomas. For instance,
the expression levels of miR-431 and miR-770-5p have been found to
be slightly higher in non-functioning pituitary adenomas compared
to their levels in the normal pituitary gland (11). Recently, another study has shown that
miRNA-dependent impairment of the HMGA/E2F1 pathway functions as
pro-oncogene signaling in pituitary adenomas. Several miRNAs
targeting HMGA2 (miR-326, miR-570 and miR-432) or
E2F1 (miR-326 and miR-603) could inhibit the growth of
pituitary cell lines (HP75 and GH3) (12).
Lee et al demonstrated that gonadotroph
adenomas in MENX-affected rats closely resemble their human
counterparts (13). The study further
found that CYP11A1 and NUSAP1, two commonly
dysregulated differentially-expressed genes (DEGs) in the
gonadotroph adenomas of rats and humans, are upregulated in 77 and
95% of human gonadotroph adenomas, respectively. Using the
microarray data deposited by Lee et al, the present study
aimed to further identify genes that were differentially expressed
between pituitary adenomas samples and normal controls. Following
Gene Ontology (GO) functional and pathway enrichment analysis of
the screened DEGs, Protein-Protein Interaction (PPI) networks were
constructed for the up- and downregulated DEGs, respectively, in
order to learn more about the interaction of proteins encoded by
DEGs, which may aid in our understanding of the molecular
mechanisms of pituitary adenomas. The results are expected to
assist in elucidating the etiology of pituitary adenomas, and
provide novel insights for the clinical diagnosis of this
disease.
Materials and methods
Affymetrix microarray data
The gene expression profile data of GSE23207
(13) were acquired from Gene
Expression Omnibus (GEO; http://www.ncbi.nlm.nih.gov/geo/), which was based on
the platform of the GPL6247 [RaGene-1_0-st] Affymetrix Rat Gene 1.0
ST Array. This dataset contains 16 samples of pituitary homozygous
mutants (p27Kip1/Cdknb1) from MENX-associated rats, aged 7–8
months, with large tumors 1–2 mm in size, and 5 samples of normal
pituitary tissues purchased from BioChain Inc. (Hayward, CA,
USA).
Data preprocessing and screening of
DEGs
CEL files and probe annotation files were
downloaded, and the gene expression data of all the samples were
preprocessed via the Robust Multichip Averaging background
correction (14), quantile
normalization and probe summarization methods using the Oligo
package (15). The Linear Models for
Microarray Data package (16) of R
was used for the identification of genes that were significantly
differentially expressed in pituitary adenomas samples. The raw
P-value was adjusted by the Benjamin and Hochberg method (17), and only the genes meeting the cut-off
criteria of a |log2fold change (FC)| of >1 and an
adjusted P-value of <0.05 were selected as DEGs.
GO and pathway enrichment
analysis
The Database for Annotation, Visualization and
Integrated Discovery (DAVID) gene functional classification tool
now provides a comprehensive set of novel and powerful tools for
researchers to understand the biological meaning behind abundant
genes (18). Pathway enrichment
analysis was conducted to identify the significant metabolic
pathways for the DEGs (19).
P<0.05 and a count number of >2 were used as the cut-off
criteria for GO and Kyoto Encyclopedia of Genes and Genomes (KEGG)
pathway enrichment analyses by DAVID.
PPI network construction
The Search Tool for the Retrieval of Interacting
Genes database was used to analyze the PPIs for DEGs by calculating
the combined scores (20), and a
score >0.4 was chosen as the cut-off. Next, PPI networks for up-
and downregulated DEGs were visualized using Cytoscape (http://cytoscape.org/) (21). The highly connected nodes (hub
proteins) were detected by calculating the degree of each node
protein based on the scale-free property of interaction networks
(22).
Results
Identification of DEGs
Based on the cut-off criteria, a total of 629 DEGs
were screened from the pituitary adenomas samples, including 391
upregulated and 238 downregulated DEGs.
Enrichment analysis of up- and
downregulated DEGs
According to GO functional annotation, the
upregulated DEGs were mainly enriched in GO terms associated with
the cell cycle and cell division. For example, DEGs such as
CCNA2, NUSAP1, CCNB1, CENPF,
CDC20 and SPC25 were significantly involved in the
cell cycle (P=1.08×10⁻¹²); NUSAP1, CENPF,
SPC25, CDC20 and CCNB1 were involved in the M
phase (P=3.09×10⁻¹¹); and DEGs such as CCNB1,
SPC25, TOP2A, CDC20 and CCNA2 were
correlated with cell division (P=1.25×10⁻⁷). Notably,
PTTG1 was found to be enriched in every GO term (Table I). The downregulated DEGs, such as
KCND3, GABRA1, GABRA4 and GABRB1, were
markedly associated with ion transport (P=6.05×10⁻⁷);
DEGs such as KCNJ5, KCND3, KCNJ6 and
KCNT2 were relevant to metal ion transport
(P=3.87×10⁻⁶) and potassium ion transport
(P=7.01×10⁻⁵); DEGs such as DRD2, POU1F1
and GHRHR were distinctly associated with the positive
regulation of multicellular organism growth
(P=2.47×10⁻⁴), pituitary gland development
(P=5.70×10⁻⁴), adenohypophysis development
(P=8.52×10⁻⁴), diencephalon development
(P=1.24×10⁻³) and endocrine system development
(P=6.09×10⁻³); and DEGs such as NOTCH2,
ERBB4 and POU1F1 were involved in cell fate
commitment (P=3.22×10⁻²) and the regulation of cell
proliferation (P=4.55×10⁻²) (Table II).
 | Table I.Top two enriched GO biological
process term clusters with the highest enrichment score for the
upregulated differentially-expressed genes. |
Table I.
Top two enriched GO biological
process term clusters with the highest enrichment score for the
upregulated differentially-expressed genes.
| Enrichment
score | Term | Description | Count | P-value | Genes |
|---|
| 7.432 | GO:0007049 | Cell cycle | 31 |
1.08×10⁻¹² | SPC25, CCNA2,
CENPF, NUSAP1, CDC20, NDC80, CCNB1, PTTG1, CCNB2, BUB1B… |
|
| GO:0022403 | Cell cycle
phase | 23 |
1.10×10⁻¹² | NUSAP1, CENPF,
NDC80, CDC20, CCNB1, PTTG1, SPC25, CDKN1A, PLK1, BUB1B… |
|
| GO:0022402 | Cell cycle
process | 27 |
3.26×10⁻¹² | PTTG1, SPC25,
CDKN2C, CENPF, NUSAP1, CDC20, NDC80, CCNB1, CDKN1C, BUB1B… |
|
| GO:0000279 | M phase | 19 |
3.09×10⁻¹¹ | NUSAP1, CENPF,
NDC80, CDC20, PTTG1, CCNB1, SPC25, PLK1, BUB1B, SKA3… |
|
| GO:0051301 | Cell division | 14 |
1.25×10⁻⁷ | NUSAP1, CDC20,
PTTG1, CCNB1, SPC25, CCNB2, PLK1, BUB1B, TOP2A, CCNA2… |
|
| GO:0000087 | M phase of mitotic
cell cycle | 12 |
2.16×10⁻⁷ | CCNB1, SPC25,
PLK1, NUF2, NUSAP1, BUB1B, SKA3, CENPF, CDC20, PTTG1… |
|
| GO:0000278 | Mitotic cell
cycle | 16 |
5.40×10⁻⁷ | NUSAP1, CENPF,
NDC80, CDC20, PTTG1, CCNB1, SPC25, CDKN1A, CDKN2C, BUB1B… |
|
| GO:0000280 | Nuclear
division | 10 |
1.09×10⁻⁵ | CCNB1, SPC25,
KIF11, PLK1, NUF2, NUSAP1, BUB1B, SKA3, CDC20, PTTG1 |
|
| GO:0007067 | Mitosis | 10 |
1.09×10⁻⁵ | CCNB1, SPC25,
KIF11, PLK1, NUF2, NUSAP1, BUB1B, SKA3, CDC20, PTTG1 |
|
| GO:0048285 | Organelle
fission | 10 |
1.74×10⁻⁵ | CCNB1, SPC25,
KIF11, PLK1, NUF2, NUSAP1, BUB1B, SKA3, CDC20, PTTG1 |
|
| GO:0051439 | Regulation of
ubiquitin-protein ligase activity during mitotic cell cycle | 4 |
4.86×10⁻² | CCNB1, PLK1,
BUB1B, CDC20 |
| 5.335 | GO:0000279 | M phase | 19 |
3.09×10⁻¹¹ | NUSAP1, CENPF,
NDC80, CDC20, PTTG1, CCNB1, SPC25, PLK1, BUB1B, SKA3… |
|
| GO:0051327 | M phase of meiotic
cell cycle | 7 |
2.32×10⁻⁴ | ADCY3, KIF2C,
MKI67, PLK1, SGOL2, PTTG1, RAD51 |
|
| GO:0007126 | Meiosis | 7 |
2.32×10⁻⁴ | ADCY3, KIF2C,
MKI67, PLK1, SGOL2, PTTG1, RAD51 |
|
| GO:0051321 | Meiotic cell
cycle | 7 |
2.76×10⁻⁴ | ADCY3, KIF2C,
MKI67, PLK1, SGOL2, PTTG1, RAD51 |
| Table II.Top two enriched GO biological
process term clusters with the highest enrichment score for the
downregulated differentially-expressed genes. |
Table II.
Top two enriched GO biological
process term clusters with the highest enrichment score for the
downregulated differentially-expressed genes.
| Enrichment
score | Term | Description | Count | P-value | Genes |
|---|
| 4.727 | GO:0006811 | Ion transport | 16 |
6.05×10⁻⁷ | KCND3, GABRA1,
GABRA4, GABRB2, GABRB1, CACNG6, ATP2B4, KCNT2, KCNH7,
CACNA1A…… |
|
| GO:0030001 | Metal ion
transport | 12 |
3.87×10⁻⁶ | KCNJ5, KCND3,
KCNJ6, ATP2B4, CACNG6, KCNH7, KCNH8, SCNN1G, KCNJ3,
CACNA1A…… |
|
| GO:0006812 | Cation
transport | 12 |
2.54×10⁻⁵ | KCNJ5, KCND3,
KCNJ6, ATP2B4, CACNG6, KCNH7, KCNH8, SCNN1G, KCNJ3,
CACNA1A…… |
|
| GO:0006813 | Potassium ion
transport | 7 |
7.01×10⁻⁵ | KCNJ5, KCND3,
KCNJ6, KCNT2, KCNH7, KCNH8, KCNJ3 |
|
| GO:0015672 | Monovalent
inorganic cation transport | 8 |
5.52×10⁻⁴ | KCNJ5, KCND3,
KCNJ6, KCNT2, KCNH7, KCNH8, SCNN1G, KCNJ3 |
| 2.321 | GO:0040018 | Positive regulation
of multicellular organism growth | 4 |
2.47×10⁻⁴ | GH1, DRD2,
POU1F1, GHRHR |
|
| GO:0021983 | Pituitary gland
development | 4 |
5.70×10⁻⁴ | DRD2, POU1F1,
GHRHR, TBX19 |
|
| GO:0021984 | Adenohypophysis
development | 3 |
8.52×10⁻⁴ | DRD2, POU1F1,
GHRHR |
|
| GO:0021536 | Diencephalon
development | 4 |
1.24×10⁻³ | DRD2, POU1F1,
GHRHR, TBX19 |
|
| GO:0043567 | Regulation of
insulin-like growth factor receptor signaling pathway | 3 |
1.82×10⁻³ | GH1, POU1F1,
GHRHR |
|
| GO:0040014 | Regulation of
multicellular organism growth | 4 |
4.82×10⁻³ | GH1, DRD2,
POU1F1, GHRHR |
|
| GO:0035270 | Endocrine system
development | 4 |
6.09×10⁻³ | DRD2, POU1F1,
GHRHR, TBX19 |
|
| GO:0030900 | Forebrain
development | 5 |
9.58×10⁻³ | ERBB4, DRD2,
POU1F1, GHRHR, TBX19 |
|
| GO:0045927 | Positive regulation
of growth | 4 |
9.75×10⁻³ | GH1, DRD2,
POU1F1, GHRHR |
|
| GO:0048732 | Gland
development | 5 |
1.75×10⁻² | ERBB4, DRD2,
POU1F1, GHRHR, TBX19 |
|
| GO:0045165 | Cell fate
commitment | 4 |
3.22×10⁻² | NOTCH2, ERBB4,
POU1F1, TBX19 |
|
| GO:0051240 | Positive regulation
of multicellular organismal process | 5 |
3.49×10⁻² | GH1, ERBB4,
DRD2, POU1F1, GHRHR |
|
| GO:0042127 | Regulation of cell
proliferation | 8 |
4.55×10⁻² | NOTCH2, ERBB4,
DRD2, NR3C2, CDK6, POU1F1, GHRHR, TBX19 |
According to the KEGG pathway
enrichment analysis, the upregulated DEGs were mainly enriched in
10 pathways
For example, CDC20, CCNB1,
CCNB2, BUB1, CDKN1A and MCM3 were
enriched in the pathway of the cell cycle (P=5.01×10⁻⁷);
CDC20, CCNB1, CCNB2, BUB1 and
PLK1 were distinctly enriched in the pathway of oocyte
meiosis (P=1.058×10⁻³); CCNB1, CCNB2,
CCNA2, BUB1 and PLK1 were significantly
enriched in the pathway of progesterone-mediated oocyte maturation
(P=1.150×10⁻³); and CDKN1A, CCNB1,
CCNB2 and CASP8 were markedly enriched in the p53
signaling pathway (P=3.4841×10⁻²) (Table III). Meanwhile, the downregulated
DEGs were mainly enriched in 7 pathways. GH1, GABRA1,
GABRA4 and GABRB1 were enriched in the pathway of
neuroactive ligand-receptor interaction (P=4.35×10⁻⁴);
MAOB, ALDH2 and ALDH1A7 were mainly enriched
in the pathways of histidine metabolism (P=1.2476×10⁻²)
and tryptophan metabolism (P=3.7487×10⁻²);
ATP2B4, ERBB4 and PLCG2 were enriched in the
calcium signaling pathway (P=3.9919×10⁻²); and
GSTA4, MGST1, GSTM7 were significantly
enriched in the pathways of drug metabolism
(P=1.4397×10⁻²) and glutathione metabolism
(P=4.9294×10⁻²) (Table
III).
| Table III.Results of pathway enrichment
analysis of the up- and downregulated differentially-expressed
genes. |
Table III.
Results of pathway enrichment
analysis of the up- and downregulated differentially-expressed
genes.
| Category | Term | Description | Count | P-value | Genes |
|---|
| Upregulated | rno04110 | Cell cycle | 14 |
5.01×10⁻⁷ | CDC20, MCM3,
CDKN1C, CCNB1, CDKN1A, CCNB2, CDKN2C, BUB1, BUB1B, CCNA2…… |
|
| rno04114 | Oocyte meiosis | 9 |
1.06×10⁻³ | CCNB1, ADCY3,
AR, CCNB2, MAPK12, PLK1, BUB1, CDC20, PTTG1 |
|
| rno00601 | Glycosphingolipid
biosynthesis | 5 |
1.10×10⁻³ | B4GALT1,
B3GALT2, B3GALT5, FUT4, B4GALT4 |
|
| rno04914 |
Progesterone-mediated oocyte
maturation | 8 |
1.15×10⁻³ | CCNB1, ADCY3,
CCNB2, KRAS, MAPK12, PLK1, BUB1, CCNA2 |
|
| rno04062 | Chemokine signaling
pathway | 9 |
1.46×10⁻² | ADCY3, KRAS,
LYN, ARRB1, PREX1, GRK5, PRKCD, CCL6, SHC4 |
|
| rno00330 | Arginine and
proline metabolism | 5 |
1.70×10⁻² | ARG1, GOT1,
NOS1, ASS1, GAMT |
|
| rno05219 | Bladder cancer | 4 |
2.94×10⁻² | CDKN1A, KRAS,
PGF, VEGFA |
|
| rno04115 | p53 signaling
pathway | 5 |
3.48×10⁻² | CCNB1, CDKN1A,
CCNB2, CASP8, IGFBP3 |
|
| rno04610 | Complement and
coagulation cascades | 5 |
4.19×10⁻² | C1QA, A2M, C1S,
C1QC, F2R |
|
| rno00510 | N-glycan
biosynthesis | 4 |
4.89×10⁻² | B4GALT1, MAN2A1,
ALG5, MAN1A1 |
| Downregulated | rno04080 | Neuroactive
ligand-receptor interaction | 9 |
4.35×10⁻⁴ | GH1, GABRA1,
GABRA4, GABRB2, DRD2, GABRB1, TSHB, LHB, GHRHR |
|
| rno00410 | β-alanine
metabolism | 3 |
1.05×10⁻² | ALDH2, ALDH1A7,
DPYD |
|
| rno00340 | Histidine
metabolism | 3 |
1.25×10⁻² | MAOB, ALDH2,
ALDH1A7 |
|
| rno00982 | Drug
metabolism | 4 |
1.44×10⁻² | GSTA4, MAOB,
MGST1, GSTM7 |
|
| rno00380 | Tryptophan
metabolism | 3 |
3.75×10⁻² | MAOB, ALDH2,
ALDH1A7 |
|
| rno04020 | Calcium signaling
pathway | 5 |
3.99×10⁻² | ATP2B4, ERBB4,
PLCG2, PLCB1, CACNA1A |
|
| rno00480 | Glutathione
metabolism | 3 |
4.93×10⁻² | GSTA4, MGST1,
GSTM7 |
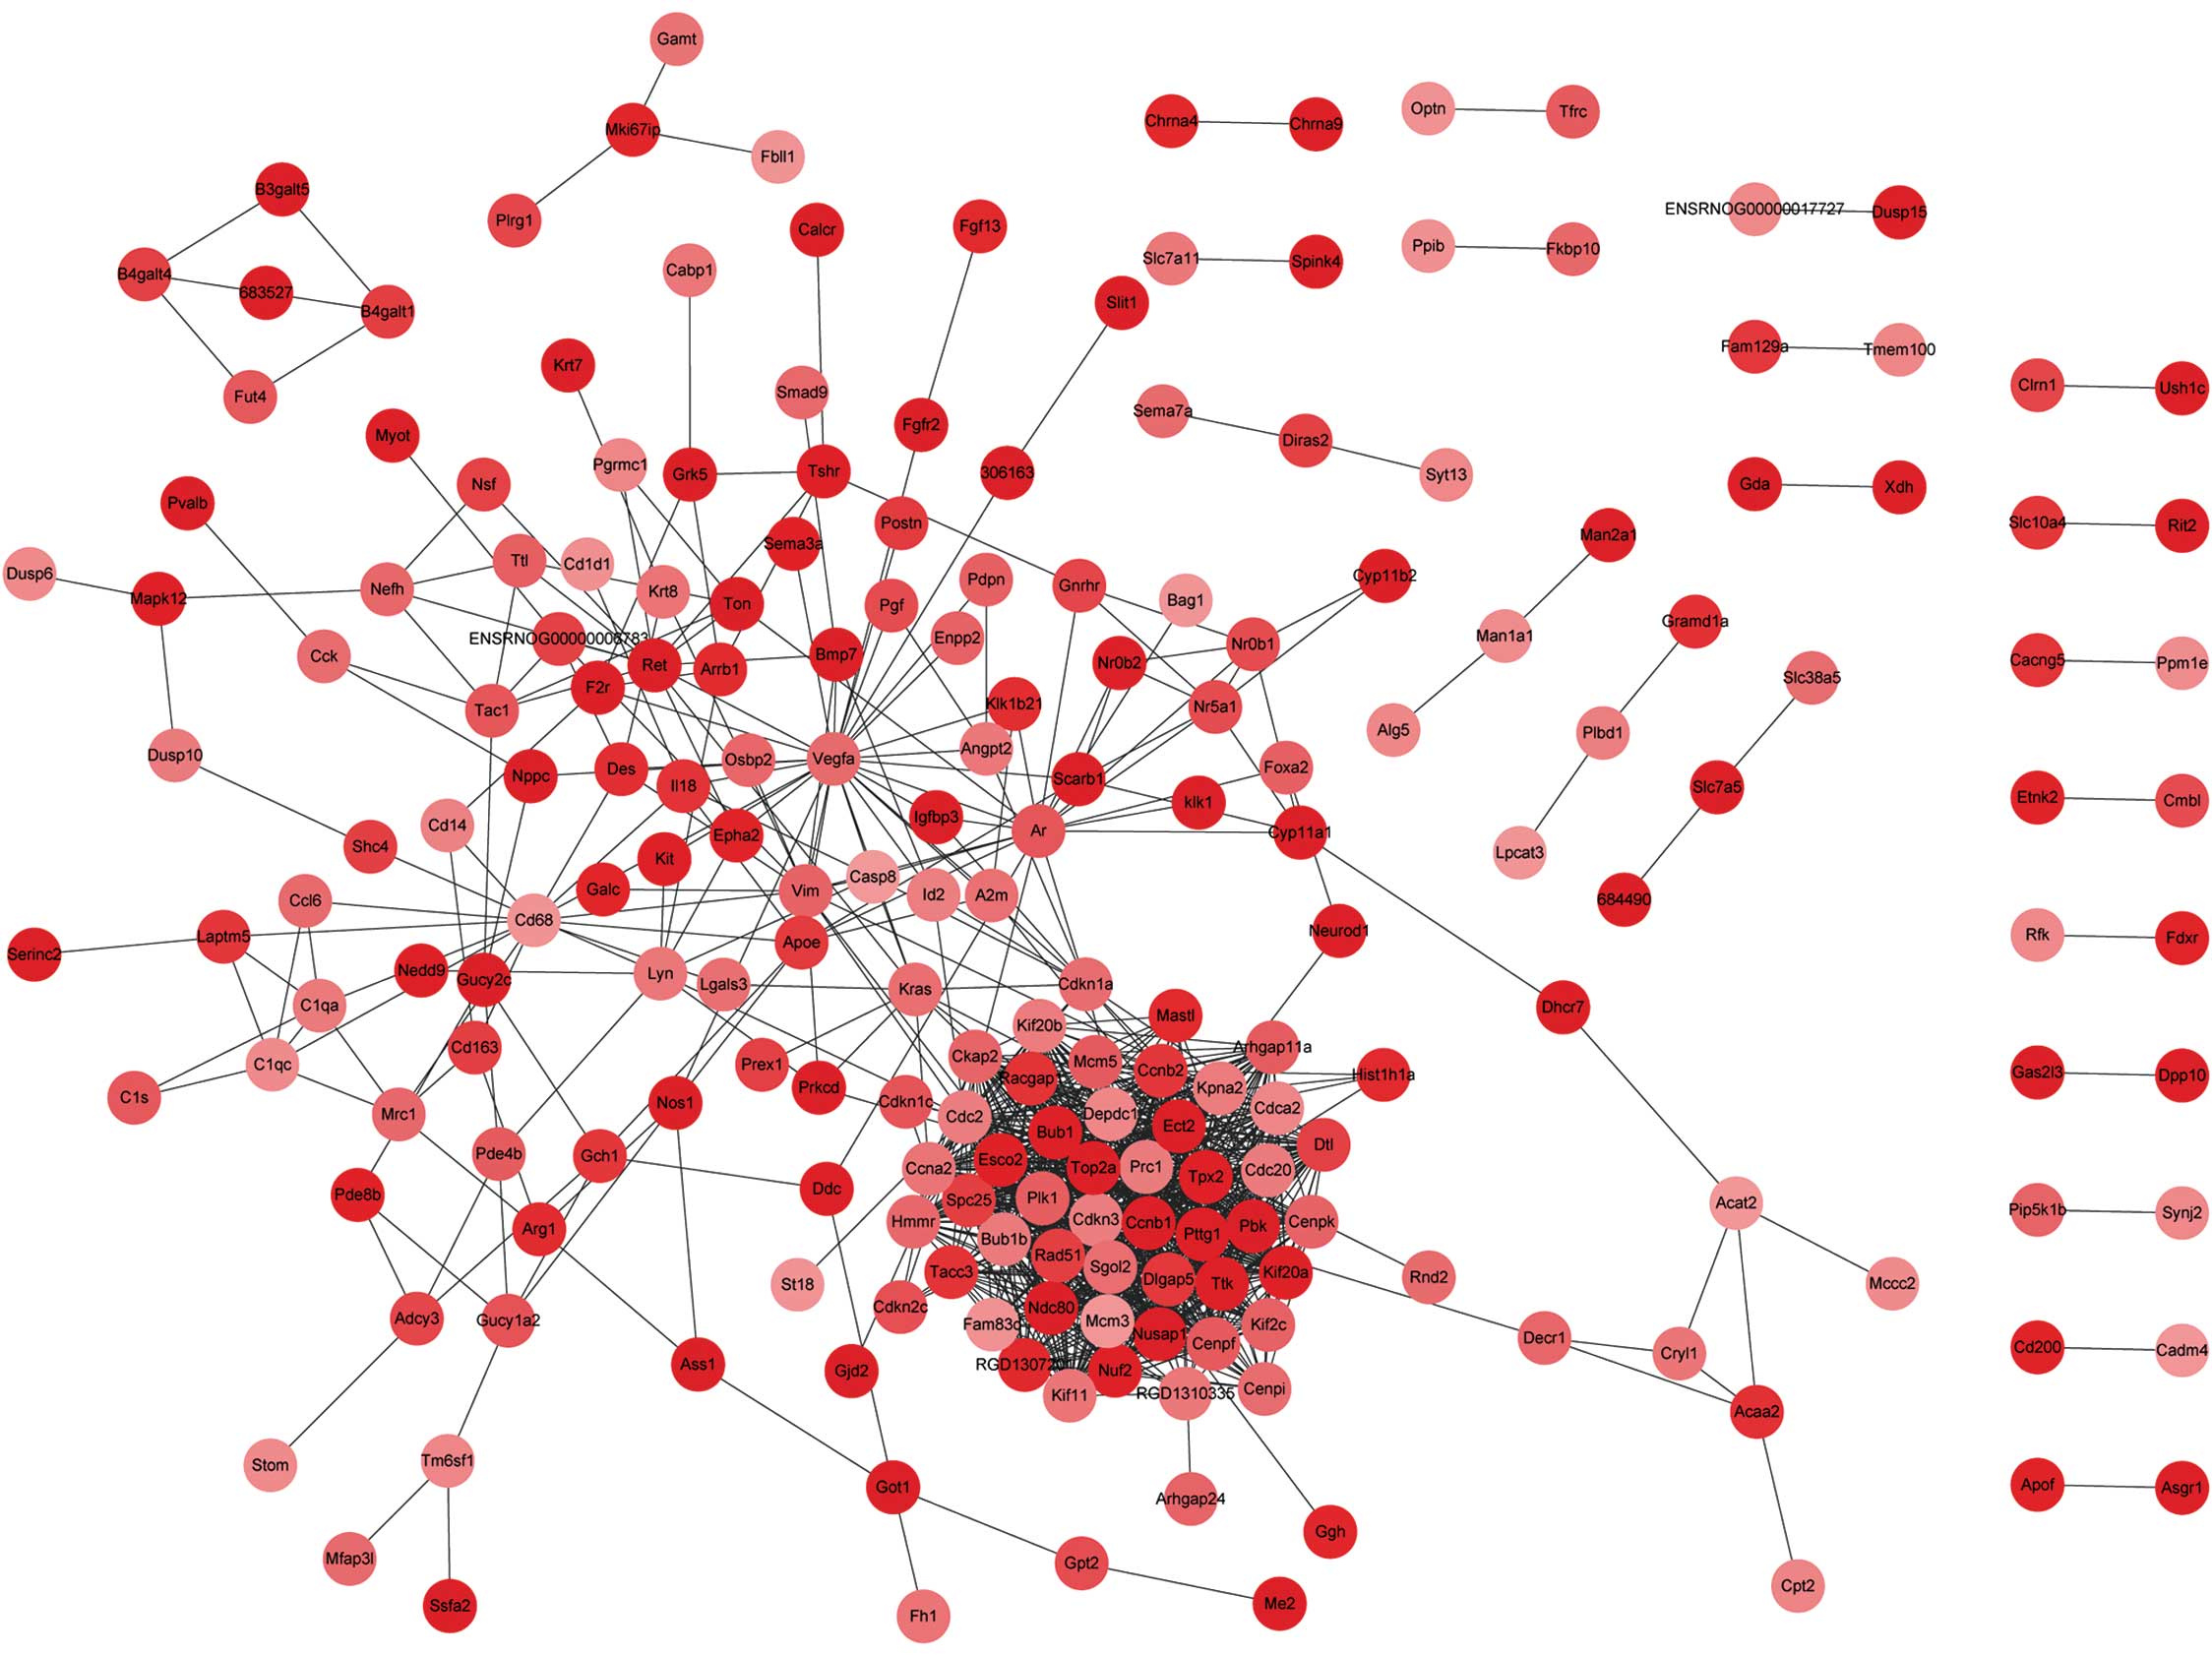
Analysis of PPI network
The PPI networks constructed with the up- and
downregulated DEGs consisted of 1,044 and 69 PPI pairs,
respectively. In the former, PTTG1, along with CCNB1,
CCNA2, SPC25, CENPF, NUSAP1,
CDC20, TOP2A and BUB1, were observed to
interact with each other (Fig. 1).
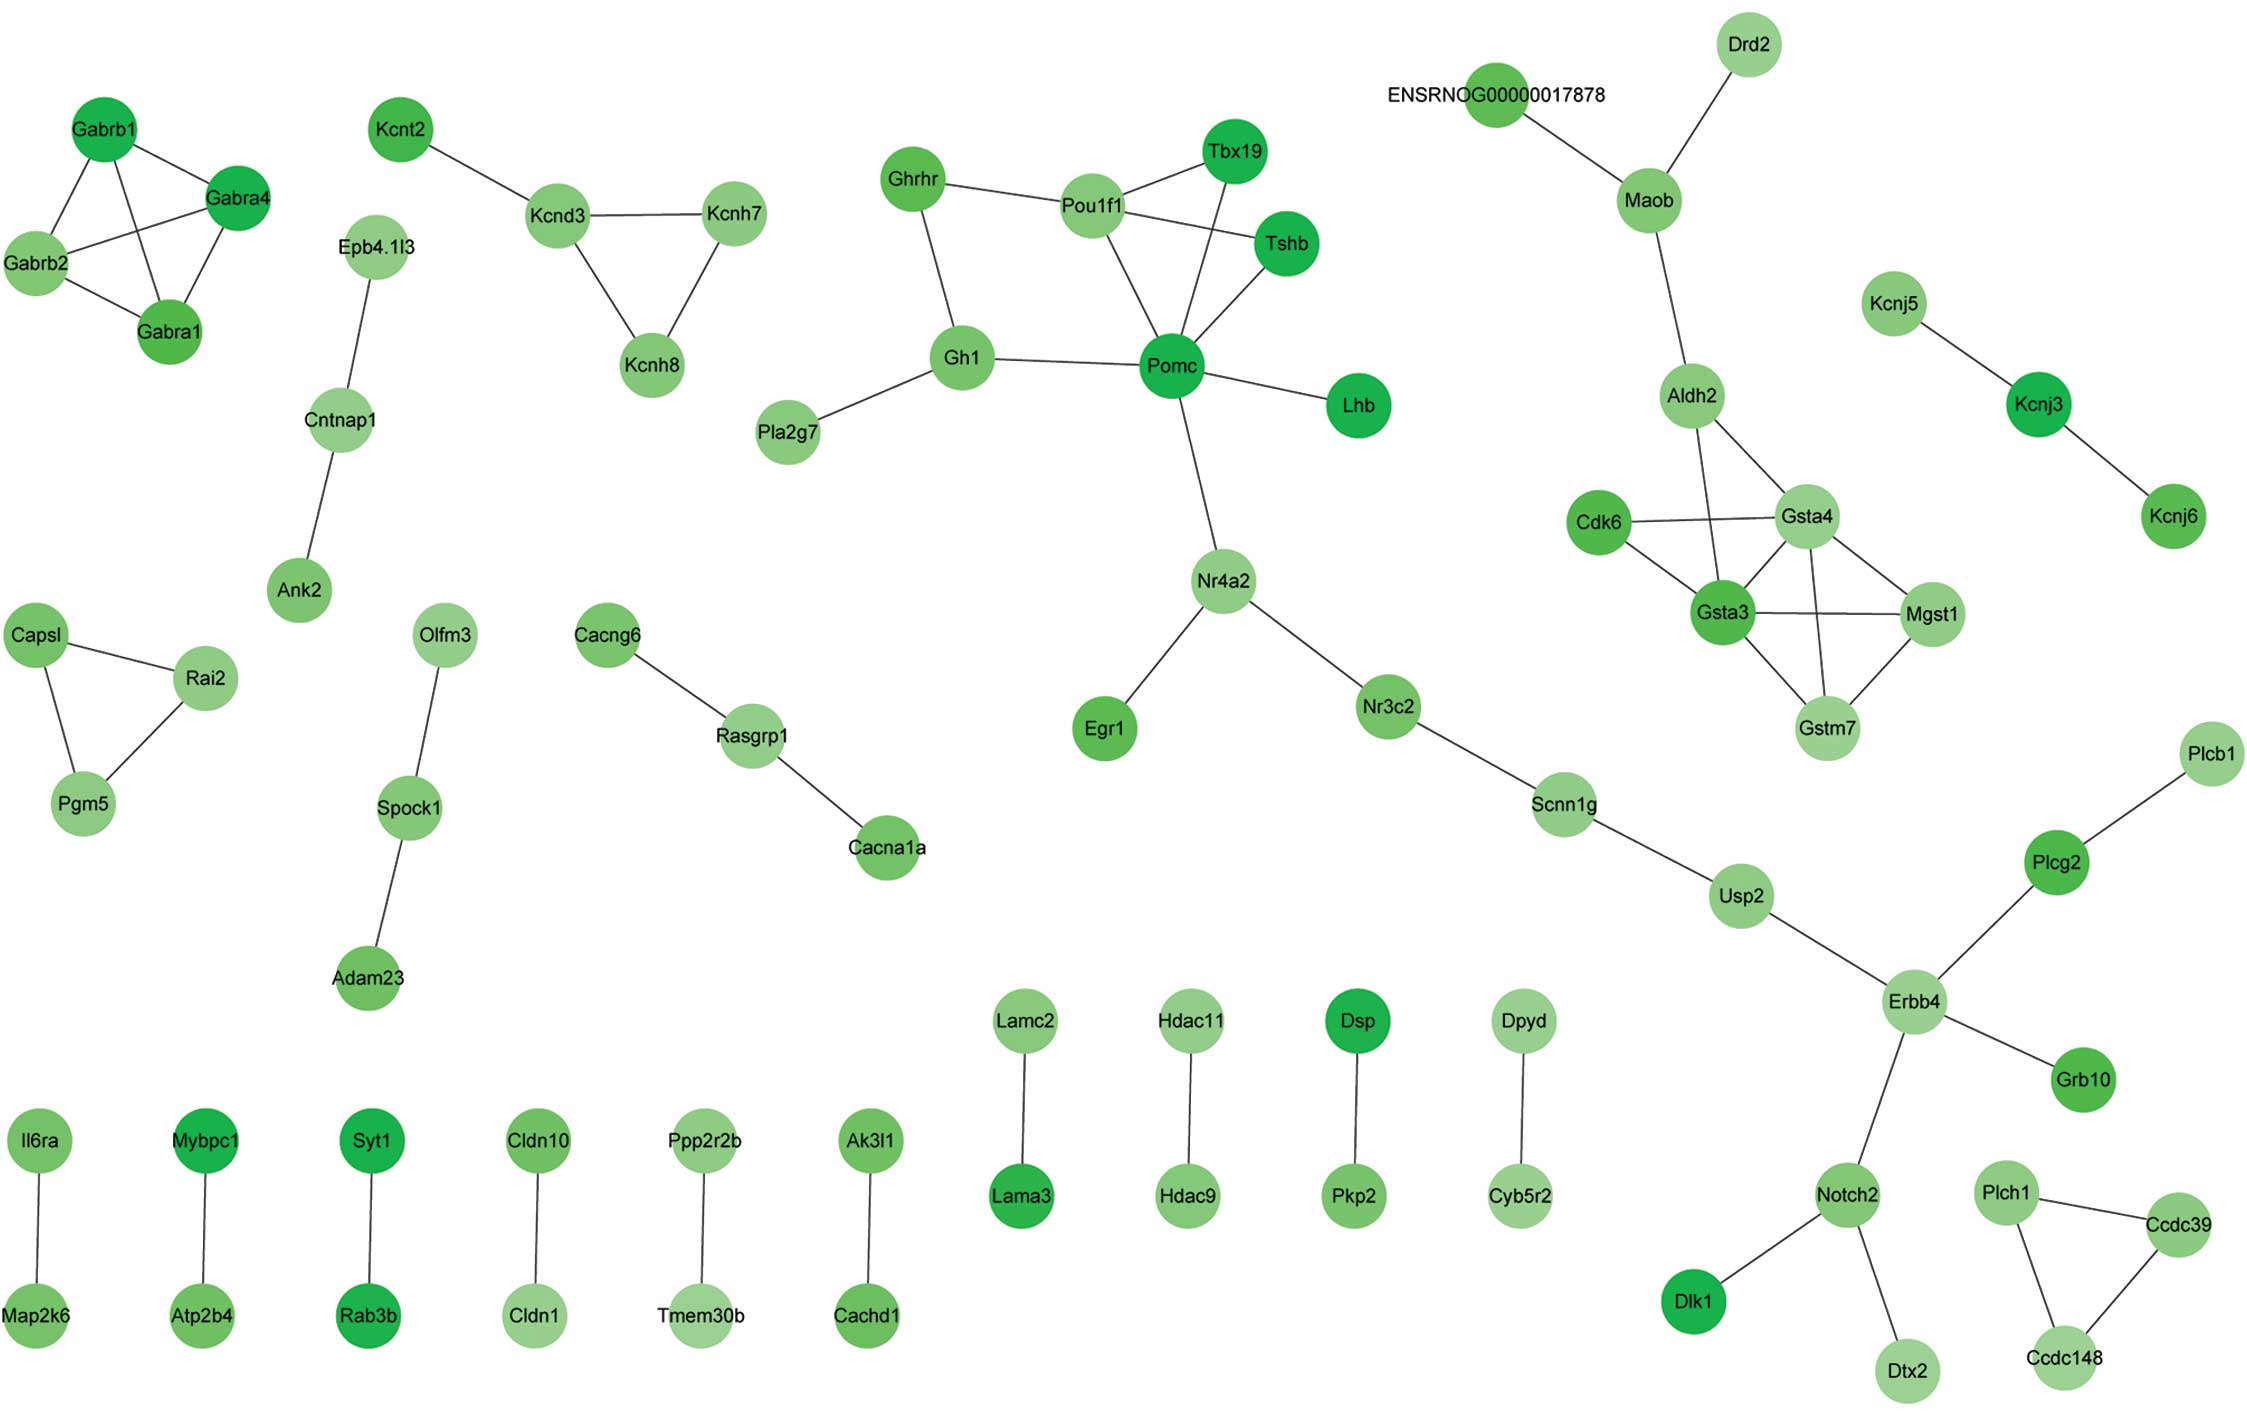
Within the PPI network built with downregulated DEGs,
GABRA1, GABRA4, GABRB1 and GABRB1 were
observed to interact with each other; GSTA3, GSTA4,
GSTM7 and MGST1 were also found to interact with each
other, and POU1F1 was observed to interact with POMC
(Fig. 2). The connection degrees of
the top 15% highly-connected upregulated DEGs were each >30, and
those of CDK1, CCNB1, CCNA2 and BUB1
were 51, 47, 46 and 44, respectively (Table IV). The top 20% highly-connected
downregulated DEGs all had connection degrees of at least 3, and
the degrees of POMC, GSTA4, POU1F1,
ERBB4, KCND3 and NOTCH2 were 6, 5, 4, 4, 3 and
3, respectively (Table IV).
| Table IV.Upregulated DEGs with connection
degrees of >30 and the downregulated DEGs with connection
degrees of at least 3 in the protein-protein interaction
networks. |
Table IV.
Upregulated DEGs with connection
degrees of >30 and the downregulated DEGs with connection
degrees of at least 3 in the protein-protein interaction
networks.
| Category | Degree |
|---|
| Upregulated
DEGs |
|
|
CDK1 | 51 |
|
CCNB1 | 47 |
|
CCNA2 | 46 |
|
BUB1 | 44 |
|
ECT2 | 43 |
|
TPX2 | 42 |
|
NDC80 | 42 |
|
PRC1 | 42 |
|
NUSAP1 | 41 |
|
TOP2A | 41 |
|
CCNB2 | 41 |
|
PBK | 41 |
|
RACGAP1 | 41 |
|
TTK | 41 |
|
PIK1 | 40 |
|
SPC25 | 40 |
|
BUB1B | 40 |
|
CENPF | 40 |
|
CDKN3 | 39 |
|
NUF2 | 38 |
|
CDC20 | 38 |
|
KIF11 | 38 |
|
DLGAP5 | 38 |
|
SGOL2 | 37 |
|
DTL | 36 |
|
KIF20A | 36 |
|
CDCA2 | 36 |
|
KIF20B | 35 |
|
ESCO2 | 35 |
|
RAD51 | 34 |
|
ARHGAP11A | 34 |
|
CKAP2 | 33 |
|
HMMR | 33 |
|
KIF2C | 32 |
|
DEPDC1 | 32 |
| Downregulated
DEGs |
|
|
POMC | 6 |
|
GSTA4 | 5 |
|
GSTA1 | 5 |
|
POU1F1 | 4 |
|
ERBB4 | 4 |
|
GABRA1 | 3 |
|
MGST1 | 3 |
|
GABRA4 | 3 |
|
GSTM7 | 3 |
|
ALDH2 | 3 |
|
GH1 | 3 |
|
NR4A2 | 3 |
|
MAOB | 3 |
|
KCND3 | 3 |
|
NOTCH2 | 3 |
|
GABRB1 | 3 |
Discussion
In the present study, 391 DEGs were identified to be
significantly upregulated and 238 were significantly downregulated
in the pituitary adenomas samples. According to the constructed PPI
network with the upregulated DEGs, PTTG1 interacted with
other DEGs with higher connection degrees, such as CCNB1,
CCNA2, SPC25, CENPF, NUSAP1,
CDC20, TOP2A and BUB1.
PTTG1, a tumorigenic gene in vivo
(23), is abundantly expressed in
pituitary tumors (24). As a securin
protein, PTTG1 is correlated with the mitotic checkpoint
that prevents abnormal chromosome segregation (25), and peaks at the G2/M phase
(26). The overexpression of
PTTG1 results in cell transformation and induces aneuploidy
(27), and this exists in >90% of
pituitary tumors (28). PTTG1,
together with CCNB1, CCNA2, BUB1,
SPC25, CENPF, NUSAP1, TOP2A and
CDC20, were all found to be enriched in GO terms associated
with the cell cycle or cell division, which are indispensable for
tumor growth. It has been reported that CDC20 is involved in
the degradation of PTTG1-encoding products (29). Meanwhile, previous studies have also
reported the abnormal expression of CCNB1 (30), CCNA2 (31), and BUB1 (32) in pituitary adenomas. Furthermore,
CCNB1 was enriched in the p53 signaling pathway.
PTTG1-encoding protein can cooperate with p53 to take part
in cell apoptosis and DNA damage/repair (33,34).
Altered p53 expression has been reported in pituitary carcinomas
(35). Also, PTTG1 can
activate β-fibroblast growth factor, cyclin D3 and c-myc to promote
cell proliferation (36,37). Therefore, PTTG1 may play a
crucial role in the occurrence of pituitary adenomas via
interaction with CCNB1, CCNA2, CENPF,
NUSAP1, CDC20, TOP2A, BUB1 and p53.
Within the PPI network constructed with
downregulated DEGs, GABRA1, GABRA4 and GABRB1
had higher degrees of connection to other genes. These genes were
enriched in the pathway of neuroactive ligand-receptor interaction.
GABRA1, GABRA4 and GABRB1 encode
γ-aminobutyric acid (GABA) receptors. GABA is the major inhibitory
neurotransmitter in the mammalian brain and may act as a paracrine
or autocrine regulating factor in the human pituitary gland and
human pituitary growth hormone adenomas (38). It has been reported that GABA has a
specific effect on the electrical activity of a tumoral line of rat
pituitary cells, and that it inhibits prolactin secretion directly
at the pituitary level (39).
Additionally, POU1F1 was also observed to have a higher
connection degree in the PPI network. This gene encoding a member
of the POU family of transcription factors (40), was correlated with the development of
the pituitary gland, adenohypophysis and endocrine system. In
humans, POU1F1 mutation has been shown to be associated with
combined pituitary hormone deficiency (41). POU1F1 is also implicated in
cell growth and prevents cell apoptosis (42). In the present study, it was observed
to interact with POMC, which encodes a polypeptide hormone
precursor. The encoded polypeptide hormone precursor is synthesized
mainly in corticotrophin cells of the anterior pituitary (43). A previous study has shown that in
silent pituitary adenomas, POMC mRNA has a diffuse low level
or is absent (44). Thus,
GABRA1, GABRA4, GABRB1, POU1F1 and
POMC may also have critical roles in pituitary adenoma
occurrence via close interaction.
In conclusion, upregulated DEGs, such as those
associated with the cell cycle or cell division (e.g.,
CCNB1, CCNA2, BUB1, CENPF,
NUSAP1, CDC20, TOP2A and particularly
PTTG1) and downregulated DEGs, such as those relevant to
neuroactive ligand-receptor interaction (e.g., GABRA1,
GABRA4 and GABRB1), as well as those correlated with
the development of the pituitary gland, adenohypophysis and
endocrine system (e.g., POU1F1) may have essential roles in
the pathogenesis of pituitary adenomas. The present study provides
novel information for the clinical diagnosis of this disease.
Acknowledgements
This study was supported by grants from the
National Natural Science Foundation of China (no. 81273732/H2708)
and the Shanghai Educational Commission Funding Project (no.
2012JW68).
References
|
1
|
Chesnokova V and Melmed S: Pituitary
tumour-transforming gene (PTTG) and pituitary senescence. Horm Res.
71(Suppl 2): 82–87. 2009. View Article : Google Scholar : PubMed/NCBI
|
|
2
|
Pereira AM and Biermasz NR: Treatment of
nonfunctioning pituitary adenomas: What were the contributions of
the last 10 years? A critical view. Ann Endocrinol (Paris).
73:111–116. 2012. View Article : Google Scholar : PubMed/NCBI
|
|
3
|
Lin Y, Jiang X, Shen Y, Li M, Ma H, Xing M
and Lu Y: Frequent mutations and amplifications of the PIK3CA gene
in pituitary tumors. Endocr Relat Cancer. 16:301–310. 2009.
View Article : Google Scholar : PubMed/NCBI
|
|
4
|
Vortmeyer AO, Glasker S, Mehta GU,
Abu-Asab MS, Smith JH, Zhuang Z, Collins MT and Oldfield EH:
Somatic GNAS mutation causes widespread and diffuse pituitary
disease in acromegalic patients with McCune-Albright syndrome. J
Clin Endocrinol Metab. 97:2404–2413. 2012. View Article : Google Scholar : PubMed/NCBI
|
|
5
|
Vandeva S, Tichomirowa MA, Zacharieva S,
Daly AF and Beckers A: Genetic factors in the development of
pituitary adenomas. Endocr Dev. 17:121–133. 2010. View Article : Google Scholar : PubMed/NCBI
|
|
6
|
Mezzomo LC, Gonzales PH, Pesce FG,
Kretzmann Filho N, Ferreira NP, Oliveira MC and Kohek MB:
Expression of cell growth negative regulators MEG3 and GADD45γ is
lost in most sporadic human pituitary adenomas. Pituitary.
15:420–427. 2012. View Article : Google Scholar : PubMed/NCBI
|
|
7
|
Michaelis KA, Knox AJ, Xu M,
Kiseljak-Vassiliades K, Edwards MG, Geraci M,
Kleinschmidt-DeMasters BK, Lillehei KO and Wierman ME:
Identification of growth arrest and DNA-damage-inducible gene beta
(GADD45beta) as a novel tumor suppressor in pituitary gonadotrope
tumors. Endocrinology. 152:3603–3613. 2011. View Article : Google Scholar : PubMed/NCBI
|
|
8
|
Farrell WE: Epigenetic mechanisms of
tumorigenesis. Horm Metab Res. 37:361–368. 2005. View Article : Google Scholar : PubMed/NCBI
|
|
9
|
Ezzat S: Epigenetic control in pituitary
tumors. Endocr J. 55:951–957. 2008. View Article : Google Scholar : PubMed/NCBI
|
|
10
|
Melmed S: Pathogenesis of pituitary
tumors. Nat Rev Endocrinol. 7:257–266. 2011. View Article : Google Scholar : PubMed/NCBI
|
|
11
|
Cheunsuchon P, Zhou Y, Zhang X, Lee H,
Chen W, Nakayama Y, Rice KA, Tessa Hedley-Whyte E, Swearingen B and
Klibanski A: Silencing of the imprinted DLK1-MEG3 locus in human
clinically nonfunctioning pituitary adenomas. Am J Pathol.
179:2120–2130. 2011. View Article : Google Scholar : PubMed/NCBI
|
|
12
|
D'angelo D, Palmieri D, Mussnich P, Roche
M, Wierinckx A, Raverot G, Fedele M, Croce CM, Trouillas J, Fusco
A, et al: Altered microRNA expression profile in human pituitary GH
adenomas: Down-regulation of miRNA targeting HMGA1, HMGA2 and E2F1.
J Clin Endocrinol Metab. 97:2011–3482. 2012. View Article : Google Scholar
|
|
13
|
Lee M, Marinoni I, Irmler M, Psaras T,
Honegger JB, Beschorner R, Anastasov N, Beckers J, Theodoropoulou
M, Roncaroli F, et al: Transcriptome analysis of MENX-associated
rat pituitary adenomas identifies novel molecular mechanisms
involved in the pathogenesis of human pituitary gonadotroph
adenomas. Acta Neuropathol. 126:137–150. 2013. View Article : Google Scholar : PubMed/NCBI
|
|
14
|
Irizarry RA, Hobbs B, Collin F,
Beazer-Barclay YD, Antonellis KJ, Scherf U and Speed TP:
Exploration, normalization and summaries of high density
oligonucleotide array probe level data. Biostatistics. 4:249–264.
2003. View Article : Google Scholar : PubMed/NCBI
|
|
15
|
Carvalho BS and Irizarry RA: A framework
for oligonucleotide microarray preprocessing. Bioinformatics.
26:2363–2367. 2010. View Article : Google Scholar : PubMed/NCBI
|
|
16
|
Smyth GK: Linear models and empirical
bayes methods for assessing differential expression in microarray
experiments. Stat Appl Genet Mol Biol. 3:2004.PubMed/NCBI
|
|
17
|
Benjamini Y and Hochberg Y: Controlling
the false discovery rate: A practical and powerful approach to
multiple testing. J R Stat Soc Ser B. 57:289–300. 1995.
|
|
18
|
da Huang W, Sherman BT and Lempicki RA:
Systematic and integrative analysis of large gene lists using DAVID
bioinformatics resources. Nat Protoc. 4:44–57. 2008. View Article : Google Scholar
|
|
19
|
Huang DW, Sherman BT and Lempicki RA:
Bioinformatics enrichment tools: Paths toward the comprehensive
functional analysis of large gene lists. Nucleic Acids Res.
37:1–13. 2009. View Article : Google Scholar : PubMed/NCBI
|
|
20
|
Von Mering C, Huynen M, Jaeggi D, Schmidt
S, Bork P and Snel B: STRING: A database of predicted functional
associations between proteins. Nucleic Acids Res. 31:258–261. 2003.
View Article : Google Scholar : PubMed/NCBI
|
|
21
|
Kohl M, Wiese S and Warscheid B:
Cytoscape: Software for visualization and analysis of biological
networks. Methods Mol Biol. 696:291–303. 2013. View Article : Google Scholar
|
|
22
|
He X and Zhang J: Why do hubs tend to be
essential in protein networks? PLoS genetics. 2:e882006. View Article : Google Scholar : PubMed/NCBI
|
|
23
|
Zhang X, Horwitz GA, Prezant TR, Valentini
A, Nakashima M, Bronstein MD and Melmed S: Structure, expression
and function of human pituitary tumor-transforming gene (PTTG). Mol
Endocrinol. 13:156–166. 1999. View Article : Google Scholar : PubMed/NCBI
|
|
24
|
Chen L, Puri R, Lefkowitz EJ and Kakar SS:
Identification of the human pituitary tumor transforming gene
(hPTTG) family: Molecular structure, expression and chromosomal
localization. Gene. 248:41–50. 2000. View Article : Google Scholar : PubMed/NCBI
|
|
25
|
Quereda V and Malumbres M: Cell cycle
control of pituitary development and disease. J Mol Endocrinol.
42:75–86. 2009. View Article : Google Scholar : PubMed/NCBI
|
|
26
|
Yu R, Ren SG, Horwitz GA, Wang Z and
Melmed S: Pituitary tumor transforming gene (PTTG) regulates
placental JEG-3 cell division and survival: Evidence from live cell
imaging. Mol Endocrinol. 14:1137–1146. 2000. View Article : Google Scholar : PubMed/NCBI
|
|
27
|
Yu R, Lu W, Chen J, Mccabe CJ and Melmed
S: Overexpressed pituitary tumor-transforming gene causes
aneuploidy in live human cells. Endocrinology. 144:4991–4998. 2003.
View Article : Google Scholar : PubMed/NCBI
|
|
28
|
Zhang X, Horwitz GA, Heaney AP, Nakashima
M, Prezant TR, Bronstein MD and Melmed S: Pituitary tumor
transforming gene (PTTG) expression in pituitary adenomas. J Clin
Endocr Metab. 84:761–767. 1999. View Article : Google Scholar : PubMed/NCBI
|
|
29
|
Zur A and Brandeis M: Securin degradation
is mediated by fzy and fzr and is required for complete chromatid
separation but not for cytokinesis. EMBO J. 20:792–801. 2001.
View Article : Google Scholar : PubMed/NCBI
|
|
30
|
Raverot G, Wierinckx A, Dantony E, Auger
C, Chapas G, Villeneuve L, Brue T, Figarella-Branger D, Roy P,
Jouanneau E, et al: Prognostic factors in prolactin pituitary
tumors: Clinical, histological and molecular data from a series of
94 patients with a long postoperative follow-up. J Clin Endocr
Metab. 95:1708–1716. 2010. View Article : Google Scholar : PubMed/NCBI
|
|
31
|
Leone V, Langella C, D'Angelo D, Mussnich
P, Wierinckx A, Terracciano L, Raverot G, Lachuer J, Rotondi S,
Jaffrain-Rea ML, et al: Mir-23b and miR-130b expression is
downregulated in pituitary adenomas. Mol Cell Endocrinol. 390:1–7.
2014. View Article : Google Scholar : PubMed/NCBI
|
|
32
|
Yoshida D, Nomura R and Teramoto A:
Signalling pathway mediated by CXCR7, an alternative chemokine
receptor for stromal-cell derived factor-1α, in AtT20 mouse
adrenocorticotrophic hormone-secreting pituitary adenoma cells. J
Neuroendocrinol. 21:481–488. 2009. View Article : Google Scholar : PubMed/NCBI
|
|
33
|
Yu R, Heaney AP, Lu W, Chen J and Melmed
S: Pituitary tumor transforming gene causes aneuploidy and
p53-dependent and p53-independent apoptosis. J Biol Chem.
275:36502–36505. 2000. View Article : Google Scholar : PubMed/NCBI
|
|
34
|
Hamid T and Kakar SS: PTTG/securin
activates expression of p53 and modulates its function. Mol Cancer.
3:182004. View Article : Google Scholar : PubMed/NCBI
|
|
35
|
Thapar K, Scheithauer BW, Kovacs K,
Pernicone PJ and Laws ER Jr: p53 expression in pituitary adenomas
and carcinomas: Correlation with invasiveness and tumor growth
fractions. Neurosurgery. 38:765–770. 1996. View Article : Google Scholar : PubMed/NCBI
|
|
36
|
Mccabe C, Khaira J, Boelaert K, Heaney AP,
Tannahill LA, Hussain S, Mitchell R, Olliff J, Sheppard MC,
Franklyn JA and Gittoes NJ: Expression of pituitary tumour
transforming gene (PTTG) and fibroblast growth factor-2 (FGF-2) in
human pituitary adenomas: Relationships to clinical tumour
behaviour. Clin Endocrinol (Oxf). 58:141–150. 2003. View Article : Google Scholar : PubMed/NCBI
|
|
37
|
Pei L: Identification of c-myc as a
down-stream target for pituitary tumor-transforming gene. J Biol
Chem. 276:8484–8491. 2001. View Article : Google Scholar : PubMed/NCBI
|
|
38
|
End K, Gamel-Didelon K, Jung H, Tolnay M,
Lüdecke D, Gratzl M and Mayerhofer A: Receptors and sites of
synthesis and storage of gamma-aminobutyric acid in human pituitary
glands and in growth hormone adenomas. Am J Clin Pathol.
124:550–558. 2005. View Article : Google Scholar : PubMed/NCBI
|
|
39
|
Israel J, Dufy B, Gourdji D and Vincent J:
Effects of GABA on electrical properties of cultured rat pituitary
tumor cells: An intracellular recording study. Life Sci.
29:351–359. 1981. View Article : Google Scholar : PubMed/NCBI
|
|
40
|
Cohen LE, Wondisford FE and Radovick S:
Role of Pit-1 in the gene expression of growth hormone, prolactin
and thyrotropin. Endocrinol Metab Clin North Am. 25:523–540. 1996.
View Article : Google Scholar : PubMed/NCBI
|
|
41
|
Quentien MH, Barlier A, Franc JL,
Pellegrini I, Brue T and Enjalbert A: Pituitary transcription
factors: From congenital deficiencies to gene therapy. J
Neuroendocrinol. 18:633–642. 2006. View Article : Google Scholar : PubMed/NCBI
|
|
42
|
Pellegrini I, Roche C, Quentien MH,
Ferrand M, Gunz G, Thirion S, Bagnis C, Enjalbert A and Franc JL:
Involvement of the pituitary-specific transcription factor pit-1 in
somatolactotrope cell growth and death: An approach using
dominant-negative pit-1 mutants. Mol Endocrinol. 20:3212–3227.
2006. View Article : Google Scholar : PubMed/NCBI
|
|
43
|
Millington GW: Proopiomelanocortin (POMC):
The cutaneous roles of its melanocortin products and receptors.
Clin Exp Dermatol. 31:407–412. 2006. View Article : Google Scholar : PubMed/NCBI
|
|
44
|
Stefaneanu L, Kovacs K, Horvath E and
Lloyd RV: In situ hybridization study of pro-opiomelanocortin
(POMC) gene expression in human pituitary corticotrophs and their
adenomas. Virchows Arch A Pathol Anat Histopathol. 419:107–113.
1991. View Article : Google Scholar : PubMed/NCBI
|