Introduction
Squamous cell carcinoma (SCC) is a histologically
distinct type of cancer (1). It
arises from the uncontrolled proliferation of epithelial cells or
cells exhibiting cytological or tissue architectural
characteristics of SC differentiation, including the presence of
keratin, tonofilament bundles or desmosomes, which are structures
involved in cell-cell adhesion (1).
SCC occurs in numerous tissues, including the lips, mouth,
esophagus, lungs, urinary bladder and prostate (2). Of all the cases of SCC, 2.5% become
metastatic and lead to substantial morbidity, which constitutes a
considerable economic burden to the healthcare system (3). The incidence of SCC has notably
increased worldwide over the last decade (4). Thus, an improved understanding of the
underlying molecular mechanisms and gene networks involved in the
development and progression of skin SCC is required.
Numerous studies on the mechanisms and therapeutic
strategies for the treatment of SCC have been reported to date
(5–8).
Exposure to ultraviolet radiation, a potent mutagen and
DNA-damaging agent, is considered to be a significant risk factor
for the development of SCC (5,6).
Carcinogenesis is a multistep process. During tumor progression,
multiple genes experience up- or downregulation (7). A number of genes and signaling pathways
involved in the progression of SCC have been previously identified
(3,6–9). Streit
et al (8) reported that
thrombospondin-1 (TSP-1) was an effective inhibitor of angiogenesis
and tumor growth in carcinomas of the skin. In addition, the
authors observed that the expression of TSP-1 was downregulated in
patients with SCC. Previous studies have established that the
transforming growth factor β-mothers against decapentaplegic
homolog 4 (SMAD4) signaling pathway is required for effective
epithelial wound healing, and a conditional deletion of SMAD4 in
the epidermis causes defects in skin wound healing, which are
accompanied by spontaneous skin inflammation and SCC (6). Additionally, talin 1 and laminin alpha
3, which participate in signaling pathways associated with adhesion
and migration, have been previously observed to be overexpressed in
SCC (9). Padilla et al
(3) and Nindl et al (7) selected differentially expressed genes
(DEGs) between SCC and normal skin (NO) samples using the
microarray expression profile dataset GSE2503. However, the
interactions between the carcinogenic genes that lead to SCC remain
to be elucidated.
In the present study, GSE2503 was downloaded and
used to identify the DEGs between SCC and NO samples, in order to
investigate the underlying molecular mechanisms of SCC.
Subsequently, functional enrichment analysis and functional
annotation were performed. In addition, protein-protein interaction
(PPI) networks and subnetworks were constructed and analyzed, in
order to study and identify target genes for the diagnosis and
treatment of SCC. The results of the present study may facilitate
the understanding of the mechanisms responsible for the
carcinogenesis and development of SCC. Furthermore, the genes
identified in the present study may serve as biomarkers for the
diagnosis and prognosis of SCC.
Materials and methods
Affymetrix microarray data
The microarray expression profile dataset GSE2503
(3,7),
which is based on the Gene Expression Omnibus (GEO) Platform 96
GeneChip® Human Genome U133A 2.0 Array (Affymetrix, Inc., Santa
Clara, CA, USA), was downloaded from the National Center of
Biotechnology Information GEO database (http://www.ncbi.nlm.nih.gov/geo/). The dataset
contained 15 samples, including six NO, four actinic keratosis and
five SCC. In the present study, the SCC and NO samples were
analyzed by bioinformatics methods.
Data preprocessing and differential
expression analysis
The original array data were converted into
expression measures. Background correction, quartile data
normalization and probe summarization were performed using the
Robust Multi-array Average (10)
algorithm in the R affy package (https://www.bioconductor.org/packages/release/bioc/html/affy.html).
Paired t-test based on the Linear Models for Microarray Data
package (https://bioconductor.org/packages/release/bioc/html/limma.html)
(11) in R (https://www.r-project.org/) was used to identify DEGs
between SCC and NO samples. Multiple testing correction was
performed with the Benjamini-Hochberg method (12) to obtain the adjusted P-value.
Subsequently, log2-fold change (log2FC) was
calculated. Only those genes exhibiting |log2FC|>1.0
and adjusted P<0.05 were regarded as DEGs.
Gene ontology and pathway enrichment
analysis
Gene Ontology (GO; http://geneontology.org/) (13) is a tool for unification of biology
that collects structured, defined and controlled vocabulary for
large-scale gene annotation. The Kyoto Encyclopedia of Genes and
Genomes (KEGG; http://www.genome.jp/kegg/) (14) knowledge database is a collection of
online databases regarding genomes, enzymatic pathways and
biological chemicals. The Database for Annotation, Visualization
and Integrated Discovery (DAVID; https://david.ncifcrf.gov/) (15) contains a comprehensive set of
functional annotation tools that have been developed for
associating functional terms with lists of genes via clustering
algorithms. In order to analyze the identified DEGs at the
functional level, GO enrichment and KEGG pathway analysis were
performed using the DAVID online tool. P<0.05 was set as the
threshold value.
Functional annotation of DEGs
Functional annotation analysis was performed to
determine whether the identified DEGs functioned as transcription
factors (TFs). The Tumor Suppressor Gene Database (TSGene;
http://bioinfo.mc.vanderbilt.edu/TSGene/) (16) integrates TSGs with large-scale
experimental evidence to provide a comprehensive resource for the
investigation of TSGs and their implication in the molecular
mechanisms of cancer. The Tumor Associated Gene (TAG; http://www.binfo.ncku.edu.tw/TAG/GeneDoc.php) database
(17) contains information regarding
genes involved in carcinogenesis. In the present study, all the
oncogenes and TSGs known to date were extracted from the TAG and
TSGene databases.
PPI network construction
The Search Tool for the Retrieval of Interacting
Genes (STRING; http://string-db.org/) database
(18) is a precomputed global
resource designed to evaluate PPI information. In the present
study, the STRING online tool was used to analyze the PPI of DEGs,
and those experimentally validated interactions with a combined
score >0.4 were selected as significant.
The majority of the PPI networks in the biological
network constructed were observed to obey the scale-free
attribution (19). Thus, the degree
of connectivity was statistically analyzed in networks using
cytoscape (www.cytoscape.org) (20), to obtain the significant nodes or hub
proteins (21) in the PPI
networks.
Subnetwork identification and
functional enrichment analysis
The BioNet package (https://www.bioconductor.org/packages/release/bioc/html/BioNet.html)
(22) provides a comprehensive set of
methods for the integrated analysis of gene expression data and
biological networks. The GeneAnswers (23) package (https://www.bioconductor.org/packages/release/bioc/html/GeneAnswers.html)
facilitates the understanding of the associations between a list of
genes and any relevant annotations.
In the present study, the BioNet package was used to
identify the subnetworks in the constructed PPI networks, with a
threshold false discovery rate (FDR)<0.001. Subsequently, the
GeneAnswers package based on Entrez Gene ID (http://www.ncbi.nlm.nih.gov/gene) was used to identify
over-represented GO terms with an FDR<0.05, and significantly
enriched pathways with P<0.05. Subsequently, data integration
and network visualization were performed to obtain heat maps and
association networks of the results derived from the enrichment
analysis and the corresponding genes.
Results
Identification of 181 DEGs
Following data preprocessing, a total of 181 genes
that were differentially expressed in SCC compared with NO were
identified. These DEGs included 95 upregulated and 86 downregulated
genes.
GO and pathway enrichment
analysis
A total of 20 GO biological processes (BPs) terms
enriched by the upregulated DEGs (including cell adhesion) and 14
GO BPs terms enriched by the downregulated DEGs (including
oxidation-reduction processes) were identified by GO and pathway
enrichment analysis. The most significant GO BPs terms are
presented in Table I.
 | Table I.GO functional and KEGG pathway
enrichment analyses for the most significantly up- and
downregulated DEGs. |
Table I.
GO functional and KEGG pathway
enrichment analyses for the most significantly up- and
downregulated DEGs.
| Category | Term | Description | Degree of
connectivity | P-value |
|---|
| Upregulated
DEGs |
|
|
|
|
| BP | GO:0007155 | Cell adhesion | 18 |
1.53×10⁻⁵ |
| BP | GO:0006954 | Inflammatory
response | 12 |
5.69×10⁻⁵ |
| BP | GO:0050900 | Leukocyte
migration | 10 |
4.37×10⁻⁶ |
| BP | GO:0030216 | Keratinocyte
differentiation | 7 |
3.74×10⁻⁶ |
| BP | GO:0032602 | Chemokine
production | 5 |
2.27×10⁻⁵ |
| Downregulated
DEGs |
|
|
|
|
| BP | GO:0055114 |
Oxidation-reduction | 10 |
4.33×10⁻⁴ |
| BP | GO:0042391 | Regulation of
membrane potential | 7 |
1.23×10⁻³ |
| BP | GO:0006898 | Receptor-mediated
endocytosis | 4 |
5.09×10⁻³ |
| BP | GO:0006805 | Metabolism of
xenobiotics | 4 |
9.58×10⁻³ |
| BP | GO:0003215 | Cardiac right
ventricle morphogenesis | 3 |
7.73×10⁻⁵ |
| Upregulated
DEGs |
|
|
|
|
|
KEGG | 5200 | Signaling pathways
in cancer | 8 |
9.37×10⁻⁴ |
|
KEGG | 4810 | Regulation of actin
cytoskeleton | 5 |
1.14×10⁻² |
|
KEGG | 4640 | Hematopoietic cell
lineage | 4 |
2.36×10⁻³ |
|
KEGG | 5219 | Bladder cancer | 3 |
2.41×10⁻³ |
|
KEGG | 5412 | Arrhythmogenic
right ventricular cardiomyopathy | 3 |
1.18×10⁻² |
| Downregulated
DGEs |
|
|
|
|
|
KEGG | 480 | Metabolism of
glutathione | 3 |
3.14×10⁻³ |
|
KEGG | 330 | Metabolism of
arginine and proline | 3 |
3.91×10⁻³ |
|
KEGG | 980 | Metabolism of
xenobiotics by cytochrome P450 | 3 |
8.41×10⁻³ |
|
KEGG | 982 | Metabolism of drugs
by cytochrome P450 | 3 |
9.08×10⁻³ |
|
KEGG | 310 | Lysine
degradation | 2 |
2.79×10⁻² |
Table I also contains
the most significantly enriched pathways of the upregulated and
downregulated DEGs revealed by KEGG analysis. The upregulated DEGs
were observed to be enriched in 18 pathways, while the
downregulated DEGs were enriched in 7 pathways.
Functional annotation of DEGs
Upon analyzing the differential expression pattern
of TFs and TAGs in SCC and NO samples, the present study identified
a number of TFs, including hypoxia inducible factor 1, alpha
subunit (HIF1A), aryl hydrocarbon receptor nuclear
translocator-like 2 and paired-like homeodomain 1, which were
significantly upregulated, in addition to six TFs, including
nuclear receptor subfamily 3, hepatic leukemia factor and zinc
finger protein 83, which were significantly downregulated in SCC.
Among the upregulated DEGs, 11 genes were identified as TAGs. Of
these, four were oncogenes and five were TSGs. The function of the
remaining two genes identified in the analysis remains to be
elucidated. Among the downregulated DEGs, five genes were
identified as TSGs, including low-density lipoprotein
receptor-related protein 1B and proline dehydrogenase (oxidase)
1.
PPI network construction
Based on the information contained in the STRING
database, 104 protein pairs were identified (Fig. 1). A total of 14 nodes were selected as
hub proteins (degree ≥5) in the PPI network, including matrix
metallopeptidase 1 (MMP1) (also known as interstitial collagenase),
keratin 6A (KRT6A) and interleukin 8 (IL8), which presented a
degree of connectivity of 8 (Table
II).
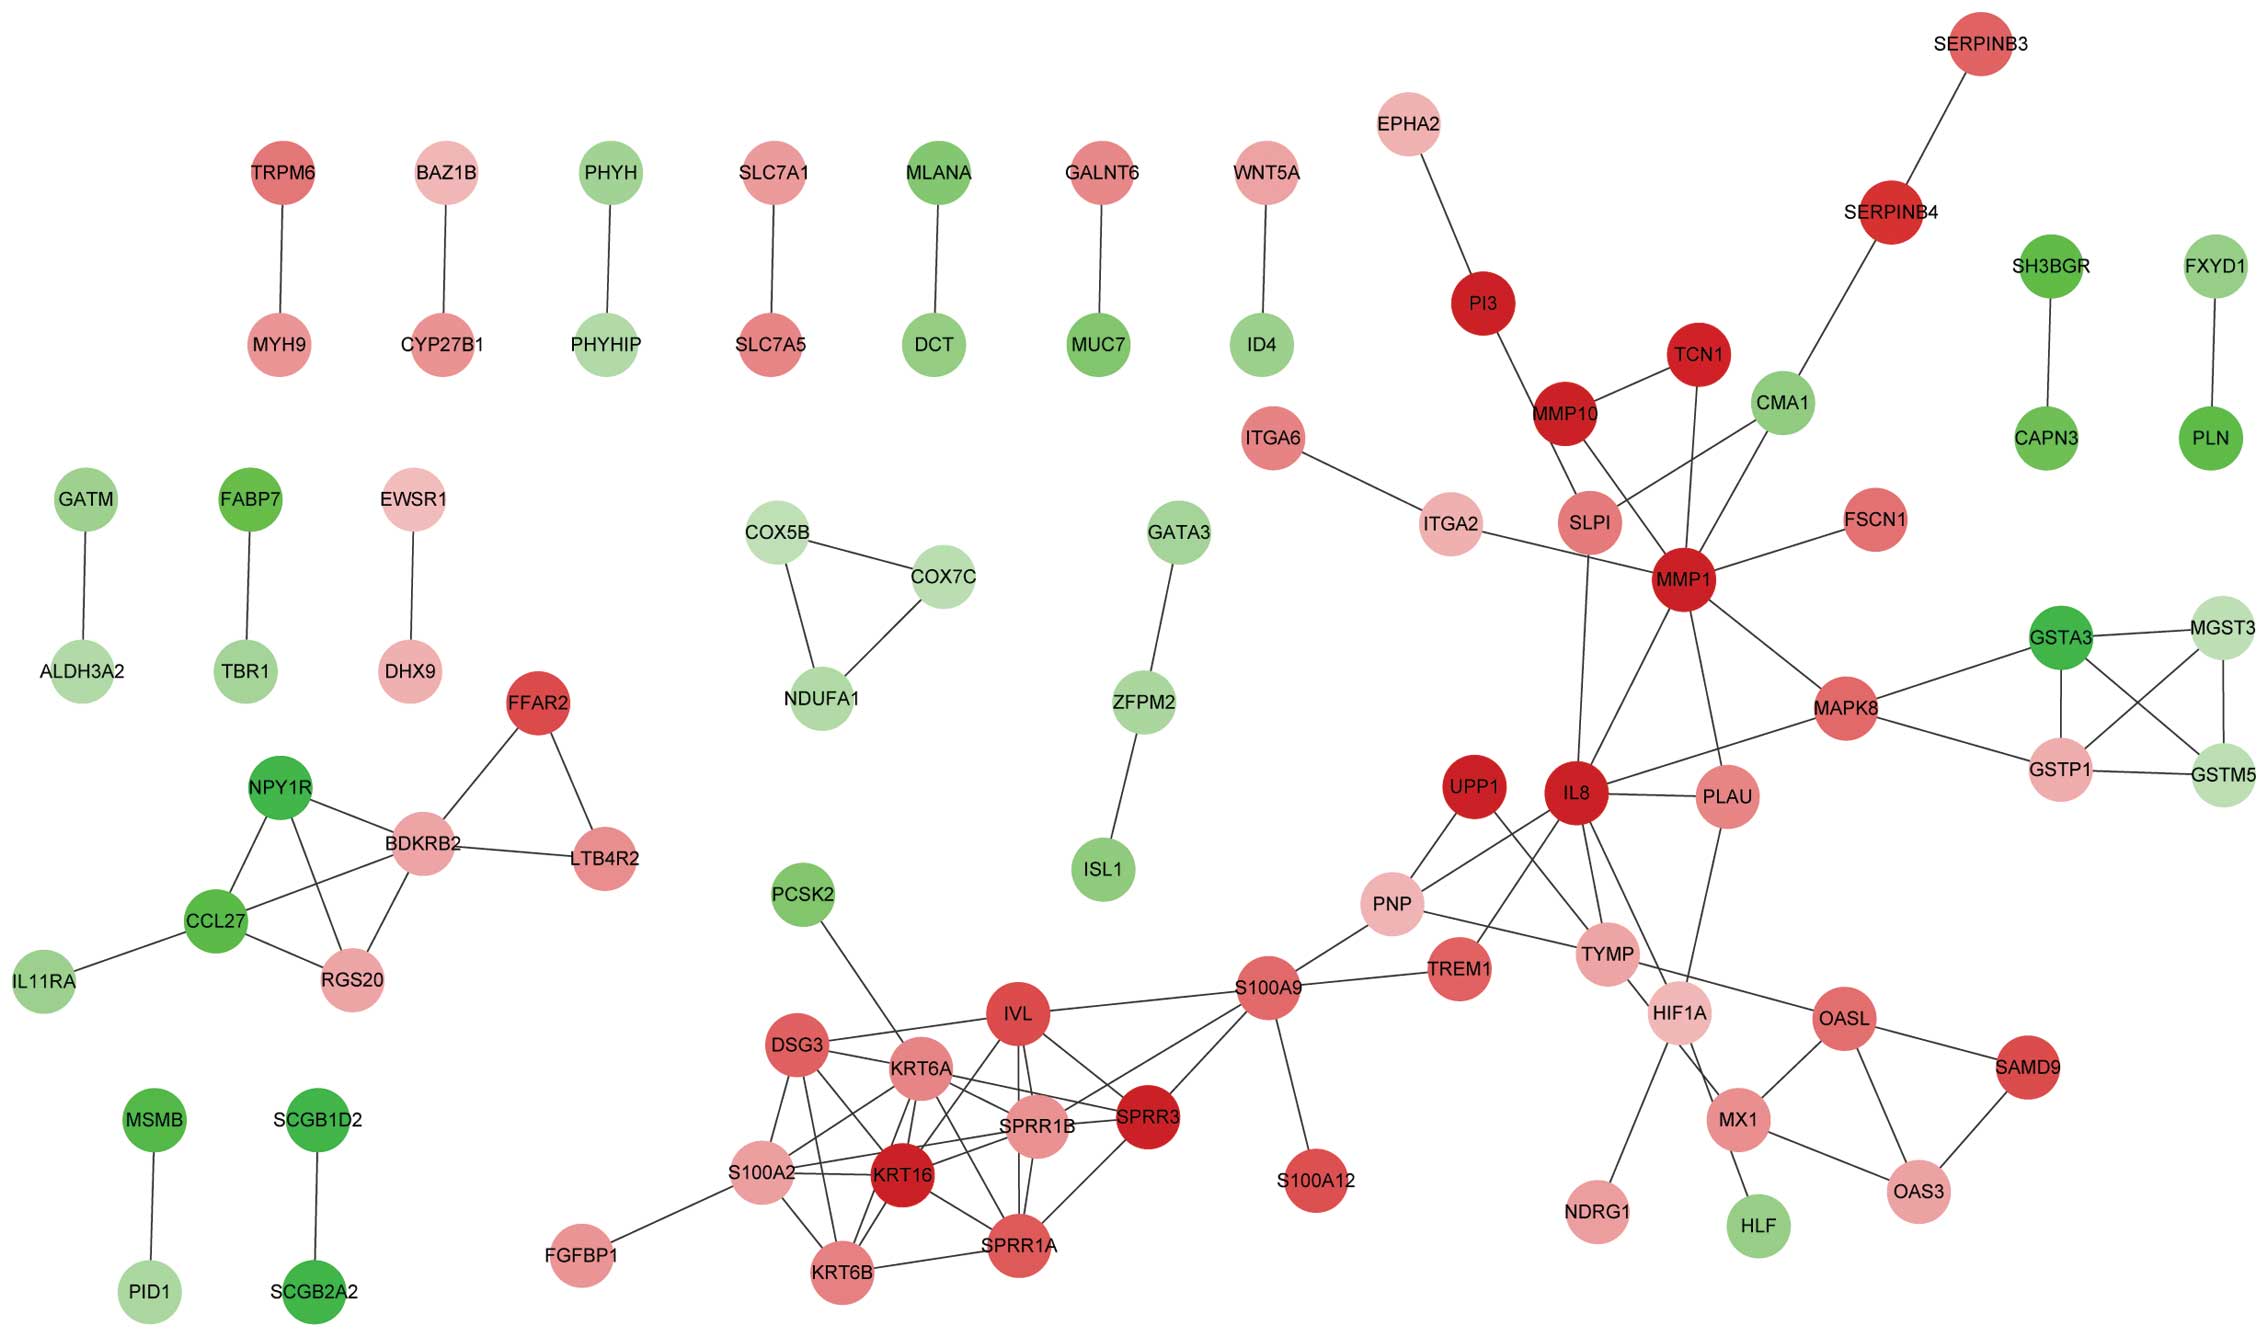 | Figure 1.Constructed protein-protein
interaction network of DEGs. Red, upregulated DEGs. Green,
downregulated DEGs. DEGs, differentially expressed genes; ALDH3A2,
aldehyde dehydrogenase 3 family, member A2; BAZ1B, bromodomain
adjacent to zinc finger domain, 1B; BDKRB2, bradykinin receptor B2;
CAPN3, calpain 3; CCL27, chemokine (C-C motif) ligand 27; CMA1,
chymase 1, mast cell; COX5B, cytochrome c oxidase subunit
5B; COX7C, COX 7C; CYP27B1, cytochrome P450, family 27, subfamily
B, polypeptide 1; DCT, dopachrome tautomerase; DSG3, desmoglein 3;
DHX9, DEAH (Asp-Glu-Ala-His) box helicase 9; EPHA2, ephrin type-A
receptor 2; EWSR1, Ewing sarcoma RNA-binding protein 1; FABP7,
fatty acid binding protein 7, brain; FFAR2, free fatty acid
receptor 2; FGFBP1, fibroblast growth factor binding protein 1;
FSCN1, fascin actin-bundling protein 1; FXYD1, FXYD domain
containing ion transport regulator 1; GALNT6, polypeptide
N-acetylgalactosaminyltransferase 6; GATA3, GATA binding protein 3;
GATM, glycine amidinotransferase (L-arginine:glycine
amidinotransferase); GSTA3, glutathione S-transferase alpha 3;
GSTM5, GST Mu 5; GSTP1, GST Pi 1; HIF1A, hypoxia-inducible factor
1, alpha subunit; HLF, hepatic leukemia factor; ID4, inhibitor of
DNA binding 4, dominant negative helix-loop-helix protein; IL8,
interleukin 8; IL11RA, IL 11 receptor, alpha; ISL1, ISL LIM
homeobox 1; ITGA2, integrin alpha 2; ITGA6, ITGA 6; IVL,
involucrin; KRT6A, keratin 6A; KRT6B, KRT 6B; KRT16, KRT 16;
LTB4R2, leukotriene B4 receptor 2; MAPK8, mitogen-activated protein
kinase 8; MGST3, microsomal GST 3; MLANA, melan-A; MMP1, matrix
metallopeptidase 1; MMP10, MMP 10; MSMB, microseminoprotein, beta-;
MUC7, mucin 7, secreted; MX1, Mx dynamin-like guanosine
triphosphate hydrolase 1; MYH9, myosin, heavy chain 9, non-muscle;
NDRG1, N-myc downstream regulated 1; NDUFA1, nicotinamide adenine
dinucleotide hydrogen dehydrogenase (ubiquinone) 1 alpha
subcomplex; NPY1R, neuropeptide Y receptor Y1; OAS3,
2′-5′-oligoadenylate synthetase 3; OASL, OAS-like; PI3, peptidase
inhibitor 3, skin derived; PID1, phosphotyrosine interaction domain
containing 1; PLAU, plasminogen activator, urokinase; PLN,
phospholamban; PNP, purine nucleoside phosphorylase; PHYH,
phytanoyl-CoA 2-hydroxylase; PHYHIP, PHYH interacting protein;
RGS20, regulator of G protein signaling 20; S100A2, S100
calcium-binding protein A2; S100A9, S100A 9; S100A12, S100A 12;
SAMD9, sterile alpha motif domain containing 9; SCGB1D2,
secretoglobin, family 1D, member 2; SCGB2A2, SCGB, family 2A,
member 2; SERPINB3, serpin peptidase inhibitor, clade B
(ovalbumin), member 3; SERPINB4, SERPINB 4; SH3BGR, SH3 domain
binding glutamate-rich protein; SLC7A1, solute carrier family 7
(cationic amino acid transporter, Y+ system), member 1; SLC7A5,
SLC7A 5; SLPI, secretory leukocyte protease inhibitor; SPRR1A,
small proline-rich protein 1A; SPRR1B, SPRR 1B; SPRR3, SPRR 3;
TBR1, T-box, brain, 1; TCN1, transcobalamin I (vitamin B12 binding
protein, R binder family); TREM1, triggering receptor expressed on
myeloid cells 1; TRPM6, transient receptor potential cation
channel, subfamily M, member 6; TYMP, thymidine phosphorylase;
UPP1, uridine phosphorylase 1; WNT5A, wingless-type mouse mammary
tumour virus integration site family, member 5A; ZFPM2, zinc finger
protein, FOG family member 2. |
| Table II.Statistical analysis of the degrees
of connectivity corresponding to the most significant hub genes
identified in the protein-protein interaction network and
subnetwork. |
Table II.
Statistical analysis of the degrees
of connectivity corresponding to the most significant hub genes
identified in the protein-protein interaction network and
subnetwork.
| Gene | Degree of
connectivity | Adjusted
P-value |
|---|
| MMP1 | 8 | 0.012 |
| KRT6A | 8 | 0.028 |
| IL8 | 8 | 0.005 |
| SPRR1B | 7 | 0.031 |
| KRT16 | 7 | 0.001 |
| SPRR1A | 6 | 0.012 |
| IVL | 6 | 0.015 |
| S100A9 | 6 | 0.028 |
| S100A2 | 6 | 0.014 |
Subnetwork identification and
functional enrichment analysis
As represented in Fig.
2, 43 nodes, 75 protein pairs and 9 hub proteins with a degree
≥6 were identified in the subnetwork. The hub proteins, including
IL8, MMP1 and KRT6A, are summarized in Table II.
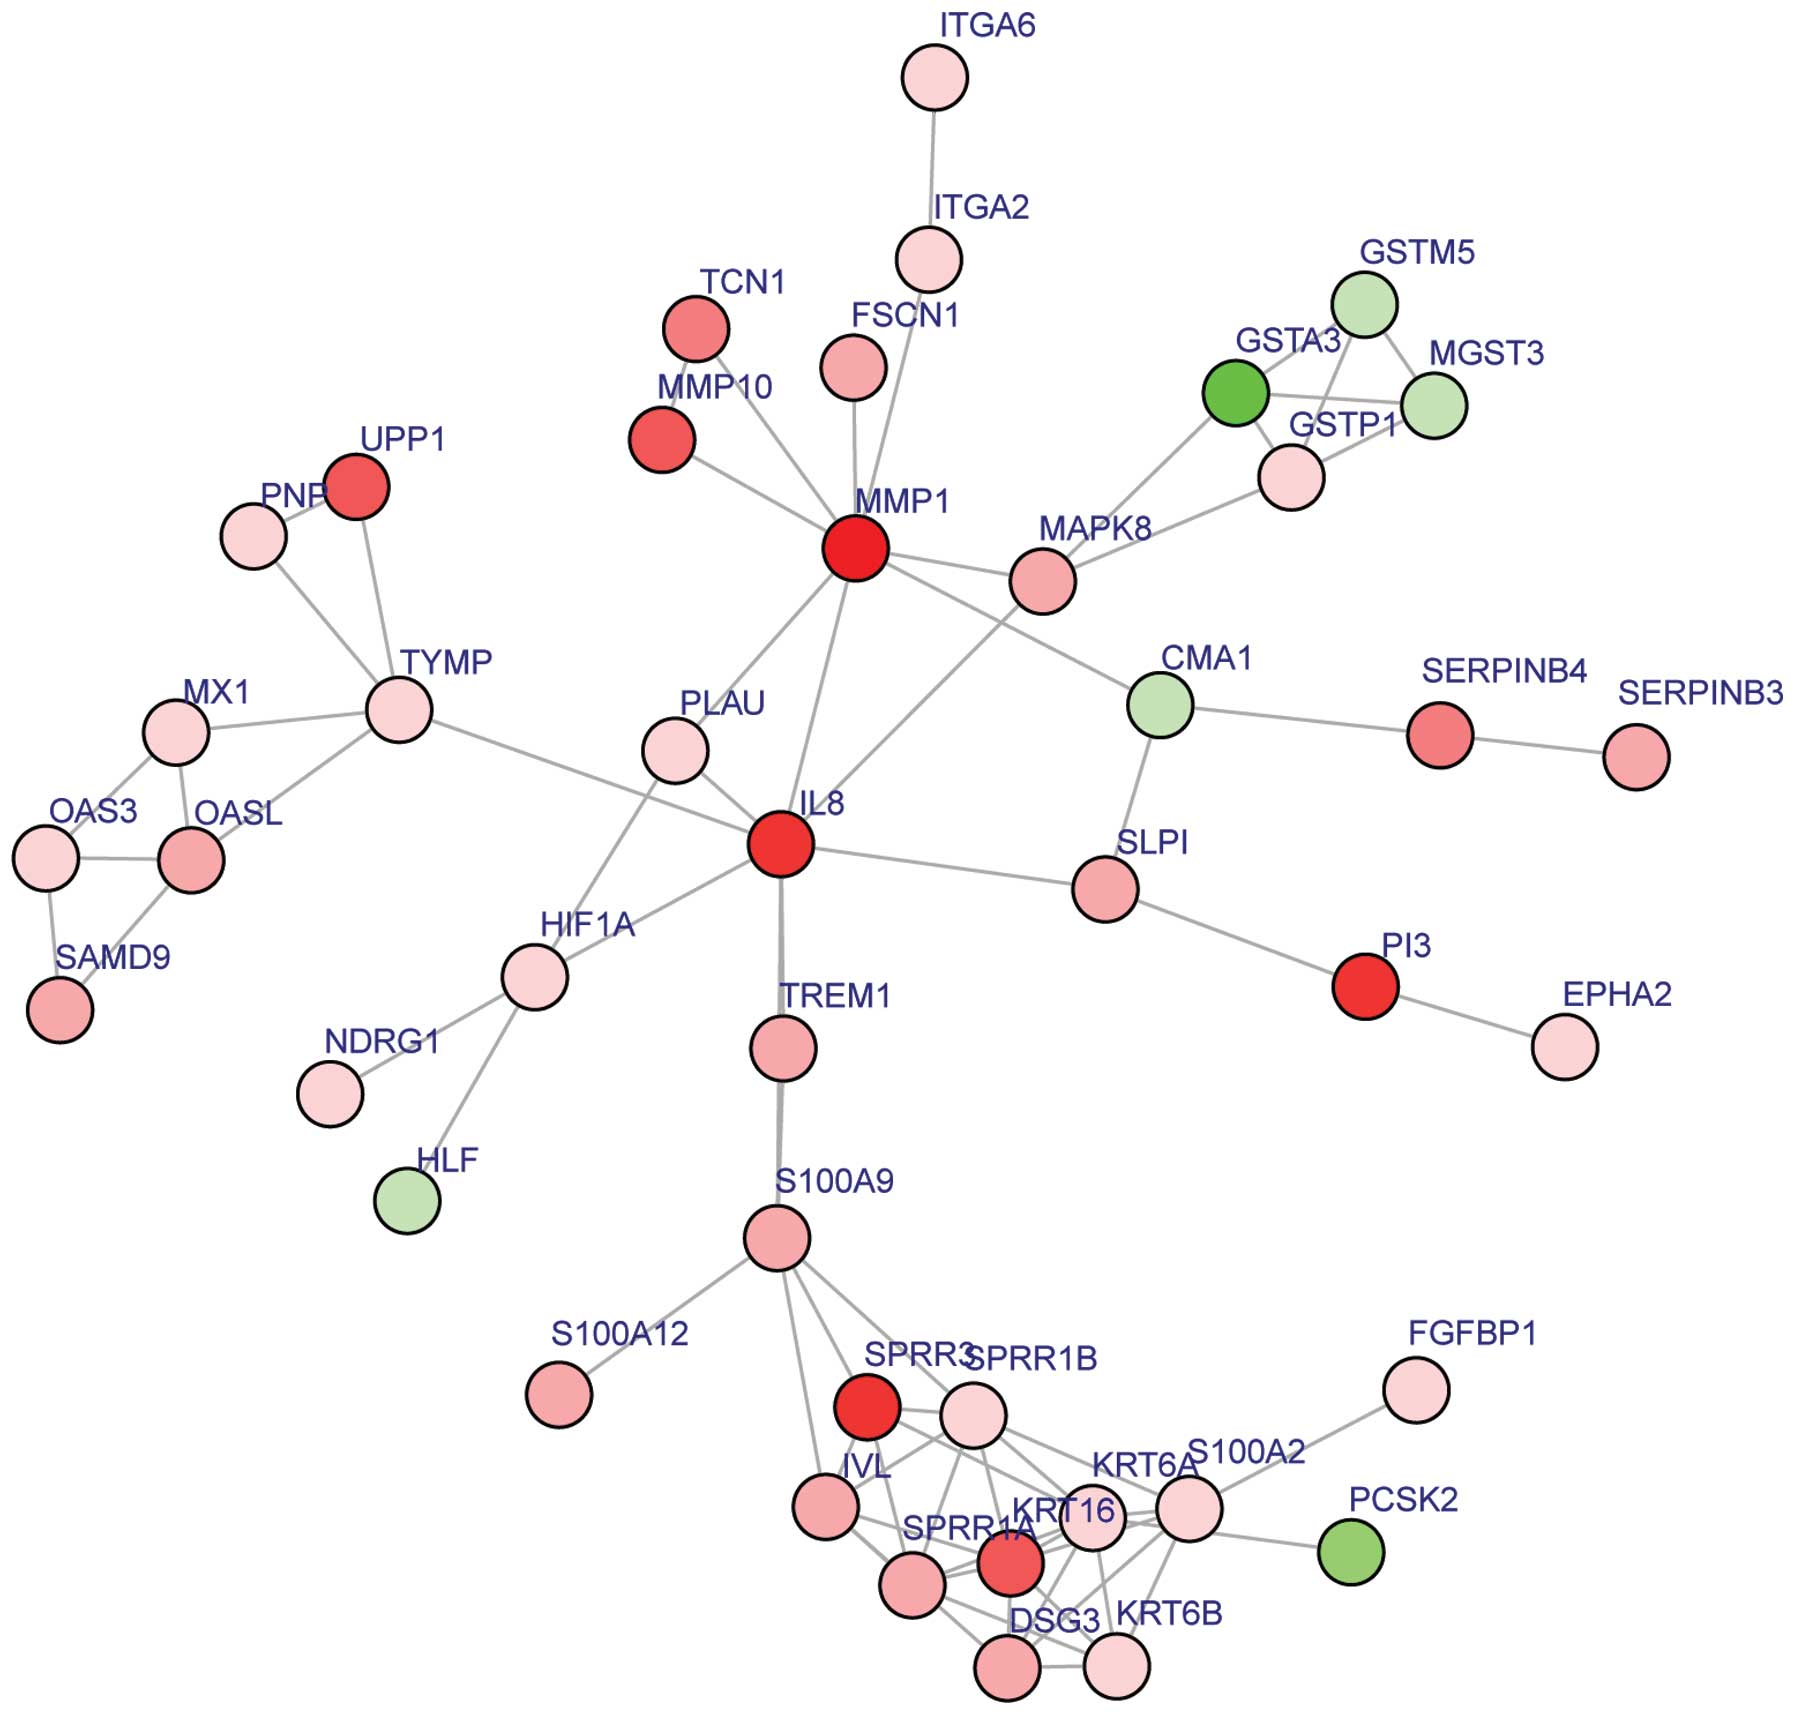 | Figure 2.Constructed subnetwork of DEGs. Red,
upregulated DEGs. Green, downregulated DEGs. DEGs, differentially
expressed genes; CMA1, chymase 1, mast cell; DSG3, desmoglein 3;
EPHA2, ephrin type-A receptor 2; FGFBP1, fibroblast growth factor
binding protein 1; FSCN1, fascin actin-bundling protein 1; GSTA3,
glutathione S-transferase alpha 3; GSTM5, GST Mu 5; GSTP1, GST Pi
1; H1F1A, hypoxia-inducible factor 1, alpha subunit; HLF, hepatic
leukemia factor; IL8, interleukin 8; ITGA2, integrin alpha 2;
ITGA6, ITG 6; IVL, involucrin; KRT6A, keratin 6A; KRT6B, KRT 6B;
KRT16, KRT 16; MAPK8, mitogen-activated protein kinase 8; MGST3,
microsomal GST 3; MMP1, matrix metallopeptidase 1; MMP10, MMP 10;
MX1, Mx dynamin-like guanosine triphosphate hydrolase 1; NDRG1,
N-myc downstream regulated 1; PCSK2, proprotein convertase
subtilisin/kexin type 2; PI3, peptidase inhibitor 3, skin derived;
OAS3, 2′-5′-oligoadenylate synthetase 3; OASL, OAS-like; PLAU,
plasminogen activator, urokinase; PNP, purine nucleoside
phosphorylase; S100A2, S100 calcium-binding protein A2; S100A9,
S100A 9; S100A12, S100A 12; SAMD9, sterile alpha motif domain
containing 9; SERPINB3, serpin peptidase inhibitor, clade B
(ovalbumin), member 3; SERPINB4, SERPIN 4; SLPI, secretory
leukocyte protease inhibitor; SPRR1A, small proline-rich protein
1A; SPRR1B, SPRR 1B; SPRR3, SPRR 3; TCN1, transcobalamin I (vitamin
B12 binding protein, R binder family); TREM1, triggering receptor
expressed on myeloid cells 1; TYMP, thymidine phosphorylase; UPP1,
uridine phosphorylase 1. |
Using heat maps (Figs.
3 and 4), the association between
DEGs and BPs/signaling pathways was evaluated. For example,
integrin alpha (ITGA)6 and 2 were observed to be enriched in
several BPs terms, including extracellular matrix (ECM)-receptor
interaction and regulation of the KEGG signaling pathways of cell
and focal adhesion.
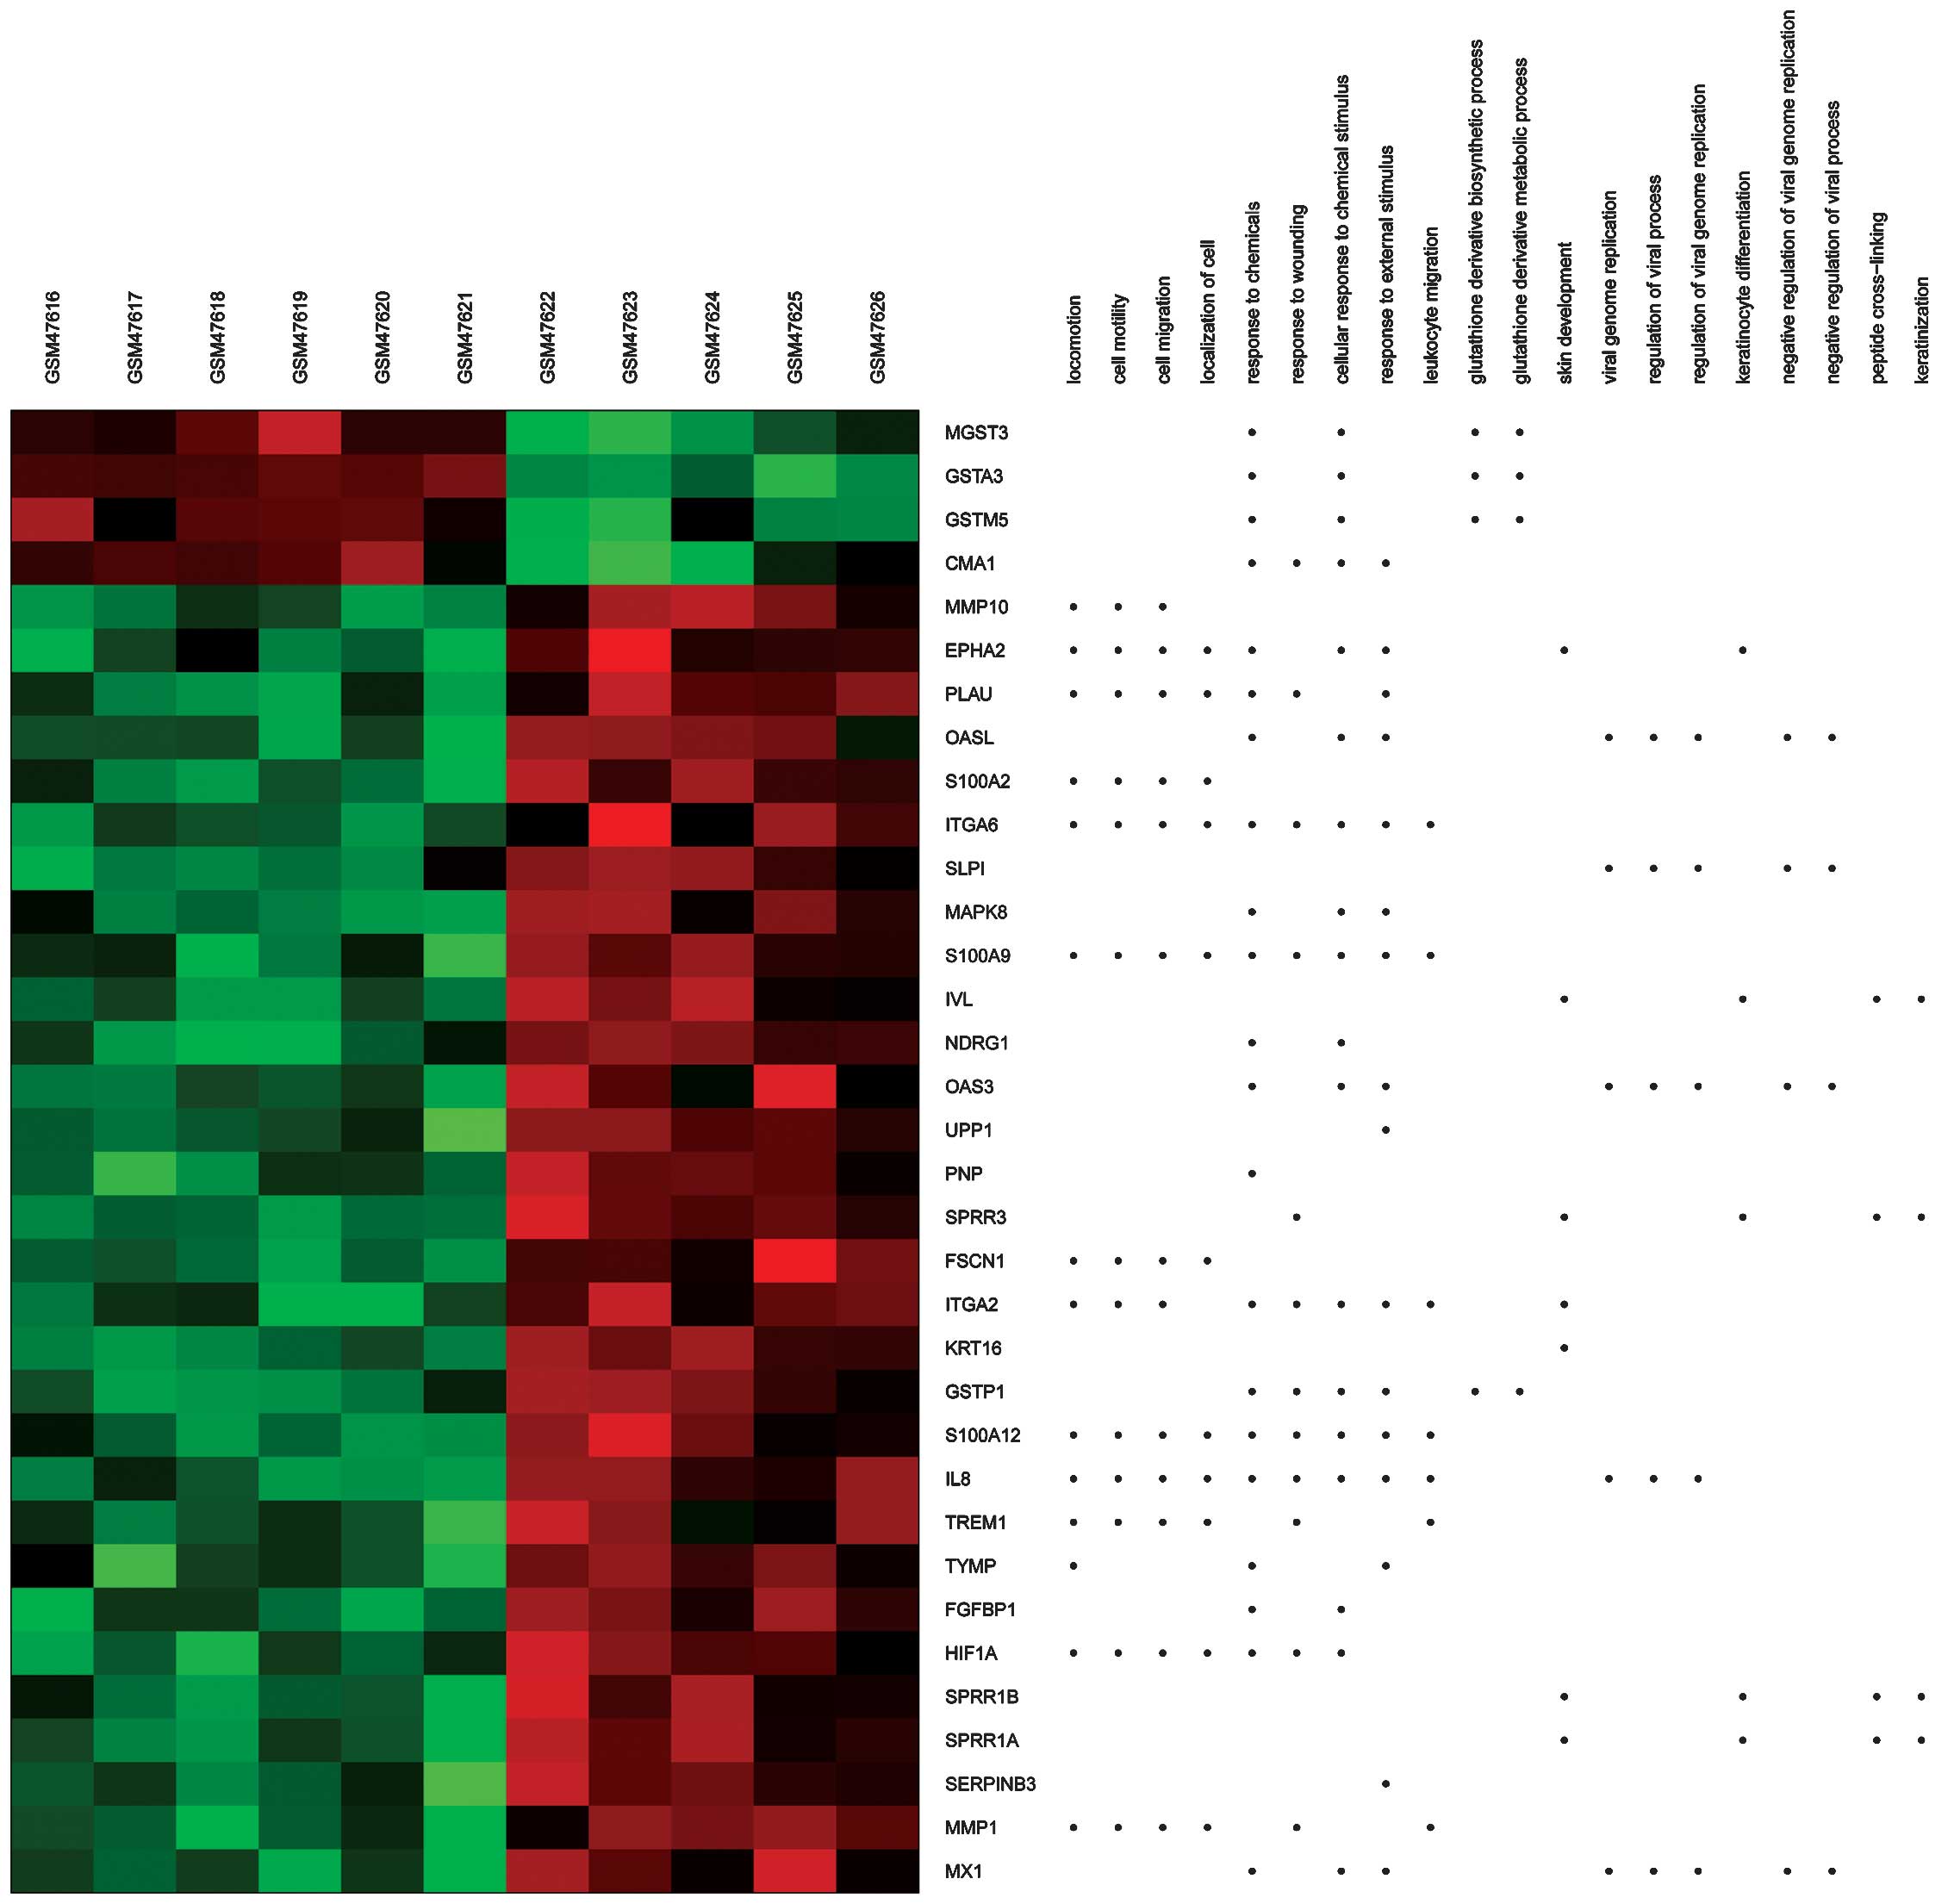 | Figure 3.Heat map of Gene Ontology BPs
generated via GeneAnswers. The dots indicate the BPs enriched by
DEGs. Red, upregulated DEGs. Green, downregulated DEGs. BPs,
biological processes; DEGs, differentially expressed genes; GSM,
genome-scale model; CMA1, chymase 1, mast cell; EPHA2, ephrin
type-A receptor 2; FGFBP1, fibroblast growth factor binding protein
1; FSCN1, fascin actin-bundling protein 1; GSTA3, glutathione
S-transferase alpha 3; GSTM5, GST Mu 5; GSTP1, GST Pi 1; HIF1A,
hypoxia-inducible factor 1, alpha subunit; IL8, interleukin 8;
ITGA2, integrin alpha 2; ITGA6, ITGA 6; IVL, involucrin; KRT16,
keratin 16; MAPK8, mitogen-activated protein kinase 8; MGST3,
microsomal GST 3; MMP1, matrix metallopeptidase 1; MMP10, MMP 10;
MX1, Mx dynamin-like guanosine triphosphate hydrolase 1; NDRG1,
N-myc downstream regulated 1; PLAU, plasminogen activator,
urokinase; PNP, purine nucleoside phosphorylase; OAS3,
2′-5′-oligoadenylate synthetase 3; OASL, OAS-like; S100A2, S100
calcium-binding protein A2; S100A9, S100A 9; S100A12, S100A 12;
SERPINB3, serpin peptidase inhibitor, clade B (ovalbumin), member
3; SLPI, secretory leukocyte protease inhibitor; SPRR1A, small
proline-rich protein 1A; SPRR3, SPRR 3; TREM1, triggering receptor
expressed on myeloid cells 1; TYMP, thymidine phosphorylase; UPP1,
uridine phosphorylase 1. |
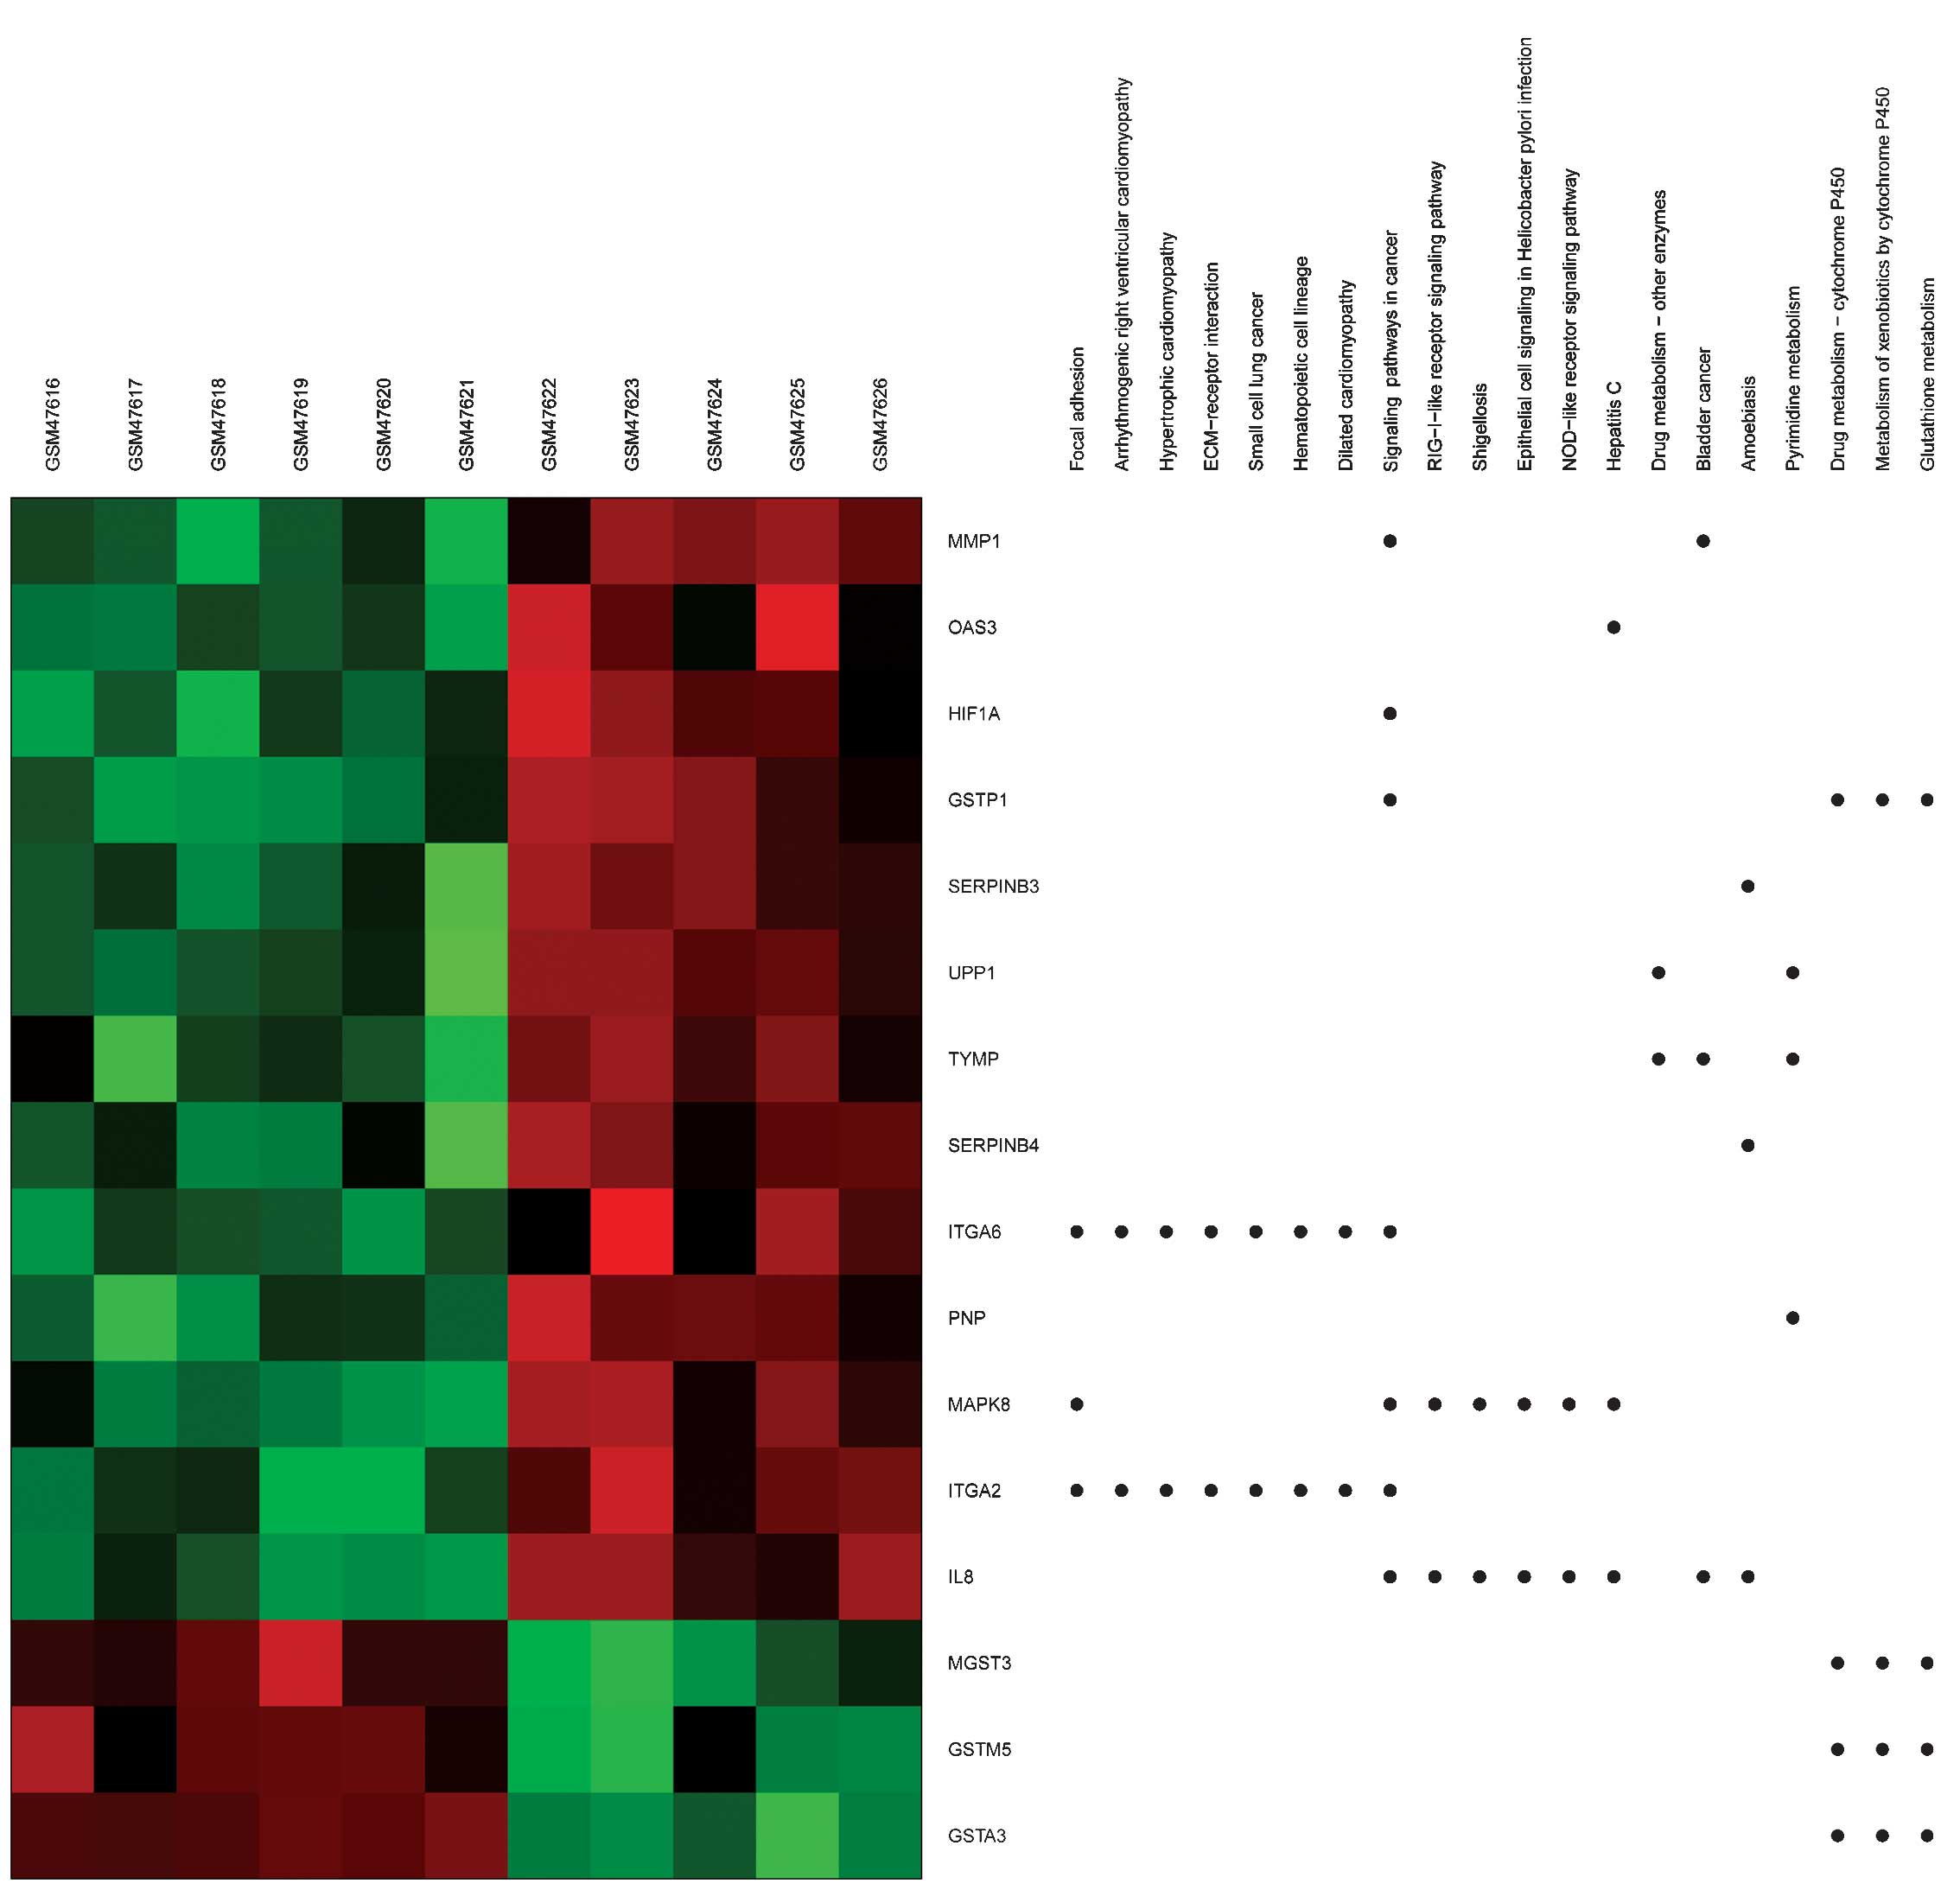 | Figure 4.Heat map of Kyoto Encyclopedia of
Genes and Genomes generated via GeneAnswers. The dots indicate the
signaling pathways enriched by DEGs. Red, upregulated DEGs. Green,
downregulated DEGs. DEGs, differentially expressed genes; ECM,
extracellular matrix; GSM, genome-scale model; GSTA3, glutathione
S-transferase alpha 3; GSTM5, GST Mu 5; GSTP1, GST Pi 1; HIF1A,
hypoxia-inducible factor 1, alpha subunit; IL8, interleukin 8;
ITGA2, integrin alpha 2; ITGA6, ITGA 6; MAPK8, mitogen-activated
protein kinase 8; MGST3, microsomal GST 3; MMP1, matrix
metallopeptidase 1; NOD, nucleotide-binding oligomerization; OAS3,
2′-5′-oligoadenylate synthetase 3; PNP, purine nucleoside
phosphorylase; RIG-I, retinoic acid-inducible gene 1; SERPINB3,
serpin peptidase inhibitor, clade B (ovalbumin), member 3;
SERPINB4, SERPINB 4; TYMP, thymidine phosphorylase; UPP1, uridine
phosphorylase 1. |
Discussion
SCC is characterized by a high rate of proliferation
and nodal metastasis (24).
Therefore, early detection or prevention of this disease may be the
most effective approach to improve patients' prognosis. In the
present study, a total of 181 DEGs that were differently expressed
in SCC vs. NO samples were identified via the gene expression
profile contained in GSE2503. The upregulated DEGs were enriched in
BPs terms associated with cell adhesion and cancer signaling
pathways. In the constructed PPI network and subnetwork, the hub
genes MMP1 and IL8 presented the highest degree of
connectivity. Additionally, ITGA6 and ITGA2 were
enriched in several pathways and GO BPs terms in the subnetworks.
These results suggested that the above genes and signaling pathways
may participate in the progression of SCC.
Cell adhesion is a common event in BPs (23). Alterations in the expression levels of
cell-cell adhesion molecules have been previously proposed to
contribute to the progression of malignant tumors (25). In the present study, IL8, one
of the hub genes with the highest degree of connectivity, was
observed to be enriched in the BP of cell adhesion. IL8 is a
proinflammatory cytokine that promotes chemotaxis and degranulation
in neutrophils (26). Overexpression
of IL8 or its receptors has been previously observed in cancer
cells, endothelial cells and tumor-associated macrophages,
suggesting a regulatory function for IL8 within the tumor
microenvironment (26). Notably, IL8
has been previously reported to be able to stimulate cellular
proliferation and angiogenesis in head and neck SCC by acting in an
autocrine or paracrine manner (27).
Additionally, a previous study on cultured oropharyngeal SCC lines
has suggested that the overexpression of IL8 may enhance the
pathogenicity of oropharyngeal SCC by promoting cell growth
(28). Therefore, IL8 and the
signaling pathways associated with cell adhesion appear to be
closely connected with SCC, and they may be used as potential
targets for the treatment of SCC.
Using the PPI networks and subnetworks constructed
in the present study, MMP1 was identified as one of the hub
genes exhibiting the highest degree of connectivity. Additionally,
MMP1 was observed to be enriched in signaling pathways
associated with cancer. MMP1 belongs to the MMP family, and
participates in a variety of BPs, including cell proliferation,
differentiation, migration, apoptosis and host defense (29). MMP1 has been previously associated
with cancer invasion and metastasis, since it degrades fibrillar
collagens, thus enabling the tumor to traverse the extracellular
space (29). Notably, MMP1 is
frequently detected in various types of cancer, and may be
associated with advanced stages of the disease (30). For example, MMP1 appears to be
overexpressed in skin cancer, according to the studies by Nindl
et al (7). Taken together,
these data support the hypothesis that MMP1 is a candidate
molecular marker associated with SCC.
In the present study, the TF HIF1A was
identified to be overexpressed in SCC. HIF1A functions as a
TF in response to cellular hypoxia, and participates in BPs
associated with tumor angiogenesis and pathophysiology of ischemic
disease (31). It has been previously
reported that HIF1A may be a predictor of disease
progression in esophageal SCC (32).
Fillies et al (33) suggested
that the overexpression of HIF1A may be an indicator of favorable
prognosis in SCC of the oral cavity. Accordingly, HIF1A may
be an important TF associated with SCC.
The present study also revealed that ITGA6
and ITGA2 were enriched in several GO BPs terms, including
regulation of cell adhesion and migration, and KEGG signaling
pathways of focal adhesion and ECM-receptor interaction. The
protein product of the ITGA6 gene is the integrin alpha
chain alpha 6 (34). Integrins have a
significant role in cell adhesion and migration (34), and different combinations of integrins
act as receptors of certain ECM proteins (35). Integrins participate in a number of
BPs (including cell adhesion, cell migration, blood clotting and
tissue organization) and cancer processes (including cell
migration, metastasis and invasion) (34). ITGA6 interacts with the ECM protein
laminin, and is involved in the regulation of cell adhesion, growth
and migration (36). The role of
ITGA6 in cancer development has been widely documented. Friedrichs
et al (37) observed that the
overexpression of ITGA6 was associated with unfavorable prognosis
in patients with breast cancer. In addition, previous studies have
reported that ITGA6 is highly expressed in esophageal SCC tissues
and participates in the tumorigenesis of esophageal SCC (38). Therefore, ITGA6 may be a
potential target gene for the treatment of SCC. Notably,
ITGA2 encodes a cell adhesion molecule termed α2β1 integrin
receptor, which enables the interaction of the cells with the ECM
and mediates the signaling events occurring within the ECM
(39). Recent studies have indicated
that the ITGA2 gene is associated with various types of
cancer, including colorectal (40)
and breast cancer (41). In addition,
Beaulieu (42) reported that ITGA2
was expressed in colon cancer cell lines, and participated in the
proliferation and migration of these cells. There are limited
studies on the effects of ITGA2 on SCC thus far (42). However, it may be speculated that
ITGA2 may be a key gene, along with ITGA6, in the
progression of SCC.
In conclusion, the results of the present study
provide a comprehensive bioinformatics analysis of DEGs that may be
involved in SCC. The results of the current study may contribute to
understand the underlying molecular mechanisms that lead to SCC.
Furthermore, the DEGs identified in the present study, including
IL8, MMP1, HIF1A, ITGA6 and ITGA2, and certain
signaling pathways associated with focal adhesion and ECM-receptor
interaction, may be potential targets for the diagnosis and
treatment of SCC.
However, the present study has a number of
limitations. Thus, the size of the sample employed in the
microarray analysis was small, which may generate a high number of
false positive results. Additionally, the present study lacked
experimental verification. Therefore, further genetic and
experimental studies with larger sample sizes are required to
confirm the findings of the present study.
Acknowledgements
The authors would like to thank FengHe (ShangHai)
Information Technology Co., Ltd. (Shanghai, China) for their advice
and support.
References
|
1
|
Rudolph R and Zelac DE: Squamous cell
carcinoma of the skin. Plast Reconstr Surg. 114:82e–94e. 2004.
View Article : Google Scholar : PubMed/NCBI
|
|
2
|
Joshi SK, Bhadauria RS, Jadon G and
Diwaker AK: Introduction to neoplasm: ‘Tumor classificatio’/. A
review article. IJARPB. 2:227–263. 2012.
|
|
3
|
Padilla RS, Sebastian S, Jiang Z, Nindl I
and Larson R: Gene expression patterns of normal human skin,
actinic keratosis, and squamous cell carcinoma: A spectrum of
disease progression. Arch Dermatol. 146:288–293. 2010. View Article : Google Scholar : PubMed/NCBI
|
|
4
|
Diepgen TL and Mahler V: The epidemiology
of skin cancer. Br J Dermatol. 146(Suppl 61): S1–S6. 2002.
View Article : Google Scholar
|
|
5
|
Armstrong BK and Kricker A: The
epidemiology of UV induced skin cancer. J Photochem Photobiol B.
63:8–18. 2001. View Article : Google Scholar : PubMed/NCBI
|
|
6
|
Owens P, Engelking E, Han G, Haeger SM and
Wang XJ: Epidermal Smad4 deletion results in aberrant wound
healing. Am J Pathol. 176:122–133. 2010. View Article : Google Scholar : PubMed/NCBI
|
|
7
|
Nindl I, Dang C, Forschner T, Kuban RJ,
Meyer T, Sterry W and Stockfleth E: Identification of
differentially expressed genes in cutaneous squamous cell carcinoma
by microarray expression profiling. Mol Cancer. 5:302006.
View Article : Google Scholar : PubMed/NCBI
|
|
8
|
Streit M, Velasco P, Brown LF, Skobe M,
Richard L, Riccardi L, Lawler J and Detmar M: Overexpression of
thrombospondin-1 decreases angiogenesis and inhibits the growth of
human cutaneous squamous cell carcinomas. Am J Pathol. 155:441–452.
1999. View Article : Google Scholar : PubMed/NCBI
|
|
9
|
Snijders AM, Schmidt BL, Fridlyand J,
Dekker N, Pinkel D, Jordan RC and Albertson DG: Rare amplicons
implicate frequent deregulation of cell fate specification pathways
in oral squamous cell carcinoma. Oncogene. 24:4232–4242. 2005.
View Article : Google Scholar : PubMed/NCBI
|
|
10
|
Irizarry RA, Hobbs B, Collin F,
Beazer-Barclay YD, Antonellis KJ, Scherf U and Speed TP:
Exploration, normalization, and summaries of high density
oligonucleotide array probe level data. Biostatistics. 4:249–264.
2003. View Article : Google Scholar : PubMed/NCBI
|
|
11
|
Diboun I, Wernisch L, Orengo CA and
Koltzenburg M: Microarray analysis after RNA amplification can
detect pronounced differences in gene expression using limma. BMC
Genomics. 7:2522006. View Article : Google Scholar : PubMed/NCBI
|
|
12
|
Benjamini Y and Hochberg Y: Controlling
the false discovery rate: A practical and powerful approach to
multiple testing. J R Stat Soc Series B Stat Methodol. 57:289–300.
1995.
|
|
13
|
Ashburner M, Ball CA, Blake JA, Botstein
D, Butler H, Cherry JM, Davis AP, Dolinski K, Dwight SS, Eppig JT,
et al: The gene ontology consortium: Gene ontology: Tool for the
unification of biology. Nat Genet. 25:25–29. 2000. View Article : Google Scholar : PubMed/NCBI
|
|
14
|
Kanehisa M and Goto S: KEGG: Kyoto
encyclopedia of genes and genomes. Nucleic Acids Res. 28:27–30.
2000. View Article : Google Scholar : PubMed/NCBI
|
|
15
|
Huang DW, Sherman BT, Tan Q, Collins JR,
Alvord WG, Roayaei J, Stephens R, Baseler MW, Lane HC and Lempicki
RA: The DAVID Gene Functional Classification Tool: A novel
biological module-centric algorithm to functionally analyze large
gene lists. Genome Biol. 8:R1832007. View Article : Google Scholar : PubMed/NCBI
|
|
16
|
Zhao M, Sun J and Zhao Z: TSGene: A web
resource for tumor suppressor genes. Nucleic Acids Res. 41(D1):
D970–D976. 2013. View Article : Google Scholar : PubMed/NCBI
|
|
17
|
Chen JS, Hung WS, Chan HH, Tsai SJ and Sun
HS: In silico identification of oncogenic potential of
fyn-related kinase in hepatocellular carcinoma. Bioinformatics.
29:420–427. 2013. View Article : Google Scholar : PubMed/NCBI
|
|
18
|
von Mering C, Huynen M, Jaeggi D, Schmidt
S, Bork P and Snel B: STRING: A database of predicted functional
associations between proteins. Nucleic Acids Res. 31:258–261. 2003.
View Article : Google Scholar : PubMed/NCBI
|
|
19
|
Yook SH, Oltvai ZN and Barabási AL:
Functional and topological characterization of protein interaction
networks. Proteomics. 4:928–942. 2004. View Article : Google Scholar : PubMed/NCBI
|
|
20
|
Shannon P, Markiel A, Ozier O, Baliga NS,
Wang JT, Ramage D, Amin N, Schwikowski B and Ideker T: Cytoscape: A
software environment for integrated models of biomolecular
interaction networks. Genome Res. 13:2498–2504. 2003. View Article : Google Scholar : PubMed/NCBI
|
|
21
|
He X and Zhang J: Why do hubs tend to be
essential in protein networks? PLoS Genet. 2:e882006. View Article : Google Scholar : PubMed/NCBI
|
|
22
|
Beisser D, Klau GW, Dandekar T, Müller T
and Dittrich MT: BioNet: An R-Package for the functional analysis
of biological networks. Bioinformatics. 26:1129–1130. 2010.
View Article : Google Scholar : PubMed/NCBI
|
|
23
|
Feng G, Du P, Krett NL, Tessel M, Rosen S,
Kibbe WA and Lin SM: A collection of bioconductor methods to
visualize gene-list annotations. BMC Res Notes. 3:102010.
View Article : Google Scholar : PubMed/NCBI
|
|
24
|
Wong TS, Liu XB, Wong BY, Ng RW, Yuen AP
and Wei WI: Mature miR-184 as potential oncogenic microRNA of
squamous cell carcinoma of tongue. Clin Cancer Res. 14:2588–2592.
2008. View Article : Google Scholar : PubMed/NCBI
|
|
25
|
Birchmeier W, Weidner KM, Hülsken J and
Behrens J: Molecular mechanisms leading to cell junction (cadherin)
deficiency in invasive carcinomas. Semin Cancer Biol. 4:231–239.
1993.PubMed/NCBI
|
|
26
|
Waugh DJ and Wilson C: The interleukin-8
pathway in cancer. Clin Cancer Res. 14:6735–6741. 2008. View Article : Google Scholar : PubMed/NCBI
|
|
27
|
Richards BL, Eisma RJ, Spiro JD, Lindquist
RL and Kreutzer DL: Coexpression of interleukin-8 receptors in head
and neck squamous cell carcinoma. Am J Surg. 174:507–512. 1997.
View Article : Google Scholar : PubMed/NCBI
|
|
28
|
Smith DR, Polverini PJ, Kunkel SL,
Orringer MB, Whyte RI, Burdick MD, Wilke CA and Strieter RM:
Inhibition of interleukin 8 attenuates angiogenesis in bronchogenic
carcinoma. J Exp Med. 179:1409–1415. 1994. View Article : Google Scholar : PubMed/NCBI
|
|
29
|
Kurahara S, Shinohara M, Ikebe T, Nakamura
S, Beppu M, Hiraki A, Takeuchi H and Shirasuna K: Expression of
MMPS, MT-MMP, and TIMPs in squamous cell carcinoma of the oral
cavity: Correlations with tumor invasion and metastasis. Head Neck.
21:627–638. 1999. View Article : Google Scholar : PubMed/NCBI
|
|
30
|
Tsuchiya N, Narita S, Kumazawa T, Inoue T,
Ma Z, Tsuruta H, Saito M, Horikawa Y, Yuasa T, Satoh S, et al:
Clinical significance of a single nucleotide polymorphism and
allelic imbalance of matrix metalloproteinase-1 promoter region in
prostate cancer. Oncol Rep. 22:493–499. 2009. View Article : Google Scholar : PubMed/NCBI
|
|
31
|
Semenza GL: HIF-1: Mediator of
physiological and pathophysiological responses to hypoxia. J Appl
Physiol (1985). 88:1474–1480. 2000.PubMed/NCBI
|
|
32
|
Yu ZT, Zhao HF and Shang XB: Expression of
hypoxia-inducible factor-1alpha and vessel endothelial growth
factor in esophageal squamous cell carcinoma and
clinico-pathological significance thereof. Zhonghua Yi Xue Za Zhi.
88:2465–2469. 2008.(In Chinese). PubMed/NCBI
|
|
33
|
Fillies T, Werkmeister R, van Diest PJ,
Brandt B, Joos U and Buerger H: HIF1-alpha overexpression indicates
a good prognosis in early stage squamous cell carcinomas of the
oral floor. BMC Cancer. 5:842005. View Article : Google Scholar : PubMed/NCBI
|
|
34
|
Pawar SC, Demetriou MC, Nagle RB, Bowden
GT and Cress AE: Integrin alpha6 cleavage: A novel modification to
modulate cell migration. Exp Cell Res. 313:1080–1089. 2007.
View Article : Google Scholar : PubMed/NCBI
|
|
35
|
Miranti CK and Brugge JS: Sensing the
environment: A historical perspective on integrin signal
transduction. Nat Cell Biol. 4:E83–E90. 2002. View Article : Google Scholar : PubMed/NCBI
|
|
36
|
Jauliac S, López-Rodriguez C, Shaw LM,
Brown LF, Rao A and Toker A: The role of NFAT transcription factors
in integrin-mediated carcinoma invasion. Nat Cell Biol. 4:540–544.
2002. View
Article : Google Scholar : PubMed/NCBI
|
|
37
|
Friedrichs K, Ruiz P, Franke F, Gille I,
Terpe HJ and Imhof BA: High expression level of alpha 6 integrin in
human breast carcinoma is correlated with reduced survival. Cancer
Res. 55:901–906. 1995.PubMed/NCBI
|
|
38
|
Kwon J, Lee TS, Lee HW, Kang MC, Yoon HJ,
Kim JH and Park JH: Integrin alpha 6: A novel therapeutic target in
esophageal squamous cell carcinoma. Int J Oncol. 43:1523–1530.
2013.PubMed/NCBI
|
|
39
|
Gürkan A, Emingil G, Afacan B, Berdeli A
and Atilla G: Alpha 2 integrin gene (ITGA2) polymorphism in renal
transplant recipients with and without drug induced gingival
overgrowth. Arch oral biol. 59:283–288. 2014. View Article : Google Scholar : PubMed/NCBI
|
|
40
|
Gerger A, Hofmann G, Langsenlehner U,
Renner W, Weitzer W, Wehrschütz M, Wascher T, Samonigg H and Krippl
P: Integrin alpha-2 and beta-3 gene polymorphisms and colorectal
cancer risk. Int J Colorectal Dis. 24:159–163. 2009. View Article : Google Scholar : PubMed/NCBI
|
|
41
|
Langsenlehner U, Renner W, Yazdani-Biuki
B, Eder T, Wascher TC, Paulweber B, Clar H, Hofmann G, Samonigg H
and Krippl P: Integrin alpha-2 and beta-3 gene polymorphisms and
breast cancer risk. Breast Cancer Res Treat. 97:67–72. 2006.
View Article : Google Scholar : PubMed/NCBI
|
|
42
|
Beaulieu JF: Integrins and human
intestinal cell functions. Front Biosci. 4:D310–D321. 1999.
View Article : Google Scholar : PubMed/NCBI
|


