Introduction
Glioblastoma is the most common and fatal malignant
primary brain tumor in adults, with an incidence rate of 2.8 cases
per 100,000 individuals per year and a perioperative mortality rate
of 2.2% (1). It is estimated that
44,500 new cases of primary brain tumors were diagnosed in the USA
in 2005, of which glioblastoma accounted for ~20% (2). The traditional treatment method is
surgical resection combined with fractionated radiotherapy and
adjuvant chemotherapy with temozolomide (3). However, despite advances in surgical
techniques, postoperative supportive care, radiation and adjuvant
systemic chemotherapy, the 5-year survival rate of glioblastoma
remains at <10% (4). The disease
generally recurs at the resection margin, and the median survival
time is ~14 months; extremely few patients have a long-term
survival, which highlights the importance of understanding the
peripheral brain tumor region (5).
Glioblastoma cells are capable of infiltrating deep
into the surrounding tissue, which allows these cells to migrate
for long distances. This is typical behavior of neural stem cells,
from which glioblastoma cells originate (6). Previous studies have demonstrated that
malignant tumors may be affected by stromal cells, and that cancer
cells may be controlled by the microenvironment; it has been
reported that the non-neoplastic, stromal compartment of the
majority of solid cancers is involved in tumor invasion,
proliferation and metastasis (7–9).
In glioblastoma, a novel population of stromal cells
that surround the tumor, termed glioblastoma-associated stromal
cells (GASCs), has been isolated and analyzed. These cells have a
different molecular expression profile compared with that of
control stromal cells derived from non-glioblastoma peripheral
brain tissues (7). GASCs have been
revealed to have a phenotype and functional properties similar to
that of cancer-associated fibroblasts located in the stroma of
carcinomas, which are known to be important in the growth and
progression of tumors (10). However,
the genetic information concerning this novel cell population is
relatively scarce.
The aim of the present study was to analyze the
transcriptome and differentially expressed genes (DEGs) in GASCs.
Bioinformatics analysis was performed using the microarray
GSE24100, which is based on samples of GASCs and control stromal
cells. In addition, functional and pathway enrichment analysis was
performed and a protein-protein interaction (PPI) network was
constructed. A sub-network was also constructed for additional
analysis.
Materials and methods
Microarray data
Microarray data was obtained from the study by
Clavreul et al (7), which is
referenced in the Gene Expression Omnibus (GEO) database
(www.ncbi.nlm.nih.gov/geo/) under
accession number GSE24100. The microarray GSE24100 was detailed
using Whole Human Genome Microarray 4×44K (catalog no., G4112F;
design ID, 014850; Agilent Technologies, Santa Clara, CA, USA), and
the data contains a total of 7 samples, consisting of 3 control
stromal cell samples and 4 GASC samples.
Data preprocessing and DEG
analysis
Using the limma model (11) on R/Bioconductor software version
2.15.1 (www.bioconductor.org/) and the
microarray probe annotation profile from Brain Array Lab
(brainarray.mbni.med.umich.edu/Brainarray/), the
probe-level data was converted into expression measures, during
which background correction, quantile normalization and probe
summarization were performed. A t-test (12) was used to identify the significantly
expressed DEGs in GASC samples, with a combination of P<0.05 and
the |log2FC (fold change)| >1 used as the threshold.
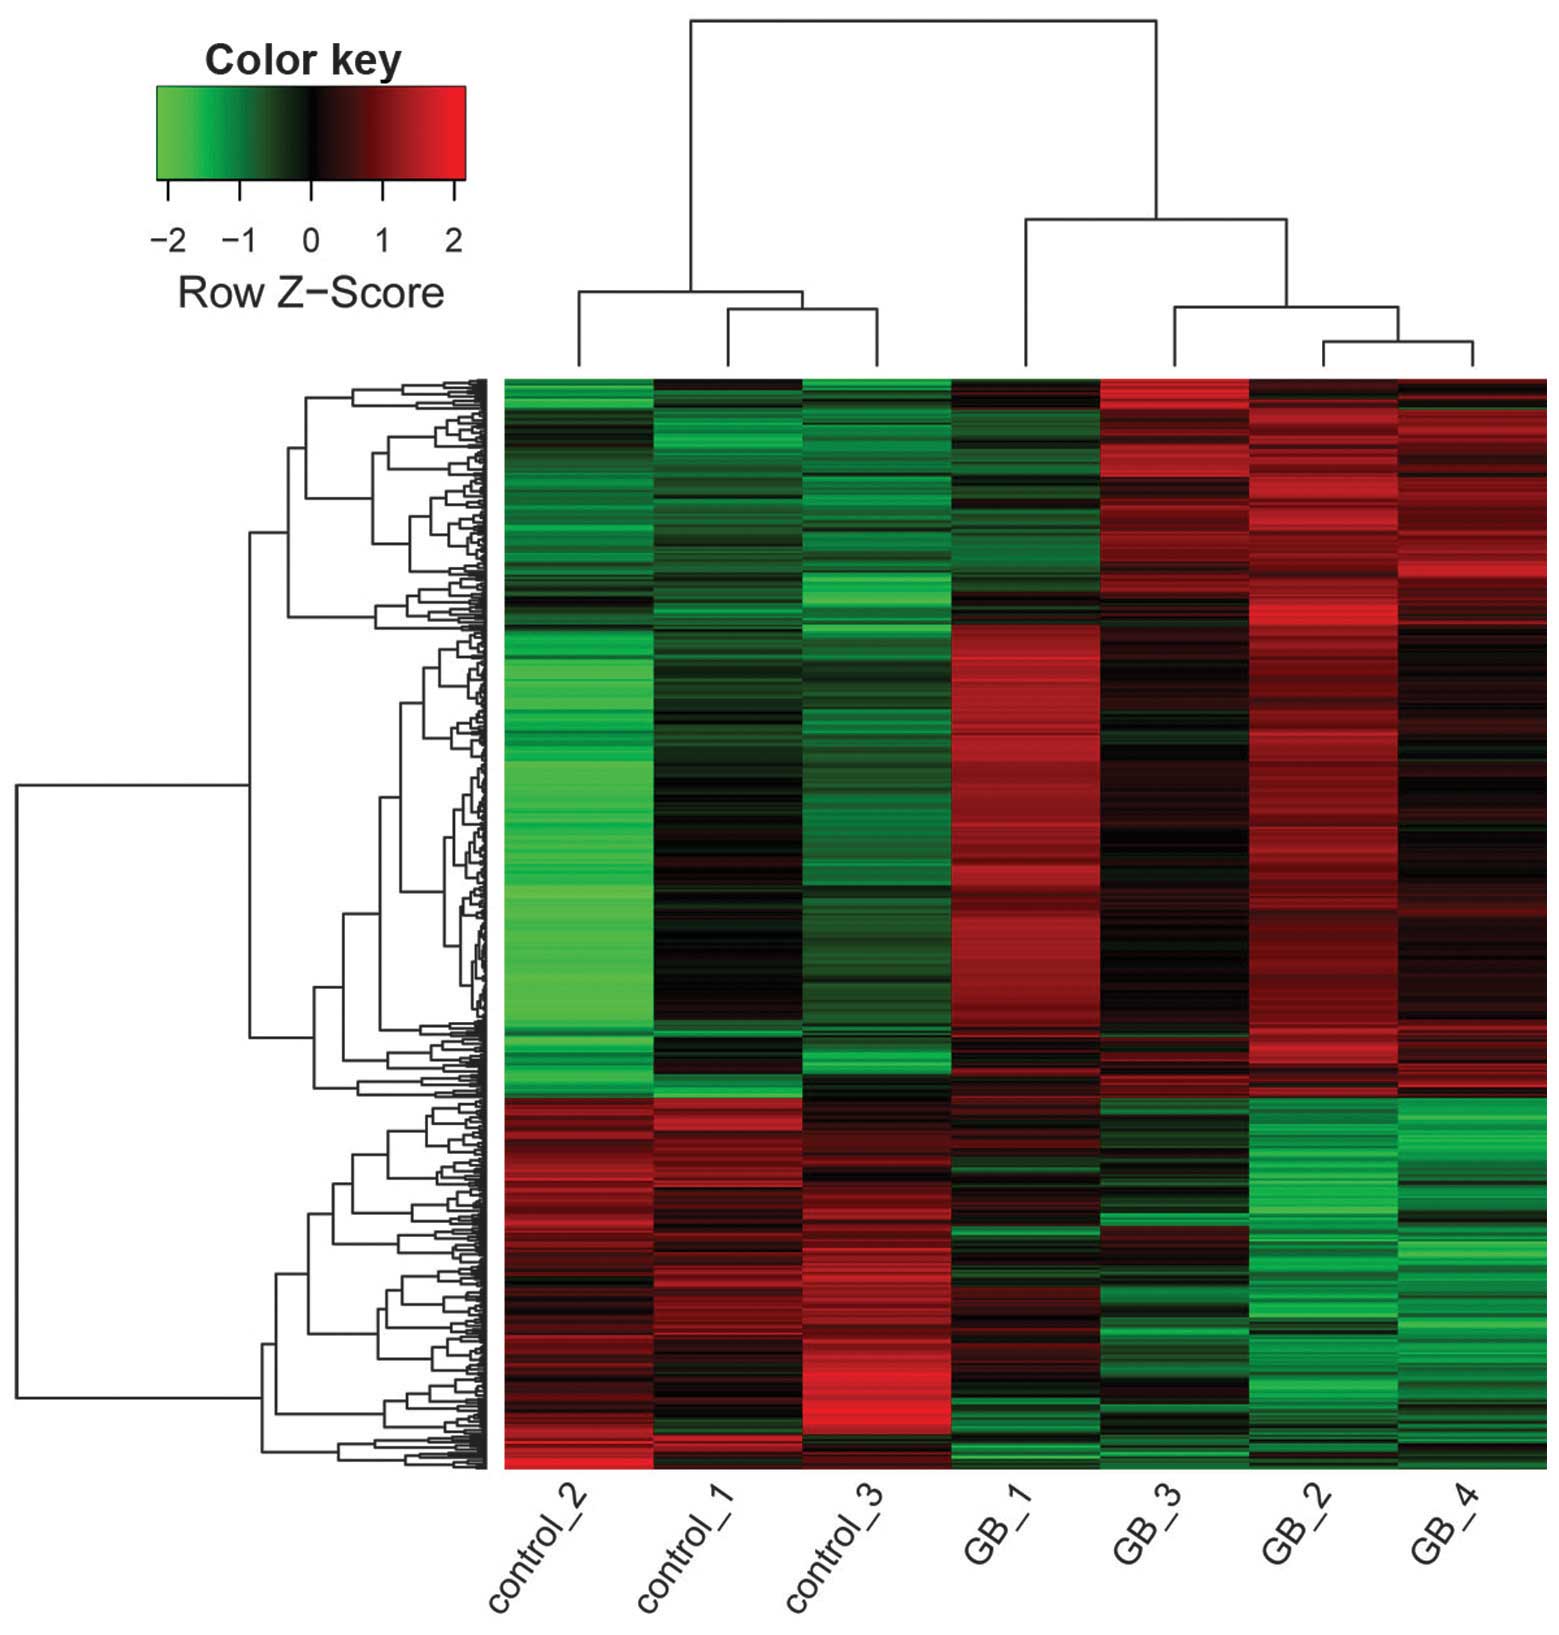
A heat map was generated using Z-score normalization of
log2 expression values to illustrate the relative
expression levels of DEGs in GASCs.
Gene ontology (GO) and pathway
enrichment analysis of DEGs
GO is a commonly used approach for functional
studies, and three independent ontologies (biological process,
molecular function and cellular component) are accessible on the
world-wide web (www.geneontology.org) (13). Kyoto Encyclopedia of Genes and Genomes
(KEGG; www.genome.jp/kegg/) is a knowledge base
for the systematic analysis of gene functions, which links genomic
information with higher order functional information (14). In the present study, GO biological
processes and KEGG pathway analysis were performed using the
Database for Annotation, Visualization and Integrated Discovery;
(http://david.abcc.ncifcrf.gov/home.jsp) (15) where P<0.05.
Functional annotation of DEGs
Functional annotation of DEGs was performed for the
detection of transcription factors and tumor-associated genes. Two
databases, Tumor Suppressor Gene Database version 2.0 (16) (bioinfo.mc.vanderbilt.edu/TSGene/)and Tumor Associated
Gene database (last modified, 10/03/2014) (17) (www.binfo.ncku.edu.tw/TAG/GeneDoc.php) were used to
screen tumor suppressor genes and oncogenes.
PPI network construction
The Search Tool for the Retrieval of Interacting
Genes/Proteins (STRING; string-db.org/) database is a pre-computed global
resource for the investigation and analysis of associations between
proteins. The database reveals protein interactions, including
experimental and predicted protein interaction information
(18). In the present study, STRING
was used to analyze the interactions between DEGs with the PPI
required confidence (combined score, 0.9) and a PPI network was
constructed. In addition, the degree of the nodes in the PPI
network were calculated, and the nodes with a higher degree were
deemed to be hub proteins compared with the other nodes in the PPI
network.
Selection and pathway enrichment
analysis of sub-network
To obtain additional information on the genes
identified in the PPI network, a sub-network was constructed using
CFinder (www.cfinder.org/) and Clique Percolation
Method (k=3) (19). Four networks
were obtained, but only one was associated with additional nodes
and was additionally analyzed. GO and KEGG enrichment analysis were
performed on the sub-network for the majority of nodes, and the
interactions were selected using CFinder version 2.0.5 for the
identification of significant pathways.
Results
DEG selection
In total, 512 transcripts were observed to be
expressed differentially, including 337 upregulated transcripts and
175 downregulated transcripts, corresponding to 331 upregulated
genes and 171 downregulated genes. The heat map of DEGs in GASCs
and control stromal cells is shown in Fig. 1.
GO categories and KEGG pathway
enrichment analysis of DEGs
Pathways obtained by KEGG enrichment are presented
in Table I. According to the results,
upregulated genes were primarily enriched in pathways associated
with the cell cycle, DNA replication, oocyte meiosis and p53
signaling (Table IA). Downregulated
genes were primarily enriched in pathways associated with
adipocytokine signaling, aldosterone-regulated sodium reabsorption
and nucleotide oligomerization domain-like receptor signaling
(Table IB).
 | Table I.Enriched GO categories and KEGG
pathway enrichment analysis of DEGs in glioblastoma-associated
stromal cells. |
Table I.
Enriched GO categories and KEGG
pathway enrichment analysis of DEGs in glioblastoma-associated
stromal cells.
| A, KEGG analysis of
upregulated DEGs. |
|---|
|
|---|
| Category | Term | Biological
process | Count | P-value |
|---|
| KEGG | 4110 | Cell cycle | 124 | 0 |
| KEGG | 3030 | DNA
replication | 36 |
3.47×10⁻¹³ |
| KEGG | 4114 | Oocyte meiosis | 112 |
5.49×10⁻¹⁰ |
| KEGG | 4914 |
Progesterone-mediated oocyte
maturation | 86 |
2.10×10⁻⁷ |
| KEGG | 4115 | p53 signaling
pathway | 68 |
2.13×10⁻⁶ |
| KEGG | 3430 | Mismatch
repair | 23 |
5.90×10⁻⁴ |
| KEGG |
240 | Pyrimidine
metabolism | 99 |
1.57×10⁻³ |
| KEGG | 3410 | Base excision
repair | 33 |
2.39×10⁻³ |
| KEGG | 3420 | Nucleotide excision
repair | 44 |
6.85×10⁻³ |
| KEGG | 3440 | Homologous
recombination | 28 |
1.22×10⁻² |
|
| B, KEGG analysis of
downregulated DEGs. |
|
| Category | Term | Biological
process | Count | P-value |
|
| KEGG | 4920 | Adipocytokine
signaling pathway | 68 |
3.85×10⁻³ |
| KEGG | 4960 |
Aldosterone-regulated sodium
reabsorption | 42 |
7.26×10⁻³ |
| KEGG | 4621 | NOD-like receptor
signaling pathway | 58 |
1.75×10⁻² |
| KEGG | 4964 | Proximal tubule
bicarbonate reclamation | 23 |
1.99×10⁻² |
| KEGG |
640 | Propanoate
metabolism | 32 |
3.69×10⁻² |
| KEGG | 4060 | Cytokine-cytokine
receptor interaction | 265 |
3.93×10⁻² |
|
| C, GO analysis of
upregulated DEGs. |
|
| Category | Term | Biological
process | Count | P-value |
|
| BP | GO:0000070 | Mitotic sister
chromatid segregation | 53 | 0 |
| BP | GO:0000075 | Cell cycle
checkpoint | 226 | 0 |
| BP | GO:0000226 | Microtubule
cytoskeleton organization | 297 | 0 |
| BP | GO:0000278 | Mitotic cell
cycle | 816 | 0 |
| BP | GO:0000280 | Nuclear
division | 346 | 0 |
| BP | GO:0000819 | Sister chromatid
segregation | 56 | 0 |
| BP | GO:0006259 | DNA metabolic
process | 896 | 0 |
| BP | GO:0006260 | DNA
replication | 277 | 0 |
| BP | GO:0006261 | DNA-dependent DNA
replication | 100 | 0 |
| BP | GO:0006270 | DNA replication
initiation | 29 | 0 |
|
| D, GO analysis of
downregulated DEGs. |
|
| Category | Term | Biological
process | Count | P-value |
|
| BP | GO:0008217 | Reg. of blood
pressure |
147 |
9.85×10⁻⁶ |
| BP | GO:0045776 | Negative regulation
of blood pressure | 35 |
3.08×10⁻⁴ |
| BP | GO:0071260 | Cellular response
to mechanical stimulus | 57 |
1.98×10⁻³ |
| BP | GO:0035094 | Response to
nicotine | 31 |
2.98×10⁻³ |
| BP | GO:0016486 | Peptide hormone
processing | 32 |
3.27×10⁻³ |
| BP | GO:0002864 | Reg. of acute
inflammatory response to antigenic stimulus | 10 |
3.73×10⁻³ |
| BP | GO:0031272 | Reg. of
pseudopodium assembly | 10 |
3.73×10⁻³ |
| BP | GO:0016485 | Protein
processing |
160 |
3.95×10⁻³ |
| BP | GO:0051239 | Reg. of
multicellular organismal processes | 1963 |
4.20×10⁻³ |
| BP | GO:0006952 | Defense
response | 1372 |
4.25×10⁻³ |
Several GO categories were enriched among DEGs and
are shown in Table I. The upregulated
genes were primarily enriched in categories associated with mitotic
sister chromatid segregation, cell cycle checkpoint and DNA
metabolic processes, which are all associated with cell mitosis and
DNA replication (Table IC). Among
downregulated genes, categories with increased transcripts included
regulation of blood pressure and cellular response to mechanical
stimulus (Table ID).
Functional annotation of DEGs
According to the annotation results (Table II), 11 transcriptional factors were
upregulated, including breast cancer 1, early onset (BRCA1)
and BRCA1 interacting protein C-terminal helicase 1, and 6
transcriptional factors were downregulated, including
ary-hydrocarbon receptor nuclear translocator 2 and DNA damage
inducible transcript 3 (DDIT3).
| Table II.Functional annotation of
differentially expressed genes in glioblastoma-associated stromal
cells. |
Table II.
Functional annotation of
differentially expressed genes in glioblastoma-associated stromal
cells.
| Category | n | Gene |
|---|
| Upregulated |
|
|
| TF | 11 | BRCA1, BRIP1, CDK2,
HEYL, HMGB2, IRX5, MEF2C, MEIS2, MYBL2, RBL1, TBX2 |
| TAG
oncogene | 9 | CCNA2, CCND2,
CEP55, DUSP26, FGF5, HGF, MYBL2, NET1, PTTG1 |
| TAG
tumor suppressor | 23 | AKAP12, BARD1, BLM,
BMP2, BRCA1, BUB1B, CDH13, CHEK1, DAB2IP, E2F1, FANCD2, ID4, ITGB3,
LIMD1, LIN9, MFSD2A, PCDH10, PTPN3, RBL1, STARD13, TFPI2, TMEFF2,
ZFHX3 |
| Downregulated |
|
|
| TF | 6 | ARNT2, DDIT3, HES2,
MITF, NFIA, NR3C2 |
| TAG
oncogene | 3 | ARHGEF5, DDIT3,
MRAS |
| TAG
tumor suppressor | 10 | ATP8A2, BHLHE41,
CABLES1, CDH4, DAB2, HRASLS2, LGI1, PLA2G16, RARRES3, RPS6KA2 |
Additionally, among the upregulated genes, 9
oncogenes were identified [including cyclin A2 (CCNA2) and
cyclin D2 (CCND2)] in addition to 23 tumor suppressor genes
(including kinase anchoring protein 12 and BRCA1-associated RING
domain 1). The downregulated genes included 3 oncogenes (such as
Rho guanine nucleotide exchange factor 5 and DDIT3) and 10
tumor suppressor genes (such as cadherin 4, type 1, R-cadherin and
ATPase, aminophospholipid transporter, class I, type 8A, member 2).
The details are presented in Table
II.
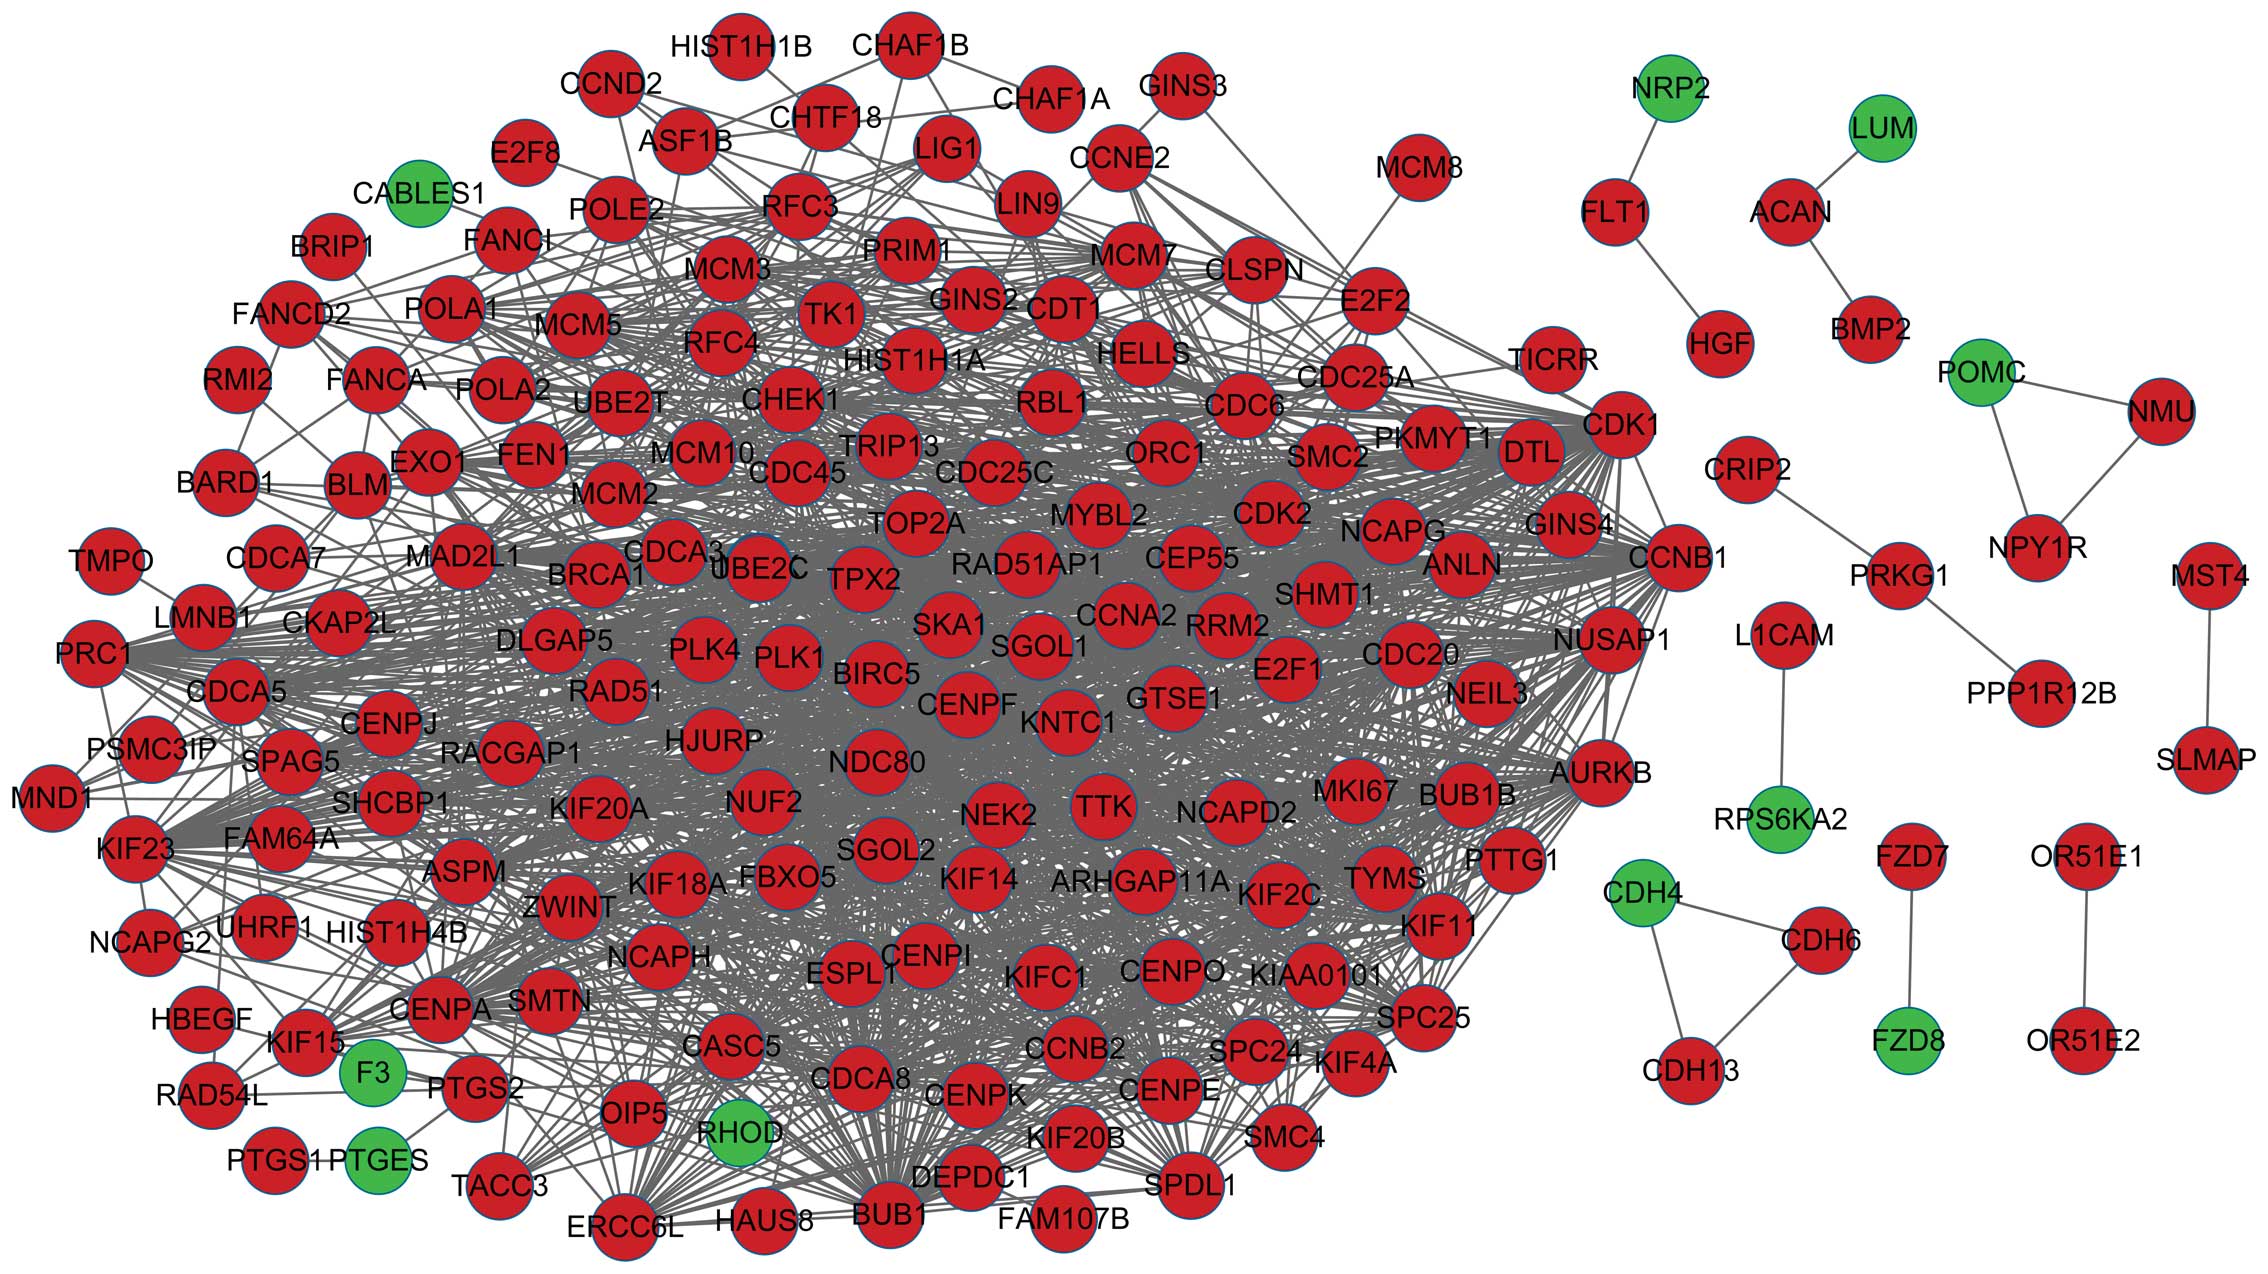
PPI network construction
The PPI network constructed for the DEGs is shown in
Fig. 2, in which 181 nodes and 1,740
interactions were identified. In this network, 8 nodes with higher
degrees were identified, including cyclin-dependent kinase 1
(CDK1), CCNA2, mitotic checkpoint serine/threonine
kinase (BUB1), cell division cycle 20 (CDC20),
kinetochore complex component 80 (NDC80), non-SMC condensing
I complex, subunit G (NCAPG), cell division cycle associated-8 and
polo-like kinase 1 (PLK1).
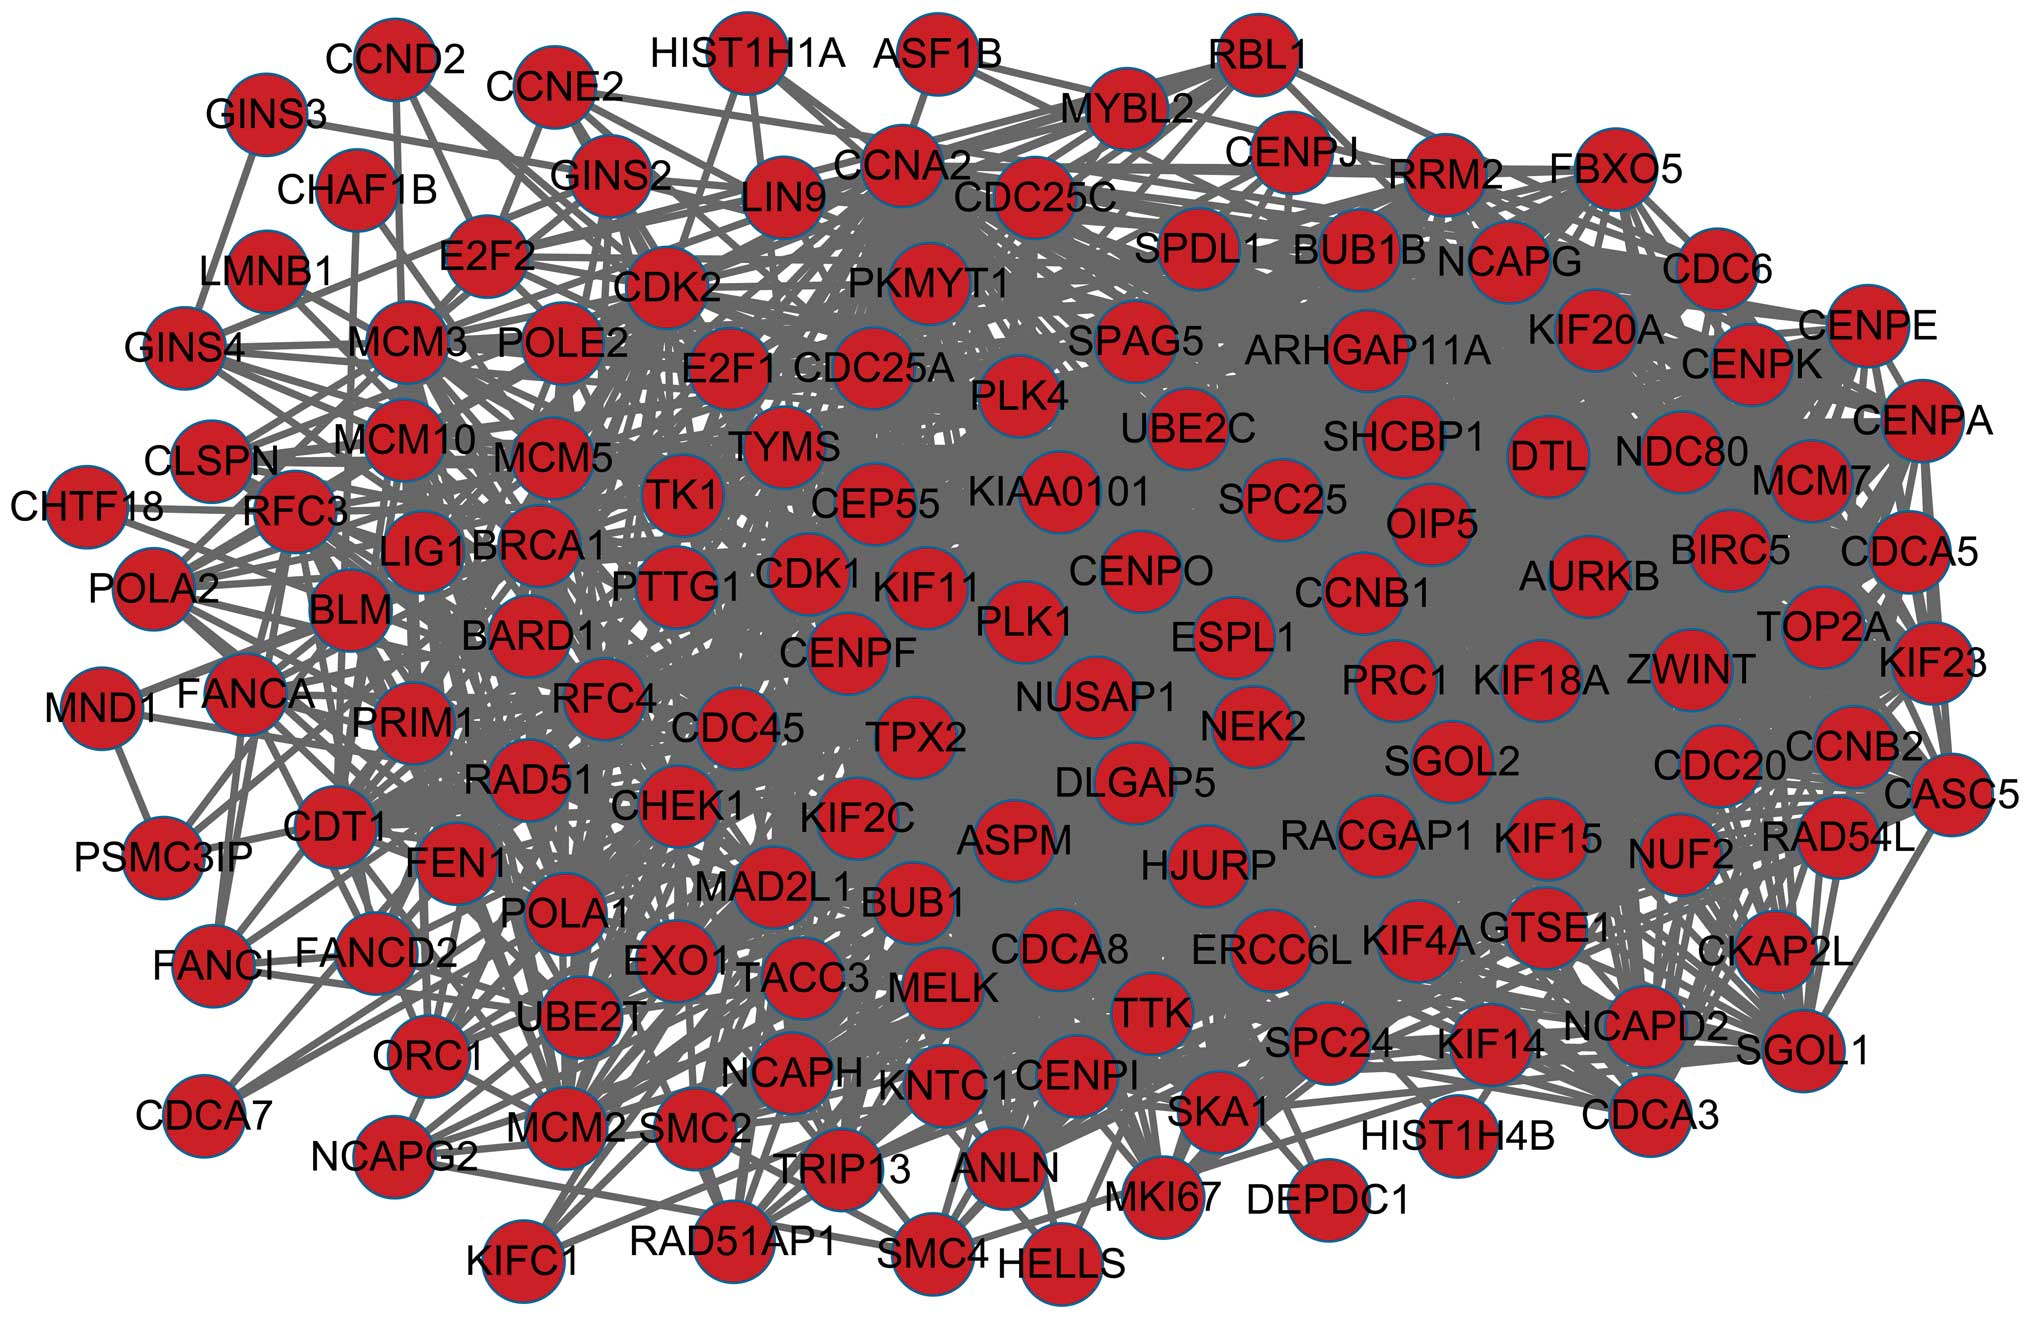
Analysis of sub-network
The sub-network obtained using CFinder is shown in
Fig. 3, in which 135 nodes and 1,694
interactions were identified, and all nodes were upregulated genes.
KEGG enrichment in the sub-network is presented in Table IIIA; cell cycle, p53 signaling
pathway, oocyte meiosis and progesterone-mediated oocyte maturation
were the predominant pathways enriched by these DEGs. GO enrichment
analysis was also performed and is presented in Table IIIB; mitotic cell cycle, DNA
metabolic process and nuclear division were the predominant
categories.
| Table III.GO terms and KEGG pathways of DEGs in
the sub-network. |
Table III.
GO terms and KEGG pathways of DEGs in
the sub-network.
| A, Enriched
pathways of DEGs in sub-network |
|---|
|
|---|
| Category | Term | Biological
Process | Count | P-value |
|---|
| KEGG | 3030 | DNA
replication | 12 | 0 |
| KEGG | 4110 | Cell cycle | 29 | 0 |
| KEGG | 4114 | Oocyte meiosis | 15 |
1.55×10⁻¹⁴ |
| KEGG | 4914 |
Progesterone-mediated oocyte
maturation | 11 |
1.29×10⁻¹⁰ |
| KEGG | 4115 | p53 signaling
pathway | 9 |
5.41×10⁻⁹ |
| KEGG |
240 | Pyrimidine
metabolism | 7 |
2.25×10⁻⁵ |
| KEGG | 3430 | Mismatch
repair | 4 |
4.28×10⁻⁵ |
| KEGG | 3420 | Nucleotide excision
repair | 4 |
5.72×10⁻⁴ |
| KEGG | 3440 | Homologous
recombination | 3 |
1.84×10⁻³ |
| KEGG | 3410 | Base excision
repair | 3 |
2.97×10⁻³ |
|
| B, Enriched GO
terms of DEGs in sub-network |
|
| Category | Term | Biological
Process | Count | P-value |
| BP | GO:0000070 | Mitotic sister
chromatid segregation | 20 | 0 |
| BP | GO:0000075 | Cell cycle
checkpoint | 27 | 0 |
| BP | GO:0000082 | G1/S transition of
mitotic cell cycle | 24 | 0 |
| BP | GO:0000226 | Microtubule
cytoskeleton organization | 36 | 0 |
| BP | GO:0000278 | Mitotic cell
cycle | 101 | 0 |
| BP | GO:0000280 | Nuclear
division | 62 | 0 |
| BP | GO:0000819 | Sister chromatid
segregation | 21 | 0 |
| BP | GO:0006259 | DNA metabolic
process | 72 | 0 |
| BP | GO:0006260 | DNA
replication | 39 | 0 |
| BP | GO:0006261 | DNA-dependent DNA
replication | 22 | 0 |
Discussion
Glioblastoma is the most aggressive cerebral tumor
in humans, and has a high annual mortality rate (20). GASCs represent a novel stromal cell
population that express mesenchymal markers and exert
tumor-promoting effects (7). In the
present study, 3 samples of GASCs and 4 of control stromal cells
were used to identify DEGs, and the functional categories
associated with those DEGs, that are altered between GASCs and
control stromal cells in glioblastoma. In total, 502 DEGs were
identified, including 331 upregulated genes and 171 downregulated
genes, including CDK1, BUB1, CDC20,
CCNA2, NDC80, NCAPG and PLK1. These are
hub genes and serve major roles in pathways of the cell cycle, p53
signaling, oocyte meiosis and progesterone-mediated oocyte
maturation as determined from the results of KEGG pathway
enrichment analysis. In addition, the upregulated gene BRCA1 was
identified to be a transcription factor. The predominant pathway in
which the majority of hub genes were enriched was the cell cycle,
which is expected as glioblastoma cell invasion requires that cells
have enhanced motility and the ability to degrade local tissue
barriers (21).
CDK1 protein belongs to the CDK family, which
controls the cell cycle by catalyzing the transfer of phosphate
from ATP to specific protein substrates. CDKs have been established
as master regulators of cell proliferation (22). As expected, in the present study,
CDK1 was upregulated in GASCs and was primarily enriched in
pathways involved in the cell cycle, mitotic cell cycle and DNA
replication, all of which are closely associated with the
mechanisms of tumor growth (23,24). In
the cell cycle, CDK1 controls a widespread regulatory system, which
involves phosphorylation of other regulatory molecules and
phosphorylation of the molecular machinery that drives the
cell-cycle (25). Furthermore, in the
current study, CDK1 was observed to be enriched in the p53
signaling pathway, which is induced by a number of stress signals,
including DNA damage, oxidative stress and activated oncogenes. The
p53 signaling network is an integral tumor suppressor pathway in
glioblastoma pathogenesis that affects cellular processes,
including cell cycle control and cell death execution (26). In this pathway, the tumor suppressor
p53 protein acts as a transcriptional activator of p53-regulated
genes (27) and is primarily involved
in control of numerous genes governing cell survival, cell
proliferation, angiogenesis and metabolism (28). Stegh et al (26) reported that the p53 signaling pathway
is inhibited in glioblastoma, which causes aberrant cell cycling
and tumorigenesis. In the present study, several DEGs were enriched
in the p53 signaling pathway, including CDK1, CDK2,
CCNB1 and CCND2, which may be associated with the
inhibition of p53 signaling (29).
Therefore, according to the current study, upregulated CDK1
may increase the growth of glioblastoma by promoting cell cycle
pathways and inhibiting the p53 signaling pathway.
BUB1 was identified to be upregulated in the
present study, and was primarily enriched in biological processes
associated with the mitotic cell cycle, including cell cycle
chromatid segregation, G1/S transition of mitotic cells and DNA
replication. The BUB family of genes encode proteins that
are involved in a large multi-protein kinetochore complex, and are
hypothesized to be key components of the checkpoint regulatory
pathway (30). BUB1 encodes a
serine/threonine-protein kinase that is critical in mitosis, and
functions partly through the phosphorylation of members of the
mitotic checkpoint complex and activation of the spindle checkpoint
(31). BUB1 accumulates at
unattached kinetochores where it mediates the recruitment of
mitotic arrest deficient (Mad) dimers (32). Combined with Mad, BUB1 prevents
the premature separation of sister chromatids until all the
chromosomes are correctly attached to kinetochores, which leads to
correct chromosome segregation (33).
Therefore, BUB1 may promote the growth of cancer cells in
glioblastoma primarily by regulating the mitotic cell cycle. In
addition, it appears that the mutation of mitotic spindle
checkpoint genes is associated with the evolution of certain human
cancers, particularly those with aneuploidy (34). Glioblastoma exhibits a high degree of
aneuploidy (35) and the upregulation
of BUB1 in GASCs may increase the tumorigenesis of
glioblastoma.
CDC20 appears to act as a regulatory protein
interacting with several other proteins at multiple points in the
cell cycle (36). In the present
study, the CDC20 gene was upregulated and enriched in cell
cycle and oocyte meiosis pathways. CDC20 is an activator
protein that regulates the anaphase-promoting complex ubiquitin
ligase, which is considered to be crucial in governing certain
cellular processes (37), including
the interaction with specific ubiquitin substrates for their
subsequent degradation by the 26S proteasome at various points
during cell cycle progression; this results in the forwards
progression of the cell cycle in a unidirectional manner (38). Previous studies have demonstrated that
CDC20 is highly expressed in various types of human tumors,
including breast (39) and cervical
cancer (40), where it functions as
an oncoprotein. Marucci et al (41) reported that, in glioblastoma,
CDC20 expression is upregulated, which is consistent with
the present results. This implies that CDC20 may promote
glioblastoma occurrence by regulating cellular processes. In
addition, Bie et al (42)
observed that the expression levels of mitotic spindle assembly
checkpoint gene CDC20 is correlated with the grade of
glioblastoma. The expression of CDC20 is regulated by
BRCA1, a susceptibility gene that greatly increases the risk
of breast and other types of cancer (43), and is expressed differently depending
on the age of the patient (44). In
the present study, BRCA1 and its target gene, CDC20,
were upregulated. This leads to the hypothesis that BRCA1
acts on glioblastoma, and is expressed at various levels in
patients of various ages, regulating the expression of target genes
that are associated with tumor grade or age of the patient,
including CDC20. Therefore, BRCA1 and its target
genes are of significant value in clinical research, and
BRCA1 may be used as an anti-cancer drug target.
According to the present study, PLK1 was
upregulated and enriched in pathways associated with the cell
cycle, oocyte meiosis and progesterone-mediated oocyte maturation.
PLK1 is a serine/threonine kinase and is critical in centrosome
maturation (45), mitotic entry
(46), bipolar spindle formation
(47,48), metaphase-to-anaphase transition
(49) and cytokinesis (50) in the mitotic phase of the cell cycle.
Foong et al (51) demonstrated
that increased expression of PLK1 is an independent, negative
prognostic factor in glioma and is associated with proliferative
and mesenchymal molecular subclasses, which characterize highly
recurrent and aggressive tumors (52). PLK1 has become a primary target in
brain tumor treatment, and its inhibition has been shown to result
in 80–90% growth suppression in a panel of pediatric cancer cells,
including glioblastoma, following 72 h of treatment (52). Therefore, in GASCs, PLK1
upregulation may promote the cell cycle, leading to the growth of
glioblastoma.
CCNA2 belongs to a highly conserved cyclin
family and is expressed in almost all tissues of the human body
(53). The encoded protein is crucial
in the control of the cell cycle at G1/S and G2/M transition
points, and this is essential in embryonic cells and the
hematopoietic lineage (54).
Overexpression of CCNA2 is involved in tumor transformation
and progression in numerous types of cancer (55). Another member of the cyclin family,
CCND2, is critical in cell cycle progression and tumorigenicity of
glioblastoma stem cells (56). As
expected, the present data revealed that CCNA2 was
upregulated, which is in accordance with the function of CCNA2 in
cancer. According to the pathway enrichment results, CCNA2
was enriched in cell cycle and progesterone-mediated oocyte
maturation pathways, in which CDK1, BUB1 and
PLK1 were also involved. The present results indicate that
CCNA2 promotes the growth of glioblastoma by participating
in the cell cycle. However, few studies have reported the
association between oocyte maturation and glioblastoma, revealing
that this may be a novel insight in glioblastoma.
In conclusion, the present study identified several
significant genes in glioblastoma, including CDK1,
BUB1, CDC20, CCNA2, PLK1 and
BRCA1, which are all upregulated and may play various roles
in the biological function of GASCs. These significant DEGs may
promote the tumorigenesis of glioblastoma as they are involved in
major biological pathways, including cell cycle, mitosis, p53
signaling and DNA replication. However, since the sample size used
in this study is small and no experiments have been performed to
confirm the conclusions, additional analyses of experimental
studies are required to investigate the genes associated with
glioblastoma.
References
|
1
|
McLendon RE and Rich JN: Glioblastoma stem
cells: A Neuropathologist's View. J Oncol. 2011:3971952011.
View Article : Google Scholar : PubMed/NCBI
|
|
2
|
States CBTRotU: CBTRUS statistical report:
primary brain and central nervous system tumors diagnosed in the
United States in 2004–2006. 2010.
|
|
3
|
Stupp R, Hegi ME, Mason WP, van den Bent
MJ, Taphoorn MJ, Janzer RC, Ludwin SK, Allgeier A, Fisher B,
Belanger K, et al: European Organisation for Research and
Treatment of Cancer Brain Tumour and Radiation Oncology Groups;
National Cancer Institute of Canada Clinical Trials Group:
Effects of radiotherapy with concomitant and adjuvant temozolomide
versus radiotherapy alone on survival in glioblastoma in a
randomised phase III study: 5-year analysis of the EORTC-NCIC
trial. Lancet Oncol. 10:459–466. 2009. View Article : Google Scholar : PubMed/NCBI
|
|
4
|
Thumma SR, Fairbanks RK, Lamoreaux WT,
Mackay AR, Demakas JJ, Cooke BS, Elaimy AL, Hanson PW and Lee CM:
Effect of pretreatment clinical factors on overall survival in
glioblastoma multiforme: A surveillance epidemiology and end
results (SEER) population analysis. World J Surg Oncol. 10:752012.
View Article : Google Scholar : PubMed/NCBI
|
|
5
|
Tseng YY, Liao JY, Chen WA, Kao YC and Liu
SJ: Sustainable release of carmustine from biodegradable
poly[(d,l)-lactide-co-glycolide] nanofibrous membranes in the
cerebral cavity: In vitro and in vivo studies. Expert
Opin Drug Deliv. 10:879–888. 2013. View Article : Google Scholar : PubMed/NCBI
|
|
6
|
Gangemi RM, Griffero F, Marubbi D, Perera
M, Capra MC, Malatesta P, Ravetti GL, Zona GL, Daga A and Corte G:
SOX2 silencing in glioblastoma tumor-initiating cells causes stop
of proliferation and loss of tumorigenicity. Stem Cells. 27:40–48.
2009. View Article : Google Scholar : PubMed/NCBI
|
|
7
|
Clavreul A, Etcheverry A, Chassevent A,
Quillien V, Avril T, Jourdan ML, Michalak S, François P, Carré JL,
Mosser J, et al: Isolation of a new cell population in the
glioblastoma microenvironment. J Neurooncol. 106:493–504. 2012.
View Article : Google Scholar : PubMed/NCBI
|
|
8
|
Mao Y, Keller ET, Garfield DH, Shen K and
Wang J: Stromal cells in tumor microenvironment and breast cancer.
Cancer Metastasis Rev. 32:303–315. 2013. View Article : Google Scholar : PubMed/NCBI
|
|
9
|
Calon A, Espinet E, Palomo-Ponce S,
Tauriello DV, Iglesias M, Céspedes MV, Sevillano M, Nadal C, Jung
P, Zhang XH, et al: Dependency of colorectal cancer on a
TGF-β-driven program in stromal cells for metastasis initiation.
Cancer cell. 22:571–584. 2012. View Article : Google Scholar : PubMed/NCBI
|
|
10
|
Östman A and Augsten M: Cancer-associated
fibroblasts and tumor growth-bystanders turning into key players.
Curr Opin Genet Dev. 19:67–73. 2009. View Article : Google Scholar : PubMed/NCBI
|
|
11
|
López-Romero P, González MA, Callejas S,
Dopazo A and Irizarry RA: Processing of agilent microRNA array
data. BMC Res Notes. 3:182010. View Article : Google Scholar : PubMed/NCBI
|
|
12
|
Ritchie ME, Phipson B, Wu D, Hu Y, Law CW,
Shi W and Smyth GK: limma powers differential expression analyses
for RNA-sequencing and microarray studies. Nucleic Acids Res.
43:e472015. View Article : Google Scholar : PubMed/NCBI
|
|
13
|
Hulsegge I, Kommadath A and Smits MA:
Globaltest and GOEAST: Two different approaches for gene ontology
analysis. BMC Proc. 3(Suppl 4): S102009. View Article : Google Scholar : PubMed/NCBI
|
|
14
|
Kanehisa M and Goto S: KEGG: Kyoto
encyclopedia of genes and genomes. Nucleic Acids Res. 28:27–30.
2000. View Article : Google Scholar : PubMed/NCBI
|
|
15
|
Dennis G Jr, Sherman BT, Hosack DA, Yang
J, Gao W, Lane HC and Lempicki RA: DAVID: Database for Annotation,
Visualization, and Integrated Discovery. Genome Biol. 4:P32003.
View Article : Google Scholar : PubMed/NCBI
|
|
16
|
Zhao M, Sun J and Zhao Z: TSGene: A web
resource for tumor suppressor genes. Nucleic Acids Res. 41(Database
issue): D970–D976. 2013. View Article : Google Scholar : PubMed/NCBI
|
|
17
|
Chen JS, Hung WS, Chan HH, Tsai SJ and Sun
HS: In silico identification of oncogenic potential of fyn-related
kinase in hepatocellular carcinoma. Bioinformatics. 29:420–427.
2013. View Article : Google Scholar : PubMed/NCBI
|
|
18
|
Szklarczyk D, Franceschini A, Kuhn M,
Simonovic M, Roth A, Minguez P, Doerks T, Stark M, Muller J, Bork
P, et al: The STRING database in 2011: Functional interaction
networks of proteins, globally integrated and scored. Nucleic Acids
Res. 39(Database issue): D561–D568. 2011. View Article : Google Scholar : PubMed/NCBI
|
|
19
|
Adamcsek B, Palla G, Farkas IJ, Derényi I
and Vicsek T: CFinder: Locating cliques and overlapping modules in
biological networks. Bioinformatics. 22:1021–1023. 2006. View Article : Google Scholar : PubMed/NCBI
|
|
20
|
Ding T, Ma Y, Li W, Liu X, Ying G, Fu L
and Gu F: Role of aquaporin-4 in the regulation of migration and
invasion of human glioma cells. Int J Oncol. 38:1521–1531.
2011.PubMed/NCBI
|
|
21
|
Baldwin RM, Barrett GM, Parolin DA,
Gillies JK, Paget JA, Lavictoire SJ, Gray DA and Lorimer IA:
Coordination of glioblastoma cell motility by PKCι. Mol Cancer.
9:2332010. View Article : Google Scholar : PubMed/NCBI
|
|
22
|
Schwartz GK and Shah MA: Targeting the
cell cycle: A new approach to cancer therapy. J Clin Oncol.
23:9408–9421. 2005. View Article : Google Scholar : PubMed/NCBI
|
|
23
|
Mo W, Chen J, Patel A, Zhang L, Chau V, Li
Y, Cho W, Lim K, Xu J, Lazar AJ, et al: CXCR4/CXCL12 mediate
autocrine cell-cycle progression in NF1-associated malignant
peripheral nerve sheath tumors. Cell. 152:1077–1090. 2013.
View Article : Google Scholar : PubMed/NCBI
|
|
24
|
Huang TH, Huo L, Wang YN, Xia W, Wei Y,
Chang SS, Chang WC, Fang YF, Chen CT, Lang JY, et al: EGFR
potentiates MCM7-mediated DNA replication through tyrosine
phosphorylation of Lyn kinase in human cancers. Cancer Cell.
23:796–810. 2013. View Article : Google Scholar : PubMed/NCBI
|
|
25
|
Ubersax JA, Woodbury EL, Quang PN, Paraz
M, Blethrow JD, Shah K, Shokat KM and Morgan DO: Targets of the
cyclin-dependent kinase Cdk1. Nature. 425:859–864. 2003. View Article : Google Scholar : PubMed/NCBI
|
|
26
|
Stegh AH, Brennan C, Mahoney JA, Forloney
KL, Jenq HT, Luciano JP, Protopopov A, Chin L and Depinho RA:
Glioma oncoprotein Bcl2L12 inhibits the p53 tumor suppressor. Genes
Dev. 24:2194–2204. 2010. View Article : Google Scholar : PubMed/NCBI
|
|
27
|
Zhao R, Gish K, Murphy M, Yin Y, Notterman
D, Hoffman WH, Tom E, Mack DH and Levine AJ: Analysis of
p53-regulated gene expression patterns using oligonucleotide
arrays. Genes Dev. 14:981–993. 2000.PubMed/NCBI
|
|
28
|
Levine A, Hu W and Feng Z: The P53
pathway: What questions remain to be explored? Cell Death Differ.
13:1027–1036. 2006. View Article : Google Scholar : PubMed/NCBI
|
|
29
|
Schwermer M, Lee S, Köster J, van Maerken
T, Stephan H, Eggert A, Morik K, Schulte JH and Schramm A:
Sensitivity to cdk1-inhibition is modulated by p53 status in
preclinical models of embryonal tumors. Oncotarget. 6:154252015.
View Article : Google Scholar : PubMed/NCBI
|
|
30
|
Grabsch H, Takeno S, Parsons WJ, Pomjanski
N, Boecking A, Gabbert HE and Mueller W: Overexpression of the
mitotic checkpoint genes BUB1, BUBR1 and BUB3 in gastric
cancer-association with tumour cell proliferation. J Pathol.
200:16–22. 2003. View Article : Google Scholar : PubMed/NCBI
|
|
31
|
Tang Z, Shu H, Qi W, Mahmood NA, Mumby MC
and Yu H: PP2A is required for centromeric localization of Sgo1 and
proper chromosome segregation. Dev Cell. 10:575–585. 2006.
View Article : Google Scholar : PubMed/NCBI
|
|
32
|
Ricke RM, Jeganathan KB and van Deursen
JM: Bub1 overexpression induces aneuploidy and tumor formation
through Aurora B kinase hyperactivation. J Cell Biol.
193:1049–1064. 2011. View Article : Google Scholar : PubMed/NCBI
|
|
33
|
Kawashima SA, Yamagishi Y, Honda T,
Ishiguro K and Watanabe Y: Phosphorylation of H2A by Bub1 prevents
chromosomal instability through localizing shugoshin. Science.
327:172–177. 2010. View Article : Google Scholar : PubMed/NCBI
|
|
34
|
Myrie KA, Percy MJ, Azim JN, Neeley CK and
Petty EM: Mutation and expression analysis of human BUB1 and BUB1B
in aneuploid breast cancer cell lines. Cancer Lett. 152:193–199.
2000. View Article : Google Scholar : PubMed/NCBI
|
|
35
|
Telentschak S, Soliwoda M, Nohroudi K,
Addicks K and Klinz FJ: Cytokinesis failure and successful
multipolar mitoses drive aneuploidy in glioblastoma cells. Oncology
Rep. 33:2001–2008. 2015.
|
|
36
|
Hadjihannas MV, Bernkopf DB, Brückner M
and Behrens J: Cell cycle control of Wnt/β-catenin signalling by
conductin/axin2 through CDC20. EMBO Rep. 13:347–354. 2012.
View Article : Google Scholar : PubMed/NCBI
|
|
37
|
Frescas D and Pagano M: Deregulated
proteolysis by the F-box proteins SKP2 and β-TrCP: Tipping the
scales of cancer. Nat Rev Cancer. 8:438–449. 2008. View Article : Google Scholar : PubMed/NCBI
|
|
38
|
Wang Z, Wan L, Zhong J, Inuzuka H, Liu P,
Sarkar FH and Wei W: Cdc20: A potential novel therapeutic target
for cancer treatment. Curr Pharm Des. 19:3210–3214. 2013.
View Article : Google Scholar : PubMed/NCBI
|
|
39
|
Jiang J, Jedinak A and Sliva D:
Ganodermanontriol (GDNT) exerts its effect on growth and
invasiveness of breast cancer cells through the down-regulation of
CDC20 and uPA. Biochem Biophys Res Commun. 415:325–329. 2011.
View Article : Google Scholar : PubMed/NCBI
|
|
40
|
Rajkumar T, Sabitha K, Vijayalakshmi N,
Shirley S, Bose MV, Gopal G and Selvaluxmy G: Identification and
validation of genes involved in cervical tumourigenesis. BMC
Cancer. 11:802011. View Article : Google Scholar : PubMed/NCBI
|
|
41
|
Marucci G, Morandi L, Magrini E, Farnedi
A, Franceschi E, Miglio R, Calò D, Pession A, Foschini MP and
Eusebi V: Gene expression profiling in glioblastoma and
immunohistochemical evaluation of IGFBP-2 and CDC20. Virchows
Archiv. 453:599–609. 2008. View Article : Google Scholar : PubMed/NCBI
|
|
42
|
Bie L, Zhao G, Cheng P, Rondeau G,
Porwollik S, Ju Y, Xia XQ and McClelland M: The accuracy of
survival time prediction for patients with glioma is improved by
measuring mitotic spindle checkpoint gene expression. PloS one.
6:e256312011. View Article : Google Scholar : PubMed/NCBI
|
|
43
|
Bae I, Rih JK, Kim HJ, Kang HJ, Haddad B,
Kirilyuk A, Fan S, Avantaggiati ML and Rosen EM: BRCA1 regulates
gene expression for orderly mitotic progression. Cell Cycle.
4:1641–1666. 2005. View Article : Google Scholar : PubMed/NCBI
|
|
44
|
Bogdani M, Teugels E, De Grève J, Bourgain
C, Neyns B and Pipeleers-Marichal M: Loss of nuclear BRCA1
localization in breast carcinoma is age dependent. Virchows Arch.
440:274–279. 2002. View Article : Google Scholar : PubMed/NCBI
|
|
45
|
Lee C, Fotovati A, Triscott J, Chen J,
Venugopal C, Singhal A, Dunham C, Kerr JM, Verreault M, Yip S, et
al: Polo-like kinase 1 inhibition kills glioblastoma multiforme
brain tumor cells in part through loss of SOX2 and delays tumor
progression in mice. Stem Cells. 30:1064–1075. 2012. View Article : Google Scholar : PubMed/NCBI
|
|
46
|
Roshak AK, Capper EA, Imburgia C, Fornwald
J, Scott G and Marshall LA: The human polo-like kinase, PLK,
regulates cdc2/cyclin B through phosphorylation and activation of
the cdc25c phosphatas. Cell Signal. 12:405–411. 2000. View Article : Google Scholar : PubMed/NCBI
|
|
47
|
Casenghi M, Barr FA and Nigg EA:
Phosphorylation of Nlp by Plk1 negatively regulates its
dynein-dynactin-dependent targeting to the centrosome. J Cell Sci.
118:5101–5108. 2005. View Article : Google Scholar : PubMed/NCBI
|
|
48
|
Feng Y, Yuan JH, Maloid SC, Fisher R,
Copeland TD, Longo DL, Conrads TP, Veenstra TD, Ferris A, Hughes S,
et al: Polo-like kinase 1-mediated phosphorylation of the
GTP-binding protein Ran is important for bipolar spindle formation.
Biochem Biophys Res Commun. 349:144–152. 2006. View Article : Google Scholar : PubMed/NCBI
|
|
49
|
Hansen DV, Loktev AV, Ban KH and Jackson
PK: Plk1 regulates activation of the anaphase promoting complex by
phosphorylating and triggering SCFbetaTrCP-dependent destruction of
the APC inhibitor Emi1. Mol Biol Cell. 15:5623–5634. 2004.
View Article : Google Scholar : PubMed/NCBI
|
|
50
|
Niiya F, Tatsumoto T, Lee KS and Miki T:
Phosphorylation of the cytokinesis regulator ECT2 at G2/M phase
stimulates association of the mitotic kinase Plk1 and accumulation
of GTP-bound RhoA. Oncogene. 25:827–837. 2006. View Article : Google Scholar : PubMed/NCBI
|
|
51
|
Foong CS, Sandanaraj E, Brooks HB,
Campbell RM, Ang BT, Chong YK and Tang C: Glioma-propagating cells
as an in vitro screening platform PLK1 as a case study. J
Biomol Screen. 17:1136–1150. 2012. View Article : Google Scholar : PubMed/NCBI
|
|
52
|
Hu K, Lee C, Qiu D, Fotovati A, Davies A,
Abu-Ali S, Wai D, Lawlor ER, Triche TJ, Pallen CJ and Dunn SE:
Small interfering RNA library screen of human kinases and
phosphatases identifies polo-like kinase 1 as a promising new
target for the treatment of pediatric rhabdomyosarcomas. Mol Cancer
Ther. 8:3024–3035. 2009. View Article : Google Scholar : PubMed/NCBI
|
|
53
|
Ko E, Kim Y, Cho EY, Han J, Shim YM, Park
J and Kim DH: Synergistic effect of Bcl-2 and Cyclin A2 on adverse
recurrence-free survival in stage i non-small cell lung cancer. Ann
Surg Oncol. 20:1005–1012. 2013. View Article : Google Scholar : PubMed/NCBI
|
|
54
|
Arsic N, Bendris N, Peter M, Begon-Pescia
C, Rebouissou C, Gadéa G, Bouquier N, Bibeau F, Lemmers B and
Blanchard JM: A novel function for Cyclin A2: Control of cell
invasion via RhoA signaling. J Cell Biol. 196:147–162. 2012.
View Article : Google Scholar : PubMed/NCBI
|
|
55
|
Uhlen M, Oksvold P, Fagerberg L, Lundberg
E, Jonasson K, Forsberg M, Zwahlen M, Kampf C, Wester K, Hober S,
et al: Towards a knowledge-based human protein atlas. Nature
Biotechnol. 28:1248–1250. 2010. View Article : Google Scholar
|
|
56
|
Koyama-Nasu R, Nasu-Nishimura Y, Todo T,
Ino Y, Saito N, Aburatani H, Funato K, Echizen K, Sugano H, Haruta
R, et al: The critical role of cyclin D2 in cell cycle progression
and tumorigenicity of glioblastoma stem cells. Oncogene.
32:3840–3845. 2013. View Article : Google Scholar : PubMed/NCBI
|