Introduction
Pancreatic cancer remains one of the most lethal
malignancies worldwide, with a high malignant potential and a poor
prognosis. The number of new cases of pancreatic cancer was almost
48,960 in 2015. It is the fourth most common cause of
cancer-associated mortality in Western society, with a median
survival of <6 months and a 5-year survival rate of 5% (1,2). Despite
advances in cancer therapy, pancreatic cancer is unresponsive to
the majority of treatments (3,4). To date,
no targeted therapy to improve the clinical outcome has been
identified. Consequently, development of molecular prognostic
factors to improve patient selection for novel therapeutic
approaches is urgently required.
Tumor hypoxia is a common phenomenon in solid
tumors, and is associated with poor prognosis in several types of
cancer, including laryngeal squamous cell carcinoma, ovarian
cancer, breast cancer, gallbladder cancer and pancreatic cancer
(5). Hypoxia leads to genetic
instability and failure of DNA repair, which results in the
selection of tumor cells toward a more aggressive phenotype. Under
hypoxic conditions, tumor cells switch from oxygen-dependent
glucose metabolism to anaerobic glycolysis (6). This cellular adaptation to hypoxia,
known as the Warburg effect, is supported by an observed increase
in glucose transport and consumption (7). High rates of glucose uptake and
glycolysis supply the energy required for proliferation of
malignant cells and tumor growth.
The glucose transporter (GLUT) family has been
identified as belonging to the solute carrier 2A family (SLCZA).
The members of this family differ in their affinity for glucose and
their effects on physiological regulation (8,9). Glucose
transporter-1 (GLUT-1) is a member of the GLUT family, which is
expressed in erythrocytes, endothelial cells, placenta and
blood-tissue barriers, including the blood-brain and blood-nerve
barriers (10,11). Recent studies have demonstrated that
GLUT-1 is often upregulated in various malignant tumors, including
colorectal cancer (12), esophageal
cancer (13), oral squamous cell
carcinoma (14), renal cell carcinoma
(15) breast cancer and lung cancer
(16). It is also considered to be
the predominantly elevated glucose transporter under ischemic and
hypoxic conditions, whereby cells require glycolysis as an energy
source. Positron emission tomography (PET) with
18F-fluorodeoxyglucose (18F-FDG) is a
non-invasive diagnostic and prognostic tool used to evaluate the
hypoxic status of tumors. The expression of glucose transporter
proteins, in particular GLUT-1, is hypothesized to be associated
with FDG uptake (17).
In the present study, immunohistochemical analysis
was used to determine the level of GLUT-1 expression in human
pancreatic cancer tissues and to evaluate the association between
GLUT-1 expression and clinicopathological characteristics and
prognosis. In addition, the association between GLUT-1 expression,
18F-FDG accumulation and Ki-67 expression was also
investigated.
Materials and methods
Clinical data
The study sample was comprised of 53 formalin-fixed
and paraffin-embedded pancreatic cancer tissue specimens and
adjacent healthy tissues obtained from patients with pancreatic
cancer. All patients underwent surgical resection at the First
Affiliated Hospital of Soochow University (Suzhou, China) between
January 2010 and December 2011. Patient characteristics and tumor
status are summarized in Table I. The
clinical stage was classified according to the seventh edition of
the TNM classification of the American Joint Committee on Cancer
(18). Patients that had received
preoperative chemo-, radio-or immunotherapy were excluded. The
study was conducted in accordance with the Declaration of Helsinki
(19) and was approved by the Ethics
Committee of Soochow University.
 | Table I.Clinicopathological characteristics of
pancreatic cancer patients (n=53). |
Table I.
Clinicopathological characteristics of
pancreatic cancer patients (n=53).
| Characteristics | Patients, n (%) |
|---|
| Age, years |
|
|
Median | 63 |
|
Range | 39–72 |
| Gender |
|
| Male | 29 (54.7) |
|
Female | 24 (45.3) |
| Tumor size, cm |
|
|
Median | 3.8 |
|
Range | 1.1–7.4 |
| ≤2 | 18 (34.0) |
|
>2 | 35 (66.0) |
|
Differentiation |
|
|
Well | 13 (24.5) |
|
Moderate | 18 (34.0) |
|
Poor | 22 (41.5) |
| Lymph node
metastasis |
|
|
Yes | 21 (39.6) |
| No | 32 (60.4) |
| Clinical stage |
|
| I | 22 (41.5) |
| II | 31 (58.5) |
Immunohistochemistry (IHC)
The samples were fixed with formalin (GE Healthcare
Life Sciences, Logan, UT, USA) embedded in paraffin (GE Healthcare
Life Sciences) and sectioned. Serial sections (4-µm) subjected to
immunohistological staining were fixed with freshly prepared 3%
H2O2 with 0.1% sodium azide to block
endogenous peroxidase activity and treated with antigen retrieval
solution (GE Healthcare Life Sciences) for 15 min. After placing in
blocking reagent (Roche Diagnostics, Basel, Switzerland) for 15
min, the sections were incubated with primary rabbit monoclonal
anti-GLUT-1 (dilution, 1:300; catalog no., ab115730; Abcam,
Cambridge, MA, USA) or mouse monoclonal anti-Ki-67 (dilution,
1:500; catalog no., ab6526; Abcam) antibody overnight at 4°C,
followed by incubation with horseradish peroxidase-conjugated
polyclonal goat anti-rabbit IgG secondary antibody (dilution,
1:500; catalog no., ab97200; Abcam) for 2 h at 4°C. The signal was
visualized by 3,3′-diaminobenzidene (Sangon Biotech Co., Ltd,
Shanghai, China).
Evaluation of IHC
GLUT-1 expression was evaluated by light microscopy
(Leica Microsystems, Mannheim, Germany) for immunostaining
intensity and staining percentage. A total of 3 fields of view were
examined at magnification, ×200. The staining intensity was
classified as follows: 0, no staining; 1, weak staining; 2,
moderate to strong staining. The percentage of positively stained
cells was classified as follows: 0, <10%; 1, 10–50%; 2, >50%.
The final intensity score was calculated by multiplying the
staining intensity score by the staining percentage score. All
cases were subsequently classified into the four expression groups
according to the following final scores: 0, negative (−); 1, weak
(+); 2, moderate (++); 3, strong (+++). Scores of ++ and +++
indicated positive GLUT-1 expression. To determine Ki-67
expression, positively stained cells were defined as those
exhibiting clear nuclear staining. Tissues were considered to
exhibit positive Ki-67 expression when >15% of the tumor cells
were stained among ≥1,000 tumor cells.
18F-FDG PET/computed
tomography (CT)
FDG-PET scans were performed on the 53 patients from
mid-thigh to the head using a GE Discovery STE 16 PET/CT scanner
(GE Healthcare, Piscataway, NJ, USA). Blood glucose levels were
measured prior to 18F-FDG injection, and patients with a
blood glucose level of >11.2 mmol/l were excluded from the
study. Patients underwent FDG PET scans after ≥6 h fasting and an
uptake time of 45–60 min following intravenous 18F-FDG
administration (3.70–4.44 MBq/kg). An emission scan was acquired
for 3 min per bed position and a whole-body scan was performed for
each patient using several bed positions, which were conducted
based on the height of each patient.
The whole-body PET images were independently
evaluated by two nuclear medicine physicians for the presence of
abnormally increased uptake in the pancreas. PET, CT and fused
PET/CT images were presented on a workstation to diagnose
18F-FDG uptake in the pancreas. On the basis of regions
of interest (ROIs), 18F-FDG uptake was analyzed
semi-quantitatively by calculating the maximum standardized uptake
value (SUVmax) according to the following equation:
SUVmax = maximum pixel value within the ROI activity
(MBq/kg)/(injected dose [MBq]/body weight [kg]).
Statistical analysis
All statistical analyses were performed using SPSS
17.0 (SPSS, Inc., Chicago, IL, USA). Continuous variables were
compared using the Mann-Whitney U test and categorical variables
were compared using the χ2 test or Fisher's exact test. The overall
survival time was defined as the interval between the date of tumor
resection and the date of mortality or last follow-up. Overall
survival was calculated using the Kaplan-Meier method and compared
by the log-rank test. Multivariate analysis was performed using the
Cox proportional hazards regression model. Correlation analysis was
performed using Spearman's rank analysis. Receiver operating
characteristic (ROC) curve analysis was used to define a cut-off
SUVmax value for the optimal sensitivity and specificity
in the prediction of GLUT-1 strong positive expression. P<0.05
was considered to indicate a statistically significant
difference.
Results
Overexpression of GLUT-1 protein in
pancreatic cancer
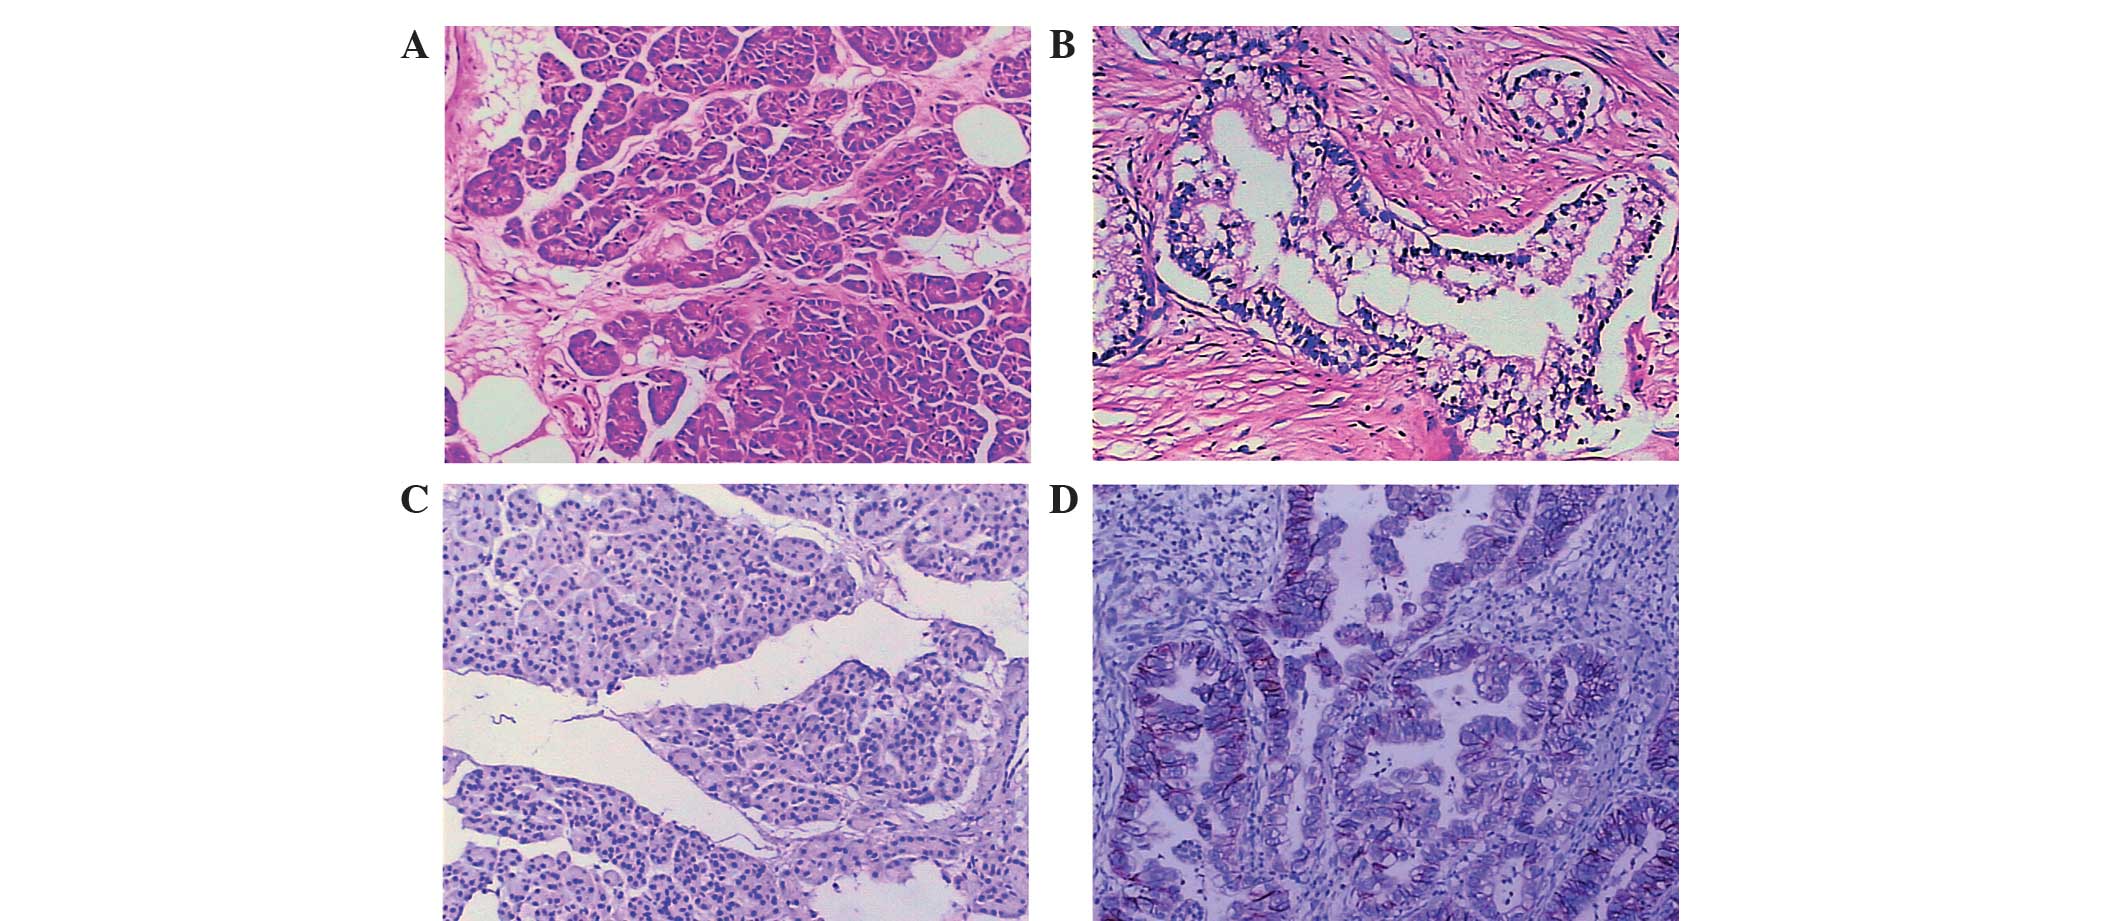
To elucidate the function of GLUT-1 in the
progression of pancreatic cancer, the expression of GLUT-1 protein
in clinical pancreatic cancer tissues was analyzed using IHC
staining. The GLUT-1 protein was predominantly localized to the
cytomembrane of cancer cells in pancreatic cancer tissues (Fig. 1). Among the 53 pancreatic cancer
tissues, 39 cases (73.6%) exhibited positive GLUT-1 expression,
including 25 strongly positive cases (47.2%) in tumor tissues.
Among the non-tumorous tissues, 42 cases (79.2%) exhibited negative
GLUT-1 expression and 11 cases exhibited positive expression
(20.8%). Thus, GLUT-1 expression was significantly higher in
pancreatic cancer tissues when compared with non-tumor tissues
(χ2=29.681; P<0.001).
Correlation between GLUT-1 protein
expression and clinicopathological parameters
The associations between GLUT-1 expression and
clinicopathological parameters of pancreatic cancer patients are
shown in Table II. GLUT-1 expression
significantly correlated with tumor size (χ2=11.908; P=0.001),
clinical stage (χ2=10.764; P=0.002) and lymph node metastasis
(χ2=5.105; P=0.029), however, no significant associations were
identified between GLUT-1 expression and gender (χ2=0.045;
P=1.000), age (χ2=1.002; P=0.365), tumor location (χ2=1.449;
P=0.311), tumor differentiation (χ2=1.287, P=0.525) or vascular
invasion (χ2=3.527; P=0.106). These results indicated that the
overexpression of GLUT-1 may correlate with the progression of
pancreatic cancer.
| Table II.Association between GLUT-1 expression
and clinicopathological features of pancreatic cancer patients. |
Table II.
Association between GLUT-1 expression
and clinicopathological features of pancreatic cancer patients.
|
|
| GLUT-1
expression |
|
|
|---|
|
|
|
|
|
|
|---|
| Parameter | n | Positive | Negative | χ2 | P-value |
|---|
| Gender |
|
|
Male | 29 | 21 | 8 | 0.045 | 1.000 |
|
Female | 24 | 18 | 6 |
|
|
| Age, years |
|
|
≤65 | 28 | 19 | 9 | 1.002 | 0.365 |
|
>65 | 25 | 20 | 5 |
|
|
| Tumor
locationb |
|
|
Head | 37 | 29 | 8 | 1.449 | 0.311 |
| Body
and tail | 16 | 10 | 6 |
|
|
| Tumor size, cm |
|
| ≤2 | 18 | 8 | 10 | 11.908 | 0.001 |
|
>2 | 35 | 31 | 4 |
|
|
|
Differentiation |
|
|
Well | 13 | 8 | 5 | 1.287 | 0.525 |
|
Moderate | 18 | 14 | 4 |
|
|
|
Poor | 22 | 17 | 5 |
|
|
| Clinical stage |
|
| I | 22 | 11 | 11 | 10.764 | 0.002a |
| II | 31 | 28 | 3 |
|
|
| Lymph node
metastasis |
|
| Y | 21 | 19 | 2 | 5.105 | 0.029a |
| N | 32 | 20 | 12 |
|
|
| Vascular
invasion |
|
| Y | 10 | 5 | 5 | 3.527 | 0.106 |
| N | 43 | 34 | 9 |
|
|
Prognostic significance of GLUT-1
overexpression
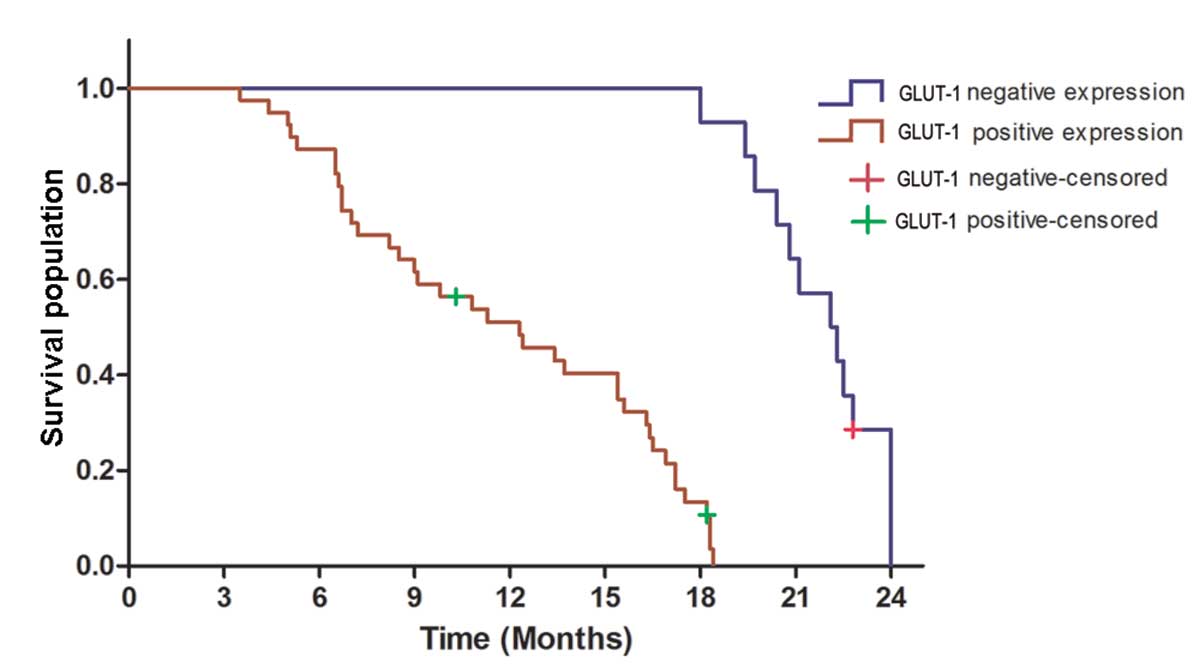
Of the 53 pancreatic cancer patients, 3 patients
were lost to follow-up. As shown in Fig.
2, the median overall survival time for the GLUT-1 positive
group was 12.3 months compared with 22.2 months for the GLUT-1
negative group. Kaplan-Meier curve analysis revealed that patients
with positive GLUT-1 expression exhibited a significantly shorter
overall survival time than those with GLUT-1 negative expression
(log-rank test, P=0.001). Multivariate analysis revealed that
GLUT-1 expression is an independent prognostic factor (P=0.001;
Table III). These results indicated
that GLUT-1 overexpression is correlated with poor prognosis of
pancreatic cancer.
| Table III.Multivariate analysis of prognostic
markers in pancreatic cancer patients. |
Table III.
Multivariate analysis of prognostic
markers in pancreatic cancer patients.
| Factors | HR | 95% CI | P-value |
|---|
| Gender | 1.251 | 0.686–2.280 | 0.466 |
| Age | 0.638 | 0.360–1.128 | 0.122 |
| Tumor location | 1.385 | 0.690–2.778 | 0.359 |
| Tumor size | 0.425 | 0.211–0.856 | 0.017 |
|
Differentiation | 1.426 | 0.697–2.915 | 0.331 |
| Clinical stage | 0.537 | 0.306–0.943 | 0.030 |
| Lymph node
metastasis | 4.210 | 2.295–7.720 | <0.001 |
| Vascular
invasion | 0.583 | 0.302–1.125 | 0.108 |
| GLUT-1
expression | 0.294 | 0.153–0.568 | <0.001 |
Association between GLUT-1 expression
and SUVmax
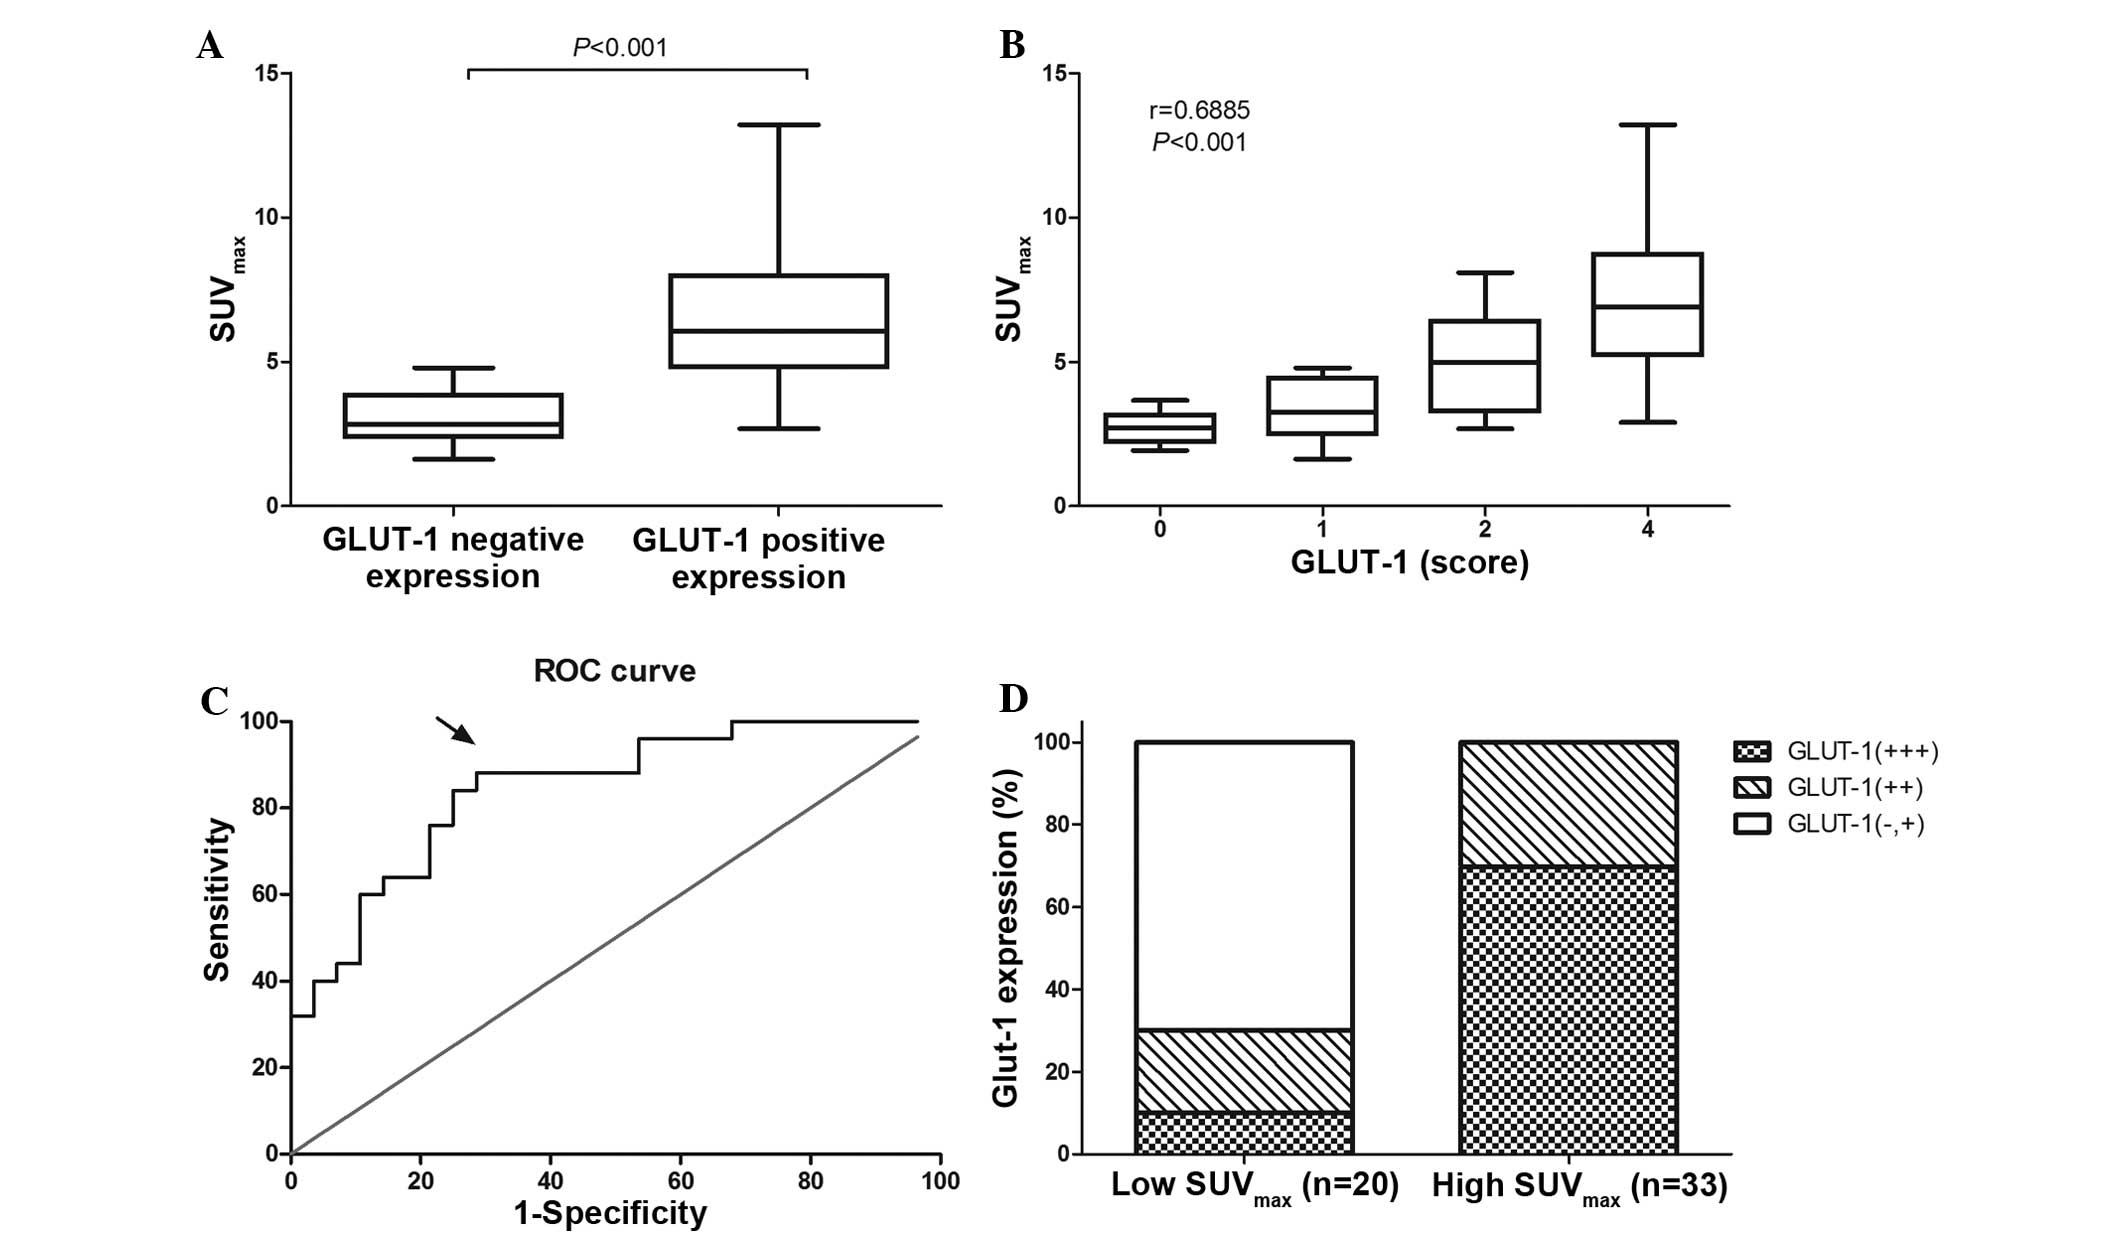
All patients were examined by 18F-FDG
PET/CT. The median SUVmax was 4.90 (range, 1.93–13.22;
25–75% percentile, 2.96–7.04). As shown in Fig. 3A, the patients with positive GLUT-1
expression exhibited a significantly higher SUVmax than
those exhibiting negative GLUT-1 expression (median
SUVmax, 6.07 vs. 2.84; P<0.001). In addition,
Spearman's rank analysis indicated that SUVmax is
positively correlated with GLUT-1 expression in pancreatic cancer
tissues (r=0.6885; P<0.001; Fig.
3B).
The sensitivity and specificity for the detection of
GLUT-1 strong positive expression at different cutoff values of
SUVmax in pancreatic cancer patients were determined
according to the ROC curve (Fig. 3C).
A cutoff SUVmax value of 4.830 exhibited the highest
Youden's index (20) of 0.594, which
was associated with optimal sensitivity (88%) and specificity
(71.4%). The area under the ROC curve was 0.844 (95% confidence
interval, 0.7405–0.9480; P<0.001). According to the cutoff
value, the 53 pancreatic cancer patients were divided into two
groups: high and low SUVmax groups. Among the 33
patients of the high SUVmax group, 69.7% (23/33)
exhibited strong positive GLUT-1 expression, while the remaining
30.3% (10/33) of patients exhibited weak or moderate GLUT-1
expression. Of the 20 patients in the low SUVmax group,
10% (2/20) exhibited strong positive GLUT-1 expression, while 90%
(18/20) exhibited weak or moderate GLUT-1 expression. (Fig. 3D).
Association between GLUT-1 expression
and Ki-67
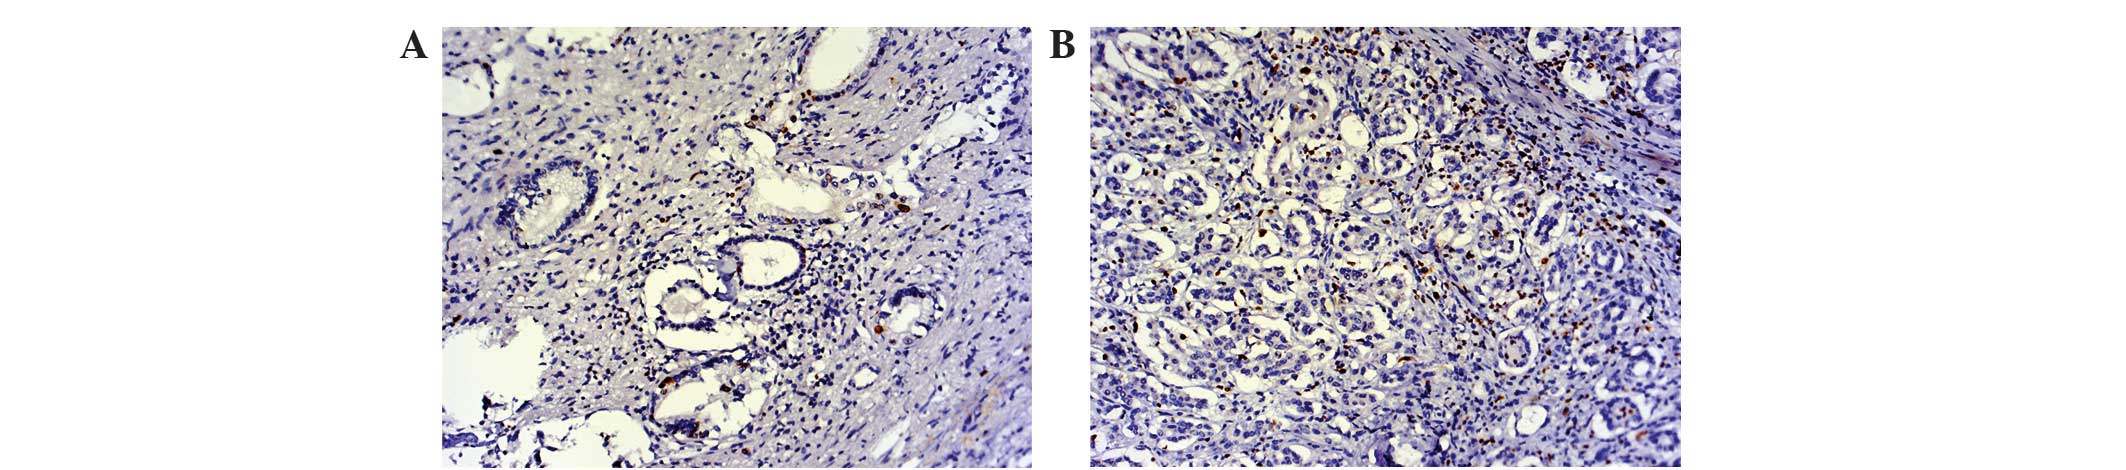
To clarify the association between GLUT-1 and cell
proliferation, the correlation between GLUT-1 and Ki-67 expression
was examined in pancreatic cancer tissues (Fig. 4). Positive Ki-67 expression was
observed in 79.2% (42/53) of pancreatic cancer tissues and 22.7%
(12/53) of adjacent non-tumorous tissues. Among the 53 tumor
specimens, GLUT-1 expression was positively correlated with the
Ki-67 expression (r=0.327; P=0.017; Table IV).
| Table IV.Correlation between GLUT-1 and Ki-67
expression in pancreatic cancer patients. |
Table IV.
Correlation between GLUT-1 and Ki-67
expression in pancreatic cancer patients.
|
| GLUT-1
expression |
|
|
|---|
|
|
|
|
|
|---|
| Ki-67
expression | Positive, n | Negative, n | r | P-value |
|---|
| Positive, n | 34 | 8 |
|
|
| Negative, n | 5 | 6 | 0.327 | 0.017 |
Discussion
In the present study, the expression of GLUT-1 was
examined in 53 pairs of paraffin-embedded pancreatic cancer
tissues. The results revealed that GLUT-1 was overexpressed in
pancreatic cancer tissues and its expression positively correlated
with increased tumor size, higher clinical stage and lymph node
metastasis. Additionally, GLUT-1 was identified as an independent
prognostic factor for pancreatic cancer.
GLUT-1, a member of GLUT family, facilitates the
entry of glucose across the plasma membrane. A number of studies
have demonstrated a close association between GLUT-1 expression and
malignant mesothelium, which is relevant for the clinical behavior
of the tumor (14,21,22). The
results of the present study indicated that GLUT-1 was
overexpressed in pancreatic cancer and was associated with
clinicopathological characteristics, including tumor size, clinical
stage and lymph node metastasis. In particular, the expression of
GLUT-1 exhibited a significant effect on patient survival. Elevated
GLUT-1 expression in tumor tissues reflects the requirement for a
corresponding increase in glucose. Two possible mechanisms have
been postulated to explain the overexpression of GLUT-1 in tumors.
Firstly, local ischemia and hypoxia in the tumor may result in
adaptive glycolytic metabolism and GLUT-1 expression (23). Secondly, GLUT-1 activity is widely
upregulated via hypoxia-inducible factor-1 in hypoxic conditions
(24,25).
Certain factors affect FDG uptake, including
hypoxia, cell density and expression of glycolysis-associated
proteins (26,27). In the present study, SUVmax
was significantly associated with the intensity of GLUT-1
expression and low GLUT-1 expression also corresponded to a low
SUVmax. This may indicate that the sensitivity of
SUVmax for the pancreatic cancer patients with positive
GLUT-1 expression is higher than those with negative expression. In
ROC analysis, the positive and negative predictive values of
SUVmax for identifying GLUT-1 strong expression were
69.7% (22/33) and 90% (18/20), respectively. We hypothesize that
glucose consumption, as calculated by SUVmax using
18F-FDG/PET, predicted the level of GLUT-1 expression in
pancreatic cancer patients. In addition, the cutoff value of
SUVmax may aid in the selection of patients for more
aggressive gene therapy, particularly for advanced pancreatic
cancer that is not suitable for resection.
In general, hypoxia leads to reduced proliferation
and increased apoptosis. However, certain cancer cells in the
hypoxic environment undergo adaptive changes and produce energy via
anaerobic glycolysis, enabling their survival and proliferation
(28,29). Ki-67, a proliferation-related nuclear
protein, is expressed in proliferating cells during all active
phase of the cell cycle (30,31). The results of the present study
revealed a positive correlation between GLUT-1 expression and Ki-67
expression. This indicates that proliferation and hypoxia are not
exclusive, and that GLUT-1 may present a potential therapeutic
target to limit glucose uptake, thereby limiting the proliferation
of pancreatic cancer cells.
In conclusion, the present study demonstrated that
the overexpression of GLUT-1 in pancreatic cancer tissues is
significantly associated with the clinicopathological
characteristics and prognosis of pancreatic cancer patients. In
addition, the expression of GLUT-1 was positively associated with
18F-FDG uptake and cell proliferation in pancreatic
cancer. These findings suggest that GLUT-1 may present an
underlying prognostic indicator and a potential therapeutic target
for pancreatic cancer.
Acknowledgements
The present study was supported by the Project of
Nature Science Foundation of China (grant no. 81201905), the Nature
Science Research Grants at the University of Jiangsu Province of
P.R. China (grant no. 14KJB320019) and the Project of Medical
Research of Jiangsu Province (grant no. Q201402).
References
|
1
|
Siegel R, Naishadham D and Jemal A: Cancer
statistics, 2013. CA Cancer J Clin. 63:11–30. 2013. View Article : Google Scholar : PubMed/NCBI
|
|
2
|
Ryan DP, Hong TS and Bardeesy N:
Pancreatic adenocarcinoma. N Engl J Med. 371:1039–1049. 2014.
View Article : Google Scholar : PubMed/NCBI
|
|
3
|
Vincent A, Herman J, Schulick R, Hruban RH
and Goggins M: Pancreatic cancer. Lancet. 378:607–620. 2011.
View Article : Google Scholar : PubMed/NCBI
|
|
4
|
Diener MK, Combs SE and Buchler MW:
Chemoradiotherapy for locally advanced pancreatic cancer. Lancet
Oncol. 14:269–270. 2013. View Article : Google Scholar : PubMed/NCBI
|
|
5
|
Finger EC and Giaccia AJ: Hypoxia,
inflammation, and the tumor microenvironment in metastatic disease.
Cancer Metastasis Rev. 29:285–293. 2010. View Article : Google Scholar : PubMed/NCBI
|
|
6
|
Matsumoto S, Yasui H, Mitchell JB and
Krishna MC: Imaging cycling tumor hypoxia. Cancer Res.
70:10019–10023. 2010. View Article : Google Scholar : PubMed/NCBI
|
|
7
|
Milane L, Ganesh S, Shah S, Duan ZF and
Amiji M: Multi-modal strategies for overcoming tumor drug
resistance: Hypoxia, the Warburg effect, stem cells, and
multifunctional nanotechnology. J Control Release. 155:237–247.
2011. View Article : Google Scholar : PubMed/NCBI
|
|
8
|
Thorens B and Mueckler M: Glucose
transporters in the 21st Century. Am J Physiol Endocrinol Metab.
298:E141–E145. 2010. View Article : Google Scholar : PubMed/NCBI
|
|
9
|
Adekola K, Rosen ST and Shanmugam M:
Glucose transporters in cancer metabolism. Curr Opin Oncol.
24:650–654. 2012. View Article : Google Scholar : PubMed/NCBI
|
|
10
|
Szablewski L: Expression of glucose
transporters in cancers. Biochim Biophys Acta. 1835:164–169.
2013.PubMed/NCBI
|
|
11
|
Krzeslak A, Wojcik-Krowiranda K, Forma E,
Jozwiak P, Romanowicz H, Bienkiewicz A and Brys M: Expression of
GLUT1 and GLUT3 glucose transporters in endometrial and breast
cancers. Pathol Oncol Res. 18:721–728. 2012. View Article : Google Scholar : PubMed/NCBI
|
|
12
|
Wincewicz A, Sulkowska M, Koda M,
Kanczuga-Koda L, Witkowska E and Sulkowski S: Significant
coexpression of GLUT-1, Bcl-xL and Bax in colorectal cancer. Ann N
Y Acad Sci. 1095:53–61. 2007. View Article : Google Scholar : PubMed/NCBI
|
|
13
|
Chiba I, Ogawa K, Morioka T, Shimoji H,
Sunagawa N, Iraha S, Nishimaki T, Yoshimi N and Murayama S:
Clinical significance of GLUT-1 expression in patients with
esophageal cancer treated with concurrent chemoradiotherapy. Oncol
Lett. 2:21–28. 2011.PubMed/NCBI
|
|
14
|
Ohba S, Fujii H, Ito S, Fujimaki M,
Matsumoto F, Furukawa M, Yokoyama J, Kusunoki T, Ikeda K and Hino
O: Overexpression of GLUT-1 in the invasion front is associated
with depth of oral squamous cell carcinoma and prognosis. J Oral
Pathol Med. 39:74–78. 2010. View Article : Google Scholar : PubMed/NCBI
|
|
15
|
Brophy S, Sheehan KM, McNamara DA, Deasy
J, Bouchier-Hayes DJ and Kay EW: GLUT-1 expression and response to
chemoradiotherapy in rectal cancer. Int J Cancer. 125:2778–2782.
2009. View Article : Google Scholar : PubMed/NCBI
|
|
16
|
Rastogi S, Banerjee S, Chellappan S and
Simon GR: Glut-1 antibodies induce growth arrest and apoptosis in
human cancer cell lines. Cancer Lett. 257:244–251. 2007. View Article : Google Scholar : PubMed/NCBI
|
|
17
|
Alakus H, Batur M, Schmidt M, Drebber U,
Baldus SE, Vallböhmer D, Prenzel KL, Metzger R, Bollschweiler E,
Hölscher AH and Mönig SP: Variable 18F-fluorodeoxyglucose uptake in
gastric cancer is associated with different levels of GLUT-1
expression. Nucl Med Commun. 31:532–538. 2010.PubMed/NCBI
|
|
18
|
Edge SB and Compton CC: The American Joint
Committee on Cancer: The 7th edition of the AJCC cancer staging
manual and the future of TNM. Ann Surg Oncol. 17:1471–1474. 2010.
View Article : Google Scholar : PubMed/NCBI
|
|
19
|
Reynolds T: Declaration of Helsinki
revised. J Natl Cancer Inst. 92:1801–1803. 2000. View Article : Google Scholar : PubMed/NCBI
|
|
20
|
Böhning D, Böhning W and Holling H:
Revisiting Youden's index as a useful measure of the
misclassification error in meta-analysis of diagnostic studies.
Stat Methods Med Res. 17:543–554. 2008. View Article : Google Scholar : PubMed/NCBI
|
|
21
|
Cho H, Lee YS, Kim J, Chung JY and Kim JH:
Overexpression of glucose transporter-1 (GLUT-1) predicts poor
prognosis in epithelial ovarian cancer. Cancer Invest. 31:607–615.
2013. View Article : Google Scholar : PubMed/NCBI
|
|
22
|
Sulkowska M, Wincewicz A, Sulkowski S,
Koda M and Kanczuga-Koda L: Relations of TGF-beta1 with HIF-1
alpha, GLUT-1 and longer survival of colorectal cancer patients.
Pathology. 41:254–260. 2009. View Article : Google Scholar : PubMed/NCBI
|
|
23
|
Mayer A, Schmidt M, Seeger A, Serras AF,
Vaupel P and Schmidberger H: GLUT-1 expression is largely unrelated
to both hypoxia and the Warburg phenotype in squamous cell
carcinomas of the vulva. BMC Cancer. 14:7602014. View Article : Google Scholar : PubMed/NCBI
|
|
24
|
Melstrom LG, Salabat MR, Ding XZ, Strouch
MJ, Grippo PJ, Mirzoeva S, Pelling JC and Bentrem DJ: Apigenin
down-regulates the hypoxia response genes: HIF-1α, GLUT-1 and VEGF
in human pancreatic cancer cells. J Surg Res. 167:173–181. 2011.
View Article : Google Scholar : PubMed/NCBI
|
|
25
|
Fraga A, Ribeiro R and Medeiros R: Tumor
hypoxia: The role of HIF. Actas Urol Esp. 33:941–951. 2009.
View Article : Google Scholar : PubMed/NCBI
|
|
26
|
Pugachev A, Ruan S, Carlin S, Larson SM,
Campa J, Ling CC and Humm JL: Dependence of FDG uptake on tumor
microenvironment. Int J Radiat Oncol Biol Phys. 62:545–553. 2005.
View Article : Google Scholar : PubMed/NCBI
|
|
27
|
Huang T, Civelek AC, Li J, Jiang H, Ng CK,
Postel GC, Shen B and Li XF: Tumor microenvironment-dependent
18F-FDG, 18F-fluorothymidine, and 18F-misonidazole uptake: A pilot
study in mouse models of human non-small cell lung cancer. J Nucl
Med. 53:1262–1268. 2012. View Article : Google Scholar : PubMed/NCBI
|
|
28
|
Jiang J, Tang YL and Liang XH: EMT: A new
vision of hypoxia promoting cancer progression. Cancer Biol Ther.
11:714–723. 2011. View Article : Google Scholar : PubMed/NCBI
|
|
29
|
Osinsky S, Zavelevich M and Vaupel P:
Tumor hypoxia and malignant progression. Exp Oncol. 31:80–86.
2009.PubMed/NCBI
|
|
30
|
Lee HE, Kim MA, Lee BL and Kim WH: Low
Ki-67 proliferation index is an indicator of poor prognosis in
gastric cancer. J Surg Oncol. 102:201–206. 2010. View Article : Google Scholar : PubMed/NCBI
|
|
31
|
Viale G, Giobbie-Hurder A, Regan MM,
Coates AS, Mastropasqua MG, Dell'Orto P, Maiorano E, MacGrogan G,
Braye SG, Ohlschlegel C, et al: Prognostic and predictive value of
centrally reviewed Ki-67 labeling index in postmenopausal women
with endocrine-responsive breast cancer: Results from breast
international group trial 1–98 comparing adjuvant tamoxifen with
letrozole. J Clin Oncol. 26:5569–5575. 2008.
|